1. Introduction
Stroke is the second leading cause of mortality and the major cause of physical disability in adults worldwide [
1]. Preclinical testing of potential drugs has not yet found agents without serious side effects, limiting the propagation of pathological processes from the primary site of damage to surrounding healthy tissues, and protecting nerve cells [
2,
3]. Thus, deep and comprehensive studies on molecular mechanisms of the pathological processes after stroke are required.
Our previous proteomic studies have shown that the expression of amyloid precursor protein (APP), as well as nicastrin and apolipoprotein E (APOER or LRP1), involved in the processing and functioning of APP, increased in the penumbra at 1–4 h after acute photothrombotic exposure; hence, we decided to study APP and its proteolytic system understroke [
4].
The APP protein has been intensively studied since the 1980s due to its central role in the development of Alzheimer’s disease (AD). Its fragment β-amyloid peptide (Aβ) accumulates in amyloid plaques in the brain of AD patients. APP is an evolutionarily conserved protein [
5,
6]. A high level of APP expression in the brain indicates its important role in the nervous system. It is involved in the development, differentiation, and function of neurons, neurite growth, synapse and long-term memory formation, brain integrity maintenance, and neuronal response to damage [
7,
8]. However, the specific biochemical and physiological functions of APP and its proteolytic products are still unknown. The accumulation of APP in damaged neurons after ischemic stroke indicates its important role in stroke-induced pathological processes in the nerve tissue [
9,
10].
APP is a large transmembrane glycoprotein that crosses the plasma membrane (PM) once. Its large N-terminal domain faces the extracellular environment, while its small C-terminal domain faces the cytoplasm. APP undergoes proteolytic cleavage by α-, β-, and γ-secretases to form several peptides: sAPPα (soluble amyloid precursor protein alpha), sAPPβ (soluble amyloid precursor protein beta), Aβ (β-amyloid peptide), AICD (amyloid precursor protein intracellular domain), and some less studied peptides. APP proteolytic products have independent activity and are involved in various cellular processes. There are amyloidogenic and non-amyloidogenic pathways of APP proteolysis.
In the non-amyloidogenic pathway, α-secretase cleaves a large N-terminal fragment of sAPPα from APP. At the same time, Aβ (the APP fragment that is immersed in the membrane) is cleaved and inactivated. Then γ-secretase cleaves off the intracellular AICD peptide that degrades in the cytoplasm. Cleavage of APP by α-secretase occurs mainly on the cell surface, although some part of APP is cleaved along the pathways of processing and traffic in cisterns and vesicles of the endoplasmic reticulum and Golgi apparatus [
11,
12]. Proteinases of the ADAM (a disintegrin and metalloproteinase) family act as α-secretase in mammalian cells and ADAM10 protein plays the main role in APP processing in the non-amyloidogenic pathway [
13,
14]. Amyloidogenic processing of APP occurs in specialized regions of the cell membranes, the lipid rafts. However, ADAM10-mediated non-amyloidogenic processing is believed to occur in the non-raft region of the membrane [
15,
16,
17].
β-secretase is an aspartyl protease represented by two main isoforms: BACE1 (beta-site APP cleaving enzyme 1) and BACE2. BACE1 is abundant in the nervous system (in neurons, astrocytes, and oligodendrocytes) while BACE2 is abundant in peripheral tissues (melanocytes or pancreatic β-cells).
In the amyloidogenic pathway, BACE1 and γ-secretase cleave APP in the plasma membrane so that the Aβ peptide is released into the environment and AICD is released into the cytoplasm. During cerebral ischemia, BACE1 is activated as a result of oxidative stress and stimulation of the oxygen sensor HIF1α [
18,
19]. γ-secretase is a large multi-subunit enzyme consisting of presenilin-1 (PS1) that performs a proteolytic function, presenilin-2 (presenilin enhancer 2, PEN-2) that associates and causes the endoproteolysis of PS1 into the N-terminal fragment (NTF) and C-terminal fragment (CTF), involved in the substrate recognition of nicastrin (NCT), and the anterior pharynx-defective 1 (APH-1) protein that forms a platform for subunit binding [
20]. The results of γ-secretase activity include the release of the amyloid peptide Aβ into the extracellular environment promoting the development of AD and the release of the rest into the cytoplasm as the transcription factor AICD is regulating the expression of proapoptotic genes [
11]. The subcellular localization of APP influences its proteolytic processing and Aβ formation, not only the localization of β- and γ-secretases in lipid rafts and their co-localization with caveolin-1 but also the exclusion of ADAM10 from lipid rafts lead to Aβ formation [
16]. On the other hand, non-amyloidogenic APP processing occurs on the cell surface, where α-secretase is localized while amyloidogenic APP processing occurs after the internalization of APP from the cell surface via endocytosis and only partially on the cell surface [
21,
22]. Caveolin-1 positively regulates APP cleavage by α-secretase [
23] and, vice versa, down-regulates BACE1 activity [
24], suggesting that caveolae and caveolins may play a key role in APP proteolysis. Caveolin-1 level significantly increases in neurons with aging [
25,
26] and under oxidative stress [
27].
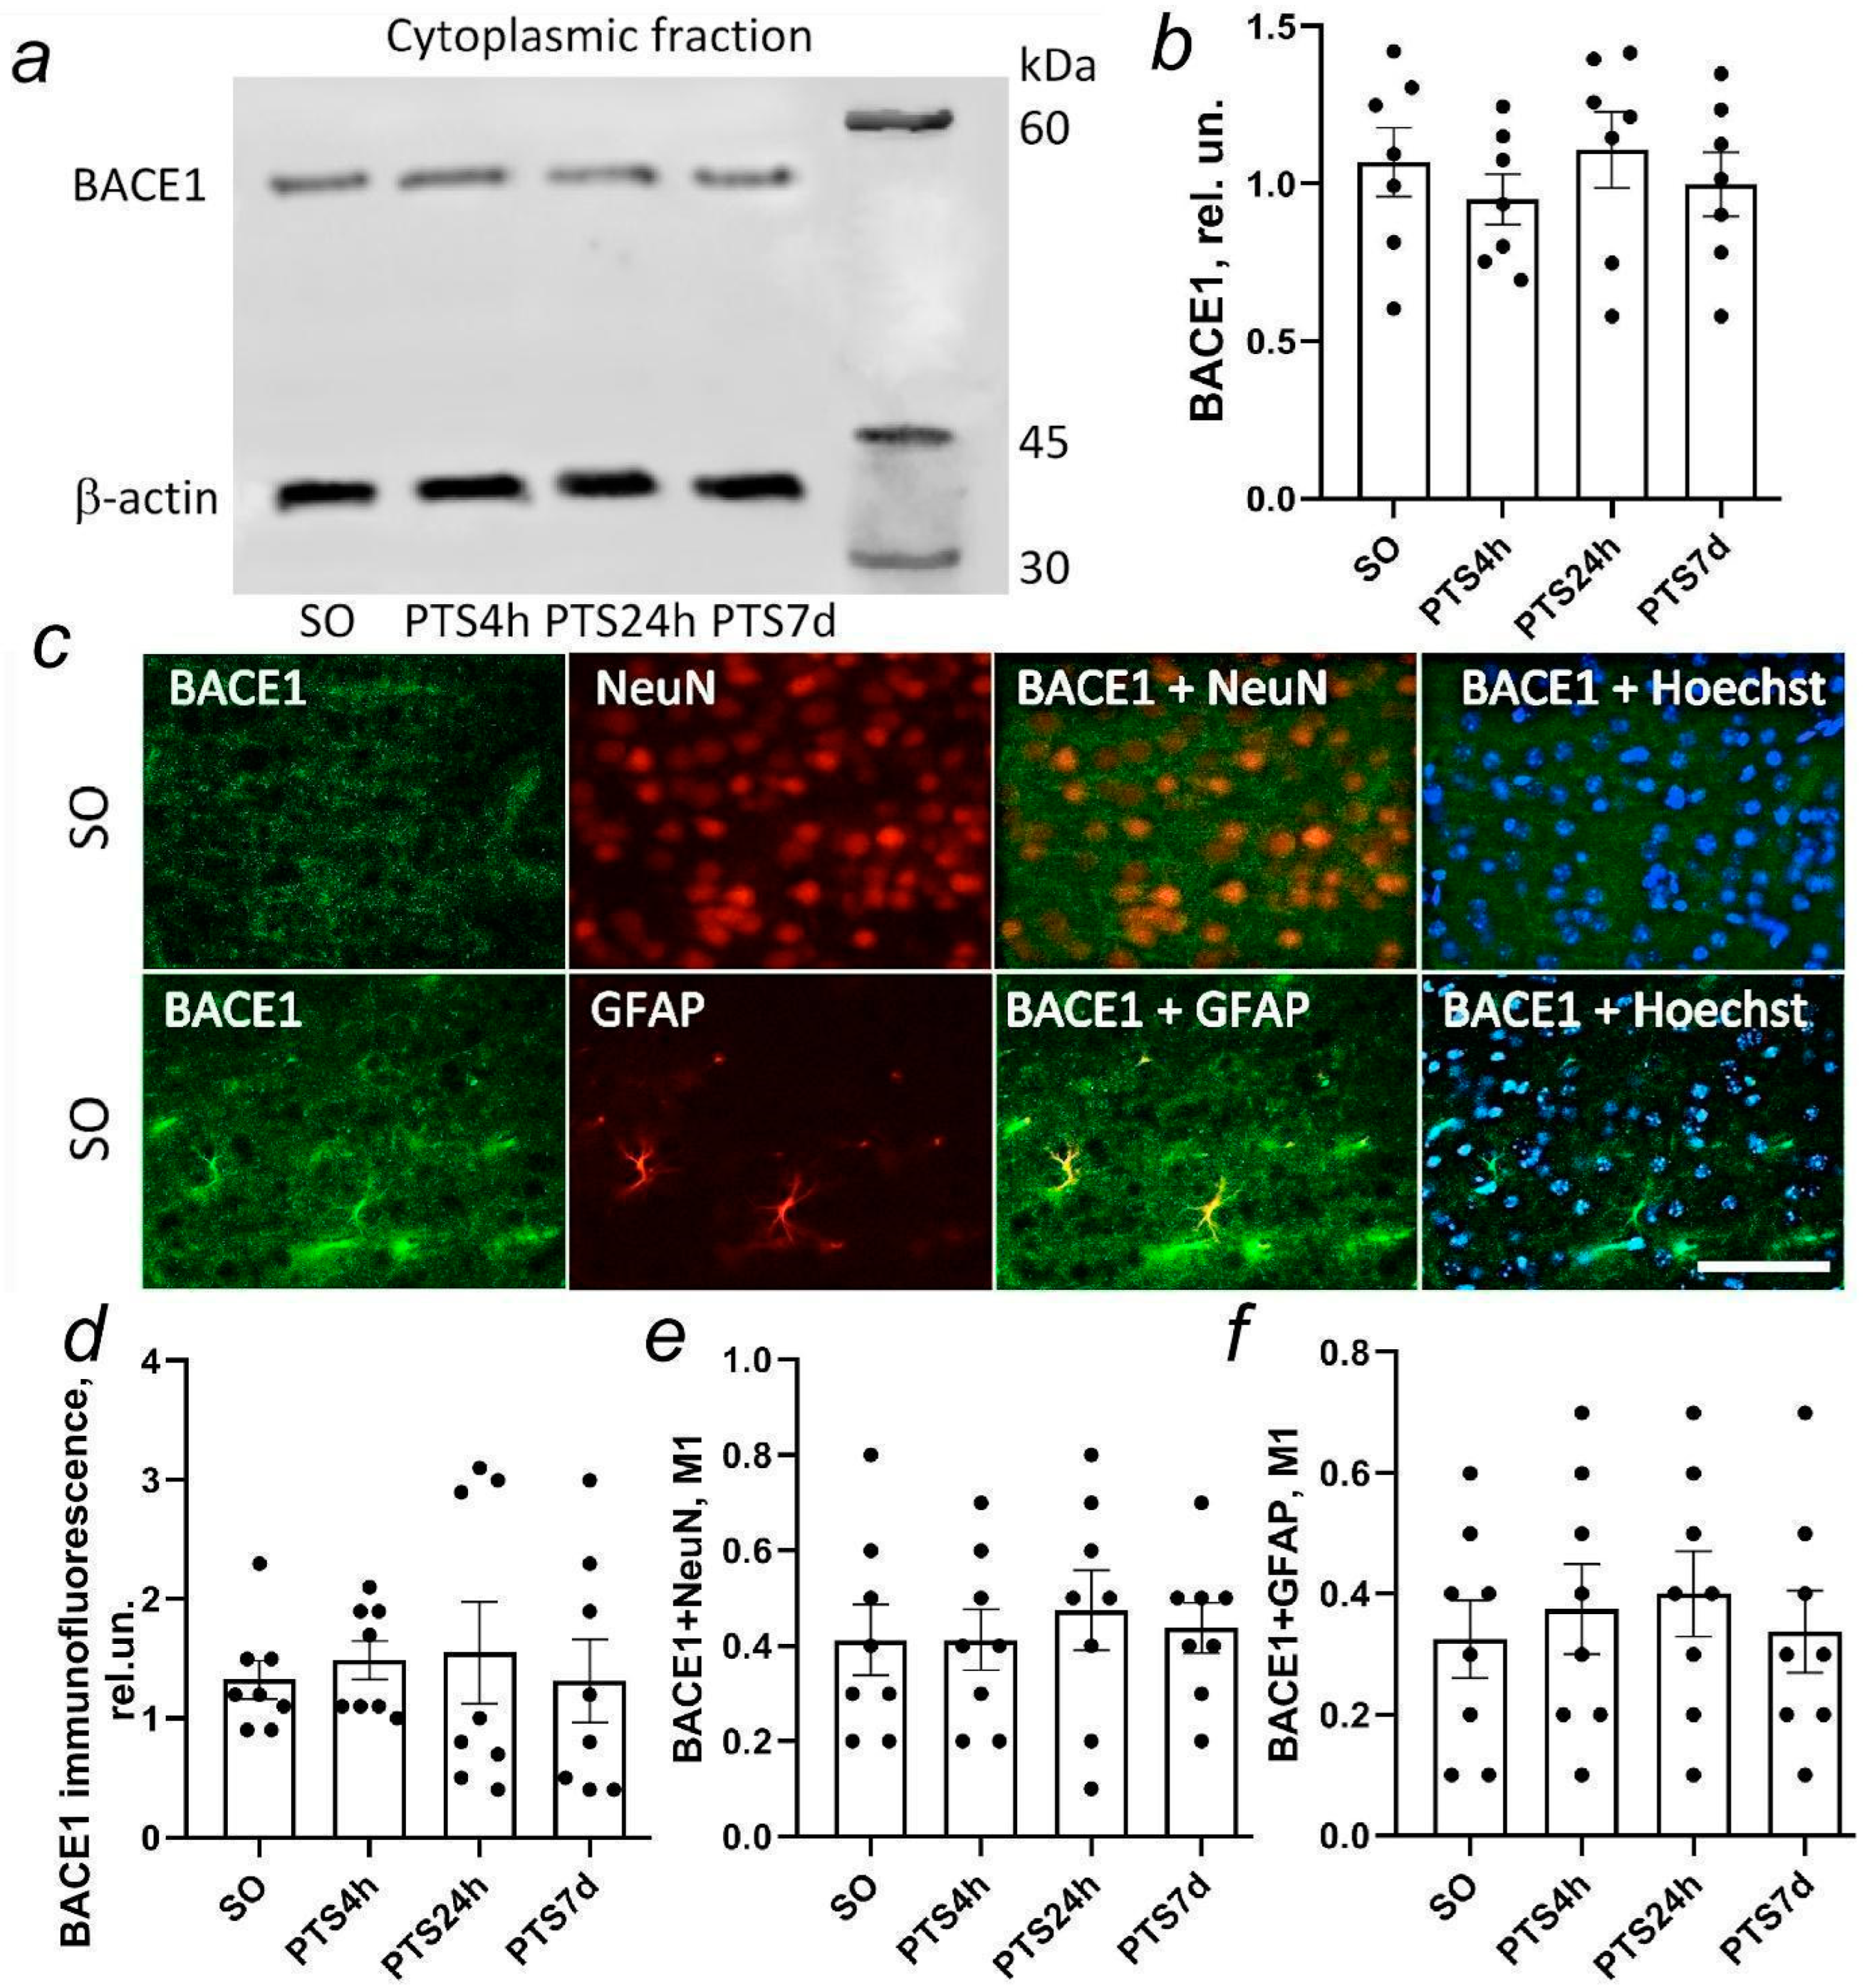
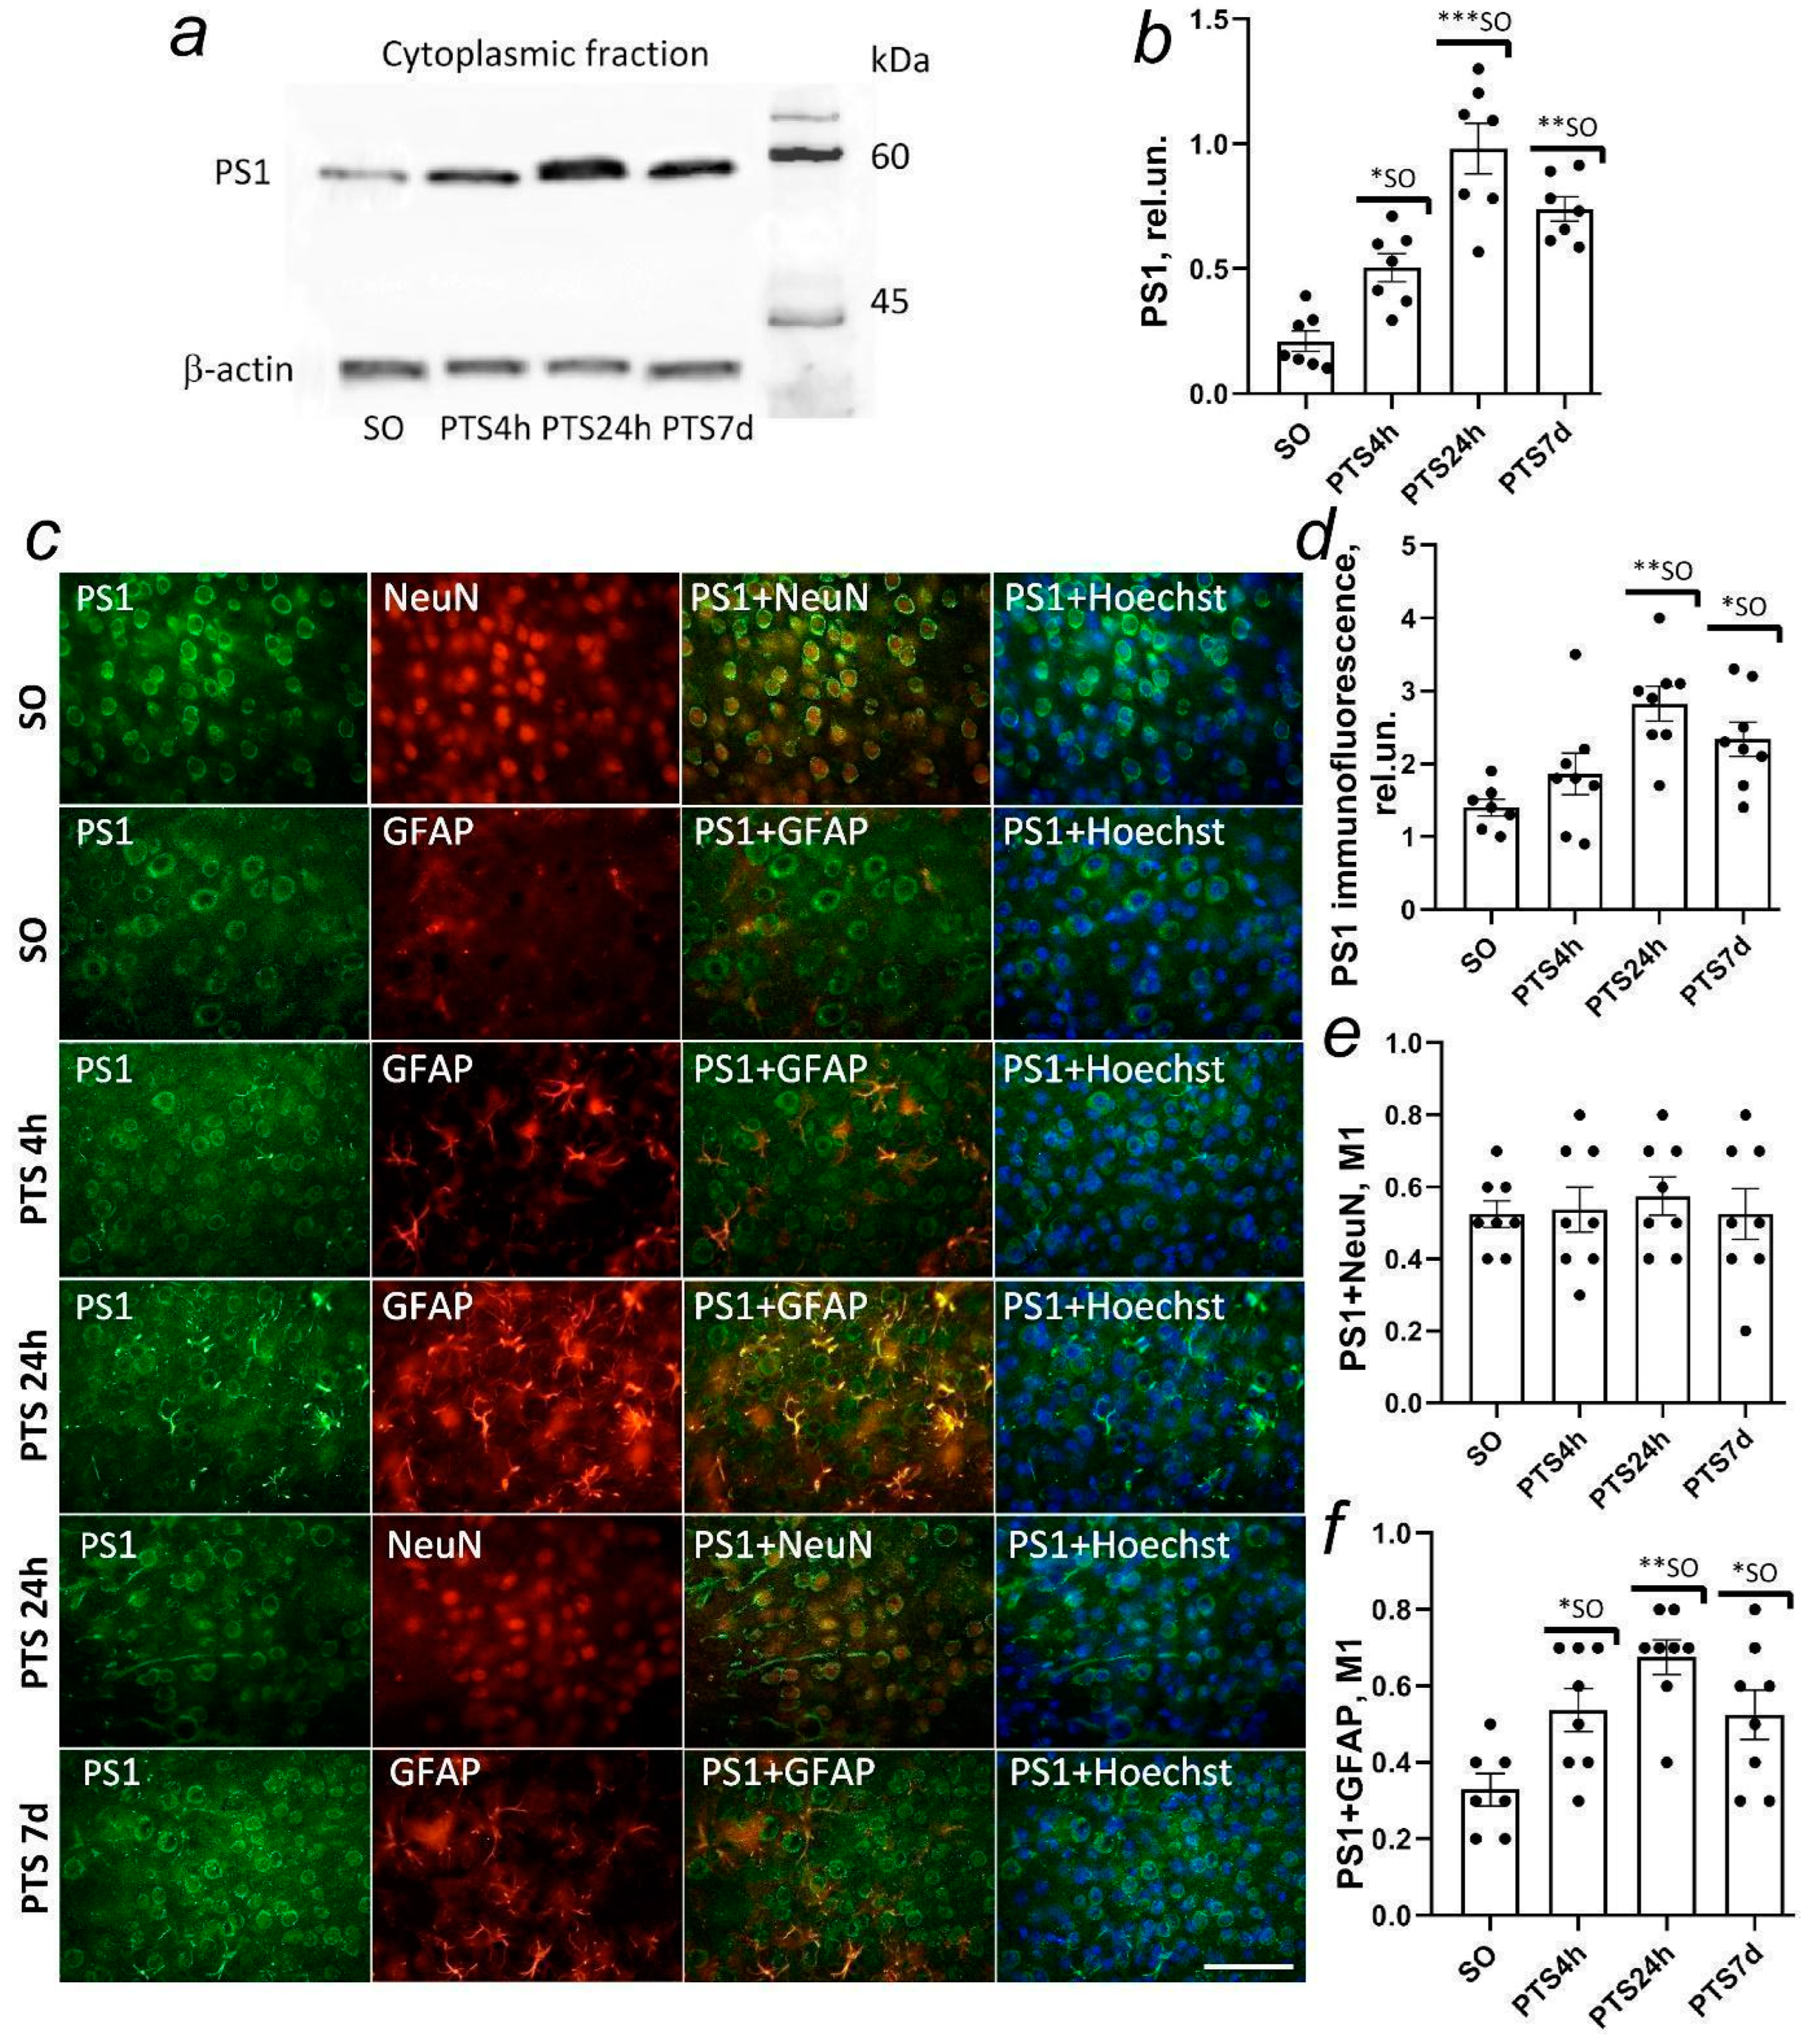
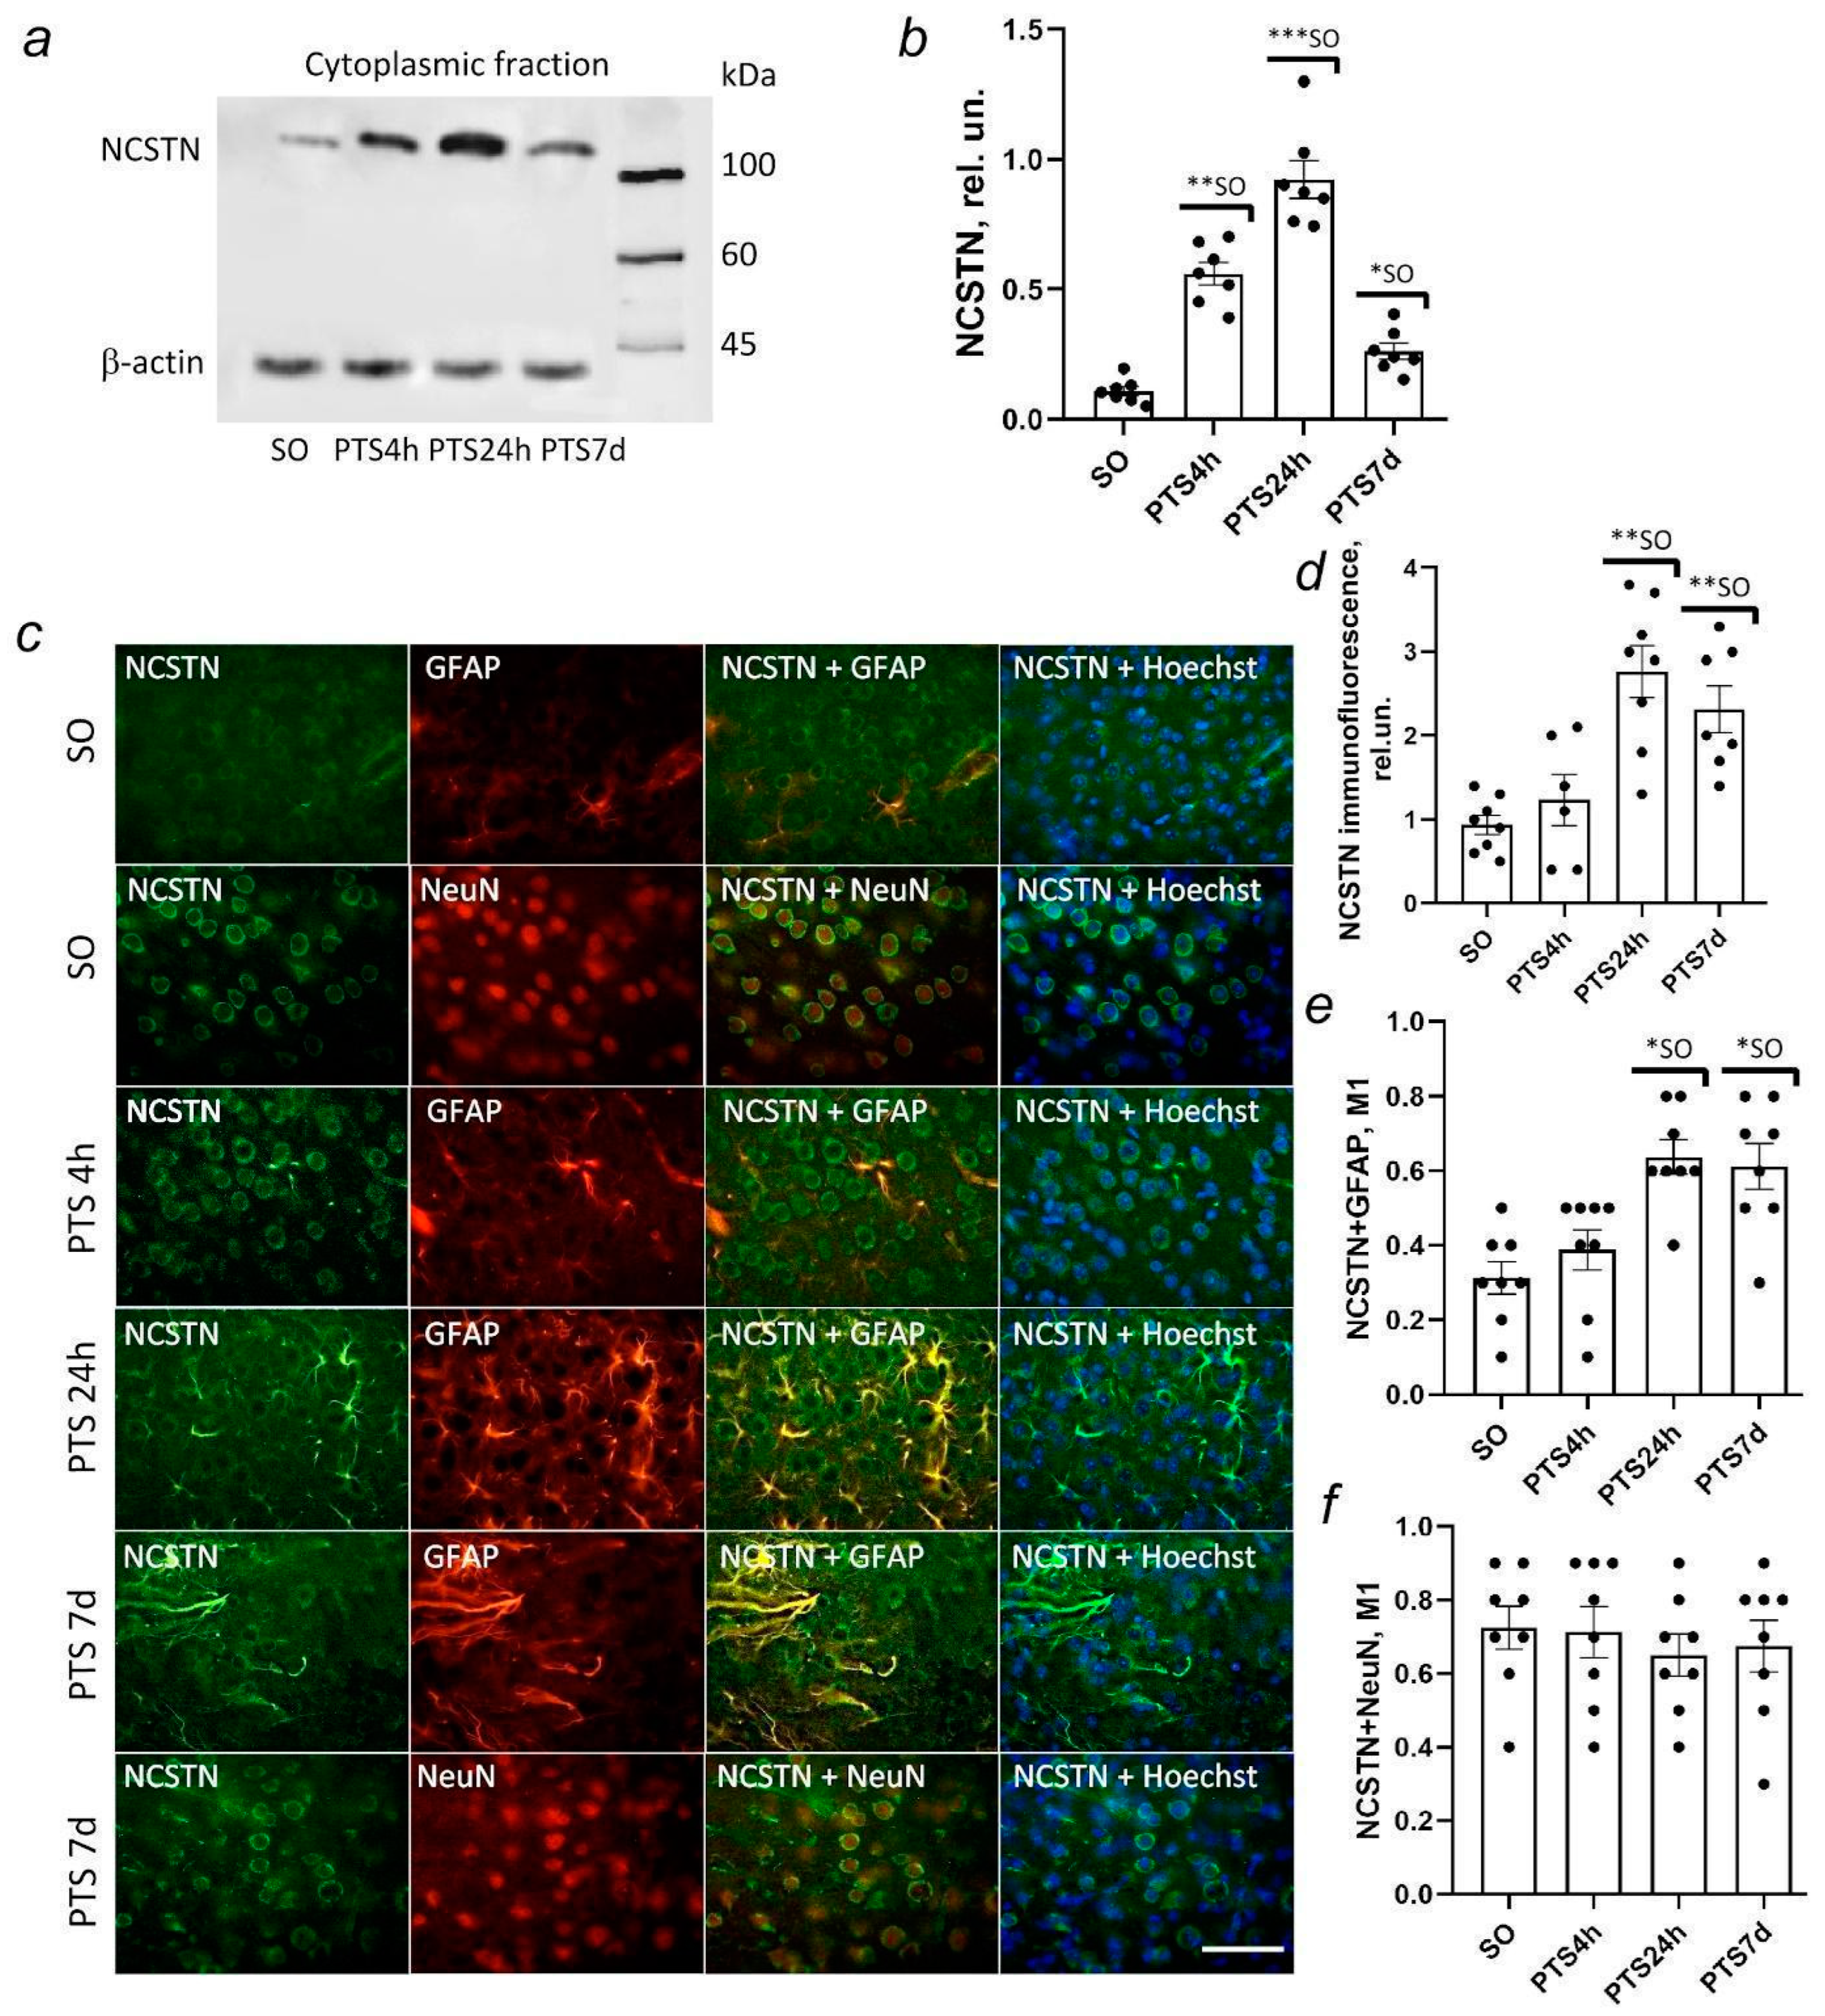
In this study, we investigated the expression and localization of APP in rat brain cells after photothrombotic stroke (PTS). We studied the expression and localization of α-secretase ADAM10, β-secretase BACE1, and components of the γ-secretase complex presenilin 1 and nicastrin involved in APP proteolysis in rat brain neurons and glial cells after PTS. The effect of ischemia on caveolin-1 levels and co-immunoprecipitation of caveolin-1 with N- or C-terminal fragments of the APP (N-APP and C-APP) and ADAM10 was also investigated. In addition, we studied the effect of secretase inhibitors and caveolin-1 inhibitors on apoptosis, expression of the glial fibrillary acidic protein (GFAP) in astrocytes, and the volume of mouse brain infarction after PTS.
2. Methods
2.1. Antibodies
For Western blot analysis and immunofluorescence microscopy, rabbit antibodies were used: anti-ADAM-10, C-terminus (A2726), anti-BACE1 (SAB2100200), anti-nicastrin (ab1) (PRS3983), anti-presenilin-1 (PRS4203), anti-caveolin-1 (marker of lipid raft) (A19006); mouse antibodies NeuN (marker of neurons) (MAB377), GFAP (marker of astrocytes) (SAB5201104), and anti-caveolin-1 (marker of lipid raft) (SAB4200216). To determine the expression and localization of the APP protein by Western blot analysis, immunofluorescence microscopy and immunoelectron microscopy in nerve cells, we used antibodies that specifically recognize the N- or C-terminal fragments of the APP protein (N-APP and C-APP). According to the manufacturer (Merck, Darmstadt, Germany), the anti-rabbit N-APP antibody (SAB4200536) recognizes the N-terminal extracellular domain of human, rat, or mouse APP, and its proteolytic products sAPPα. The anti-rabbit C-APP antibody (A8717) is specific for the sequence of amino acids 676–695 at the C-terminal of APP and anti-β-Amyloid antibody (A8354).
All antibodies and reagents used were purchased from the Moscow branch of Merck (Merck Life Science LLC, Moscow, Russian Federation), except for rabbit antibodies anti-caveolin-1 (A19006) from ABclonal (Woburn, MA, USA).
2.2. Animals
The experiments were carried out on adult male rats (3–4 months, 200–250 g). The experiments with inhibitors were performed on male mice of the outbred CD-1 stock (14–15 weeks old, 20–25 g). Outbred Wistar rats and CD-1 mice were purchased from a farm in Pushchino, Moscow Region (
http://www.spf-animals.ru/animals/rats/, accessed on 13 May 2020). Outbred white mice and rats were obtained from the vivarium of the Rostov Scientific Research Institute of Microbiology and Parasitology. Animals were kept in standard cages in groups of 4–5 animals with free access to food and water under standard conditions: 12 h light/12 h dark cycle, 22–25 °C, air exchange rate 18 changes per hour. International, national, and institutional guidelines for the care and use of animals were followed. All experimental procedures were carried out in accordance with European Union directives 86/609/EEC on the use of experimental animals and local legislation on the ethics of animal experimentation. Animal protocols were evaluated and approved by the Animal Care and Use Committee of the Southern Federal University (Permit No. 08/2016). For the entire period of detention and before the experiment the animals were properly cared for with daily veterinary examination (body position in space, activity), thermometry, and weighing of each one. The adequate depth of anesthesia was achieved in about 30 min. The depth of anesthesia was assessed by the absence of a plantar reflex and a reaction to pinching the membrane between the fingers), a decrease in or absence of muscle tone in the limbs, and a slow regular heart rate and respiratory rhythm. The following measures of physiological support of an animal during anesthesia and experimental procedures were obtained: prevention of dry eyes and damage to the cornea by placing an ophthalmic ointment in the conjunctival sac and temperature maintenance via an electrically heated mat. After the surgical intervention, each animal was placed into a separate warm clean cage until the complete recovery from anesthesia. Further postsurgical care included the administration of analgesics, antimicrobials, daily monitoring of the animals’ state for signs of pain and distress; special attention was paid to the condition of sutures and the irradiation area.
2.3. Photothrombotic Stroke Model
For a model of ischemic stroke, we used unilateral photothrombotic stroke (PTS) in the somatosensory cerebral cortex of rats or mice. In PTS, local laser irradiation induces photoexcitation of the introduced photosensitizing dye Bengal rose. Due to its physical properties, it does not penetrate cells and remains in blood vessels. After laser irradiation, highly reactive singlet oxygen is generated and damages the vascular endothelium, causing platelet aggregation and vascular thrombosis [
28].
Experiments were performed as described before [
29]. Briefly, rats were anesthetized with intraperitoneal injections of telazol (50 mg/kg) and xylazine (10 mg/kg). The animals were fixed, the periosteum was removed, and a longitudinal incision was made in the skull skin. Rose Bengal (20 mg/kg) (R4507, Merck, Moscow, Russia) was injected into the subclavian vein. Then the somatosensory cortex (3 mm lateral to the bregma) was irradiated through the relatively transparent cranial bone with a diode laser (532 nm, 60 mW/cm
2, Ø3 mm, 30 min). This mode of exposure induces the formation of an infarction core with a diameter of about 3 mm surrounded by a penumbra about 1.5 mm wide [
30]. After anesthesia, the rats were decapitated in 4 h or 24 h or 7 days after PTS. The brain was removed and a section of the cortex corresponding to the infarction core was removed on ice with a cylindrical knife (Ø 3 mm) and then a 2-mm ring was cut around the irradiation zone with another knife (Ø 7 mm), approximately, corresponding to the penumbra tissue (experimental sample, respectively, PTS4, PTS24, and PTS7d). The control groups included sham-operated (SO) animals subjected to the same procedures but without the photosensitizer administration. The obtained tissue samples were further used for Western blot analysis.
Experiments with inhibitors of α-, β-, and γ-secretases were carried out on mice. Mice were anesthetized at 25 mg/kg telazol and 5 mg/kg xylazine. Rose Bengal at a concentration of 15 mg/mL was administered intraperitoneally at a dose of 10 μL/g of body weight. At 5 min after the photosensitizer administration, the area of the mouse skull free from the periosteum was irradiated with a diode laser in the sensorimotor cortex area (2 mm lateral to the bregma). Irradiation parameters: wavelength 532 nm, intensity 0.2 W/cm2, beam diameter 1 mm, duration 15 min. The control groups included SO animals subjected to the same operations but without the photosensitizer administration. At 3, 7, and 14 days after laser irradiation, the mice were decapitated and the brain was removed to study the extent of damage, the level of apoptosis of cells in the perifocal region and the expression of the GFAP protein in astrocytes. The surgery is non-invasive with 100% survival of animals before the decapitation.
2.4. Cytoplasmic and Nuclear Fractions of Brain Tissue Extraction
Cytoplasmic and nuclear fractions were obtained using the CelLytic™ NuCLEAR™ Extraction Kit (NXTRACT, Sigma-Aldrich, Darmstadt, Germany). To do this, the samples were homogenized on ice for 3 min using a Vibra-Cell VCX 130 ultrasonic homogenizer (Sonics, Newtown, CT, USA) in Lysis Buffer, which is included in the CelLytic™ NuCLEAR™ Extraction Kit, supplemented with a mixture of inhibitors, proteases, and phosphatases (PPC1010, Sigma-Aldrich, Darmstadt, Germany), necessary for the preservation of proteins and their phosphorylated forms, as well as nuclease benzonase (E1014, Sigma-Aldrich, Darmstadt, Germany), which destroys nucleic acids. After the homogenization, the samples were centrifuged for 20 min at 10,000–11,000× g at 4 °C in a Mikro 220 R centrifuge (Hettich, Tuttlingen, Germany). Then, the supernatant containing cytoplasmic proteins was collected and nuclear proteins were extracted from the sediment containing cell fragments and cell nuclei using the Nuclear Extraction Buffer included in the NXTRACT Reagent Kit. To carry out this process, the pellet was resuspended and incubated for 40 min with this buffer. The lysate was centrifuged for 5 min at 20,000–21,000× g at 4 °C.
In the resulting supernatant, containing nuclear proteins and the previously obtained cytoplasmic fraction, the protein content was determined using the Bradford reagent (B6916, Sigma-Aldrich). The lysates were then aliquoted, frozen in liquid nitrogen, and stored at −80 °C for further Western blot analysis.
The purity of the fractions was checked as follows: negative control of the cytoplasmic marker in the nuclear fraction was used and, vice versa, negative control of the nuclear marker in the cytoplasmic fraction was used as well. The acetylated histone protein H4 (ac-H4) was used as a nuclear fraction marker. We used an H4 anti-acetyl-Histone antibody obtained from rabbits (No. 06-866, Merck), diluted at 1:500. Proteinglyceraldehyde-3-phosphate dehydrogenase (GAPDH) was used as a marker of a cytoplasmic fraction. We used an anti-GAPDH antibody obtained from rabbits (G9545, Sigma-Aldrich) at a 1:1000 dilution. The cytoplasmic fraction was confirmed by the absence of ac-H4, and the nuclear fraction was confirmed by the absence of the cytoplasmic fraction marker GAPDH (
Figure S1).
2.5. Immunoblotting
Expression of C-APP, N-APP, Aβ, ADAM10, BACE1, presenilin 1, nicastrin, and caveolin-1 in the cytoplasmic fraction of rat cerebral cortex cells after PTS was studied using the Western blot method as described previously [
20]. Briefly, the rat cortical tissue samples were homogenized on ice using a Vibra-Cell VCX 130 ultrasonic homogenizer. Nuclear and cytoplasmic fractions were isolated using the CelLytic NuCLEAR Nuclear Fraction Extraction Kit.
Samples containing 10–20 µg of protein per 15 µL were subjected to electrophoretic separation in a polyacrylamide gel (7–10%) in the presence of sodium dodecyl sulfate in a mini-PROTEAN Tetra cell (Bio-Rad, Hercules, CA, USA). ColorBurst Electrophoresis Marker (C1992, Sigma-Aldrich) was used as a standard protein marker. After the separation, the proteins were subjected to electrophoresis onto a PVDF membrane (polyvinyl difluoride membrane 162-0177, Bio-Rad) using the Trans-Blot
® Turbo Transfer System (Bio-Rad, USA). After washing with PBS, the membrane was successively incubated for one hour in blocking buffer (TBS 1% Casein Blocker, Bio-Rad) and overnight at 4 °C with primary rabbit anti-C-APP (A8717, Merck, 1:500) or anti-N-APP (SAB4200536, Merck, 1:500) antibodies; anti-ADAM-10, C-terminus (A2726); anti-BACE1 (SAB2100200); anti-nicastrin (ab1) (PRS3983); anti-presenilin-1 (PRS4203); anti-caveolin-1 (A19006, ABclonal, 1:500); mouse anti-β-actin antibodies (A5441, 1:5000), mouse monoclonal anti-β-Amyloid antibody (A8354, 1:500) (
Table S1 Supplementary).
After the incubation, the membranes were washed in Tris buffer with the addition of 0.1% Tween-20 (TTVS, 10 mM; pH 8) and incubated for one hour at room temperature with a secondary anti-rabbit antibody IgG peroxidase (A6154, Merck, 1:1000). Protein detection was performed on Clarity Western ECL Substrate (Bio-Rad). Chemiluminescence was analyzed using the Fusion SL gel documentation system (Vilber Lourmat, Collégien, France). The obtained images were processed using the VisionCapt software package (
https://visioncapt.software.informer.com/, accessed on 20 August, 2020).
2.6. Co-Immunoprecipitation
Co-immunoprecipitation (Co-IP) was performed to confirm the fact of protein–protein interaction between C-APP, N-APP, ADAM-10, and caveolin-1. Co-immunoprecipitation was performed according to the Sileks commercial kit (Sileks, Moscow, Russia) using magnetic particles with protein G (SileksMag-Protein G, cat. no. K0182) in accordance with the manufacturer’s recommendations. For this purpose, in a cytoplasmic protein extract of penumbra tissue, obtained 24 h after photothrombotic exposure (PTS24), endogenous caveolin-1 proteins were immunoprecipitated with anti-caveolin-1 antibody and co-precipitated C-APP, N-APP, or ADAM-10 were subsequently detected by antibodies against respective proteins. To visualize the protein–protein interaction, the resulting immunoprecipitate was subjected to immunoblotting.
The primary antibodies: rabbit anti-C-APP (A8717, 1:500), anti-N-APP (SAB4200536, 1:500), anti-ADAM-10 (A2726, 1:500) caveolin-1 (SAB4200216, 1:500) were used. The expression level of the caveolin-1 protein served as a Co-IP control. HRP-conjugated antibodies (goat anti-rabbit IgG-HRP, Merk A6154, 1:1000; goat anti-mouse IgG-HRP, Amersham NIF825, 1:1000) were used as secondary antibodies. Proteins were identified in immunoblotting.
2.7. Immunofluorescence Microscopy
The double immunofluorescence method was used to evaluate the expression and distribution of α-, β- and γ-secretases, and caveolin-1 in penumbra neurons and astrocytes in rats at 4 and 24 h, and 7 days after PTS. The isolated rat brain was fixed in 4% paraformaldehyde overnight and placed in a 30% sucrose solution. Frontal 20 μm thick brain slices (+4.5 mm to −2.5 mm from bregma), obtained using a Leica VT1000 S vibratome (Leica Biosystems, Deer Park, IL, USA), were washed in PBS and incubated in 5% bovine serum albumin c 0.3% TritonX-100 in PBS for one hour at room temperature and then incubated overnight at 4 °C in the same BSA solution with antibodies added: anti-C-APP (1:500), anti-N-APP (1:500), anti-ADAM10 (1:500), anti-BACE1 (1:500), anti-nicastrin (ab1) (1:500), anti-presenilin-1 (1:500), and anti-caveolin-1 (A19006, ABclonal, 1:500), anti-Caspase 3, active (C8487, 1:500), as well as antibodies to NeuN (neuron marker) (1:1000) and GFAP (astrocyte marker) (1:1000), and then with fluorescent secondary anti-rabbit CF488A (SAB4600045, 1:1000) or anti-mouse CF555 (SAB4600302, 1:1000) antibodies. Hoechst 33342 was used as a marker of cell nuclei. After washing in PBS, slices were incubated for one hour with fluorescent secondary anti-rabbit CF488A (SAB4600045, 1:1000) or anti-mouse antibodies CF555 (SAB4600302, 1:1000). The slices were then mounted on glass slides in 60% glycerol/PBS. The results were analyzed using Nikon Eclipse FN1 fluorescent microscope equipped with a Nikon Digital Sight DS-5Mc digital camera (Nikon, Tokyo, Japan) with NIS Elements and Olympus BX51 microscope equipped with an OrcaFlash 4.0 V3 digital camera with HCImage Live software (Hamamatsu, Hamamatsu City, Japan).
Quantitative evaluation of the fluorescence of the experimental and control preparations was carried out on 10–15 images obtained with the same digital camera settings. To isolate and calculate the fluorescence intensity, we used the “Threshold’’ method of the Adjust menu in the ImageJ application (
http://rsb.info.nih.gov/ij/, NIH, USA, accessed on 20 October 2021). For better isolation, cells were cut off background pixels using the Subtract background feature in the Process menu. Next, using the capabilities of the Analyze Particles and ROI Manager menus, cells were isolated and their total fluorescence intensity was measured. The data were normalized after background subtraction:
where
Im is the average cell fluorescence intensity and
Ib is the average background fluorescence outside the cells. Protein co-localization was assessed using the ImageJ application with the JACoP plugin. The co-localization coefficient M1 represents the proportion of pixels in the green channels relative to the total signal recorded in the red channel (marker).
2.8. Inhibitor Assay
Batimastat (batimastat (BB-94); SML0041) was used as an α-secretase inhibitor; LY2886721 (SML3013), as a β-secretase inhibitor); DAPT (D5942), as an inhibitor of γ-secretases.
Batimastat was dissolved in DMSO and administered intraperitoneally to CD-1 mice at a dose of 50 mg/kg (or 3 mg/mL) one hour after irradiation for five days. Batimastat was previously shown to efficiently penetrate the brain when administered intraperitoneally [
31].
LY2886721 is a potent and selective active site inhibitor of β-secretase (BACE1,2) without inhibition of other proteases such as cathepsin D, pepsin, and renin [
32]. The LY2886721 preparation was dissolved in 6.7% DMSO and 5% Tween 20 in PBS and administered to animals intraperitoneally at a dose of 10 mg/kg/day for five days.
DAPT, a γ-secretase inhibitor, was dissolved in 5% DMSO and administered to animals intraperitoneally at a dose of 10 mg/kg/day for five days [
33].
Daidzein (Sigma-Aldrich, 486-66-8), a caveolin-1 inhibitor was dissolved 1:10 in a solution of dimethyl sulfoxide:phosphate-buffered saline (pH 7.2) and administered at 0.4 mg/kg/day, subcutaneously from 1st to 14th day after PTS [
27].
2.9. Assessment of the Cerebral Cortex Infarction Volume in Mice after PTS
To assess the infarction volume, brain slices of mice were stained with 2,3,5-triphenyltetrazolium chloride (TTX; T8877, Sigma) at 3, 7, and 14 days after PTS. After decapitation, the brain was quickly removed and placed in a pre-chilled brain matrix of adult mice (J&K Seiko Electronic Co., Ltd.). The matrix with brain tissue was transferred to a freezer (−80 °C) for 3–5 min and cut into 2 mm thick sections. These sections were stained with 1% TTX for 30 min in the dark at 37 °C. Using the ImageJ image analysis application (
http://rsb.info.nih.gov/ij/), the areas of infarction zones on each slice were measured, summed, and multiplied by the slice thickness (2 mm).
2.10. Estimation of the Number of Apoptotic Cells
Apoptotic cells were visualized using the TUNEL (TdT-mediated dUTP-X nick-end labeling) method which marks DNA strand breaks using the In Situ Cell Death Detection Kit, TMR red (no. 12156792910, Roche). At 3, 7, and 14 days after PTS and administration of inhibitors, mice were decapitated and frontal sections of the brain 20 μm thick were made on Leica VT 1000 S vibratome (Germany). The sections were treated with the reagents of the kit according to the manufacturer’s recommendations with the addition of Hoechst 33342 at a final concentration of 10 µg/mL and incubated for one hour at 37 °C.
The apoptotic index (AI) was calculated for TUNEL-positive cells (red fluorescence) in the perifocal region and the cortex of sham-operated animals within the whole area of the mount at a magnification of 20× using the formula: AI = (TUNEL-positive cell number)/(Total cell number (stained with Hoechst 33342)) × 100.
2.11. Electron Immunohistochemistry
Animal brain fixation was performed via transcranial perfusion under anesthesia (Nembutal at a dose of 60 mg/kg) using the Perfusion Two perfusion system(Leica Biosystems, Deer Park, IL, USA) equipped with an automatic pump. Perfusion was first carried out with a phosphate buffer solution, pH 7.4, brought to 37 °C (Merck, Darmstadt, Germany), and then with a cooled fixative solution, 4% paraformaldehyde (Merck, EMS, Kenilworth, NJ, USA) in phosphate buffer (pH 7.4). Then the brain was removed and placed in a fixative solution for additional fixation overnight at a temperature of 4 °C. After the post-fixation, a section was isolated from the brain along the coordinates: the first incision was 0.2 mm rostral from the bregma, the second incision was 6.04 mm caudal from the bregma while the brain was not dissected laterally. The excised brain fragment was glued at the caudal side of the cut down to the vibratome table VT 1000E (Leica Biosystems, Deer Park, IL, USA). Next frontal sections 60 µm thick were made.
Electronic immunohistochemistry was performed on rat brain slices according to the pre-embedding protocol. The pre-embedding method (before embedding) is based on the fact that the incubation of slices with primary and secondary antibodies as well as the detection of immune complexes takes place before wiring and embedding the sections in epoxy resin for electron microscopy. Vibratome slices of 60 μm were placed alternately in solutions of 6%, 15%, and 30% sucrose for cryoprotection. Unmasking of antigenic activity was carried out by instantaneous freezing of sections over vapors of liquid nitrogen and subsequent thawing in phosphate buffer. The slices were then incubated in primary anti-APP antibodies supplemented with 0.1% sodium azide to prevent bacterial growth. Incubation was carried out for four days at 20 °C. After washing in a phosphate buffer, the slices were incubated in secondary antibodies RTU Envision Flex/HRP anti-mouse, anti-rabbit (Dako, Glostrup, Denmark) for 24 h at 20 °C. Immune complexes were detected using the EnVision HRP + Peroxidase imaging system (Dako, Glostrup, Denmark). Then, tissue processing was carried out by standard methods for electron microscopic examination. After washing in a phosphate buffer for at least 15 min, the slices were additionally post-fixed in 1% OsO4 solution in the phosphate buffer for 1.5 h. Then all tissue samples were dehydrated in ascending alcohols and absolute ethanol, processed in three shifts of propylene oxide and embedded in an epoxy resin based on Epon-812. The slices were placed in a drop of resin between two glass slides coated with a water-soluble anti-adhesive Liquid Release Agent (EMS, USA). Polymerization of brain tissue was carried out at 70 °C overnight. Fragments of the studied zones were excised from the sections obtained after polymerization with a blade under a stereotaxic magnifying glass and polymerized to a prefabricated block of epoxy resin. Single and serial (up to 20 sections in one tape) 70 nm thick ultrathin slices were made using an EM UC 7 ultramicrotome (Leica, Germany) and an ultra 45° diamond knife (Diatome, Nidau, Switzerland), counterstained with uranyl acetate and lead citrate and viewed under an electron microscope Jeol Jem 1011 (Jem, Akishima, Tokyo, Japan) with an accelerating voltage of 80 kV.
2.12. Randomization and Blinding
Randomization was applied by randomly choosing the animals from their cages. Blinding was performed at different stages of the experiments: PTS or sham PTS procedure, sacrifice after a certain period post-(sham)-PTI, obtaining brain samples, microscopy, measurement, and statistical processing. Blinding was performed by different researchers.
2.13. Statistical Analysis
For a posteriori (post-hoc) test in ANOVA, Holm–Sidak’s test was applied all-pairwise (for three 4 h groups and three 24 h independently in
Figure 1c,d) or with the control comparison type (
Figure 1,
Figure 2,
Figure 3,
Figure 4,
Figure 5,
Figure 6,
Figure 7 and
Figure 8). Differences were considered significant at
p < 0.05. Data were presented as mean ± SEM.
4. Discussion
APP processing and traffic and secretases cleaving it are described in detail in some reviews [
11,
45,
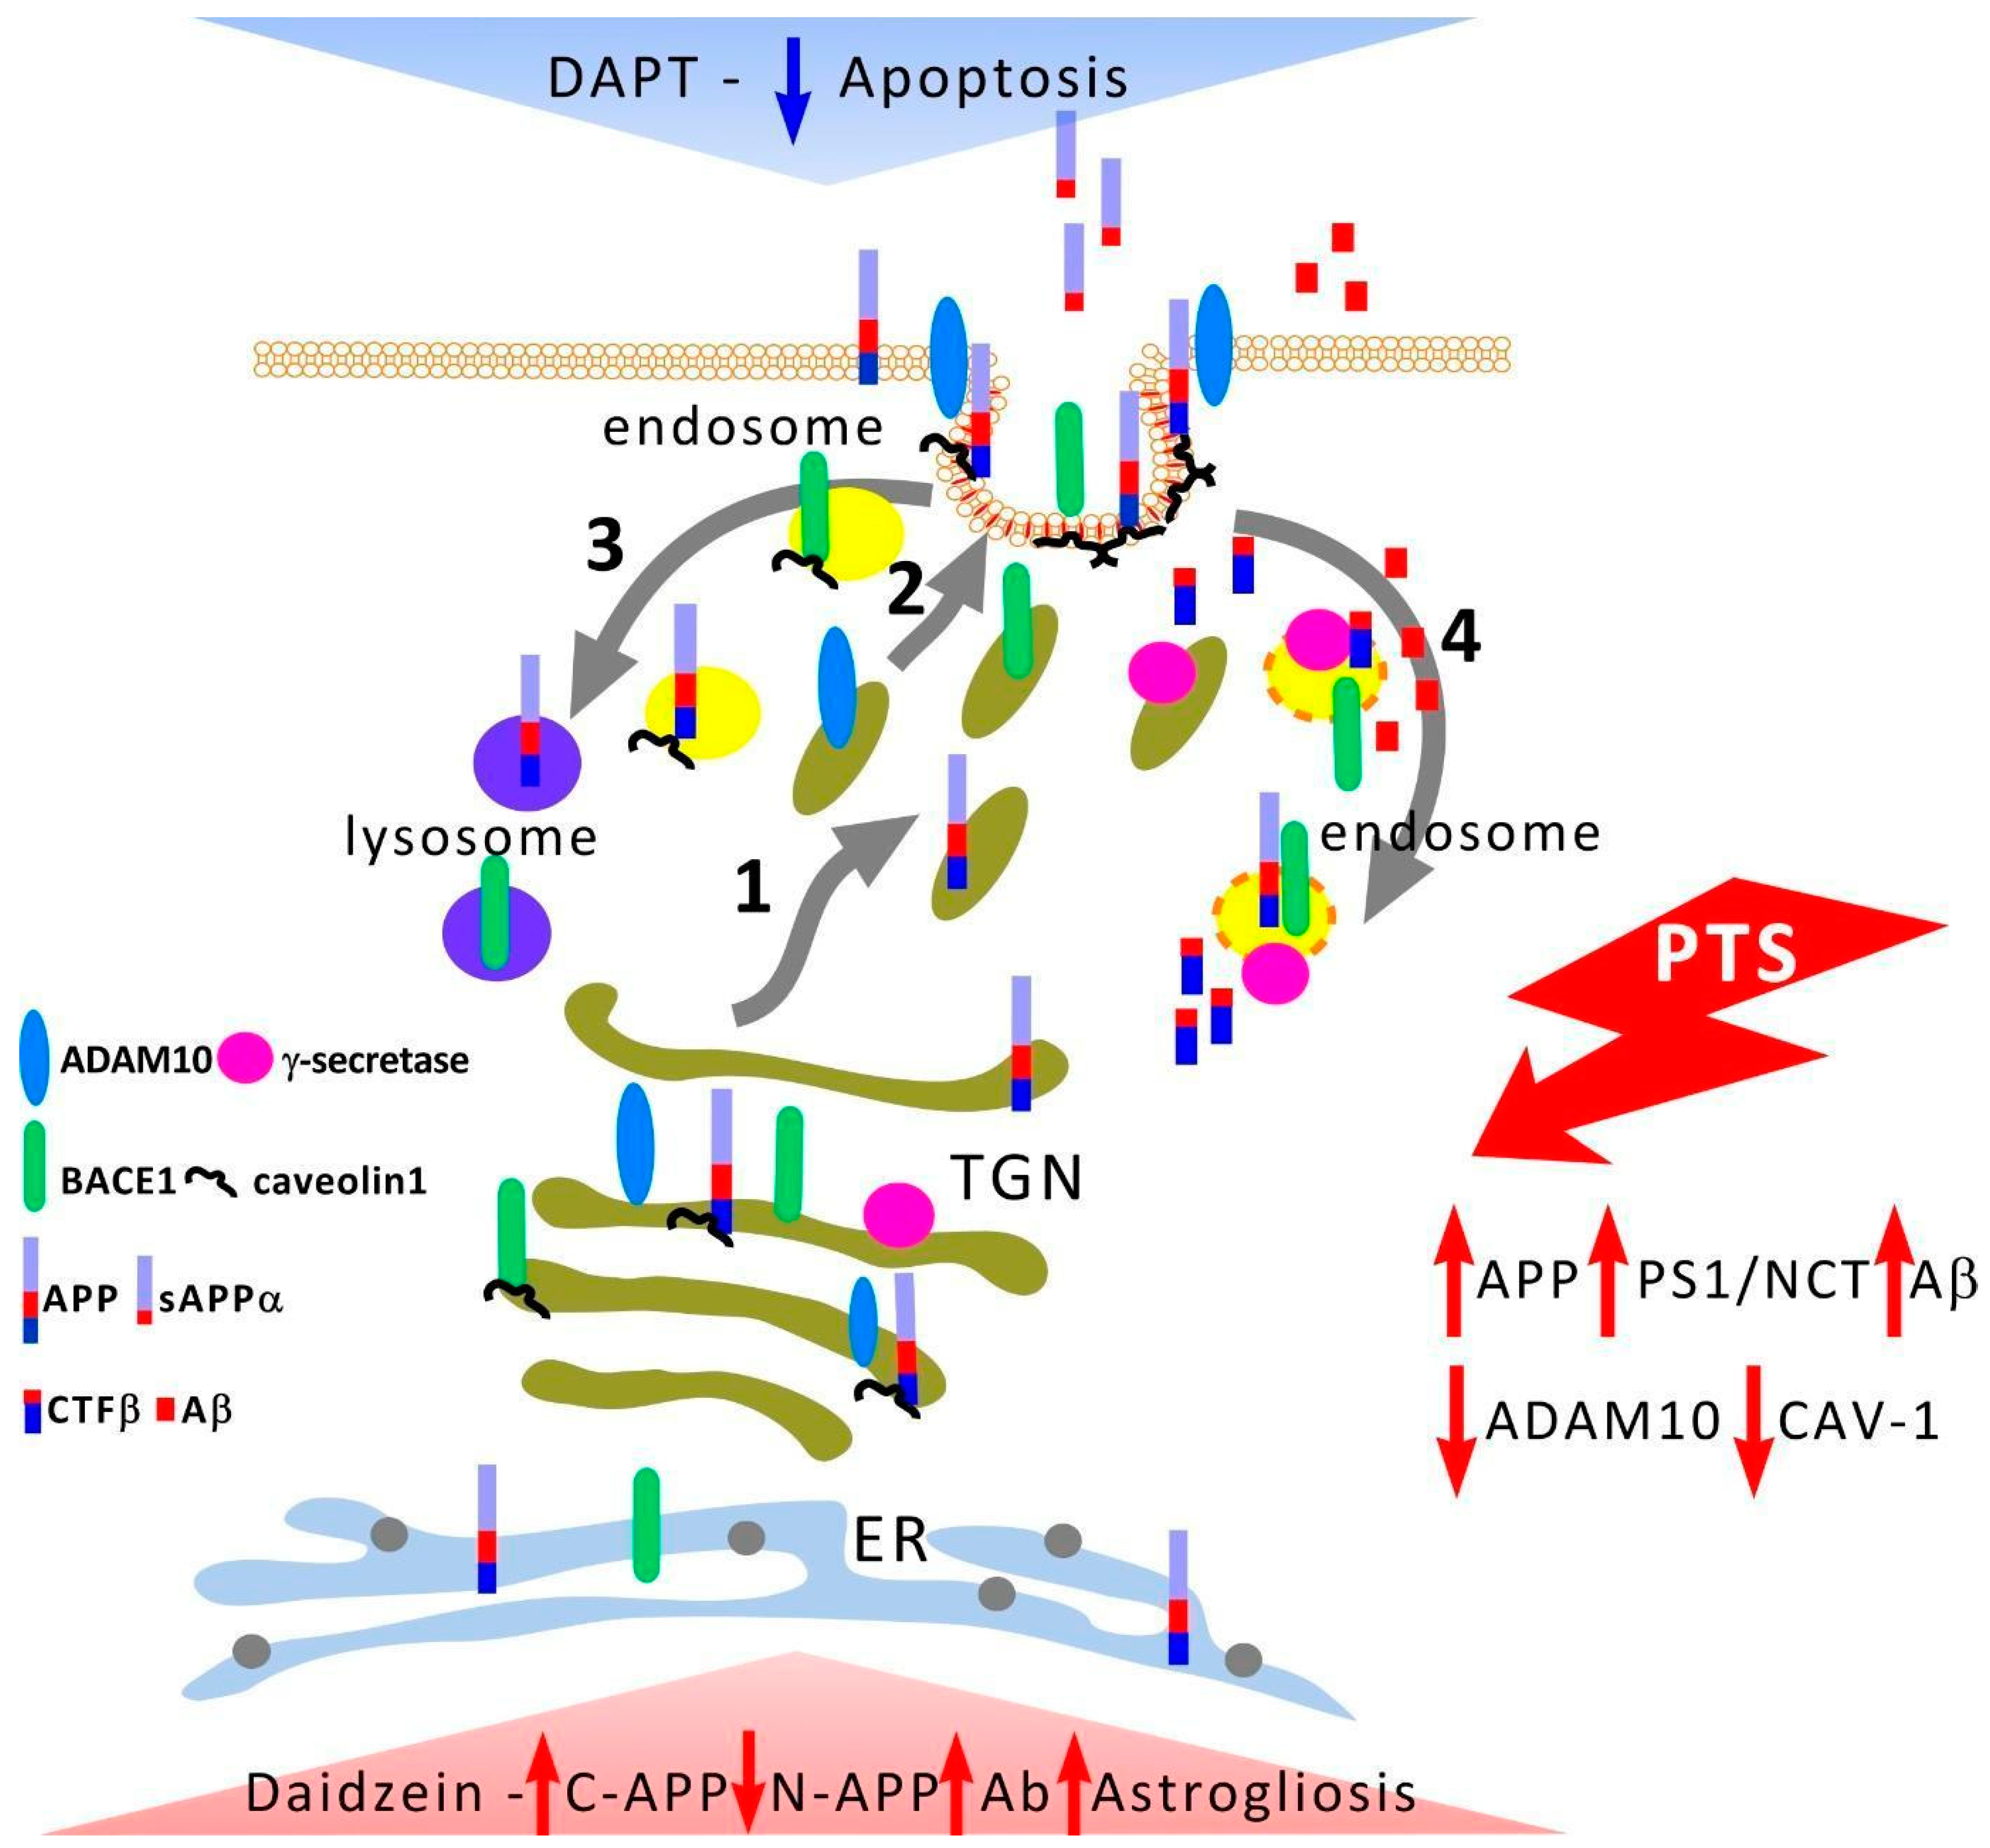
46]. After a ribosomal synthesis of the rough endoplasmic reticulum (RER), APP undergoes processing along the RER—Golgi apparatus (AG)—TGN (trans-Golgi network) vesicles—plasma membrane (PM) pathway (
Figure 9). Only about 10% of APP reaches the neuronal membrane as part of TGN vesicles, while the rest is localized in AG and TGN. After incorporation into the PM, APP is internalized within a few minutes and enters endosomes. Part of its amount is recycled and again enters PM, while the other part is degraded in lysosomes. After passing through the TGN in neurons, transport vesicles are transported along the microtubules of axons and dendrites to the periphery of these neurites. It is important to know where APP proteolysis occurs and where its products are generated. A significant fraction of the sAPPα domain is generated by α-secretase inside TGN vesicles and it is exported to the external environment after their incorporation into the PM. BACE1 is first expressed in TGN vesicles and also is concentrated in lipid rafts of the plasma membrane. After reaching the PM, most of BACE1 is internalized and enters endosomes where the acidic environment promotes APP proteolysis (pH 4.5 is optimal for BACE1). Most of the vesicles carrying APP and BACE1 are spatially segregated, both in cultured neurons and in mouse or human brains [
47]. Although both APP and BACE1 are synthesized via ER→Golgi, BACE1 is subsequently present in recycling endosomes (
Figure 9). Thus, APP and BACE1 are transported in different vesicles and this simple spatial separation limits APP cleavage by BACE1 under normal conditions.
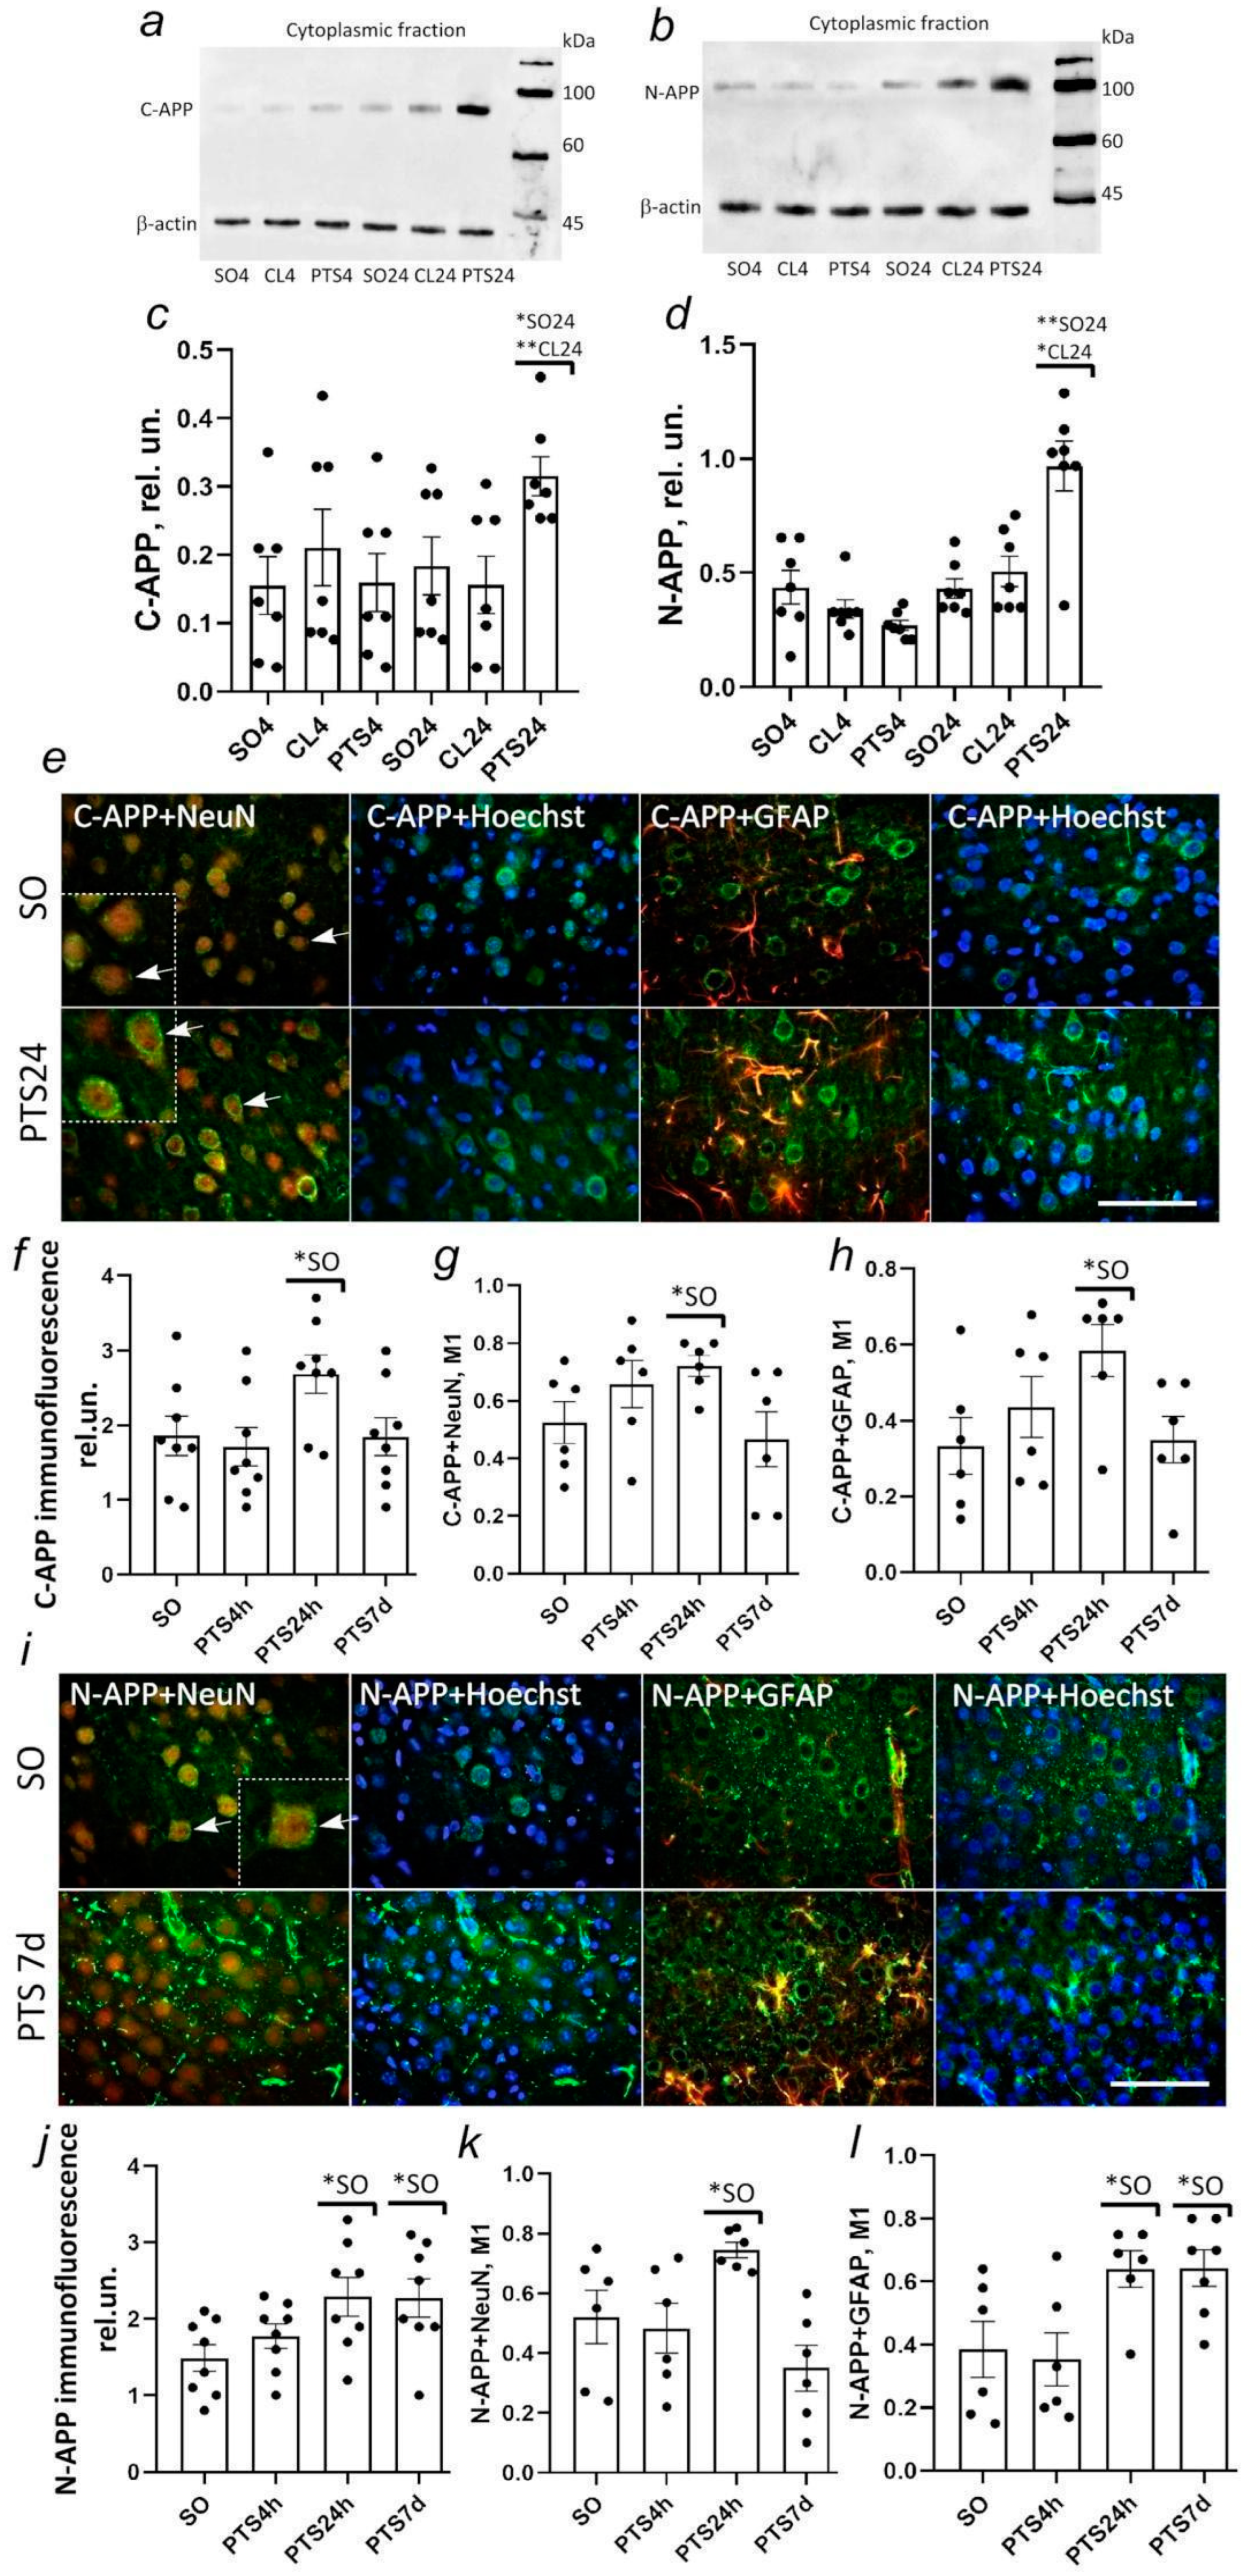
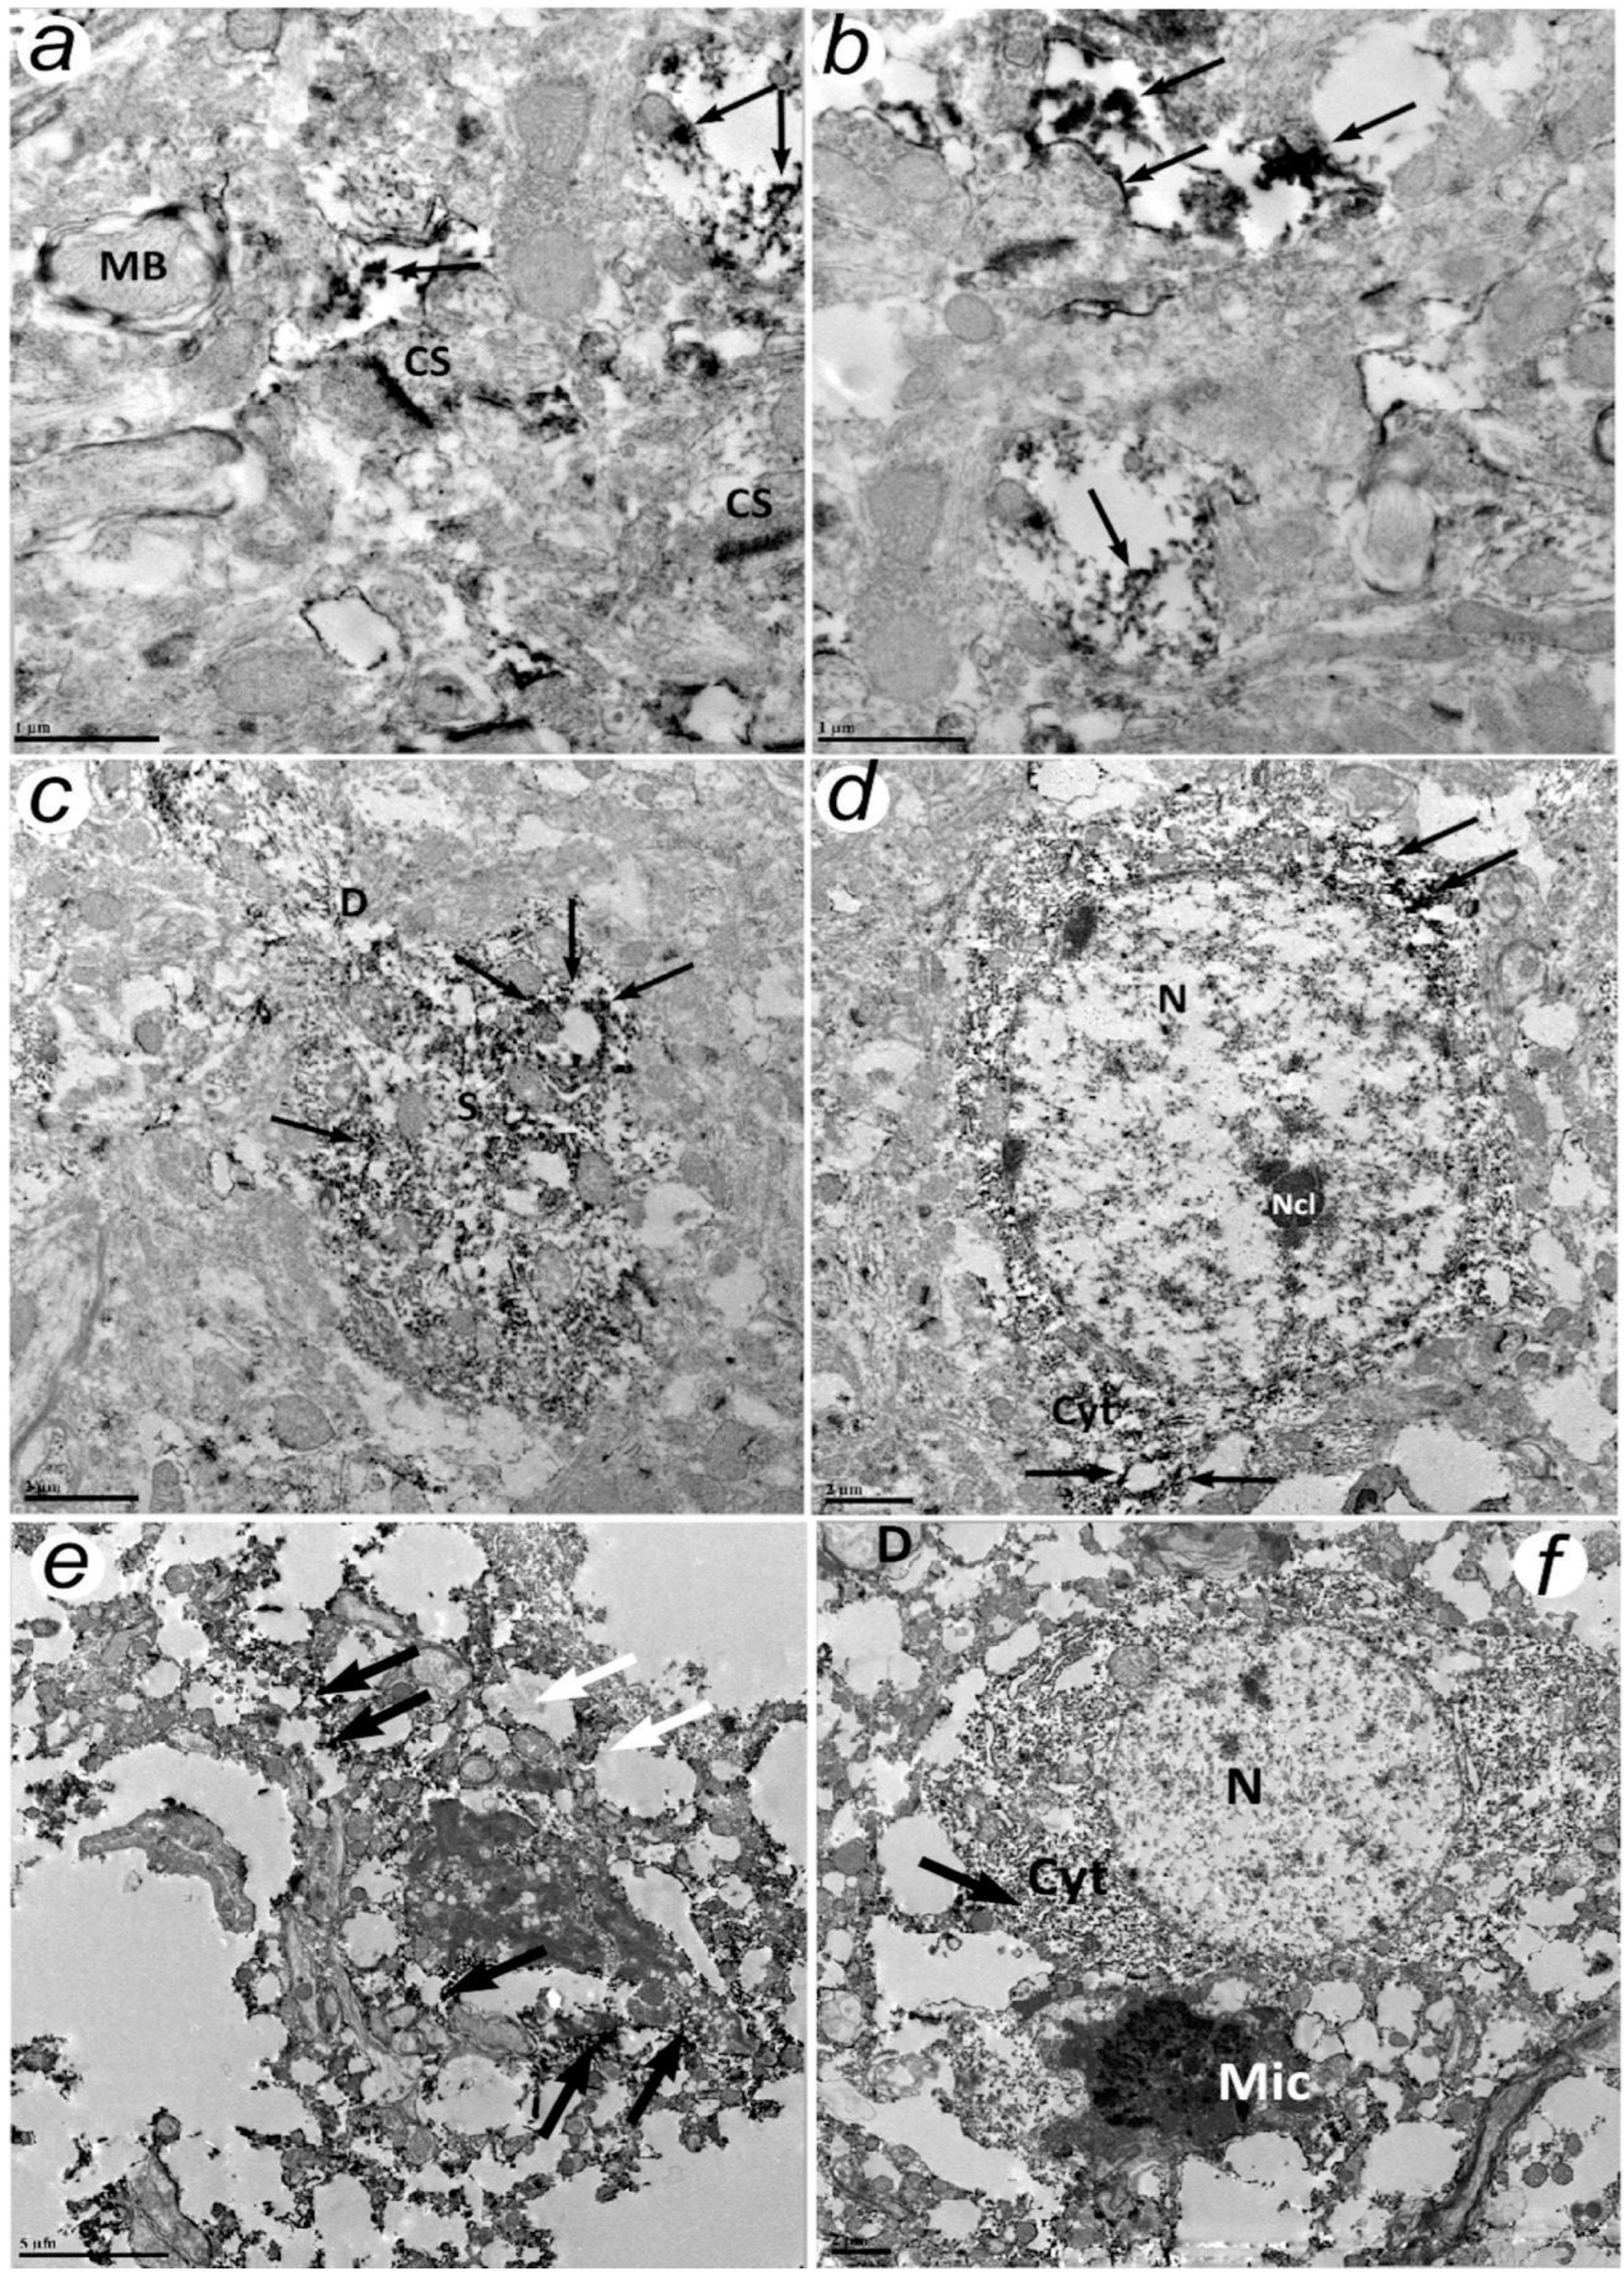
Here, we showed that C- and N-terminal fragments of APP are found not only in neurons but also in astrocytes after PTS. PTS caused the growth of both C- and N-terminal regions of APP already after 24 h. The level of the C-terminal fragment of APP decreased to control values by the 7th day after PTS and was localized in neurons, not astrocytes. A high level of N-APP (that could be predominantly a product of α-secretase (sAPPα) activity) persisted in astrocytes, but not in neurons at the 7th day after PTS. Interestingly, according to electron microscopy data, some neurons, astrocytes, and microglial cells did not contain APP. The reason for this selectivity remains to be seen. Little is known about the role of APP in astrocytes during cerebral ischemia. Although astrocytes express low levels of APP at rest, its level is strongly increased in models of brain injury where extensive gliosis occurs [
48]. Astrocyte activation is an early sign of Alzheimer’s disease and may be a source of beta-amyloid that forms neuropathological plaques in Alzheimer’s disease [
49]. Aβ is actively produced by reactive astrocytes as early as 3 days after MCAO, and peptide production decreases only 60 days after ischemia [
50]. A 10 min cardiac arrest causes the growth of full-length amyloid precursor protein in reactive astrocytes up to 7 days after ischemia, and Aβ and C-terminus of APP only after 6 months when extensive loss of neurons and the onset of brain atrophy have been observed [
51].
APP and its secretases’ distribution in different membrane domains and cell compartments (
Figure 9) can affect the balance between amyloidogenic and non-amyloidogenic processing pathways. Cell line studies have shown that APP and BACE1 convergence occurs at the plasma membrane in detergent-resistant regions of the membrane [
15,
16] or possibly near it, but more recent data suggest that these two proteins converge within early endosomes [
45,
46,
52]. Thus, the degree of co-localization of secretases remains unclear.
The proteinases of the “disintegrin and metalloproteinases” or ADAM family, such as ADAM9, ADAM10, TACE/ADAM17, and ADAM19, act as α-secretase in mammalian cells [
14]. However, in neurons, α-secretase activity is associated with ADAM10 [
53]. α-secretases cleave Notch receptors and ligands, tumor necrosis factor α, cadherins, the IL-6 receptor, EGF receptor ligands, and several other transmembrane proteins to release their extracellular domain [
54]. Protein kinase C is known to promote the processing of α-secretases and the secretion of the APP ectodomain [
11]. Cleavage of CTFα by γ-secretase releases the 3 kD p3 peptide and AICD. Studies have shown that p3 can have neurotoxic effects such as neuronal apoptosis [
55]. Chronic cerebral hypoperfusion caused an increase in the levels of sAPPα, ADAM10, and ADAM17 in the hippocampus of rats against the background of an even more significant increase in the levels of sAPPβ, BACE, and BACE1 contributed to the promotion of the amyloidogenic pathway of APP processing and caused cognitive impairment [
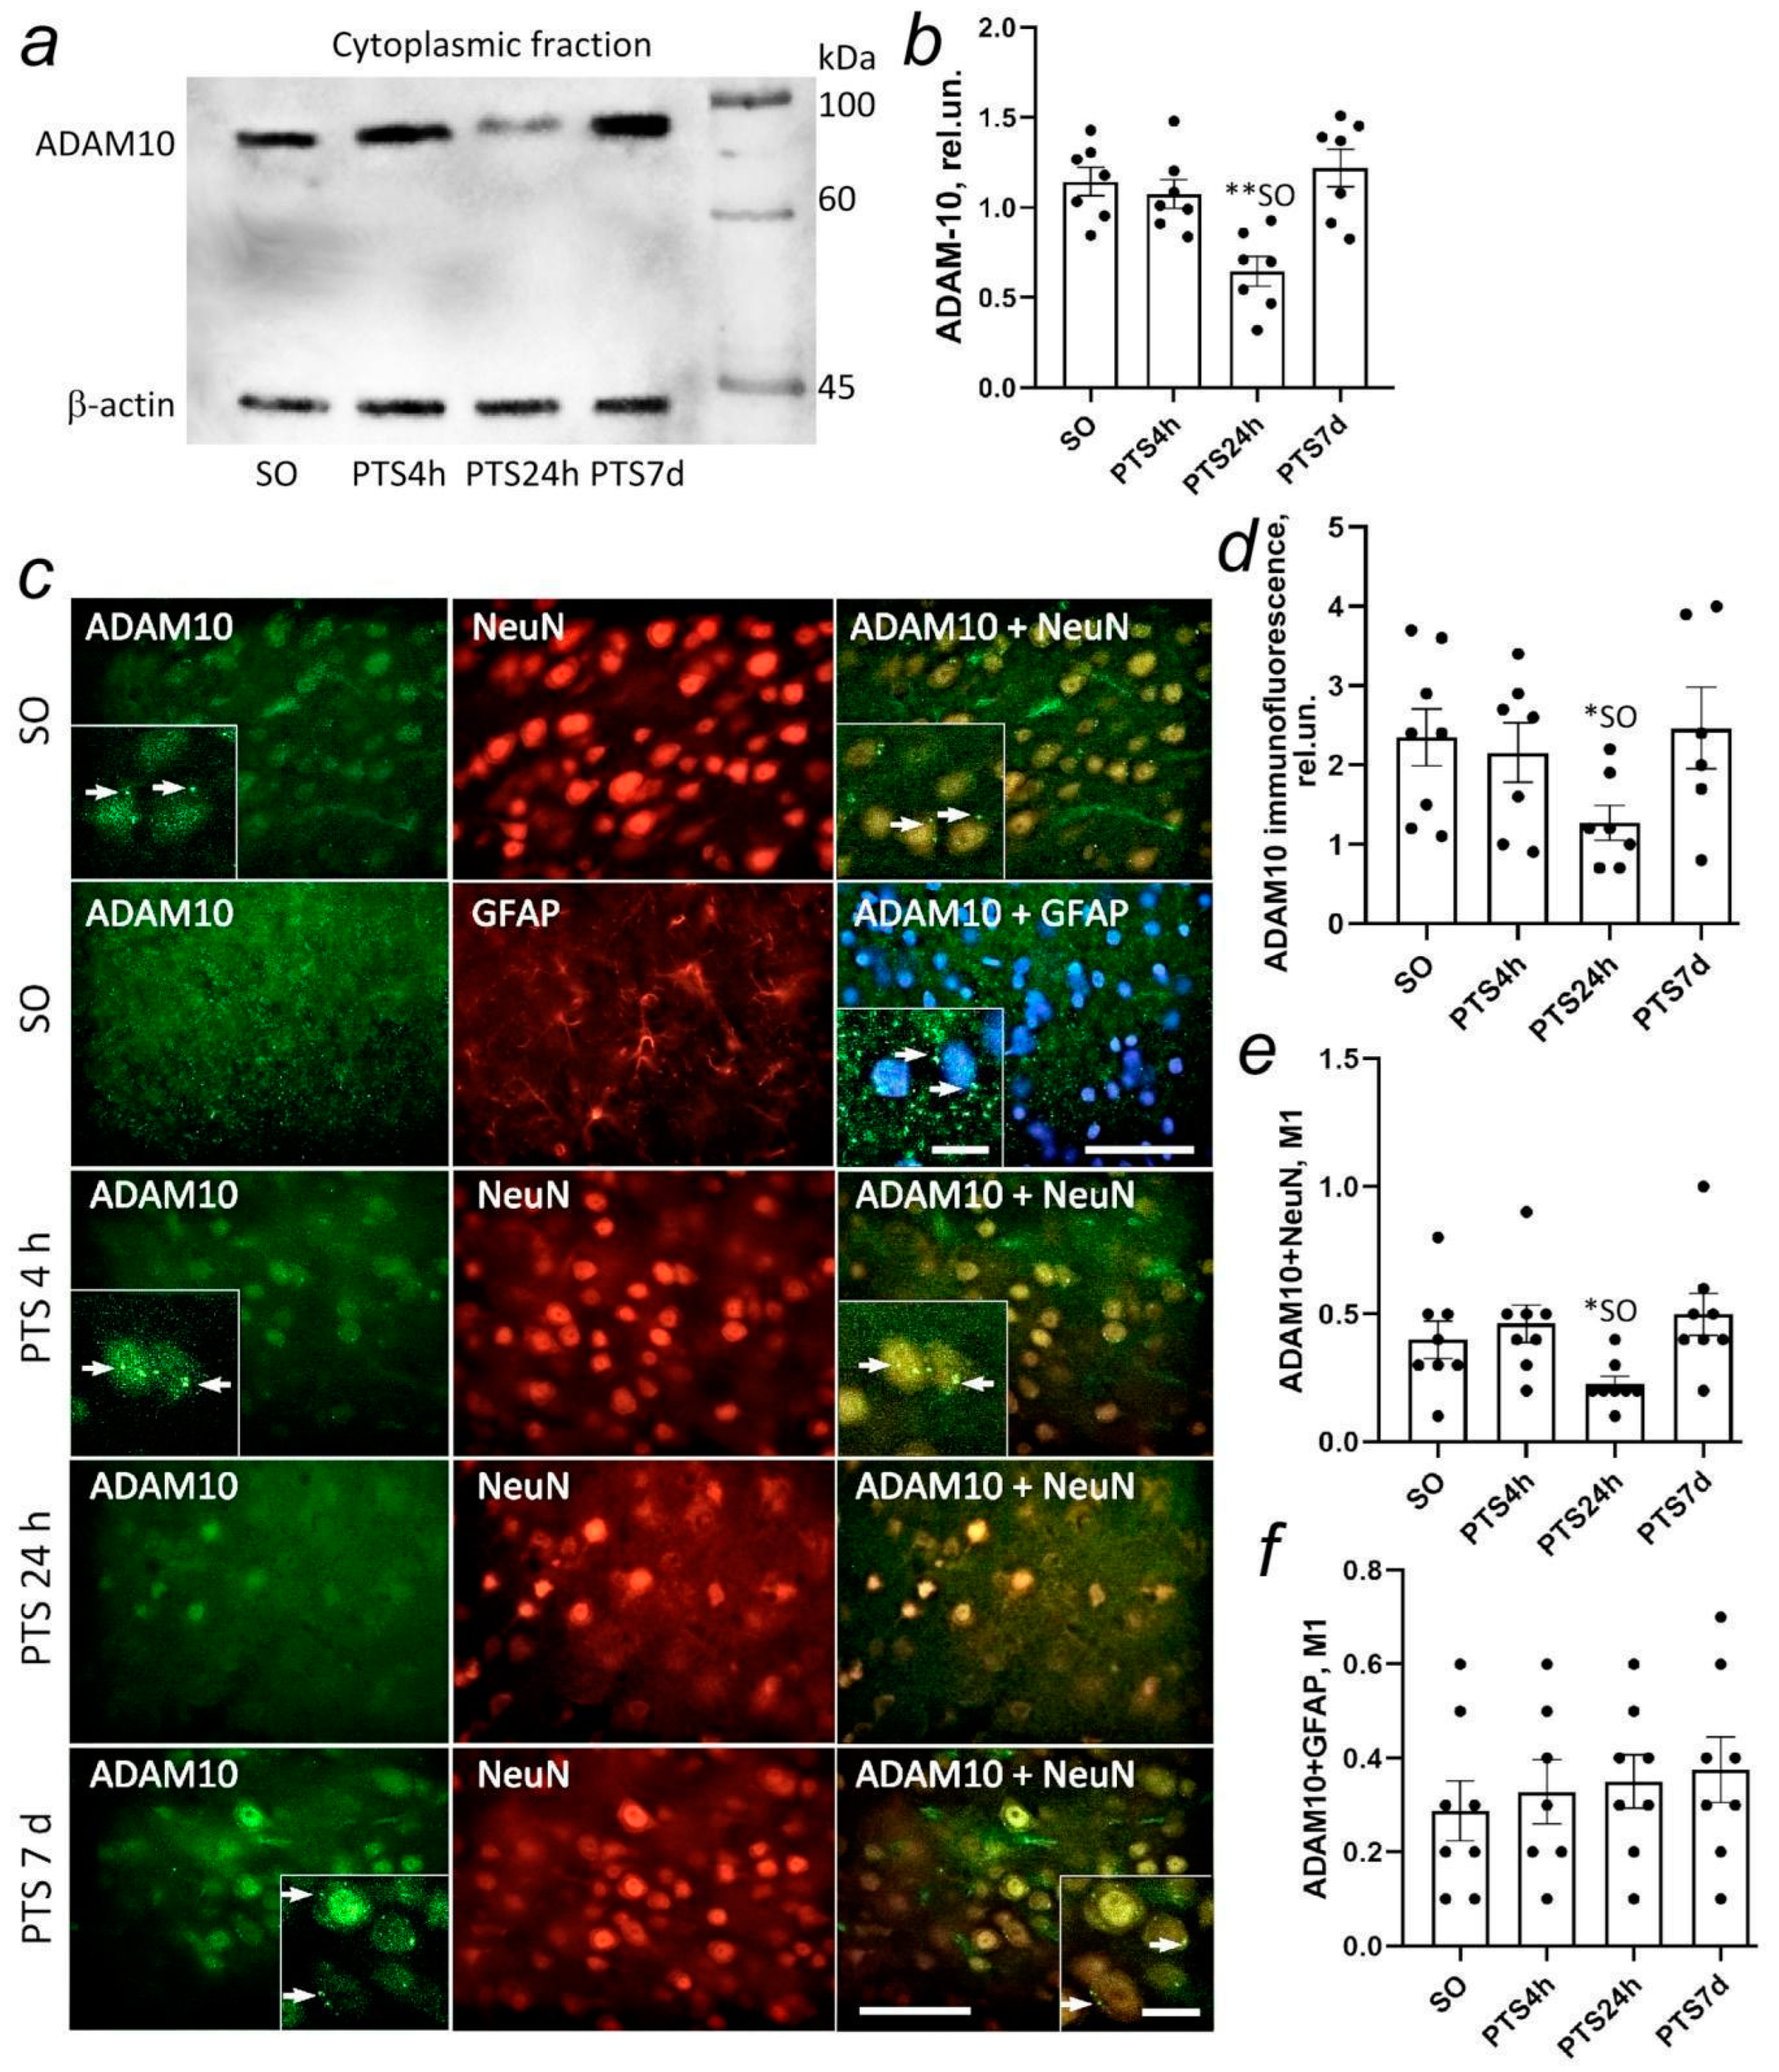
34]. It is possible that the decrease in ADAM10 expression that we observed after PTS is associated with a general decrease in protein biosynthesis needed during the most acute period of stroke. A comparison of the behavior of adult mice showed that the loss of ADAM10 in A10cKO mice leads to a decrease in neuromotor abilities and a decrease in learning ability that was associated with a change in the activity of neurons in the CA1 region of the hippocampus and impaired synaptic function [
56]. Histological and ultrastructural analysis of the brain of A10cKO mice revealed astrogliosis, microglial activation, and disturbances in the number and morphology of postsynaptic structures [
56]. In a rat PTS model, a decrease in the enzyme in neurons occurred on the first day after PTS but by the seventh day, the protein level was restored to control values. At the same time, ADAM10 expression decreased in neurons, but not in astrocytes, where N-APP also remained high (
Figure 1i,l). Probably, the increase in immunofluorescence of N-APP both in neurons on the first day after PTS and in astrocytes on the 7th day after PTS was not associated with the accumulation of ADAM10 activity products sAPPα, but was associated either with the accumulation of a full-length protein APP or accumulation of products of further processing of the amino-terminal region of APP that could be nonspecifically detected by the antibody we used.
Inhibition of BACE1 cleavage of neuregulin-1 (NRG1) and possibly neuregulin-3 (NRG3) causes a decrease in the thickness of the myelin sheath of axons of both peripheral nerves (sciatic nerve) and central optic nerves and impairs remyelination of injured nerves [
57]. Proteolytic processing of the neuregulin-1 (NRG1) BACE1 protein is associated with the activation of ErbB receptor tyrosine kinases. This signaling pathway is involved in synapse formation, plasticity, neuronal migration, myelination of central and peripheral axons, and in the regulation of neurotransmitter expression and function. It is possible that seven days after the neurotrauma time point was an insufficient time to activate the expression of the enzyme since the available data indicate that high BACE1 activity in neurons may be associated with repair processes after brain cell damage.
γ-secretase catalyzes the final cleavage of APP with AICD and either Aβ in the case of the amyloidogenic pathway of APP proteolysis or p3 in the non-amyloidogenic variant of APP proteolytic formation. γ-secretase is composed of four integral membrane proteins: presenilin (PS) 1 or 2, nicastrin (NCSTN), PEN-2, and APH-1. Assembly of the complex begins with the stabilization of PS with nicastrin and APH-1, after which, the last component of the PEN-2 protein complex is added [
58]. Biochemical studies show that PS1 and PS2 (or APH-1a and APH-1b and their alternatively spliced forms) never coexist in the same complex, suggesting that there are at least six different γ-secretase complexes in humans. PS1 is located mainly in the endoplasmic reticulum [
59]. However, significant amounts of PS1 bound to NCSTN were found in the plasma membrane and endosomes/lysosomes, indicating that completely assembled complexes leave the endoplasmic reticulum and translocate to the plasma membrane. All four components of the γ-secretase complex are localized in the active form on the plasma membrane and lysosomes [
59]. Our studies have shown that the expression of proteins of the γ-secretase complex, PS1 and nicastrin, increases in astrocytes, but not in penumbra neurons on the first day after PTS and remains high up to seven days after PTS. However, in the model of global ischemia, PS1 expression decreased from two up to seven days but the trend was reversed on day 30 [
60].
Electron microscopy shows that the C- and N-terminal fragments of APP were associated with the plasma membranes of the processes of nerve cells. Our attention was drawn to the pronounced clustering of APP and ADAM10 but not BACE1. This is unexpected since BACE1 and presenilin1 (PS1), the catalytic unit of γ-secretase, are localized mainly in detergent resistant membranes (DRM) or lipid rafts, while ADAM10 is localized mainly in non-lipid raft domains.
Caveolae are a subset of lipid rafts that are characterized by small membrane invaginations and the presence of caveolin-1 [
23,
25,
26,
27]. Caveol-like membrane domains have been characterized in nerve cells [
23,
61,
62]. In Alzheimer’s disease, caveolar dysfunction can cause a decrease in α-secretase activity and accumulation of toxic amyloid Aβ peptide [
15,
25]. Caveolin-1 is known to physically interact with APP [
23,
25] and BACE1 [
24], and overexpression of caveolin-1 attenuated γ-secretase-mediated proteolysis of APP and Notch [
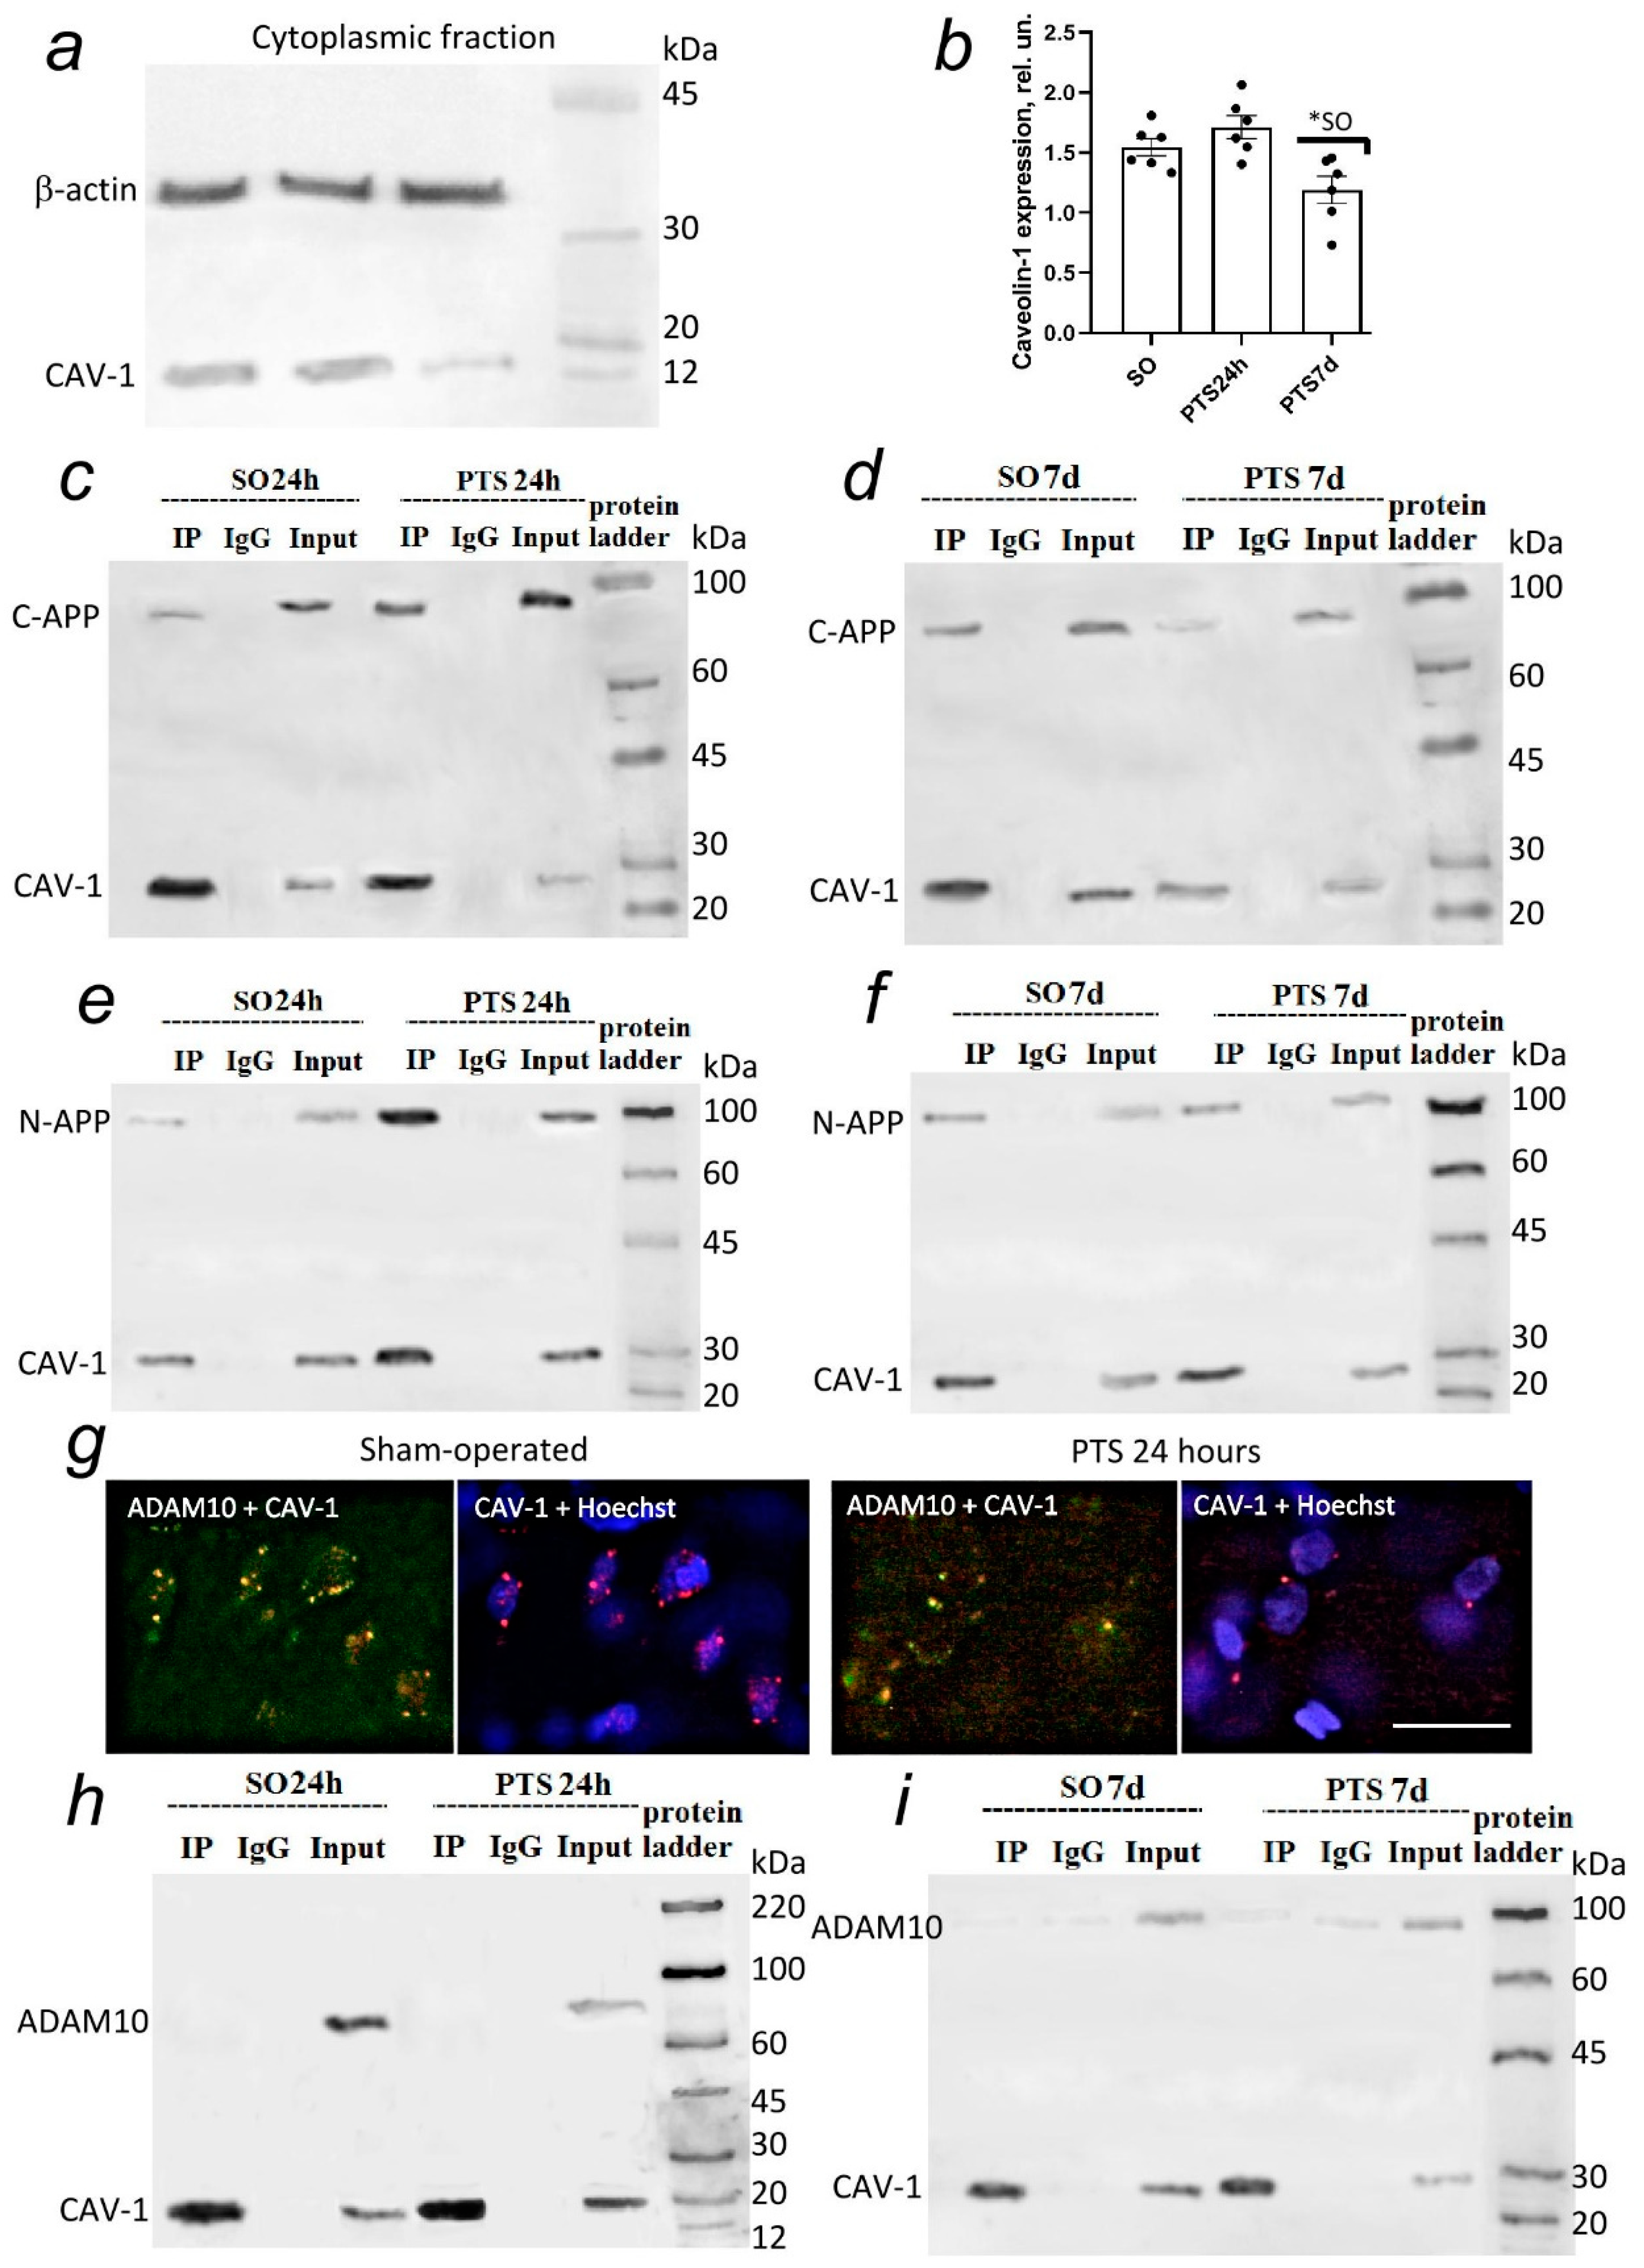
63]. Caveolin-1 was weakly expressed in rat brain cells, and PTS caused a further decrease in its level. Immunofluorescent analysis indicates a high co-localization of caveolin-1 with ADAM10 after PTS. However, the results of immunoprecipitation indicate an increase in the interaction between caveolin-1 and C-APP and, to a much lesser extent, between N-APP, as well as the absence of direct physical interaction between caveolin-1 and ADAM10 (
Figure 4). Our results confirm the data that the caveolin-1 binding motif is located on the C-terminal cytoplasmic tail of APP [
23]. The observed co-localization in fragments of APP and ADAM10 with caveolin-1 indicates the localization of APP and ADAM10 in areas of brain cells rich in caveolin both on the membrane and outside it. Our data indicate the accumulation of APP fragments in axons and dendrites and the zones of chemical synapses. It is assumed that axonal APP is concentrated in the caveolar structures of neurons [
64]. Caveolin-1 can act independently of caveolae in ischemia [
65]. Caveolin can be found in the trans-Golgi network (TGN) in the cytosol or separate structures, such as caveosomes (early endosomes) and TGN, which can be the site of APP processing to form Aβ [
66]. Thus, the balance of caveolin-1 during ischemia may affect APP processing and the degree of damage to brain cells after ischemia. Caveolin-1 may play an important role in protecting the brain from stroke. Mice with caveolin-1 knockout had less lesions, lower neurological deficits, and less cerebral edema after intracerebral hemorrhage [
67] but caveolin-1 knockout mice showed a high level of apoptotic death of penumbra cells after ischemic stroke [
68].
We carried out an inhibitory analysis to understand the significance of the detected changes in the expression of α-, β-, γ-secretase proteins, and caveolin-1.
Batimastat, or BB-94, was used as an α-secretase inhibitor. Some studies have demonstrated the neuroprotective effect of the inhibitor with a decrease in infarct volume [
31], an improvement in neurological functions, and a decrease in mortality in various models of ischemic stroke in rats and mice [
69,
70], as well as excitotoxic damage to neurons in cell culture [
71]. However, we have not detected the effect of the drug on changes in infarction volume or the level of apoptosis in cells of the mouse cerebral cortex.
LY2886721 demonstrates an effective dose-dependent decrease in the level of Aβ and sAPPβ in different experimental models: in HEK293 cells with the APP751 mutation; in primary cortical neurons of PDAPP-mutated mice [
72]; in vivo animal models (3–30 mg/kg PDAPP mice, 1.5 mg/kg beagle dogs; orally) [
22,
52,
53,
54]. In transgenic mice, doses of 3–30 mg/kg reduced Aβ levels by 20–65%. The effect lasted up to nine hours after the application of the drug. A decrease in amyloid production has been observed in plasma and cerebrospinal fluid after the administration of LY2886721 [
32,
42]. In a beagle dog model, oral administration (1.5 mg/kg) showed a significant and persistent reduction in Aβ levels in the cerebrospinal fluid [
73]. However, we could not detect the effect of LY2886721 on changes in infarct volume or the level of apoptosis of mouse cerebral cortex cells after ischemic stroke.
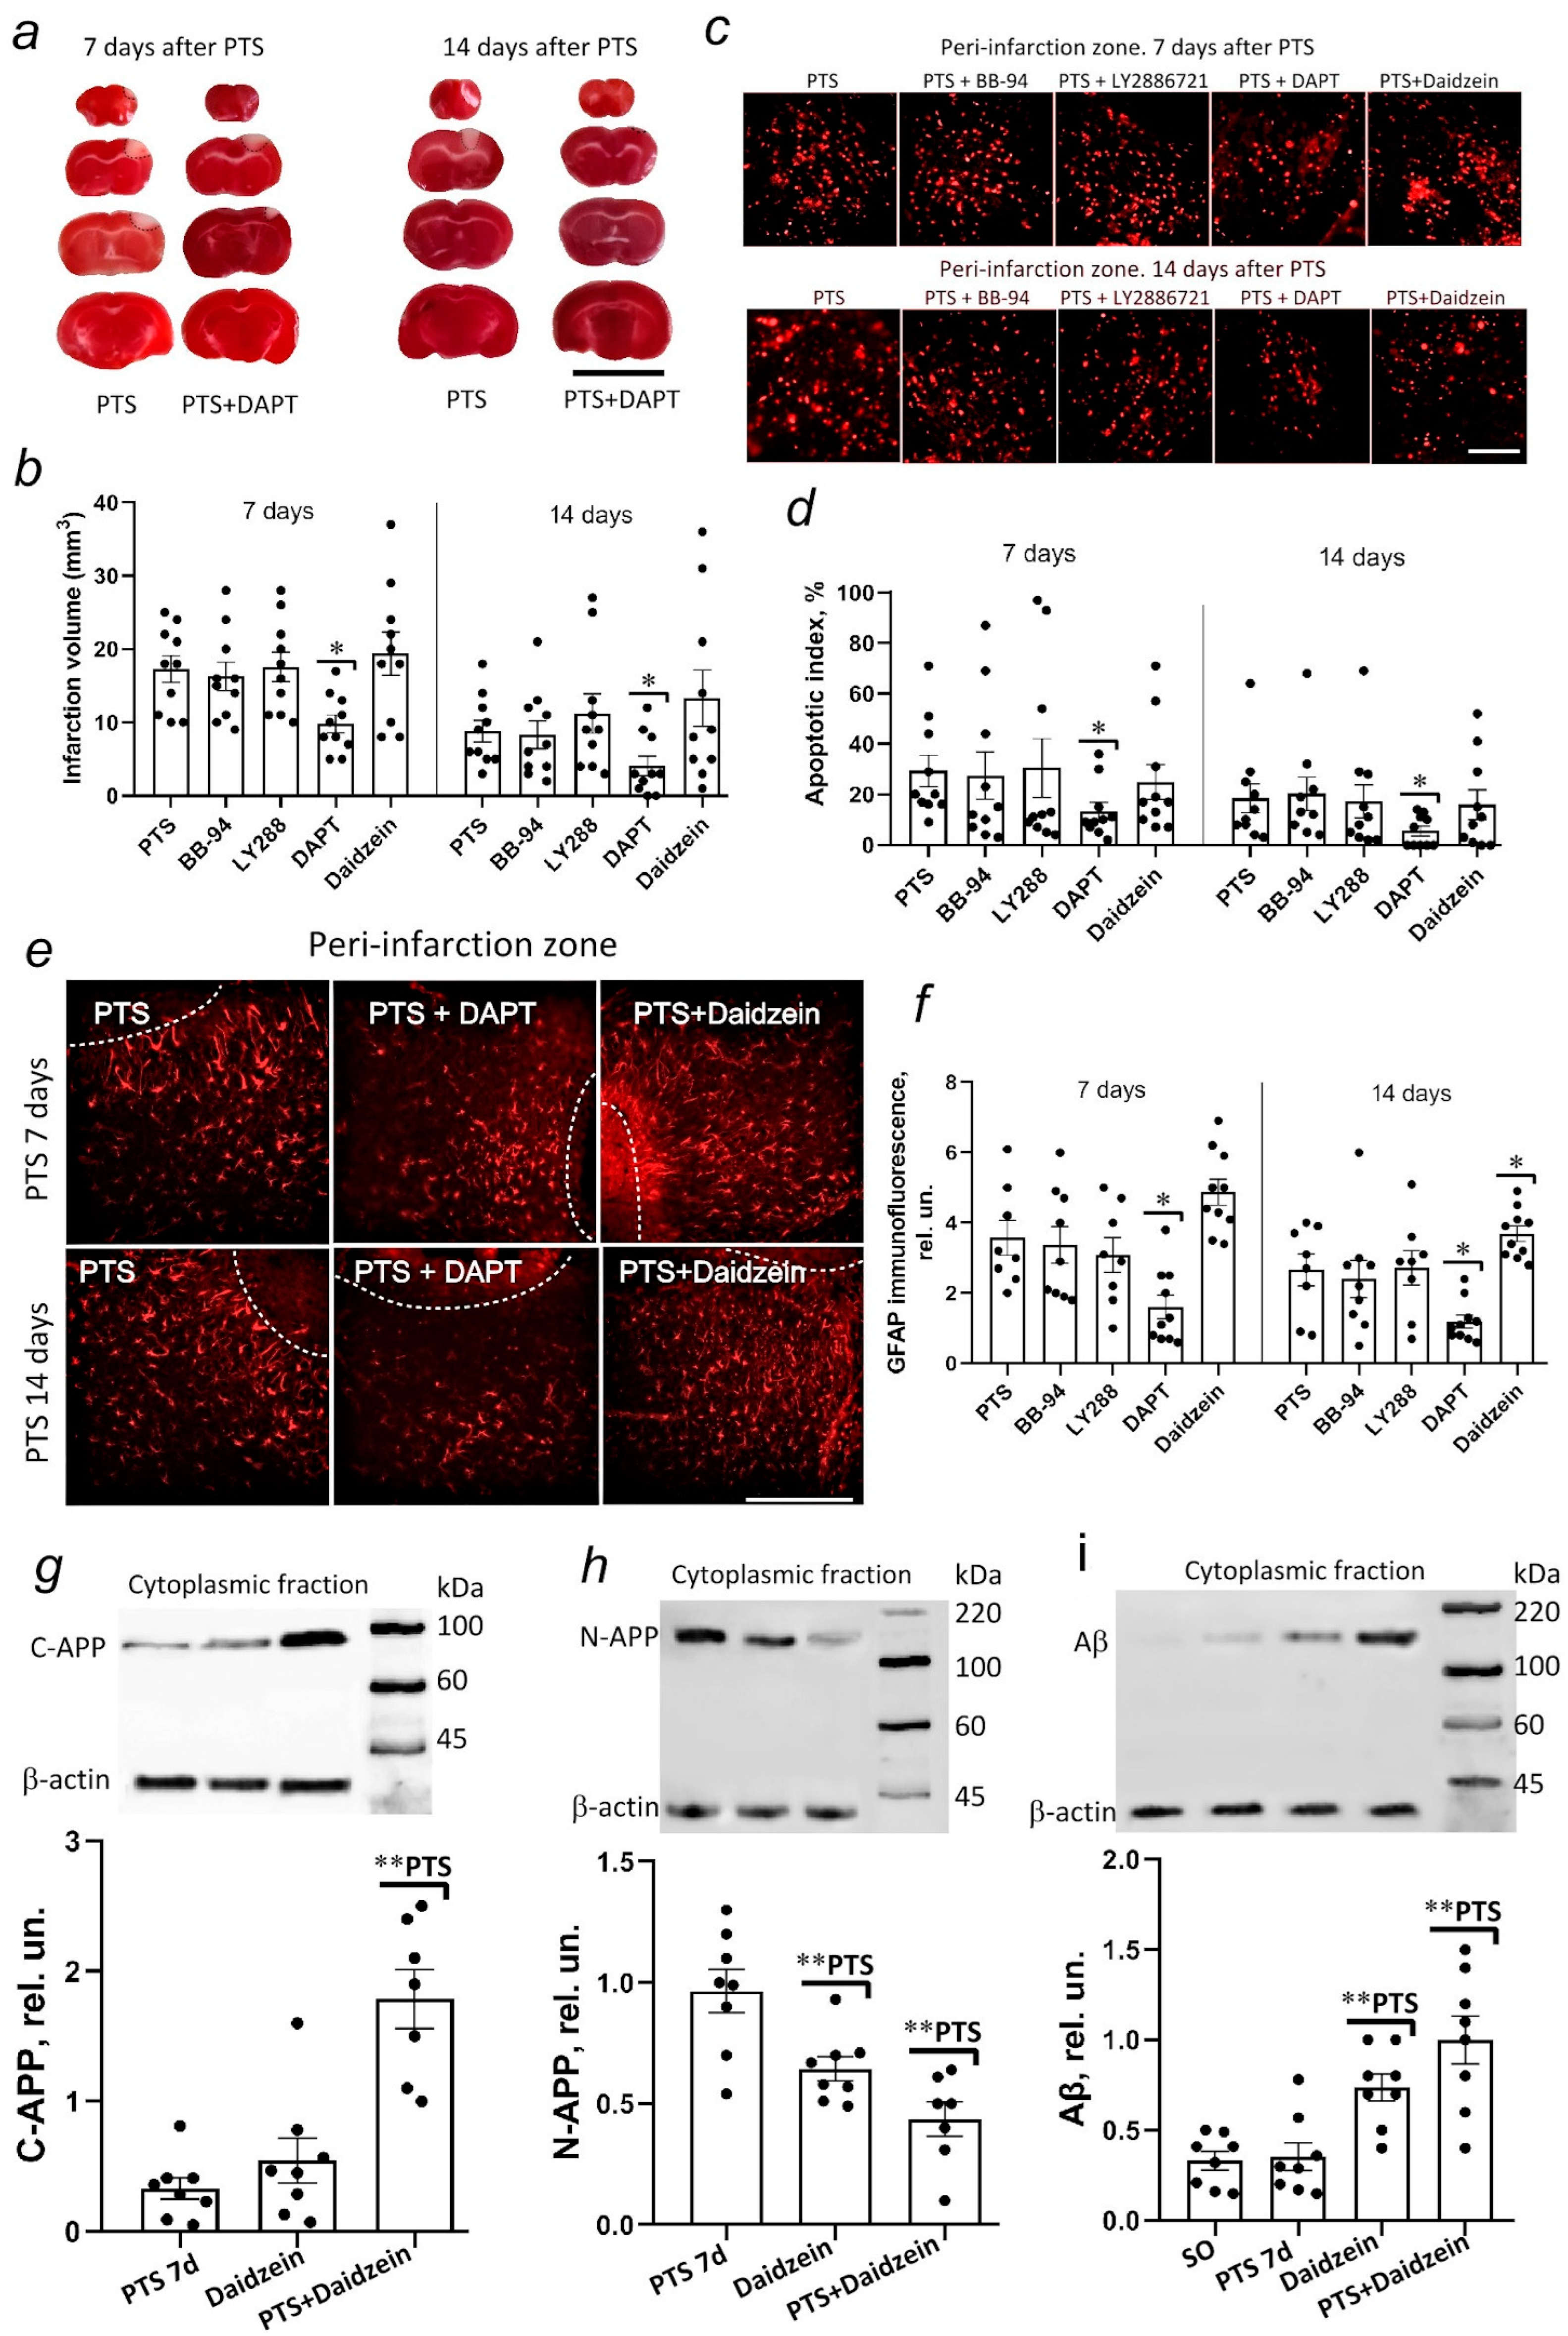
DAPT (N-[N-(3,5-difluorophenacetyl)-1-alanyl]-Sphenylglycine t-butylester) is a γ-secretase inhibitor. Among the three secretase inhibitors studied, only DAPT reduced the infarct volume on days 7 and 14 after PTS, preventing the increase in apoptosis of mouse cerebral cortex cells in the area adjacent to the infarction zone. This inhibitor was used to treat neurodegenerative diseases and modulated the differentiation of progenitor neurons and apoptotic cascades in neurons during cerebral ischemia [
33]. DAPT protects the brain from cerebral ischemia [
74] by influencing inflammatory processes, suppressing the expression of NF-κB, a family of transcription factors involved in ischemic injury, promoting inflammatory processes and inducing neuronal apoptosis [
75,
76,
77]. DAPT has been shown to have an expressed neuroprotective effect in a mouse model of ischemia/reperfusion (I/R) caused by occlusion of the middle cerebral artery. DAPT significantly improved neurobehavioral performance and reduced neuronal morphological damage. It reduced the level of GFAP as well as the number of apoptotic cells by reducing the content of interleukin-6 and tumor necrosis factor-α [
77]. Here, we also showed that photothrombotic stroke causes an increase in the level of γ-secretase proteins PS1 and nicastrin mainly in astrocytes and the administration of the inhibitor reduces the level of GFAP. It is most likely that inhibition of γ-secretase enhances the anti-inflammatory response and reduces the activation of astrocytes, contributing to the decrease in the level of apoptosis and, as a consequence, the amount of damage after ischemia. A possible mechanism for this drug effect could be a decrease in the synthesis of Aβ that can activate apoptosis both externally and internally [
78]. A decrease in the level of Aβ in astrocytes that increases after ischemia [
50,
51] can also contribute to the reduction of astrogliosis after PTS against the background of DAPT administration.
Caveolin-1-deficient cells are known to exhibit significantly increased co-localization of γ-secretase with clathrin-coated non-caveolar endocytic vesicles [
63] and a redistribution of γ-secretase between caveolar and non-caveolar membranes may stimulate Aβ formation against the background of a decrease in caveolin-1 levels that is observed at the 7th day after PTS. The administration of daidzein caused an increase in the level of C-APP and Aβ and a decrease in the N-terminal fragment after PTS (
Figure 8g,h,j). Thus, the present study shows that APP is concentrated in caveolae-rich membrane regions not only in the cytoplasm but also may be in endosome membranes (caveosomes) and in TGN where caveolin-1 ensures the concentration of APP in these membrane microdomains increasing the activity of α-secretase. It remains to be determined whether caveolin-1 is part of the retromer complex or interacts with it to sort out APP from β- and γ-secretase [
79] in late endosomal compartments, resulting in decreased Aβ production. Moreover, the inactivation of γ-secretase will help to reduce the formation of Aβ peptides. However, the transport of caveolin-1 is also regulated by presenilins [
80]. PS1 deficiency can lead to a serious loss of caveolae slowing repair processes after ischemia and activating astrocytes that make blocking of the expression of presenilin-1 (rather than a decrease in γ- secretase activity) unacceptable. We showed that the decrease in the level of caveolin-1 that is caused by the administration of daidzein contributed to the activation of astrocytes and the development of astrogliosis in the long term. A study of Cav-1 knockout mice showed reduced neovascularization and modified astrogliosis without proper glial scar formation around the infarct core 3 days after stroke [
81]. In addition, knockout or knockdown of caveolin-1 increased blood–brain barrier (BBB) permeability and cell damage after cerebral ischemia-reperfusion by activating the NO/Cav-1/MMP signaling cascade [
82].
The shift of APP processing towards the amyloidogenic pathway and the formation of Aβ, as well as full-length APP, can be a link between cardiovascular and neurodegenerative diseases [
83,
84]. The accumulation of full-sized APP in the mitochondria of brain cells, as well as cells of peripheral tissues, causes mitochondrial dysfunction and impairs energy metabolism [
83]. APP is involved in the activation of endothelial cells and increases the expression of pro-inflammatory proteins, cyclooxygenase-2, and vascular cell adhesion molecule-1, as well as the cytokine IL-1β [
85]. The accumulation of Aβ in the blood, vascular walls, and heart causes endothelial activation, inflammation and tissue damage, and impaired glucose metabolism, which contributes to the development of atherosclerosis and the formation of blood clots, chronic inflammation, and diabetes mellitus [
83,
84]. APP and its processing products are the link between aging and cardiovascular disease, and possibly vice versa. On the one hand, a violation of the blood–brain barrier during a stroke can cause an increase in APP and Aβ in the blood and their accumulation in the tissues of peripheral organs, disrupting metabolism. On the other hand, an increase in the level of Aβ in the brain after a stroke and its toxicity to endotheliocytes causes the development of inflammation, disruption of endothelial repair processes, cytokine-induced damage to BBB component cells, alteration of leukocyte–endothelial interactions, and the development of neurodegeneration. In this regard, in the future it will be interesting to study the balance of markers of BBB permeability impairment (neuron-specific enolase (NSE), GFAP, α-glycoprotein, etc.), inflammation markers in the peripheral blood after a stroke and their correlation with the level of APP and Aβ in the brain and blood in the recovery period.
Thus, inhibitory analysis showed that the decrease in ADAM10 expression in neurons and the increase in the expression of PS1 γ-secretase complex nicastrin against the background of the decrease in caveolin-1 in astrocytes promote a shift in APP processing towards the amyloidogenic pathway, which would lead to neuronal death and the development of astrogliosis and inflammation in the early recovery period after PTS. DAPT may be considered as a potential drug for stroke treatment. However, DAPT and LY2886721 inhibited the γ-secretase complex containing PS1 rather than the γ-secretase complex with PS2 in humans (in contrast to the results obtained in mice) [
86]. The potential side effects caused by blocking Notch signaling must be considered [
87].


 ,
, 


