Communication

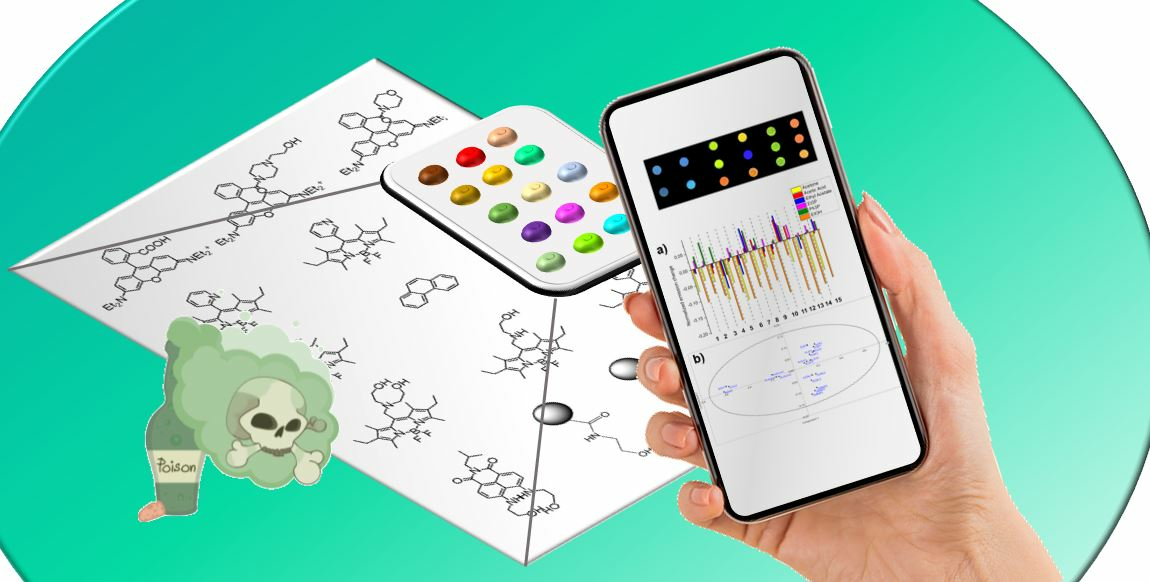
Detection of a Nerve Agent Simulant by a Fluorescent Sensor Array

by
Rossella Santonocito
1,
Mario Spina
1,
Roberta Puglisi
1,
Andrea Pappalardo
1,2,
Nunzio Tuccitto
1,3 and
Giuseppe Trusso Sfrazzetto
1,2,*
1
Department of Chemical Sciences, University of Catania, Viale Andrea Doria 6, 95125 Catania, Italy
2
National Interuniversity Consortium for Materials Science and Technology (I.N.S.T.M.) Research Unit of Catania, 95125 Catania, Italy
3
Laboratory for Molecular Surfaces and Nanotechnology (LAMSUN), Department of Chemical Sciences, University of Catania and CSGI, Viale Andrea Doria 6, 95125 Catania, Italy
*
Author to whom correspondence should be addressed.
Chemosensors 2023, 11(9), 503; https://doi.org/10.3390/chemosensors11090503
Submission received: 31 July 2023 / Revised: 5 September 2023 / Accepted: 13 September 2023 / Published: 15 September 2023

Abstract

:
Detection of nerve agents (NAs) gas in the environment through portable devices to protect people in case of emergencies still remains a challenge for scientists involved in this research field. Current detection strategies require the use of cumbersome, expensive equipment that is only accessible to specialized personnel. By contrast, emerging optical detection is one of the most promising strategies for the development of reliable, easy readout devices. However, the selectivity of the existing optical sensors needs to be improved. To overcome the lack of selectivity, the innovative strategy of the optical arrays is under evaluation due to the specific response, the ease of preparation, the portability of the equipment, and the possibility to use affordable detectors, such as smartphones, that are easily accessible to non-specialized operators. In this work, the first optical-based sensor array for the selective detection of gaseous dimethylmethylphosphonate (DMMP), a NAs simulant, is reported, employing a simple smartphone as a detector and obtaining remarkably efficient and selective detection.

Graphical Abstract

1. Introduction

The real-time detection of hazardous gases in the environment using easy-handling, reliable systems still represents a challenging target that has recently attracted many scientific interests. Special attention is focused on the detection of toxic gases. Among these, nerve agents (NAs) are still used to harm people during conflicts and terrorist attacks, as demonstrated by recent international events [1,2]. The most common compounds used for this purpose are organic esters of phosphoric acid, also known as organophosphates (OP), namely the G-type (Sarin, Soman), V-type (VX), and the latest developed A-type (also known as Novichok) (see Figure 1) [3]. Despite the fact that the production, stockpile, and use of these agents are strictly forbidden, they are still used to harm civilians during conflicts, representing a threat to human safety. Due to the high toxicity of NAs, reliable model compounds, also called simulants, are widely employed for research purposes. This class of less toxic organophosphates mimics the structure and properties of the real NAs. In particular, dimethylmethylphosphonate (DMMP) has been demonstrated to be one of the best simulants of G-type nerve agents (Figure 1) [4].
The detection of nerve agents is efficiently performed by means of instrumental techniques, including GC-MS and HPLC, reaching high sensitivity and selectivity. However, the time-consuming sample preparation precludes real-time detection in the field. In addition, only specialized operators have access to such expensive and technologically advanced equipment. To overcome these limitations, many efforts have been oriented toward the development of portable, easy readout and affordable devices for the real-time sensing of OP gas, accessible to everyone [5,6,7]. Detection of NAs using molecular probes has been demonstrated to be a powerful approach [8,9,10,11,12]. In particular, the use of optical (colorimetric and fluorescent) receptors seems to be the most convenient detection technique due to the high sensitivity achievable, the low cost of the equipment, the easy readout, and the fast response [13,14,15,16,17,18,19,20,21,22,23,24,25,26,27]. To meet the need for easy accessibility, an intriguing recent strategy involves the use of widely diffused tools, such as smartphones and digital cameras, as detectors. In this context, only a few examples of portable optical devices based on a smartphone as a detector can be found in the literature that are able to efficiently detect NAs gas [28,29,30,31].
One of the main problems related to sensing, and in particular the sensing of hazardous compounds, is the need for selectivity in order to avoid false-positive responses. Recently, this problem has been bypassed by array technology, a device containing different “receptors” able to interact with different affinity with the target analyte. Considering the whole response of these receptors and exploiting multivariate statistical analysis, a characteristic fingerprint of the desired analyte can be measured, obtaining excellent levels of selectivity [32,33,34,35,36].
In addition, optical-based array sensors can reveal and discriminate many chemical compounds. These systems work in a similar way to the mammalian olfactory system, leading to a complex response due to all probes being unique for a single analyte. An optical array comprises many optical/fluorescent organic receptors, which show different affinity for the target analyte. The array technology is based on the non-specific interaction of multiple organic receptors with the selected analyte [37]. To the best of our knowledge, no example of NA detection by an array device has been reported in the literature.
In this work, we present the first fluorescent-based array for the selective detection of DMMP gas. The synthesis of different chemiresponsive fluorescent receptors was performed, with each one able to give a typical change in the emission intensity after the non-covalent interaction with DMMP in solution and in the gas phase. To this purpose, specifically functionalized Bodipys (MBP, OBP, OBEP, BDPy-Di-AE, BDPy-AE, PBP, MBEP, PBEP), Rhodamine (RhBP, RhBM), Naphthylamide (Napht-1) fluorescent scaffolds, and properly modified Carbon Dots (CDs-C2-OH, CDs-C3-OH e CDs-C4-OH) (see Figure 2) were synthesized and dropped onto a solid support, obtaining the array device able to selectively detect DMMP vapors in ppm/sub-ppm. Selectivity was confirmed by PCA analysis, obtaining detection limits lower than the toxicity levels of NAs.
Previously, we used the array technology to detect trinitrotoluene (TNT) [34] and plant pathogenic fungi [37]. The array used for the TNT detection was limited to seven different fluorescent probes, which do not guarantee the sufficient selectivity required for the Nas detection. While, in the case of fungi detection, we realized an array with 17 fluorescent molecular probes. In the present work, we realize an array device containing 15 different fluorescent probes, also including properly functionalized carbon nanoparticles, considering the high detection efficiency of these nanosystems towards DMMP [38].

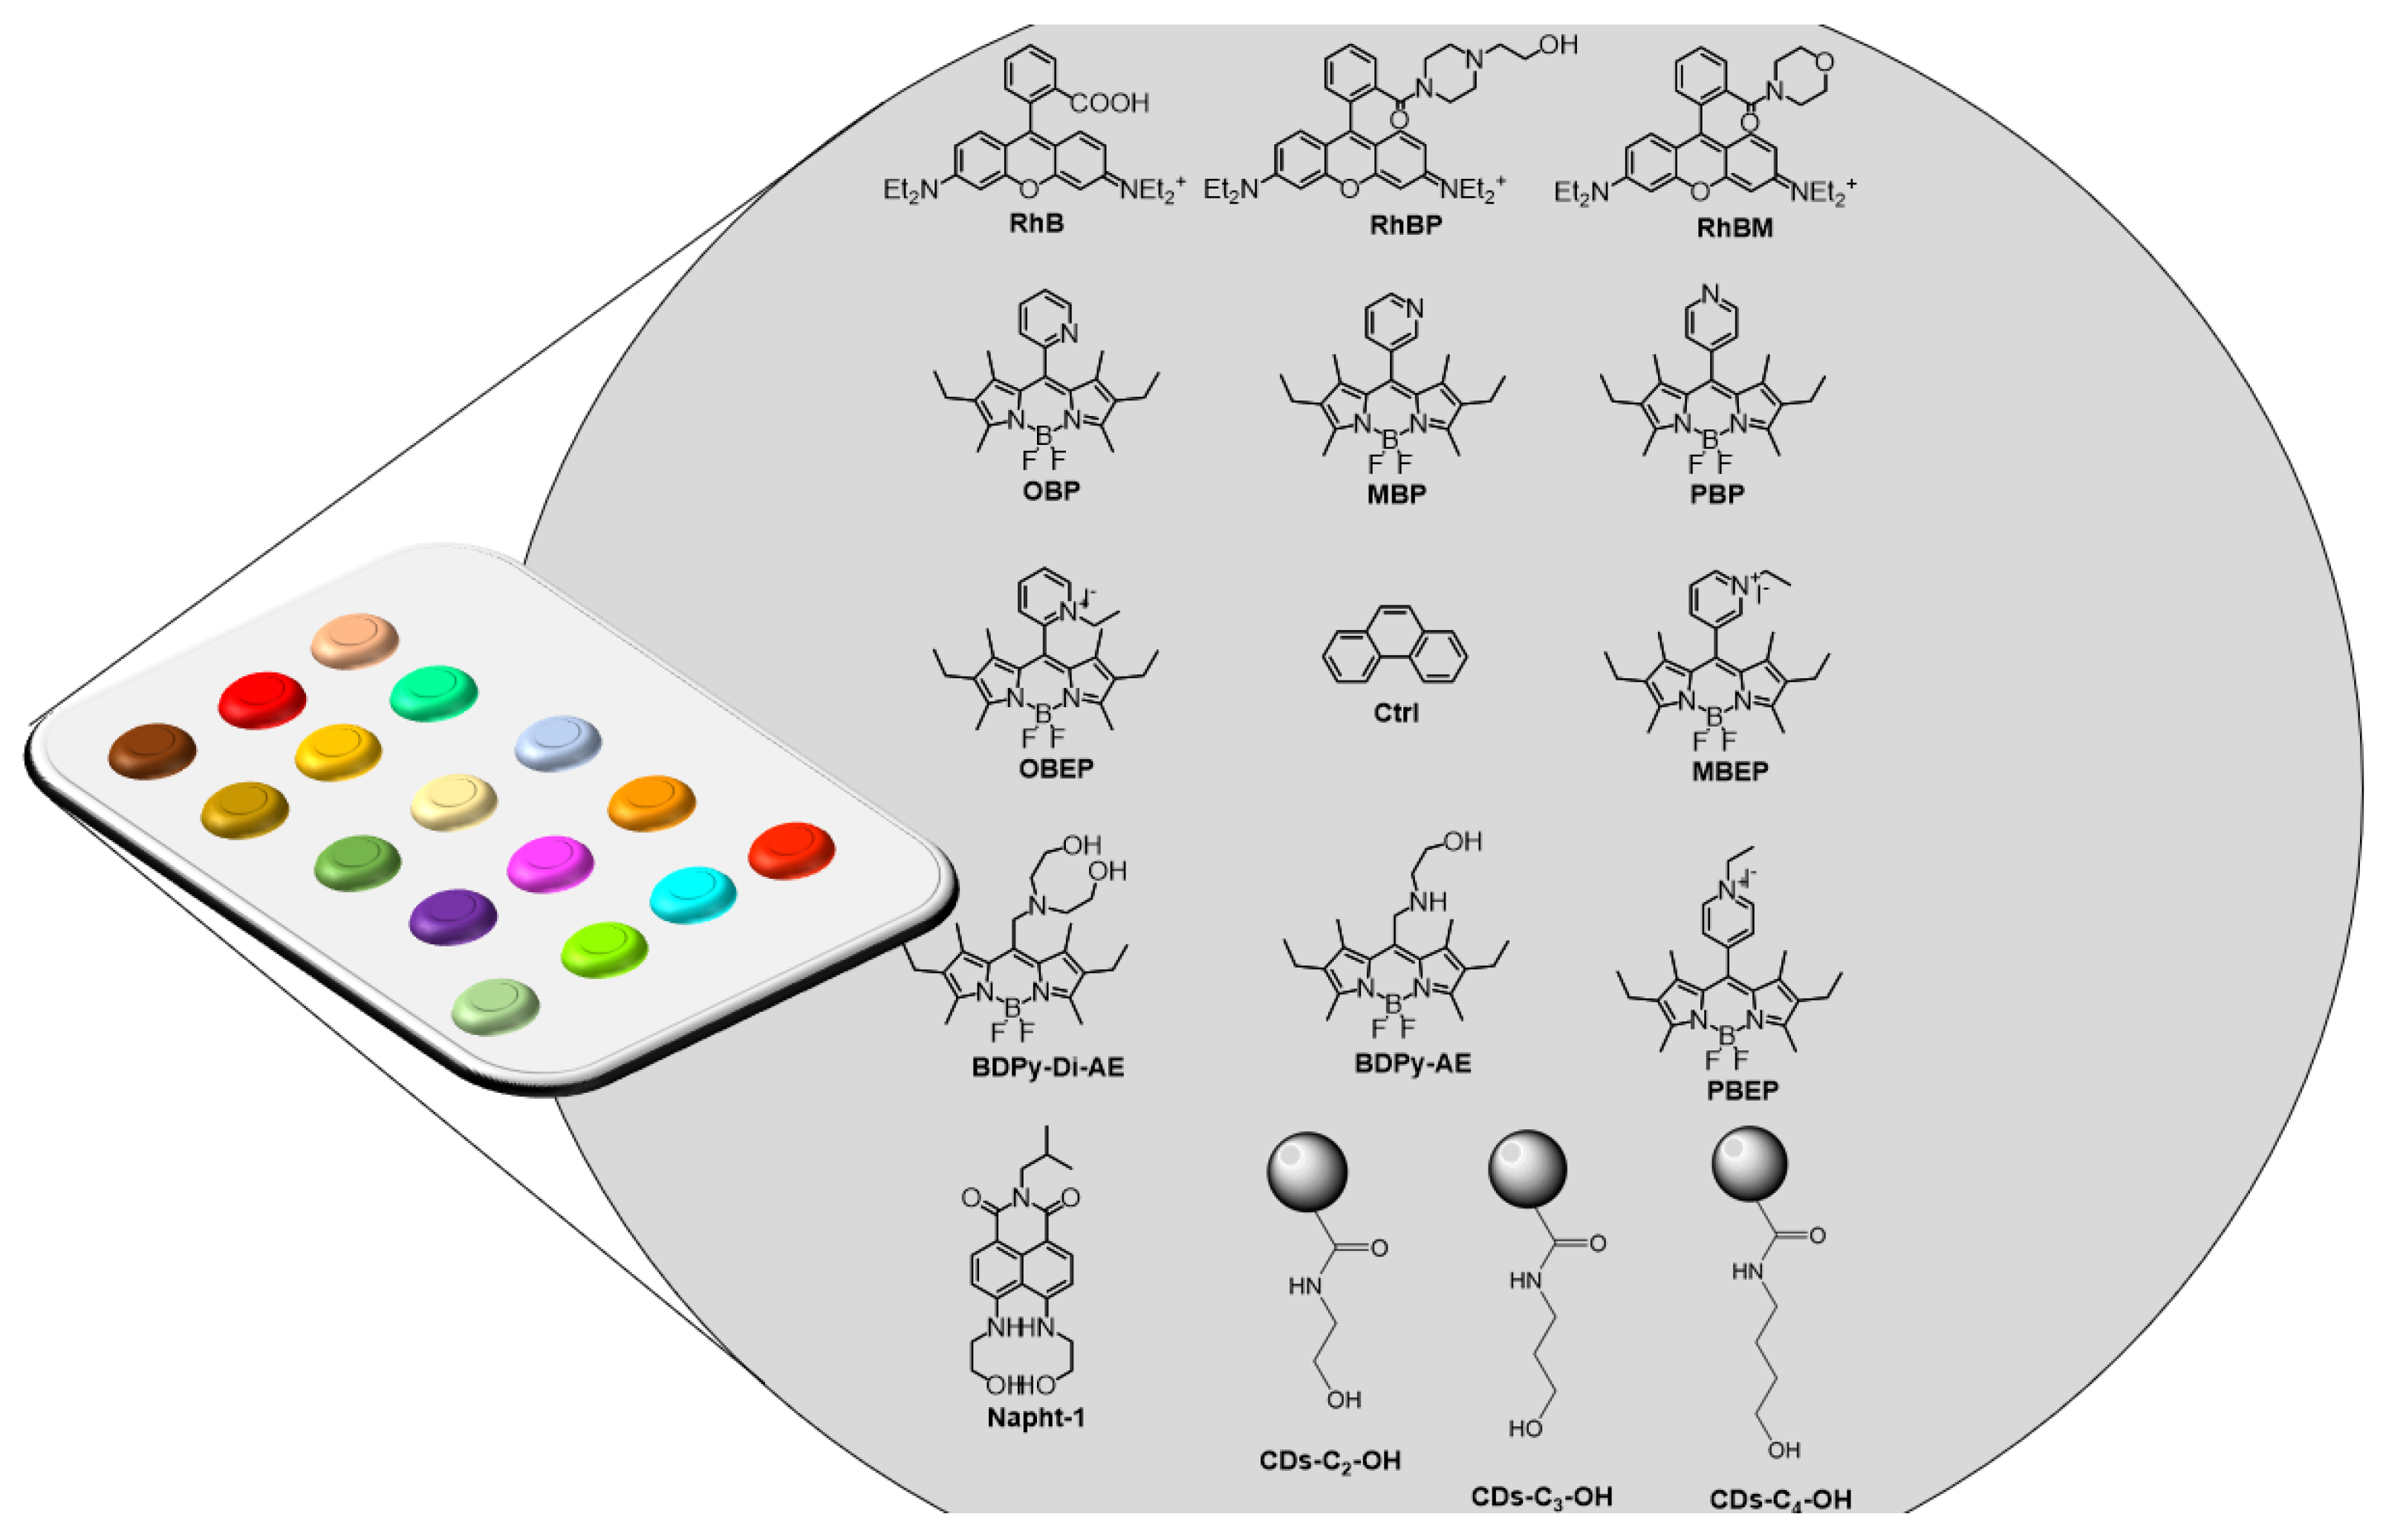
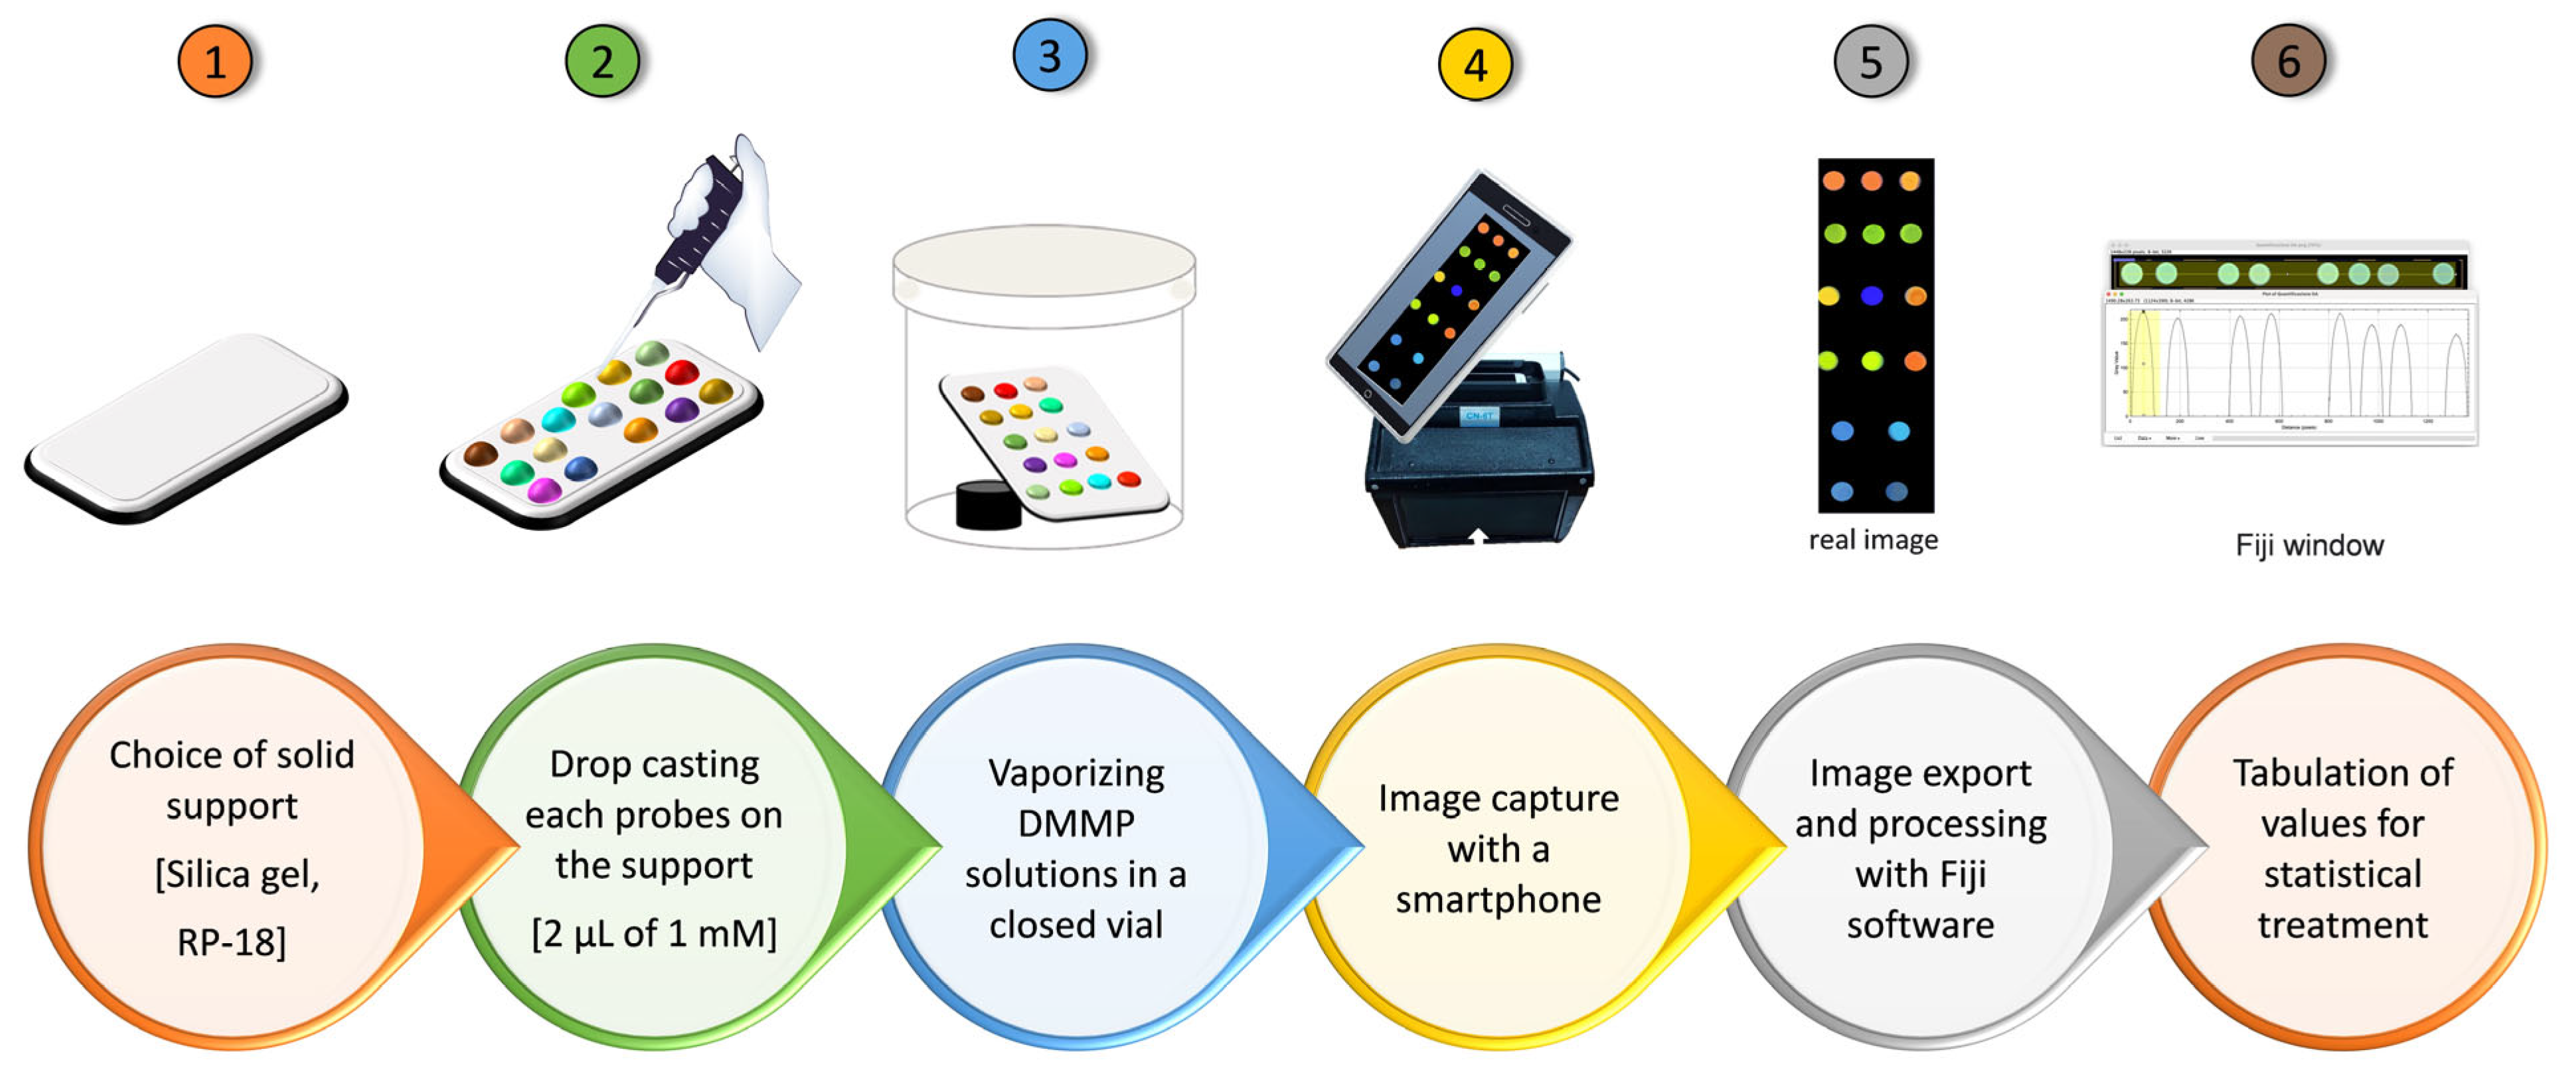
2. Materials and Methods

General Experimental Methods: The NMR experiments were carried out at 27 °C on a Varian UNITY Inova 500 MHz spectrometer (International Equipment Trading Ltd., Mundelein, IL, USA) (1H at 499.88 MHz, 13C NMR at 125.7 MHz) equipped with a pulse field gradient module (Z axis) and a tunable 5 mm Varian inverse detection probe (ID-PFG). ESI mass spectra were acquired on an API 2000- ABSciex using CH3CN or CH3OH (positive or negative ion mode).
Procedure for sensing by array: experimental setup. The power of the UV-Vis lamp selected was 6 W, and the excitation wavelength used was 365 nm. The array device was placed in the dark chamber, and its position can be modified thanks to the presence of the control probe. Indeed, any difference in light irradiation is normalized to the control. The UV source and the smartphone were placed 20 cm away from the array plate. The array device was obtained by dropping 2 μL of each fluorescent probe (1 × 10⁻³ M in CHCl3) and 2 μL of the phenanthrene (control, 1 M in CHCl3) in different positions onto rectangular 5 × 3 cm RP18 silica gel foils. The array plate was then irradiated through an UV lamp (λ 365 nm) in the dark chamber, and the image of the emission was acquired using a smartphone (iPhone 13, 24 Mpixel). Then, the array was introduced in a closed container (580 cc) containing a precise amount of DMMP. These vials were heated (by an oven) at 50 °C for 1 h to totally evaporate the DMMP. The amounts in ppm of DMMP have been calculated considering the partial pressure of DMMP at 50 °C [39]. After this time, the image has been acquired and elaborated with Fiji. In details, this software transforms the image from the RGB value to grayscale by the formula G = (Rvalue + Gvalue + Bvalue)/3. The grayscale values are normalized to the control (phenanthrene). The statistical treatment was performed by Excel (Microsoft 365). Multivariate quantification was performed by means of the PLS tool of SIMCA-P 11 (Umetrics). The dataset was centered and unity scaled.
Synthesis of probes: RhB has been acquired by Merck. RhBP, RhBM [40], OBP, MBP, PBP, OBEP, MBEP, PBEP [41], Napht-1 [42], BDPy-Di-AE and BDPy-AE [43], and CDs [38] have been synthesized following a modified synthetic procedure and are detailed in Supplementary Materials.

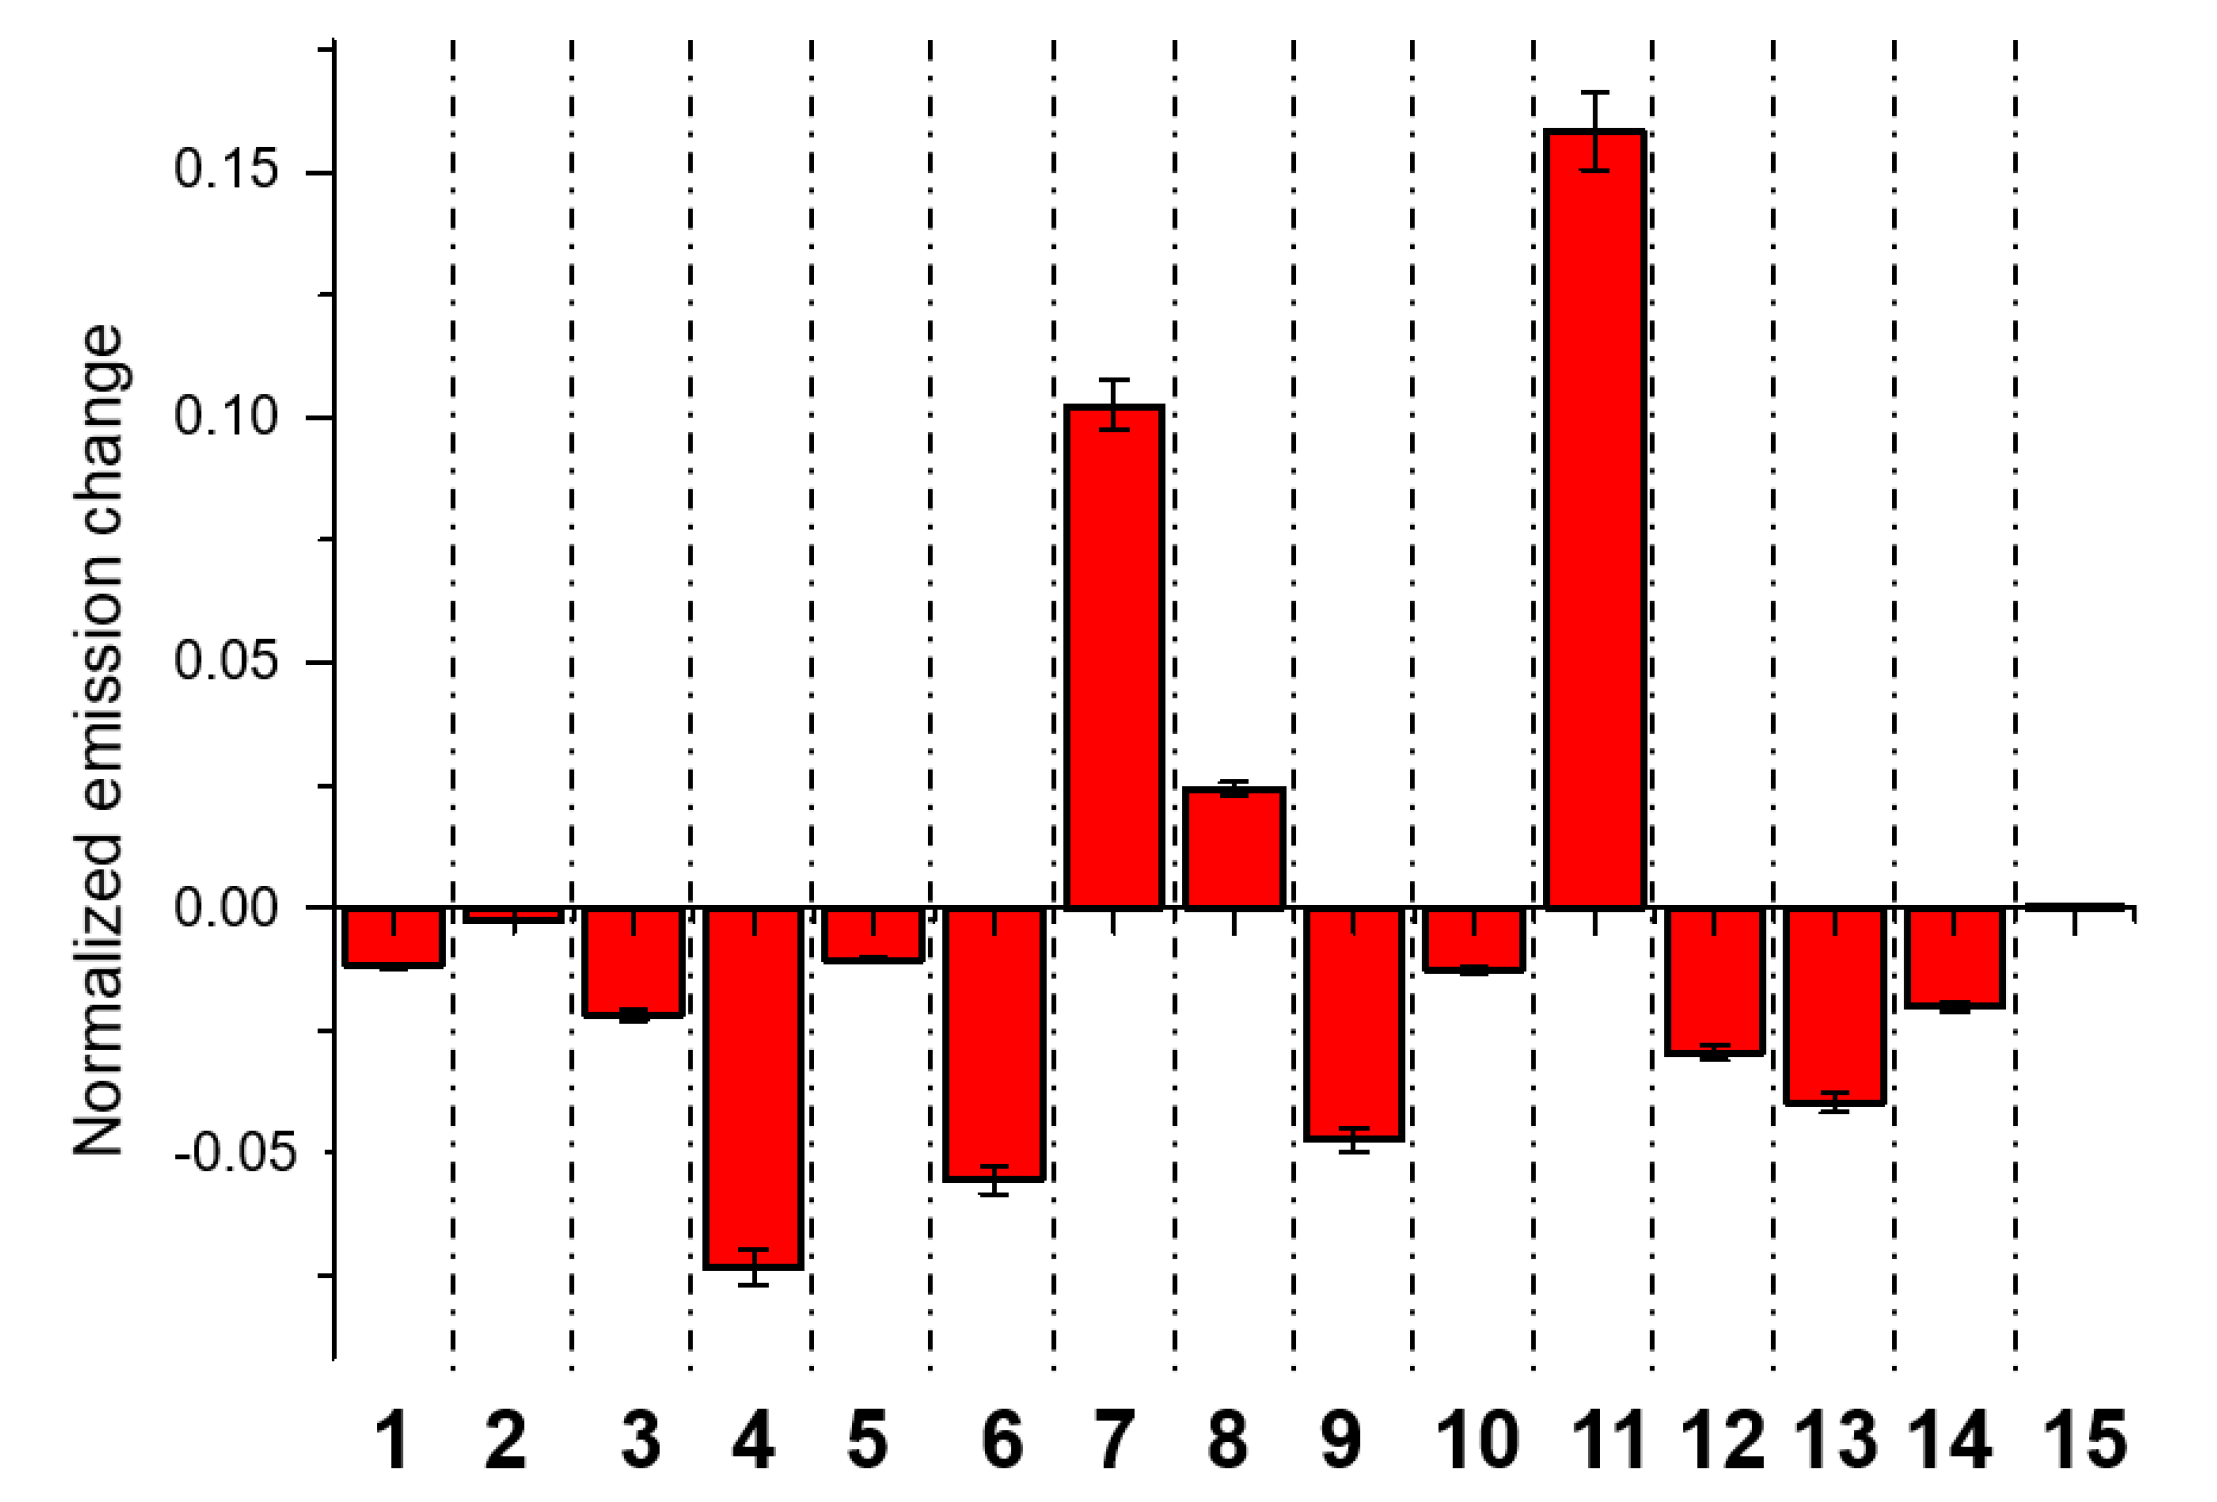
3. Results and Discussion

We based our array device on four different classes of organic fluorophores, in particular rhodamines, Bodipy’s, naphthylamides, and carbon dots (CDs), properly functionalized with functional groups able to interact through non-covalent interactions with DMMP. These probes were selected to cover a wide range of emission: 400–700 nm with rhodamines, 500–700 nm with Bodipy’s, 400–600 nm with naphthylamides, and 350–500 nm with carbon dots. Furthermore, the probes in the array will interact with DMMP through non-covalent interactions, such as hydrogen bonds, ion–dipole interactions, and π–π interactions.
The commercially available Rhodamine-B (RhB) was treated with 2-hydroxypiperazione or morpholine in the presence of HBTU (O-(Benzotriazol-1-yl)-N,N,N′,N′-tetramethyluronium hexafluorophosphate) as coupling reagent, thus obtaining RHBP or RhBM, respectively (Scheme 1, see Supplementary Materials for the details).
Bodipy’s probes have been synthesized following the pathway reported in Scheme 2. In particular, PBP, MBP, and OBP have been synthesized by the reaction of 3,5-dimethyl-4-ethyl pyrrole with the appropriate pyridine-carboxy aldehyde in the presence of triethylamine and boron trifluoride. PBEP, MBEP, and OBEP were obtained after the reaction of PBP, MBP, and OBP with an excess of ethyl iodide. The reaction of 3,5-dimethyl-4-ethyl pyrrole with chloroacethyl chloride leads to BDPy-Cl, which, in the presence of an excess of ethanolamine or diethanolamine, can be converted into BDPy-AE or BDPy-Di-AE, respectively (see Supplementary Materials for the details).
Napht-1 was synthesized following a modified procedure [32]. In particular, anhydride-Br-NO2-naphthoic was converted into isobuthyl-Br-NO2-naphthalimide by reaction in the presence of a slight excess of isobuthylamine. Then, the reaction of this imide with a large excess of ethanolamine leads to Napht-1 with a good yield (see Scheme 3 and Supplementary Materials for the details).
Carbon dots (CDs) functionalized with alcoholic groups were obtained following the pathway reported in Scheme 3. In particular, the reaction of native CDs with an excess of pentafluoro phenol in solvolysis leads to CDs-Pf covered by pentafluoro phenol, which, in the presence of the appropriate amino-alcohol, is converted into CDs-C2-OH, CDs-C3-OH, and CDs-C4-OH, respectively (see Scheme 3 and Supplementary Materials for the details). All compounds and CDs have been fully characterized (see Supplementary Materials).
An array device was prepared following the scheme represented in Figure 3. The solid support selected for this purpose is reverse-phase silica gel (RP-18), to avoid interaction between the solid phase and probes as well as the DMMP. Then, 2 μL of the 1 mM chloroform solution of each probe was dropped onto the solid support, and the solvent was removed by evaporation at room temperature. An image with the smartphone has been acquired before and after the exposition to DMMP vapors. In particular, a precise amount of DMMP was inserted into a closed vial together with the array device. The vial has been kept at 50 °C for 1 h, allowing the total evaporation of DMMP. After this time, a new image has been acquired and elaborated with Fiji [44]. A typical example of setup analysis is reported in Figure S14 of the Supplementary Materials. This software converts the images into RGB channel values, which are then converted to the gray channel (G) by using the formula G = (Rvalue + Gvalue + Bvalue)/3, thus obtaining a single value for each pixel. The emission intensities of this G scale for each probe have been compared to phenanthrene (Ctrl in Figure 1), and these normalized values (ratio between the intensity of each probe and the intensity of the control) have been tabulated for statistical treatment using the Excel software (Microsoft 365 ProPlus).
Figure 4 shows the normalized response of each probe to 100 ppm of DMMP. In particular, MBEP and PBEP show an increasing emission in the presence of the analyte, while the other probes decrease their emission. Selectivity is a crucial parameter for a real sensing device. To validate the efficacy of the array technology, we tested the response of the array to other organic molecules commonly present in the air (i.e., acetone, ethanol, acetic acid, ethyl acetate, ammonia, and triethylamine), chlorinated organic solvents (i.e., chloroform and tetrachloroethane TCE), and other phosphorous-based compounds (i.e., triethylphosphine and triphenylphosphine). In particular, Figure 5a shows the response of each probe to 100 ppm of these analytes. As we can see, each probe shows a different response to the different compound, supporting the good selectivity for DMMP, which is also confirmed by the PCA analysis reported in Figure 5b. Good clustering and discrimination can be observed with all the selected analytes. Plots also reveal that the outliers representing observations are inside the Hotelling T2 ellipses at 95% confidence.
Then, we tested the array’s response to different concentrations of DMMP vapors. In particular, Figure 6 shows the change in emission of the probes at different ppm of DMMP. We note that a sort of linear response can be detected for Bodipy’s receptors, PBP, OBP, OBEP, BDPy-Di-AE, and PBEP. Furthermore, we observed that cationic Bodipy’s (MBEP and PBEP) show an increase in emission in the presence of DMMP, while non-charged probes (PBP, OBP, and BDPy-Di-AE) undergo a quenching of emission. Figure 6b shows the responses of these probes to the progressive amounts of DMMP. In particular, each probe changes its emission with different behavior, suggesting that a quantitative analysis is difficult to perform. Notably, the array can detect 0.1 ppm of DMMP, which is lower than the LD50 values of G- and V-type NAs [3].
To verify the capabilities of the method in quantitative respects, we applied multivariate Partial Least Squares (PLS) regression. PLS is a multivariate statistical technique used for regression and dimensionality reduction, particularly in cases where a high-dimensional dataset is collected and it is required to establish a relationship between predictors (independent variables) and a response (dependent variable). Figure 7 reports the results. The model used 5 principal components, accounting for a cumulative Q2 value of around 0.8 as evaluated by the cross-validation procedure. Results revealed good linear multivariate regression quantification from 5 to 100 ppm. At lower concentrations, the analyte is detectable but barely quantifiable. The red line represents the linear fit, and the green line represents the ideal linear relationship. The extreme closeness and similarity of the two curves confirm a very good quantification capability above 5 ppm, close to the LD50 values of G- and V-type NAs [3].
A few examples of NAs sensors exploiting a smartphone as a detector have been reported. Sulfur mustard and phosgene have been detected by using a fluorescent sensor, obtaining a turn-on response after the covalent reaction between sensor and analytes and a limit of detection in solution of 14 and 70 ppb, respectively [45]. Similarly, diisopropyl fluorophosphates (DFP) have been detected by colorimetric change by a covalent reaction with the sensor, obtaining a limit of detection of 0.17 ppm in the solid state [31]. Our research group realized a fluorescent reusable sensor for DMMP with a limit of detection of 535 ppm on solid state [28]. In the present work, we obtained a lower detection limit on solid state (0.1 ppm), supporting the selectivity with a wider range of different analytes.
A real-life detection of NAs by using this sensor can be performed by simple exposure of the array to air contaminated by a nerve agent. In particular, due to the higher volatility of NAs with respect to DMMP (e.g., the volatility of Soman and DMMP is 22,000 mg/m3 and 5562 mg/m3, respectively) [39], the array will detect NA gases instantaneously, and by exploiting a camera or a smartphone, a real-time analysis can be obtained. This system can be used by militaries or adopted by sensitive targets, such as stations or airports.

4. Conclusions

In summary, the first example of an optical array device able to detect efficiently (0.1 ppm) DMMP gas (a simulant of NAs G-Type) and with selectivity by exploiting a simple smartphone as a detector has been reported. This array has been prepared by dropping organic fluorescent probes based on Bodipy’s, Rhodamine, Naphthylamide, and carbon dots onto reverse-phase silica gel (RP18). This device shows good selectivity, also confirmed by multivariate analysis, for DMMP with respect to other common solvents and phosphorous-based organic molecules. Furthermore, the possibility of detecting sub-ppm levels of DMMP was demonstrated, establishing an emission trend for some of the Bodipy’s probes. The use of a smartphone, easily connected to the internet, also leads to the possibility of sending data to a remote control station, thus elaborating on the results in real time. Further studies are being conducted to perform quantitative analyses, improve the elaboration of images by an application for the smartphone, and recover the device. At this stage of the work, the quantitative analysis needs to be improved. However, we believe that, in the case of the presence of nerve agent, a quantitative analysis is secondary to the qualitative detection of the NA. In fact, the crucial problem is whether the NA is present or not in the environment in order to sound the alarm. Furthermore, we tried to recover the array by exposing the device to thermal cycles or solvent washing. These preliminary tests show a progressive degradation of the solid support. The possibility of using other polymeric materials is under evaluation.

Supplementary Materials

The following supporting information can be downloaded at: https://www.mdpi.com/article/10.3390/chemosensors11090503/s1, synthesis and characterization of probes, detailed procedure for the array preparation and sensing. Figure S1. 1H NMR spectrum of RhBP in CDCl3; Figure S2. 1H NMR spectrum of RhBM in CDCl3; Figure S3. 1H NMR spectrum of PBP in CDCl3; Figure S4. 1H NMR spectrum of MBP in CDCl3; Figure S5. 1H NMR spectrum of OBP in CDCl3; Figure S6. 1H NMR spectrum of PBEP in CDCl3; Figure S7. 1H NMR spectrum of MBEP in CDCl3; Figure S8. 1H NMR spectrum of OBEP in CDCl3; Figure S9. 1H NMR spectrum of isobuthyl-Br-NO2-naphthalimide in CDCl3; Figure S10. 1H NMR spectrum of Napht-1 in acetone-d6; Figure S11. 1H NMR spectrum of BDPy-CH2Cl in CDCl3; Figure S12. 1H NMR spectrum of BDPy-AE in CDCl3; Figure S13. 1H NMR spectrum of BDPy-Di-AE in CDCl3; Figure S14. Representation of analysis setup.

Author Contributions

Methodology, N.T., R.S., R.P. and M.S.; validation, R.P. and A.P.; formal analysis, N.T., M.S., A.P. and R.S.; data curation, N.T. and M.S.; writing—original draft preparation, G.T.S.; funding acquisition, G.T.S. and A.P. All authors have read and agreed to the published version of the manuscript.

Funding

This work has been partially funded by the European Union (NextGeneration EU) through the MUR-PNRR project SAMOTHRACE (ECS00000022).

Institutional Review Board Statement

Not applicable.

Informed Consent Statement

Not applicable.

Data Availability Statement

Probes and original data can be obtained from the authors after a formal request.

Acknowledgments

The authors thank the University of Catania.

Conflicts of Interest

The authors declare no conflict of interest.

References

  1. Stone, R. U.K. attack puts nerve agent in the spotlight. Science 2018, 359, 1314–1315. [Google Scholar] [CrossRef]
  2. Stone, R. How to defeat a nerve agent. Science 2018, 359, 23. [Google Scholar] [CrossRef]
  3. Costanzi, S.; Machado, J.-H.; Mitchell, M. Nerve Agents: What They Are, How They Work, How to Counter Them. ACS Chem. Neurosci. 2018, 9, 873–885. [Google Scholar] [CrossRef]
  4. Ellaby, R.J.; Clark, E.R.; Allen, N.; Taylor, F.R.; Ng, K.K.L.; Dimitrovski, M.; Chu, D.F.; Mulvihill, D.P.; Hiscock, J.R. Identification of organophosphorus simulants for the development of next-generation detection technologies. Org. Biomol. Chem. 2021, 19, 2008–2014. [Google Scholar] [CrossRef]
  5. Kumar, V.; Kim, H.; Pandey, B.; James, T.D.; Yoon, J.; Anslyn, E.V. Recent advances in fluorescent and colorimetric chemosensors for the detection of chemical warfare agents: A legacy of the 21st century. Chem. Soc. Rev. 2023, 52, 663–704. [Google Scholar] [CrossRef]
  6. Diauudin, F.N.; Rashid, J.I.A.; Knight, V.F.; Yunus, W.M.Z.Y.; Ong, K.K.; Kasim, N.A.M.; Halim, N.A.; Noor, S.A.M. A review of current advances in the detection of organophosphorus chemical warfare agents based biosensor approaches. Sens. Bio-Sens. Res. 2019, 26, 100305. [Google Scholar] [CrossRef]
  7. Meng, W.Q.; Sedgwick, A.C.; Kwon, N.; Sun, M.; Xiao, K.; He, X.P.; Anslyn, E.V.; James, T.D.; Yoon, J. Fluorescent probes for the detection of chemical warfare agents. Chem. Soc. Rev. 2023, 52, 601–662. [Google Scholar] [CrossRef]
  8. Jang, Y.J.; Kim, K.; Tsay, O.G.; Atwood, D.A.; Churchill, D.G. Update 1 of: Destruction and Detection of Chemical Warfare Agents. Chem. Rev. 2015, 115, PR1–PR76. [Google Scholar] [CrossRef]
  9. Gulino, A.; Trusso Sfrazzetto, G.; Millesi, S.; Pappalardo, A.; Tomaselli, G.A.; Ballistreri, F.P.; Toscano, R.M.; Fragalà, L. Nerve Gas Simulant Sensing by an Uranyl-Salen Monolayer Covalently Anchored on Quartz Substrates. Chem. Eur. J. 2017, 23, 1576–1583. [Google Scholar]
  10. Puglisi, R.; Pappalardo, A.; Gulino, A.; Trusso Sfrazzetto, G. Supramolecular recognition of CWAs simulant by metal-salen complexes: The first multi-topic approach. Chem. Commun. 2018, 54, 11156–11159. [Google Scholar] [CrossRef]
  11. Legnani, L.; Puglisi, R.; Pappalardo, A.; Chiacchio, M.A.; Trusso Sfrazzetto, G. Supramolecular recognition of phosphocholine by an enzyme-like cavitand receptor. Chem. Commun. 2020, 56, 539–542. [Google Scholar] [CrossRef] [PubMed]
  12. Zhou, X.; Lee, S.; Xu, Z.; Yoon, J. Recent progress on the development of chemosensors for gases. Chem. Rev. 2015, 115, 7944–8000. [Google Scholar] [CrossRef] [PubMed]
  13. Chen, L.; Wu, D.; Yoon, J. Recent Advances in the Development of Chromophore-Based Chemosensors for Nerve Agents and Phosgene. ACS Sens. 2018, 3, 27–43. [Google Scholar] [CrossRef]
  14. Cai, Y.-C.; Li, C.; Song, Q.-H. Fluorescent Chemosensors with Varying Degrees of Intramolecular Charge Transfer for Detection of a Nerve Agent Mimic in Solutions and in Vapor. ACS Sens. 2017, 2, 834–841. [Google Scholar] [CrossRef] [PubMed]
  15. Sun, X.; Dahlhauser, S.-D.; Anslyn, E.-V. New Autoinductive Cascade for the Optical Sensing of Fluoride: Application in the Detection of Phosphoryl Fluoride Nerve Agents. J. Am. Chem. Soc. 2017, 139, 4635–4638. [Google Scholar] [CrossRef] [PubMed]
  16. Liu, Y.; Bonizzoni, M. A Supramolecular Sensing Array for Qualitative and Quantitative Analysis of Organophosphates in Water. J. Am. Chem. Soc. 2014, 136, 14223–14229. [Google Scholar] [CrossRef]
  17. Dennison, G.H.; Bochet, C.G.; Curty, C.; Ducry, J.; Nielsen, D.J.; Sambrook, M.R.; Zaugg, A.; Johnston, M.R. Supramolecular Agent–Simulant Correlations for the Luminescence Based Detection of V-Series Chemical Warfare Agents with Trivalent Lanthanide Complexes. Eur. J. Inorg. Chem. 2016, 2016, 1348–1358. [Google Scholar] [CrossRef]
  18. Butala, R.R.; Creasy, W.R.; Fry, R.A.; McKee, M.L.; Atwood, D.A. Lewis acid-assisted detection of nerve agents in water. Chem. Commun. 2015, 51, 9269–9271. [Google Scholar] [CrossRef]
  19. Esipenko, N.A.; Koutnik, P.; Minami, T.; Mosca, L.; Lynch, V.M.; Zyryanov, G.V.; Anzenbacher, P., Jr. First supramolecular sensors for phosphonate anions. Chem. Sci. 2013, 4, 3617–3623. [Google Scholar] [CrossRef]
  20. Kumar, V.; Rana, H.; Raviraju, G.; Gupta, A.K. Chemodosimeter for Selective and Sensitive Chromogenic and Fluorogenic Detection of Mustard Gas for Real Time Analysis. Anal. Chem. 2018, 90, 1417–1422. [Google Scholar] [CrossRef]
  21. Kumar, V.; Rana, H.; Raviraju, G.; Garg, P.; Baghel, A.; Gupta, A.K. Chromogenic and fluorogenic multianalyte detection with a tuned receptor: Refining selectivity for toxic anions and nerve agents. RSC Adv. 2016, 6, 59648–59656. [Google Scholar] [CrossRef]
  22. Barba-Bon, A.; Costero, A.M.; Gil, S.; Sancenon, F.; Martinez-Manez, R. Chromo-fluorogenic BODIPY-complexes for selective detection of V-type nerve agent surrogates. Chem. Commun. 2014, 50, 13289–13291. [Google Scholar] [CrossRef] [PubMed]
  23. Fan, S.; Zhang, G.; Dennison, G.H.; FitzGerald, N.; Burn, P.L.; Gentle, I.R.; Shaw, P.E. Challenges in Fluorescence Detection of Chemical Warfare Agent Vapors Using Solid-State Films. Adv. Mater. 2019, 32, 1905785. [Google Scholar] [CrossRef] [PubMed]
  24. Zheng, P.; Cui, Z.; Liu, H.; Cao, W.; Li, F.; Zhang, M. Ultrafast-response, highly-sensitive and recyclable colorimetric/fluo-rometric dual-channel chemical warfare agent probes. J. Hazard. Mater. 2021, 415, 125619. [Google Scholar] [CrossRef]
  25. Mahato, M.; Ahamed, S.; Tohora, N.; Sultana, T.; Ghanta, S.; Das, S.K. A Coumarin derived ratiomteric and turn on chemosensor for rapid detection of sarin surrogate. Microchem. J. 2023, 185, 108240. [Google Scholar] [CrossRef]
  26. Dagnaw, F.W.; Feng, W.; Song, Q.-H. Selective and rapid detection of nerve agent simulants by polymer fibers with a fluorescent chemosensor in gas phase. Sens. Actuators B Chem. 2020, 318, 127937. [Google Scholar] [CrossRef]
  27. Jung, S.-H.; Jung, Y.J.; Park, B.C.; Kong, H.; Lim, B.; Park, J.M.; Lee, H. Chromophore-Free photonic multilayer films for the ultra-sensitive colorimetric detection of nerve agent mimics in the vapor phase. Sens. Actuators B Chem. 2020, 323, 128698. [Google Scholar] [CrossRef]
  28. Tuccitto, N.; Catania, G.; Pappalardo, A.; Trusso Sfrazzetto, G. Agile Detection of Chemical Warfare Agents by Machine Vision: A Supramolecular Approach. Chem. Eur. J. 2021, 27, 13715–13718. [Google Scholar] [CrossRef]
  29. Zhu, R.; Azzarelli, J.M.; Swager, T.M. Wireless Hazard Badges to Detect Nerve-Agent Simulants. Angew. Chem. Int. Ed. 2016, 55, 9662–9666. [Google Scholar] [CrossRef]
  30. Dennison, G.H.; Sambrook, M.R.; Johnston, M.R. Interactions of the G-series organophosphorus chemical warfare agent sarin and various simulants with luminescent lanthanide complexes. RSC Adv. 2014, 4, 55524–55528. [Google Scholar] [CrossRef]
  31. Sun, X.; Boulgakov, A.A.; Smith, L.N.; Metola, P.; Marcotte, E.M.; Anslyn, E.V. Photography Coupled with Self-Propagating Chemical Cascades: Differentiation and Quantitation of G- and V-Nerve Agent Mimics via Chromaticity. ACS Cent. Sci. 2018, 4, 854–861. [Google Scholar] [CrossRef] [PubMed]
  32. Motiei, L.; Margulies, D. Molecules that Generate Fingerprints: A New Class of Fluorescent Sensors for Chemical Biology, Medical Diagnosis, and Cryptography. Acc. Chem. Res. 2023, 56, 1803–1814. [Google Scholar] [CrossRef] [PubMed]
  33. Li, Z.; Askim, J.R.; Suslick, K.S. The Optoelectronic Nose: Colorimetric and Fluorometric Sensor Arrays. Chem. Rev. 2019, 119, 231–292. [Google Scholar] [CrossRef] [PubMed]
  34. Santonocito, R.; Tuccitto, N.; Cantaro, V.; Carbonaro, A.B.; Pappalardo, A.; Greco, V.; Buccilli, V.; Maida, P.; Zavattaro, D.; Sfuncia, G.; et al. Smartphone-Assisted Sensing of Trinitrotoluene by Optical Array. ACS Omega 2022, 7, 37122–37132. [Google Scholar] [CrossRef]
  35. Li, Z.; Suslick, K.S. The Optoelectronic Noise. Acc. Chem. Res. 2022, 54, 950–960. [Google Scholar] [CrossRef]
  36. Janzen, M.C.; Ponder, J.B.; Bailey, D.P.; Ingison, K.C.; Suslick, K.S. Colorimetric Sensor Arrays for Volatile Organic Compounds. Anal. Chem. 2006, 78, 3591–3600. [Google Scholar]
  37. Santonocito, R.; Parlascino, R.; Cavallaro, A.; Puglisi, R.; Pappalardo, A.; Aloi, F.; Licciardello, A.; Tuccitto, N.; Cacciola, S.O.; Trusso Sfrazzetto, G. Detection of plant pathogenic fungi by a fluorescent sensor array. Sens. Actuators B Chem. 2023, 393, 134305. [Google Scholar] [CrossRef]
  38. Tuccitto, N.; Riela, L.; Zammataro, A.; Spitaleri, L.; Li-Destri, G.; Sfuncia, G.; Nicotra, G.; Pappalardo, A.; Capizzi, G.; Trusso Sfrazzetto, G. Functionalized Carbon Nanoparticle-Based Sensors for Chemical Warfare Agents. ACS Appl. Nano Mater. 2020, 3, 8182–8191. [Google Scholar] [CrossRef]
  39. Butrow, A.B.; Buchanan, J.H.; Tevault, D.E. Vapor Pressure of Organophosphorus Nerve Agent Simulant Compounds. J. Chem. Eng. Data 2009, 54, 1876–1883. [Google Scholar] [CrossRef]
  40. Gobbo, P.; Gunawardene, P.; Luo, W.; Workentin, M.S. Synthesis of a Toolbox of Clickable Rhodamine B Derivatives. Synlett 2015, 26, 1169–1174. [Google Scholar] [CrossRef]
  41. Zhang, S.; Wu, T.; Fan, J.; Li, Z.; Jiang, N.; Wang, J.; Dou, B.; Sun, S.; Song, F.; Peng, X. A BODIPY-based fluorescent dye for mitochondria in living cells, with low cytotoxicity and high photostability. Org. Biomol. Chem. 2013, 11, 555–558. [Google Scholar] [CrossRef] [PubMed]
  42. Xu, Z.; Xiao, Y.; Qian, X.; Cui, J.; Cui, D. Ratiometric and Selective Fluorescent Sensor for CuII Based on Internal Charge Transfer (ICT). Org. Lett. 2005, 7, 889–892. [Google Scholar] [CrossRef] [PubMed]
  43. Zeng, L.; Miller, E.W.; Pralle, A.; Isacoff, E.Y.; Chang, C.J. A selective turn-on fluorescent sensor for imaging copper in living cells. J. Am. Chem. Soc. 2006, 128, 10–11. [Google Scholar] [CrossRef]
  44. Schindelin, J.; Arganda-Carreras, I.; Frise, E.; Kaynig, V.; Longair, M.; Pietzsch, T.; Preibisch, S.; Rueden, C.; Saalfeld, S.; Schmid, B.; et al. Fiji: An open-source platform for biological-image analysis. Nat. Methods 2012, 9, 676–682. [Google Scholar] [CrossRef] [PubMed]
  45. Feng, W.; Liu, X.-J.; Xue, M.-J.; Song, Q.-H. Bifunctional Fluorescent Probes for the Detection of Mustard Gas and Phosgene. Anal. Chem. 2023, 95, 1755–1763. [Google Scholar] [CrossRef]
Figure 1. Chemical structures of organophosphorous NAs and simulants used in this work.
Chemosensors 11 00503 g001
Figure 2. Representation of the array and chemical structures of the organic probes used in the device.
Chemosensors 11 00503 g002
Scheme 1. Synthesis of Rhodamine probes. Reagents and conditions: (a) morpholine, CH3CN, DIPEA, HBTU, RT, N2, yield: 80%; (b) N-(2- hydroxyethyl)piperazine, CH3CN, DIPEA, HBTU, RT, N2, yield: 84%.
Chemosensors 11 00503 sch001
Scheme 2. Synthetic pathways for the synthesis of Bodipy’s probes. Reagents and conditions: (c) 4-Pyridinecarboxaldehyde, TFA, DDQ, Et3N, BF3(OEt2), CH2Cl2, R.T. 24%; (d) 3-Pyridinecarboxaldehyde, TFA, DDQ, Et3N, BF3(OEt2), CH2Cl2, R.T. 17%; (e) 2-Pyridinecarboxaldehyde, TFA, DDQ, Et3N, BF3(OEt2), CH2Cl2, R.T. 24%; (f) chloroacethyl chloride, Et3N, BF3(OEt2), CH2Cl2, R.T. 22%; (g) ethanolamine, Et3N, CH3CN, 80 °C, yield 49%; (h) diethanolamine, Et3N, CH3CN, 80 °C, yield 49%; (i) Iodoethane, CH3CN, 50 °C, 95%.
Chemosensors 11 00503 sch002
Scheme 3. Synthetic pathway for the synthesis of Napht-1 and CDs. Reagents and conditions: (j) isobuthylamine, CH3CH2OH, reflux, yield: 53%; (k) NH2CH2CH2OH, CH3OCH2CH2OH reflux, yield:47%; (l) EDAC, 50 °C, 16 h; (m) ethanolamine, DIPEA, CH2Cl2, r.t. 3 days; (n) propanolamine, DIPEA, CH2Cl2, r.t. 3 days; (o) butanolamine, DIPEA, CH2Cl2, r.t. 3 days.
Chemosensors 11 00503 sch003
Figure 3. Sensing by array by smartphone.
Chemosensors 11 00503 g003
Figure 4. Normalized emission responses of G channel (I/I0 where I and I0 are the emission of probes after and before the exposition to the 100 ppm of DMMP vapours, respectively). Probes are numbered 1 (RhBM), 2 (RhBP), 3 (RhB), 4 (PBP), 5 (MPB), 6 (OBP), 7 (MBEP), 8 (OBEP), 9 (BDPy-Di-AE), 10 (BDPy-AE), 11 (PBEP), 12 (CDs-C2-OH), 13 (Naph-1), 14 (CDs-C3-OH), and 15 (CDs-C4-OH). Results are obtained from three independent measurements.
Chemosensors 11 00503 g004
Figure 5. Selectivity test. (a) Normalized emission responses of the G channel (I/I0, where I and I0 are the emission of probes after and before the exposition to 100 ppm of different analytes, respectively). Probes are numbered 1 (RhBM), 2 (RhBP), 3 (RhB), 4 (PBP), 5 (MPB), 6 (OBP), 7 (MBEP), 8 (OBEP), 9 (BDPy-Di-AE), 10 (BDPy-AE), 11 (PBEP), 12 (CDs-C2-OH), 13 (Naph-1), 14 (CDs-C3-OH), 15 (CDs-C4-OH); (b) t1 vs. t2 scores plot; the ellipses represent T2 Hotelling at 0.95 confidence. Results are obtained from three independent measurements.
Chemosensors 11 00503 g005
Figure 6. Linearity test. (a) Normalized emission responses of the G channel (I/I0 where I and I0 are the emission of probes after and before the exposition to the amount of DMMP reported in the inset). Probes are numbered 1 (RhBM), 2 (RhBP), 3 (RhB), 4 (PBP), 5 (MPB), 6 (OBP), 7 (MBEP), 8 (OBEP), 9 (BDPy-Di-AE), 10 (BDPy-AE), 11 (PBEP), 12 (CDs-C2-OH), 13 (Naph-1), 14 (CDs-C3-OH), and 15 (CDs-C4-OH). (b) Plot of the normalized emission response of the G channel (reported in Figure 6a) as a function of DMMP concentrations.
Chemosensors 11 00503 g006
Figure 7. Expected vs. predicted dilution factor calculated by the PLS model with 5 components. The red line represents the linear fit, and the green line represents the ideal linear relationship.
Chemosensors 11 00503 g007
Disclaimer/Publisher’s Note: The statements, opinions and data contained in all publications are solely those of the individual author(s) and contributor(s) and not of MDPI and/or the editor(s). MDPI and/or the editor(s) disclaim responsibility for any injury to people or property resulting from any ideas, methods, instructions or products referred to in the content.

