Review

MicroRNA Biosensors for Early Detection of Hepatocellular Carcinoma

1
Key Laboratory of Optoelectronic Technology and Systems, Ministry of Education of China, Chongqing University, Chongqing 400044, China
2
Department of Clinical Laboratory, Chongqing University Jiangjin Hospital, School of Medicine, Chongqing University, Jiangjin, Chongqing 402260, China
3
Department of Electrical Engineering and Computer Science, The University of Tennessee, Knoxville, TN 37996, USA
*
Authors to whom correspondence should be addressed.
Chemosensors 2023, 11(9), 504; https://doi.org/10.3390/chemosensors11090504
Submission received: 31 July 2023 / Revised: 31 August 2023 / Accepted: 11 September 2023 / Published: 16 September 2023
(This article belongs to the Special Issue Advanced Techniques for the Analysis of Protein and RNA)

Abstract

:
Hepatocellular carcinoma (HCC) is the main pathological type of liver cancer. Due to its insidious onset and the lack of specific early markers, HCC is often diagnosed at an advanced stage, and the survival rate of patients with partial liver resection is low. Non-coding RNAs (ncRNAs) have emerged as valuable biomarkers for HCC detection, with microRNAs (miRNAs) being a particularly relevant class of short ncRNAs. MiRNAs play a crucial role in gene expression regulation and can serve as biomarkers for early HCC detection. However, the detection of miRNAs poses a significant challenge due to their small molecular weight and low abundance. In recent years, biosensors utilizing electrochemical, optical, and electrochemiluminescent strategies have been developed to address the need for simple, rapid, highly specific, and sensitive miRNA detection. This paper reviews the recent advances in miRNA biosensors and discusses in detail the probe types, electrode materials, sensing strategies, linear ranges, and detection limits of the sensors. These studies are expected to enable early intervention and dynamic monitoring of tumor changes in HCC patients to improve their prognosis and survival status.

1. Introduction

Liver cancer is a malignant tumor that poses a serious threat to human health and has a very high mortality rate. The pathological types of hepatocellular carcinoma include hepatocellular, biliary, and mixed cell types, of which hepatocellular carcinoma accounts for approximately 70% [1]. Hepatitis B virus (HBV), hepatitis C virus (HCV), alcohol, fatty liver, and genetic disorders may induce HCC [2]. Due to the insidious onset of HCC, most patients are usually diagnosed at a late stage, with a high frequency of metastasis and recurrence after surgery, resulting in poor prognosis and survival. Therefore, early diagnosis and detection of hepatocellular carcinoma is crucial to improve patient prognosis and survival. The main clinical methods for detecting hepatocellular carcinoma include computed tomography (CT) [3], ultrasonography (US) [4], magnetic resonance imaging (MRI) [5], and tissue biopsy [6]. These methods have limitations in detection sensitivity, expensive detection equipment, and are heavily operator-dependent and invasive to the patient’s body [7]. Therefore, the development of analytical techniques that are simple to operate, inexpensive, highly sensitive, and selective is crucial for achieving early diagnosis of hepatocellular carcinoma. In recent years, the detection and analysis of tumor markers has become an effective tool in the diagnosis, prognosis, and treatment of cancer [8]. The detection of tumor markers in peripheral blood holds significant promise for clinical applications due to several key advantages, such as minimized invasiveness, continuous monitoring, and broad accessibility. Currently, several tumor markers have been evaluated in hepatocellular carcinoma, among which alpha-fetoprotein (AFP) is the most widely used in the diagnosis of primary liver cancer [9]. Despite the high specificity of AFP, its detection sensitivity and accuracy are not sufficient to detect patients with hepatocellular carcinoma in the early stages, and false negative results may occur [10].
With the extensive characterization of the protein-coding genome of liver tumors by researchers, ncRNAs were found to regulate hepatocarcinogenesis [11]. Classified based on length and shape characteristics, ncRNAs include miRNAs, long noncoding RNAs (lncRNAs), and circular RNAs (circRNAs) [12]. These transcripts have been shown to regulate the transcription, stability, or translation of protein-coding genes in the genome, although they are not transcribed into proproteins [13]. During hepatocellular carcinogenesis, investigators have found that the expression of miRNAs is disturbed in patients. Dysregulated miRNAs may affect HCC cell proliferation by directly interacting with key regulators of the cell cycle machinery [14]. Thus, miRNAs are potential HCC biomarkers and targets for intervention.
miRNAs are the smallest non-coding RNAs with an average size of 22 nucleotides [15]. The production of miRNAs in cancer cells, the process of obtaining miRNAs, and commonly used miRNA quantification methods are shown in Figure 1. At each step of HCC development, specific miRNAs are dysregulated. Accurate detection of miRNAs from complex biological samples is extremely challenging due to their short sequences, low levels in vivo, and easy degradation. Traditional detection methods include qRT-PCR, microarrays, and Northern blotting [16]. Among them, qRT-PCR offers high sensitivity and a wide dynamic range for miRNA expression profiles, but its application is limited due to susceptibility to contamination. Microarray technology has high throughput screening capability and can analyze a wide range of miRNAs, but requires complex probes and instruments, as well as specialized operators. Northern blotting is considered the “gold standard” for miRNAs, but has shortcomings in detection time and sample consumption, and has low sensitivity and throughput [17]. Biosensors offer significant advantages in terms of sample consumption, detection time, cost, portability, and complexity compared to the above-mentioned traditional techniques for miRNA detection [18]. Biosensor technology has become a cross-disciplinary field combining biology, chemistry, physics, medicine, electronics, and other disciplines [19]. In recent years, several biosensor-based techniques have emerged for the detection of miRNAs, such as electrochemistry [20], colorimetry [21], fluorescence [22], surface plasmon resonance (SPR) [23], surface-enhanced Raman scattering (SERS) [24], and electrochemiluminescence (ECL) [25]. These methods can also be used for in situ screening and mobile health monitoring.
In this review, the focus is on the impact of miRNAs as potential biomarkers for hepatocellular carcinoma. Recent advances in electrochemical and optical biosensors for the detection of hepatocellular carcinoma-associated miRNAs are reviewed. The target detector types, probe selection, electrode design, modification methods, sensing strategies, linear detection ranges, detection limits, and response times of these biosensors are discussed in detail. In addition, the characteristics and limitations of these biosensors are summarized. The organization is as follows: Section 2 provides an overview of the expression and roles of miRNAs associated with HCC. Section 3 and Section 4 analyze the research progress of electrochemical and optical biosensors for the detection of HCC-associated miRNAs, respectively. Section 5 discusses the methods to improve the detection performance of miRNA biosensors and summarizes the challenges and prospects of miRNA biosensors for clinical applications in the future. Compared with some previous reviews on miRNA biosensors, this review carefully categorizes miRNA biosensors associated with HCC, and the biotechnology and sensing technologies covered in the review are more comprehensive.

2. miRNAs Associated with HCC

Some miRNAs that are differentially expressed in HCC tumors compared to normal liver tissue include miRNA-21, miRNA-34a, miRNA-122, miRNA-125b, miRNA-141, miRNA-155, miRNA-223, miRNA-224, miRNA let-7a, and miRNA let-7b [26]. Among them, miRNA-21 is an important non-coding RNA affecting liver diseases, which can serve as a dual marker for early screening and prognosis of HCC [27]. miRNA-34a is an important tumor suppressor that can inhibit tumor progression and tumorigenesis [28]. However, miRNA-34a expression was significantly reduced in clinical HCC specimens, suggesting that miRNA-34a is a potential marker for HCC diagnosis and prognosis [29]. miRNA-122 is primarily expressed in liver tissue and plays a central role in various aspects of hepatocyte development and differentiation. It constitutes a substantial proportion of the total miRNA content within the liver, accounting for approximately 70% of the entire miRNA population in this organ [30]. Liang et al. [31] found that miRNA-125b inhibits the expression of the oncogene LIN28B and thus exerts tumor suppressor effects in HCC. However, downregulation of miRNA-125b was frequently observed in human hepatocellular carcinoma. miRNA-125b was under-expressed in most HCC cases and negatively correlated with the cell proliferation index in HCC. miRNA-141 plays an important role in cancer formation and progression. The downregulated miRNA-141 expression may be an important predictor of HCC [32]. miRNA-155 acts as a tumor suppressor in HCC and its expression level is significantly elevated in HCC tissues, with a marked increase of 1.5–6 times compared to normal liver tissues [33]. miRNA-223 was reported to be significantly lower in the serum of HCC patients compared to non-tumor livers by Elmougy et al. [34]. Eldeen et al. [35] demonstrated that miRNA-122 and miRNA-224 can be used as biomarkers for HCC diagnosis, and the detection of either of these miRNAs in combination with AFP will improve the accuracy of early HCC diagnosis. Qiu et al. [36] found a correlation between the expression level of miRNA let-7a and HBV replication. The downregulation of miRNA let-7a is associated with a decrease in HBV replication and may prevent the development of HCC. In addition, Wang et al. [37] showed that miRNA let-7b was able to inhibit the proliferation of HCC cells through Wnt/β-linker protein signaling in HCC cells, but miRNA let-7b was significantly downregulated in human HCC tissues. The expression of the above miRNA markers can respond to the development of HCC and has great potential in the early screening and diagnosis of HCC.

3. Electrochemical Biosensors
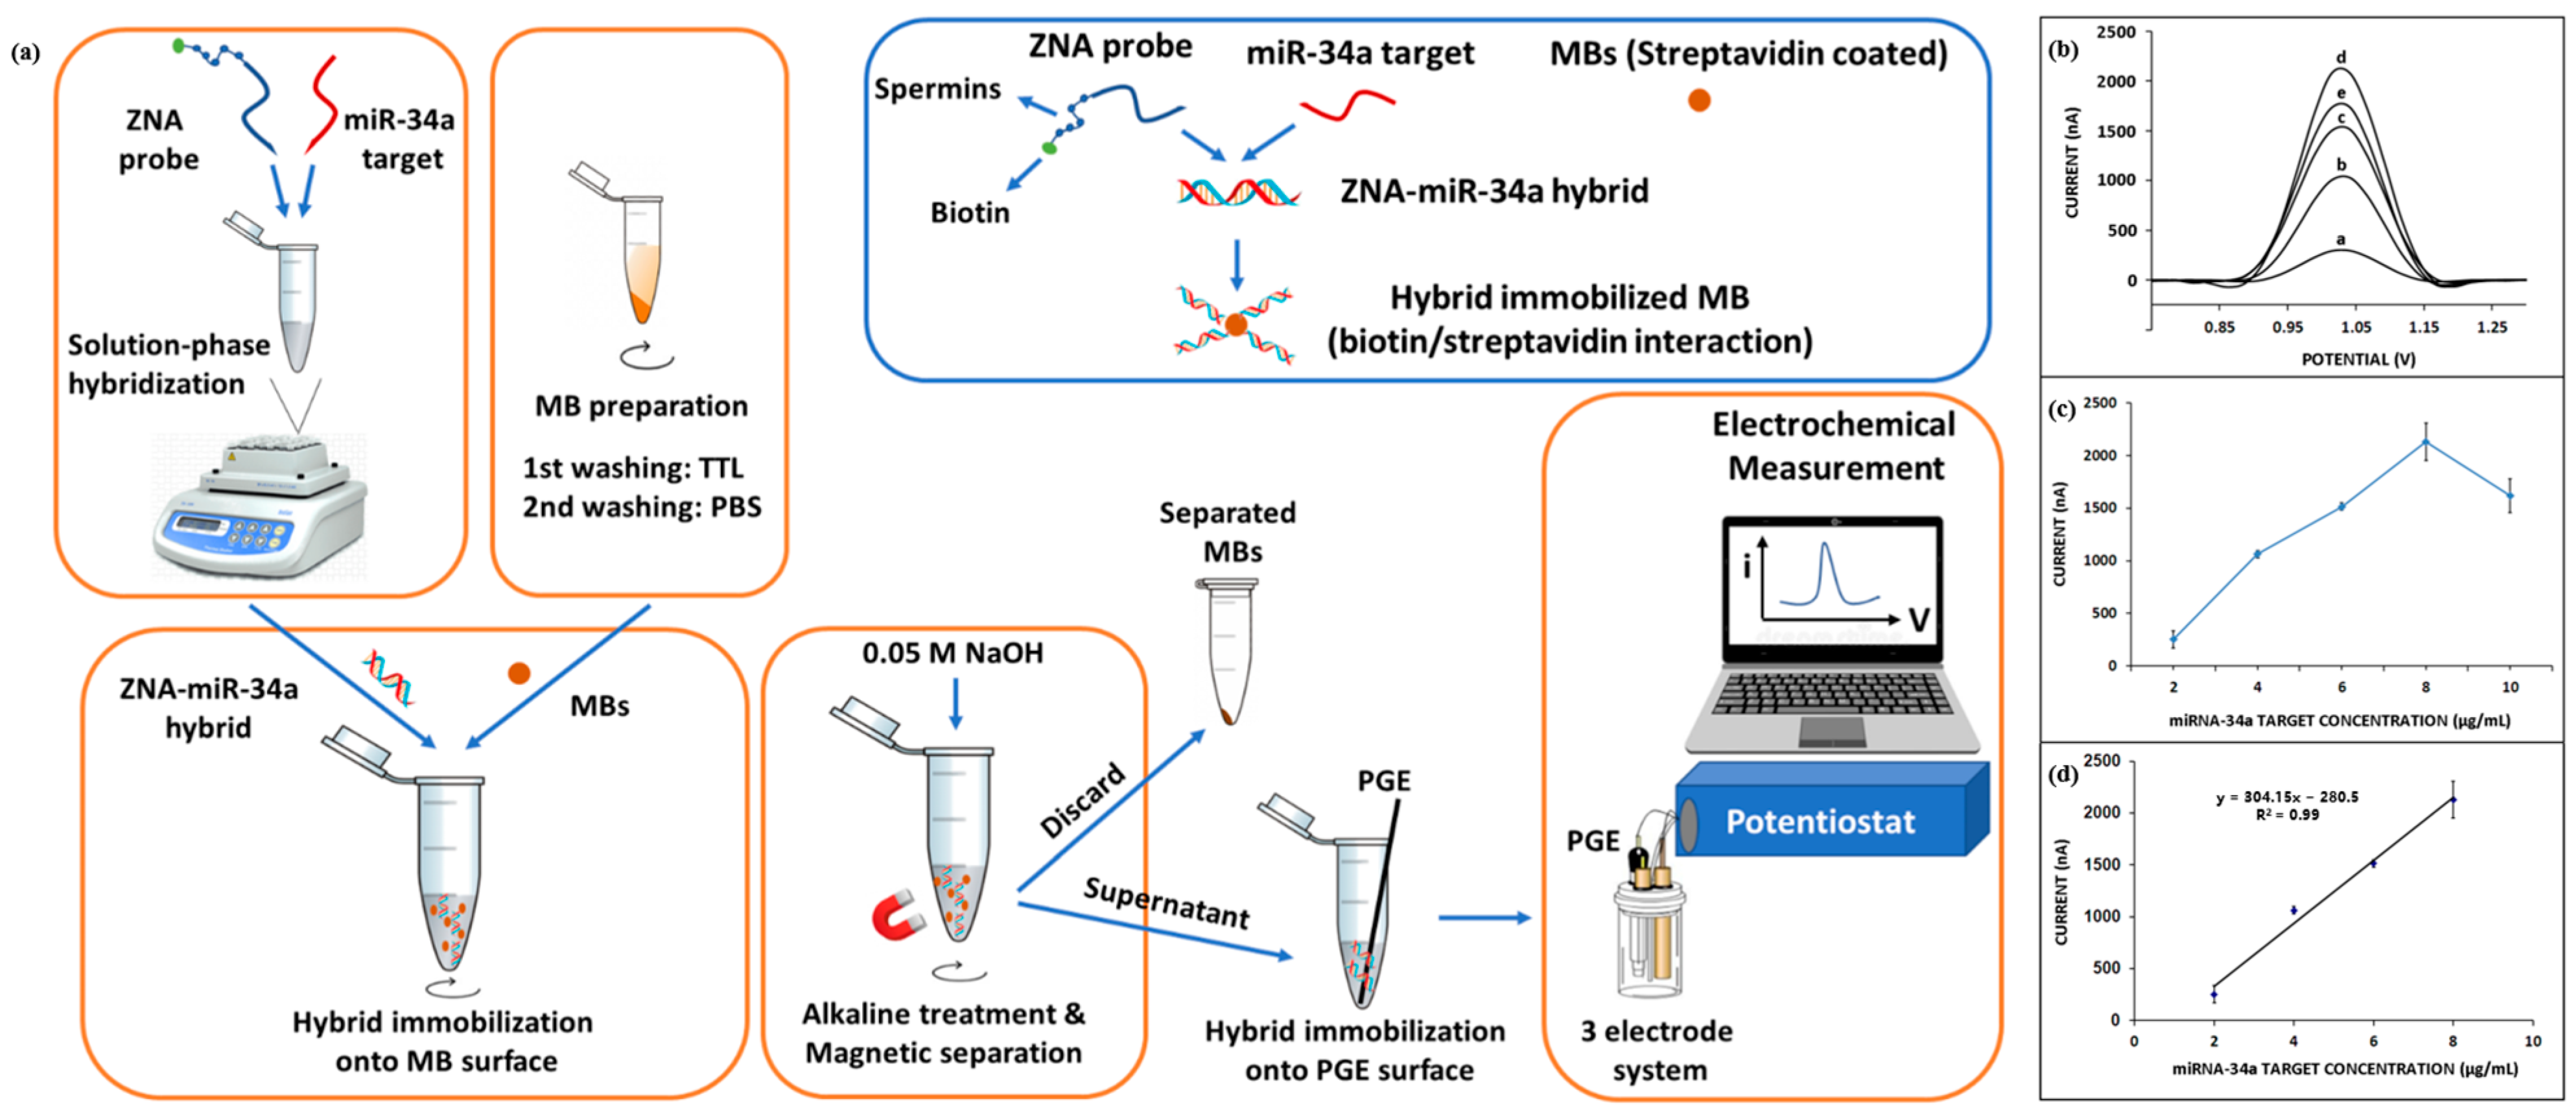
Electrochemical biosensors are devices that convert the biological signal generated by the specific binding of a recognition probe to a target to be measured into electrical signals such as voltage, current, and impedance [38]. Electrochemical biosensors are suitable for point-of-care (POC) detection due to the ease of miniaturization, automation, integration, and mass production. In recent years, nanotechnology has brought great opportunities for development in the field of electrochemical biosensors. The large surface volume ratio of nanomaterials helps to improve the detection sensitivity of biosensors [39]. Currently, the commonly used electrochemical detection methods mainly include voltammetry [40] and impedance methods [41]. Electrochemical biosensors for the detection of HCC-associated miRNAs will be discussed next according to the classification of electrochemical detection methods.

3.1. Voltammetry

Voltammetry is based on the relationship between the electrode potential and the current through the electrolytic cell to obtain analytical results. With the development of bioanalytical techniques, voltammetry is now mostly performed using a three-electrode system consisting of a working electrode, a counter electrode, and a reference electrode. The test methods mainly include cyclic voltammetry (CV) [42], square wave voltammetry (SWV) [43], differential pulse voltammetry (DPV) [44], and other methods.
Pathological studies have shown that miRNA-122 acts to repress oncogenes involved in different HCC features, and downregulation of miRNA-122 can cause tumor metastasis and hepatocellular carcinoma progression [45]. Therefore, simple and sensitive detection of miRNA-122 is highly relevant for the early diagnosis of HCC. Gao et al. [46] proposed an electrochemical biosensor based on the ion barrier effect for the detection of miRNA-122. A schematic diagram of the preparation and operation of the sensor is shown in Figure 2a. Prussian blue (PB) and gold nanoparticles (AuNPs) were first modified on the surface of a glassy carbon electrode (GCE) by a two-step electrodeposition method. The addition of Prussian blue was able to sensitize the GCE electrode to K+, resulting in a significant change in the voltammetric signal. KNO3 was chosen to provide K+. The modification of AuNPs enabled the GCE electrode to immobilize thiolated DNA probes by the self-assembly of Au-S bonds. An ionic barrier effect was produced when the DNA probe hybridized specifically with the target miRNA-122, preventing the diffusion of K+ from the solution to the electrode surface. In this way, the voltammetric signal at the electrode surface was suppressed, which achieved the quantitative detection of miRNA-122. The electrochemical response of the sensor was studied using DPV. Figure 2b and Figure 2c, respectively, show the DPV response curve and calibration curve of the sensor. The sensor has a response time of 60 min and can analyze miRNA-122 in the concentration range of 0.1 fmol/L–1.0 nmol/L with a detection limit of 0.021 fmol/L. This biosensor based on the ion barrier effect has the advantages of simple operation, low cost, sensitive response, high specificity, and high stability. In addition, the method shows better detection in real human serum samples and can be used to analyze complex biological samples. However, the detection time of this method is long, which is not conducive to the realization of point-of-care detection.
Losada et al. [47] designed an electrochemical biosensing platform based on microfluidic sensing technology that can perform eight multiple measurements of miRNA-122. The platform consisted of a glass substrate containing gold microelectrodes and a polydimethylsiloxane (PDMS) layer containing microfluidic channels. The capture probe modified with thiols was incubated in the microfluidic channel, and the probe was able to form a self-assembled monolayer (SAM) by immobilizing it on the electrode surface with Au-S bonds. After rinsing the channel with 0.5 M NaCl, miRNA-122 was injected into the microfluidic channel to hybridize with the capture probe. In this study, CV was used for electrochemical measurements, and the detection time required 30 min. The electrochemical sensing platform has a linear working concentration of 10−18−10−6 mol/L and a detection limit of 10−18 mol/L. This method has a wider linear detection range, lower detection limit, and shorter assay time for the detection of miRNA-122 compared to the method of Gao et al. [46]. In addition, microfluidic sensing technology makes the sensing platform miniaturized and more portable. It can also reduce costs and achieve high-throughput detection.
In recent years, the signal amplification strategy based on 3D DNA walkers has shown great potential for the ultrasensitive detection of miRNAs. Yang et al. [48] designed an “on-super off” dual-mode photoelectrochemical (PEC) and ratiometric electrochemical (EC) biosensor based on this strategy for the detection of miRNA-224. A schematic diagram of the sensor is shown in Figure 3. The sensor applied methylene blue (MB) and ferrocene (Fc) to induce signal quenching and enhancement. CdS quantum dots (QDs) were used here as photoactive electrode materials due to their photoelectric conversion efficiency. The signal “on” state was achieved by immobilizing MB-labeled hairpin DNA (MB-DNA) through Cd-S bonding, which sensitized the CdS QDs and generated significant PEC signals. Hairpin MB-DNA was turned on after the introduction of DNA probes labeled with Ag nanocubes (Ag-DNA). Several ferrocene-labeled DNA (Fc-DNA) generated by amplification of the 3D DNA walker, Ag-DNA, and MB-DNA hybridized to form a “Y” shaped hairpin structure. This structure keeps the MB away from the CdS QDs and the Fc close to the CdS QDs, which results in a reduced PEC signal and achieves a signal “super-off” state. In addition, miRNA-224 detection was also accomplished on the ratiometric EC biosensor using SWV. As the concentration of miRNA-224 increased, the oxidized peak current of MB decreased, and the oxidized peak current of Fc increased. Quantification of miRNA-224 was achieved by evaluating the value of IMB/IFc. The sensor has a linear detection range of 0.1–1000 fM with a detection limit of 0.019 fM in PEC and a detection range of 0.52–500 fM with a detection limit of 0.061 fM in ratiometric EC. CdS quantum dots exhibited excellent optoelectronic performance in the detection of miRNA-224 by this biosensor. The signal enhancing and quenching could be easily controlled by changing the structure of DNA, and the signal amplification strategy based on the 3D DNA walker significantly improved the sensitivity of detecting miRNAs.
Homogeneous electrochemical biosensors are low-cost, simple to immobilize, and the detection process occurs in a homogeneous solution. Wu et al. [49] designed a homogeneous electrochemical biosensor based on MnO2 nanosheets with dual enzyme activity for the detection of miRNA let-7a. In the absence of miRNA let-7a, the nucleic acid probe was tightly adsorbed on the surface of the 2D MnO2 nanosheets, and the catalytic activity of the MnO2 nanosheets was significantly inhibited. This led to the presence of a large amount of MB in the solution, which produced a very high DPV current peak. After the addition of miRNA let-7a, the phosphate group triggered the nucleobase pair shielding effect, and the probe was detached from the surface of MnO2 nanosheets after hybridization with miRNA let-7a. At this time, the surface-active sites of the MnO2 nanosheets were significantly increased and were able to fully react with MB. As a result, a large amount of MB was eliminated, leading to a significant decrease in the DPV response. The linear detection range of this homogeneous electrochemical biosensor was 0.4–140 nM, and the detection limit was 0.25 nM. Although this homogeneous electrochemical biosensor was simple to prepare, the detection sensitivity was limited.
Azab et al. [50] prepared an miRNA let-7a biosensor with a sandwich structure based on nanomaterials. The schematic diagram of the biosensor is shown in Figure 4a. Chrysin and carbon nanotubes (CNTs) were, respectively, modified on the carbon paste electrode (CPE), which could improve the antioxidant property of the electrode and optimize the conductivity and biocompatibility of the electrode. Then AuNPs were employed to modify the electrode surface, enhancing both the active surface area of the electrode and the stability of the immobilized capture probe. The electrochemical response was monitored by DPV, and the optimal time for hybridization of this sensor is 30 min. Figure 4b shows the calibration curve of ∆I versus the logarithm of miRNA let-7a concentration. In this work, the current response increased with increasing miRNA let-7a concentration in the range of 1.0 zM to 11 nM, and the limit of detection was 1.0 zM. The introduction of nanomaterials such as CNTs and AuNPs has been instrumental in improving the sensitivity of the biosensor. In addition, the prepared biosensor has good applicability for miRNA let-7a detection in real serum samples. The biosensor has an excellent detection limit, which is highly favorable for early detection of clinical HCC.
Cai et al. [51] reported an AuNP-modified graphene field effect transistor (FET) biosensor for the sensitive detection of miRNA let-7b. This FET biosensor was prepared by first dropwise addition of a reduced graphene oxide (R-GO) suspension on the FET surface, followed by modification of AuNPs on top of it. The PNA probes possess an electrically neutral backbone, which contributes to enhanced hybridization efficiency and reduced background noise in comparison to traditional DNA probes. This neutral nature of PNA probes mitigates the repulsive effects that can arise during the hybridization process [52]. In this study, after immobilizing the PNA probe on the surface of AuNPs through Au-S bonds, the excess active site was blocked using ethanolamine solution to minimize potential nonspecific binding. When the PNA probe hybridizes with miRNA let-7b, a distinct voltammetric response signal is generated due to the binding event. It was found that the developed FET biosensor could achieve detection limits as low as 10 fM in the linear range of 1 fM–100 pM. In addition, this highly sensitive and selective method was also successfully used for the detection of miRNA let-7b in serum samples. The PNA probe is highly promising for miRNA detection, and this PNA probe-based FET biosensor has the potential to be used as a point-of-care tool.
Erdem et al. [53] developed a method for electrochemical analysis of miRNA-34a based on the Zip nucleic acid (ZNA) probe. Figure 5a shows a schematic diagram of the electrochemical analysis based on the ZNA probe. ZNA probes were hybridized with target miRNA-34a in solution, and double-stranded products formed by hybridization were immobilized on the surface of magnetic beads (MBs) coated with streptavidin through biotin–streptavidin interaction. The double-stranded product was separated from the MBs by magnetic separation technique and then immobilized on the surface of pencil graphite electrodes (PGEs) for electrochemical measurements using DPV. Figure 5b–d show the DPV response curves and calibration plots of the ZNA probe hybridized with different concentrations of the target miRNA-34a. The detection limit of this method was 0.87 µg/mL in the linear range of 2–8 µg/mL. In addition, the electrochemical analysis method based on the ZNA probe is also suitable for the detection of miRNA-34a in real samples. The innovative use of ZNA probes in this sensor overcomes the electrostatic repulsion between probes and their complementary sequences, thus improving hybridization efficiency. However, the biosensor detects miRNA-34a for up to 60 min, which is not conducive to achieving point-of-care detection. In the future, with the advantage of ZNA nucleic acids combined with rapid enrichment methods such as the AC electrokinetics (ACEK) effect, the detection performance of the sensor will be improved, and the detection time will be shortened.
Zeng et al. [54] explored the photocurrent properties of yolk-in-shell Au@CdS and yolk-shell Au@CdS and established a sensitive and feasible PEC biosensor for the quantitative detection of miRNA-21 based on yolk-in-shell Au@CdS. The biosensor used HRP-labeled ssDNA combined with MBs to form MB-ssDNA-HRP as the signal probe, yolk-in-shell Au@CdS as the photoactive substrate, and benzo-4-chlorohexadienone (4-CD) precipitation as the signal quencher. In the presence of miRNA-21, miRNA-21 and two hairpin DNAs (H1, H2) could generate a large amount of H1-H2 double-stranded (dsDNA) by catalytic hairpin assembly (CHA) reaction. dsDNA binding to Cas12a-crRNA triggered the cleavage of MB-ssDNA-HRP by Cas12a, which led to the detachment of HRP from the MB surface. After magnetic separation, HRP was able to catalyze 4-chloro-1-naphthol (4-CN) to generate 4-CD precipitates that covered the yolk-in-shell Au@CdS surface, resulting in a significant decrease in its photocurrent response. The linear detection range of this PEC biosensor for miRNA-21 was 0.01 pM-10 nM, with a detection limit of 4.2 fM. In addition, stronger synergistic effects, SPR, and thermal electron transfer were found for yolk-in-shell Au@CdS by FDTD simulation combined with photocurrent/photothermal testing. Yolk-in-shell Au@CdS functional nanomaterials have great potential for early screening and diagnosis of various cancers.
Ouyang et al. [55] constructed an electrochemical biosensor for miRNA-21 detection by combining nanomaterials and hybridization chain reaction (HCR). First, Ti3C2 was obtained by etching Ti3AlC2 with HF, and then Ti3C2 was covered with Bi2O3 nanoparticles to form Ti3C2@Bi2O3 with an accordion-like structure. GCE was modified with Ti3C2@Bi2O3 to enhance electrode conductivity and AuNPs to increase the active surface area. Then the thiol-modified capture probe (SH-CP) was immobilized on the electrode through Au-S bonds. The hairpin structure of the capture probe was opened when the target miRNA-21 was present, allowing miRNA-21 to hybridize specifically with the capture probe. The addition of primers H1 and H2 triggered the hybridization chain reaction, forming long double strands on the GCE surface. Many methylene blue (MB) molecules were embedded in the long double strand, which resulted in a significant DPV response of the biosensor at a potential of 0.19 V. This dual-signal amplification strategy based on nanomaterials and HCR can detect miRNA-21 in a wide linear range of 1 fM–100 pM with a detection limit as low as 0.16 fM. Compared with the qRT-PCR quantification technique, the biosensor detected miRNA-21 in the same linear range as qRT-PCR, but with a lower detection limit and higher sensitivity. In addition, the biosensor shows good applicability in human serum samples. However, the biosensor is dependent on primed DNA strands, which leads to higher costs and is not favorable for mass production.

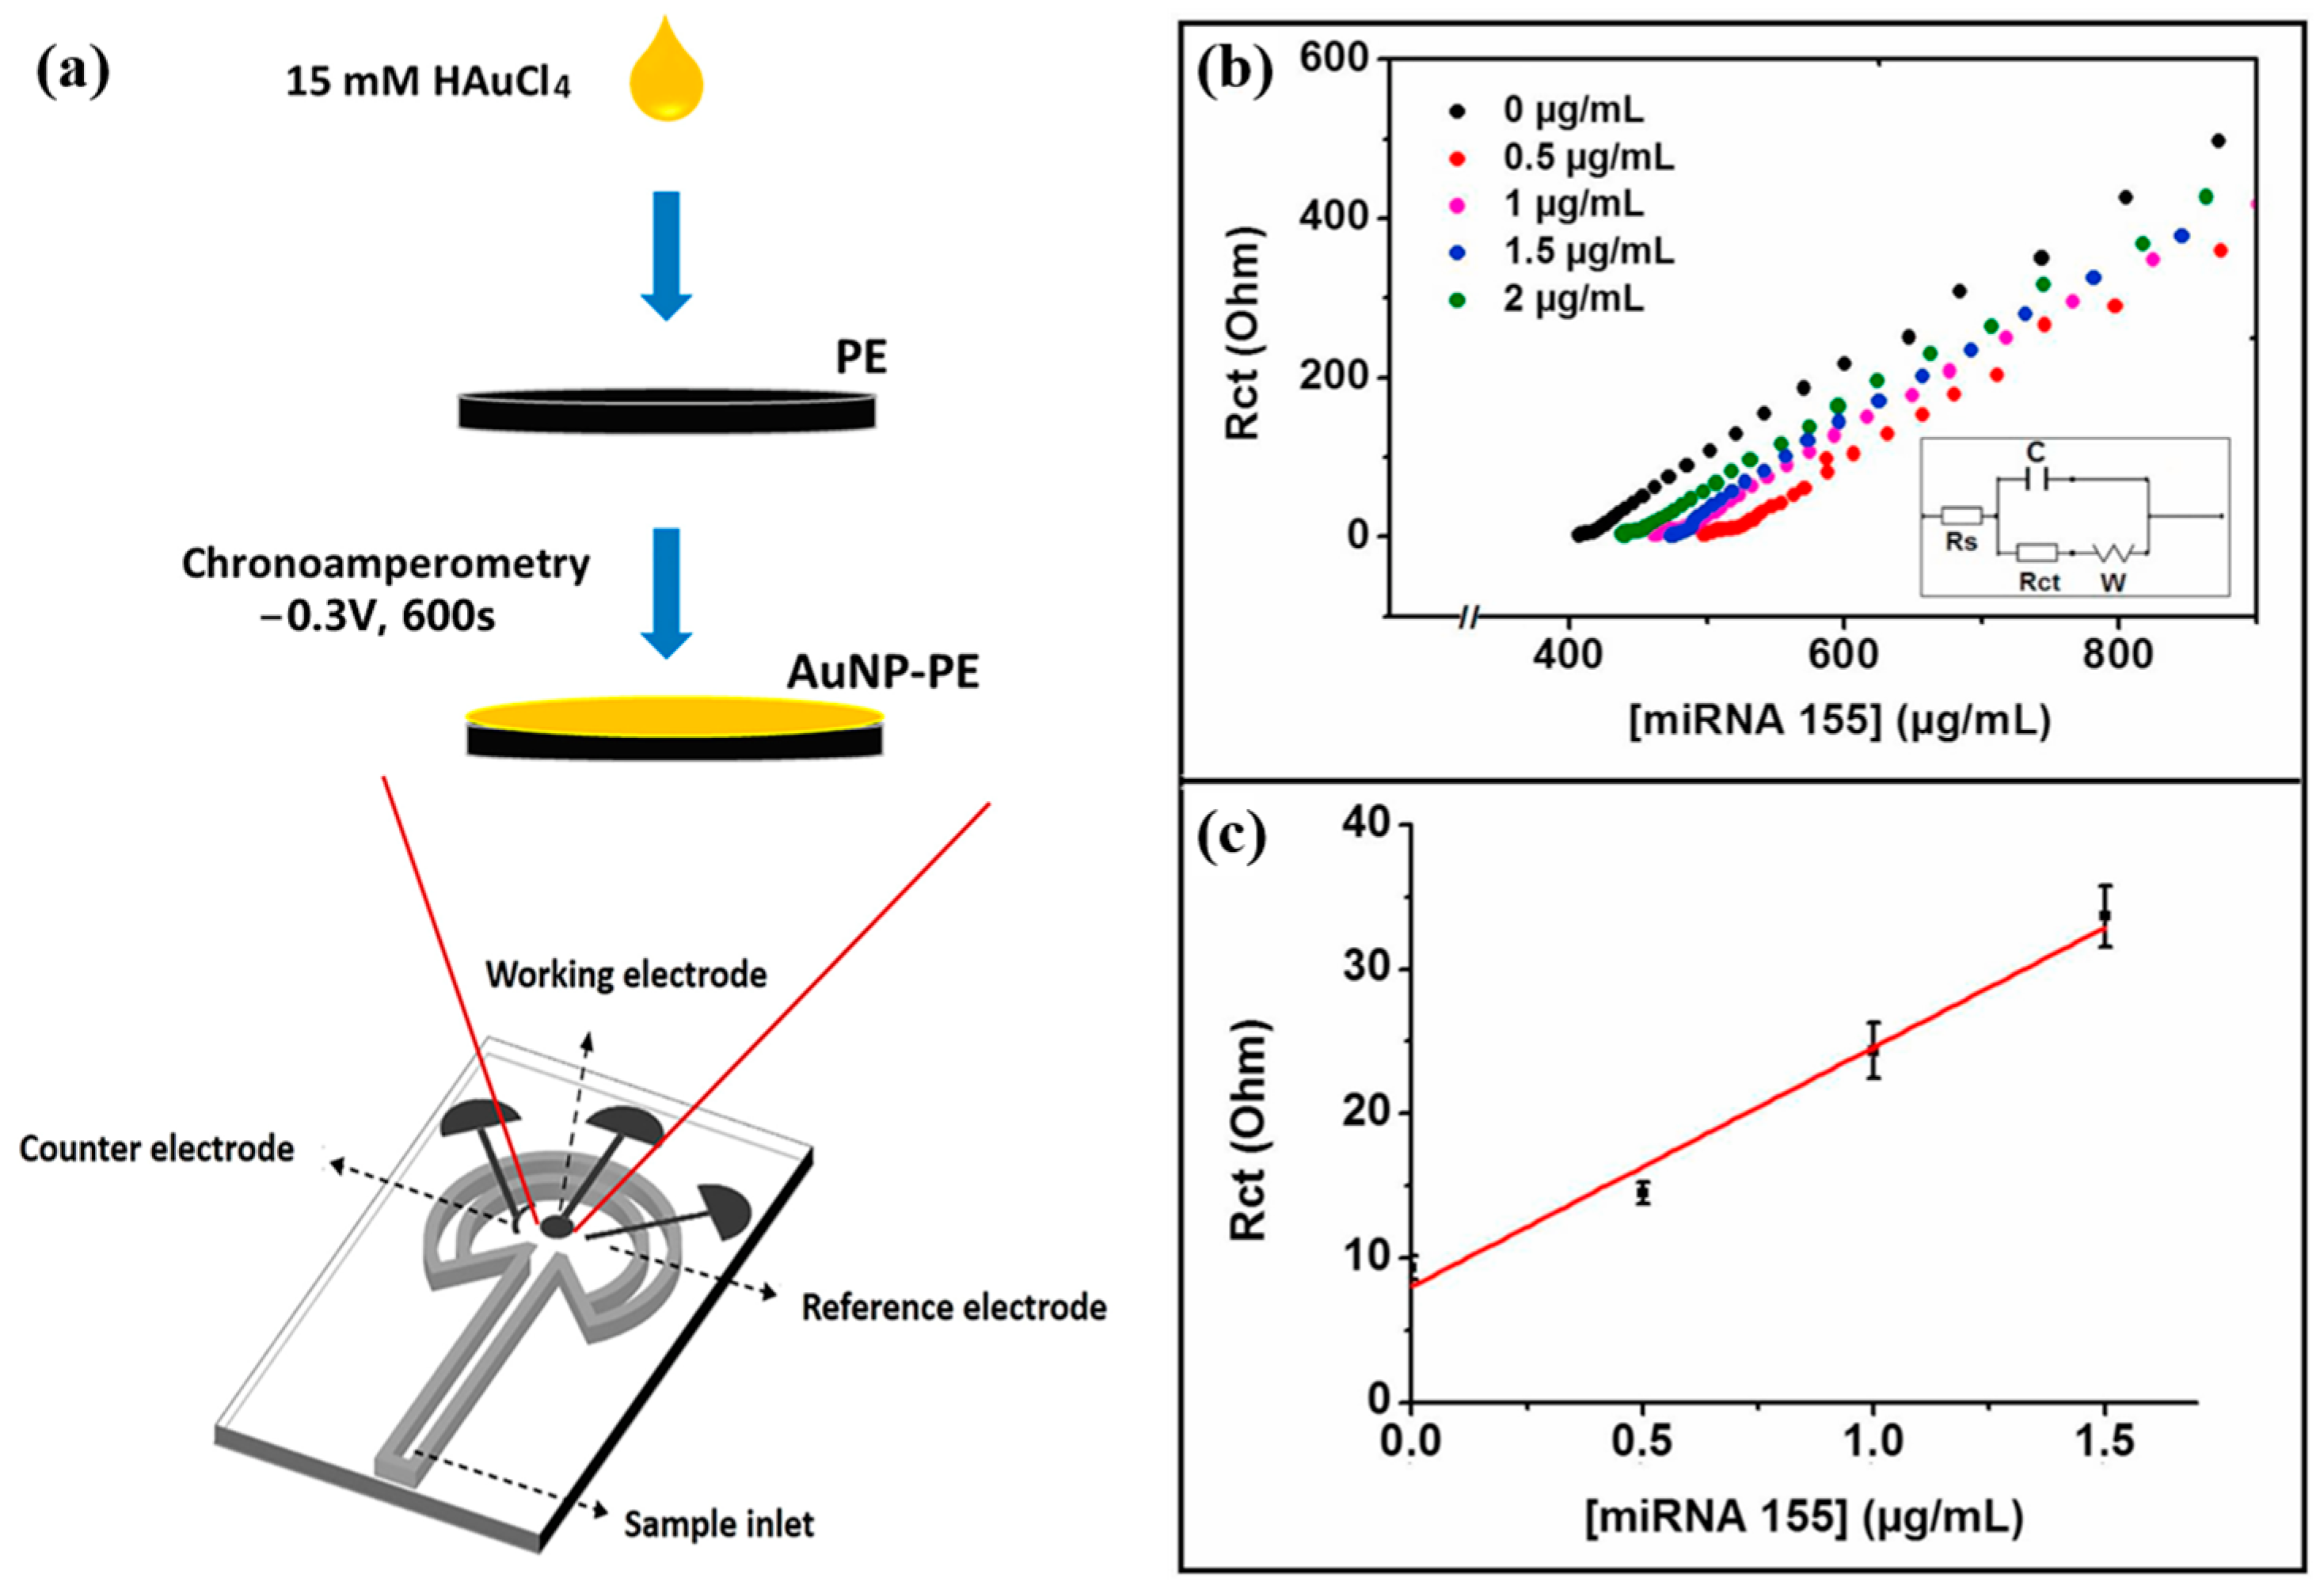
3.2. Impedance Method

Electrochemical impedance spectroscopy (EIS) is a sensitive and versatile electrochemical sensing technique that finds extensive applications in the analysis of microscopic interfacial features associated with biomolecules [56]. By probing the impedance spectroscopic response of electrochemical systems, EIS provides valuable insights into various physical properties such as diffusion rates, reaction rates, and microstructural features [57]. Currently, EIS serves a dual role in electrochemical biosensors. It can be used to characterize the sensor construction process, and also to quantitatively detect biomolecules [58].
La et al. [59] proposed a signal amplification strategy induced by the insulating effect to enable sensitive impedance measurements of miRNA-21. The DNA probe encapsulated on the surface of the Au electrode was able to capture the target miRNA-21 and a biotin-modified miRNA (biotin–miRNA) with the same nucleic acid sequence. After self-assembly by biotin–F monomers, the streptavidin (SA)–biotin–FNP network was formed by binding SA. Biotin–miRNA adsorbed onto the SA–biotin–FNP network through biotin–SA interactions, forming an insulating layer on the electrode surface that hinders electron transport and consequently amplifies the impedance response. When the target miRNA-21 was present, miRNA-21 and biotin–miRNA competed for hybridization to the capture probe. With the reduction of biotin–miRNA captured on the electrode, the adsorbed SA–biotin–FNP network was also reduced, resulting in a significant decrease in the impedance signal. The linear range of this detection strategy for miRNA-21 detection is 0.1–250 fM, with detection limits as low as 0.1 fM. The SA–biotin–FNP network used in this method is relatively easy to prepare and the sensor has good applicability in real samples. However, the detection time of this sensor is greater than 2 h, which is not conducive to achieving rapid point-of-care detection.
Eksin et al. [60] developed a paper-based electrochemical impedance biosensor for quantitative detection of miRNA-155. This paper-based biosensor is shown in Figure 6a. The paper-based sensor consisted of a microfluidic channel and a working area where the working electrode, counter electrode, and reference electrode were placed. AuNPs-PE was formed by depositing AuNPs onto PE through the chronocurrent method. Figure 6b and Figure 6c, respectively, show the EIS response curve and the calibration curve of this biosensor for the detection of miRNA-155. The thiol-modified DNA probe was immobilized on AuNPs-PE via Au-S bonds. When miRNA-155 was present, KCl solution containing [Fe(CN)6]3−/4− was added dropwise, and miRNA-155 was quantified by measuring the change in charge transfer resistance (Rct). The linear detection range of the sensor was 0–1.5 μg/mL in PBS with a detection limit of 33.8 nM, and 0–4 μg/mL in the fetal bovine serum (FBS) medium with a detection limit of 93.4 nM. The biosensor shows good selectivity for non-complementary and mismatched miRNA sequences. The paper-based electrochemical biosensor can selectively detect miRNAs even in complex media such as serum with a detection time of only 15 min and good stability, which makes it very suitable for POC detection applications.
Yarali et al. [61] developed an electrochemical biosensor for the detection of miRNA-155 and miRNA-21 associated with early cancer diagnosis using molybdenum disulfide (MoS2) modified paper-based electrodes for the first time. Block crystals and sheets of MoS2 were, respectively, fabricated and modified on the surface of paper-based electrodes to explore their performance in miRNA detection. The capture probe was modified on the MoS2-modified electrode, and different concentrations of target miRNA solutions were added dropwise for hybridization. The electrochemical response of the sensor was measured by EIS technology, and the entire miRNA detection process was completed within 30 min. The linear detection range of this biosensing platform is 1–200 ng/mL. In the PBS buffer, the LOD for miRNA-155 was calculated to be 17.0 ng/mL and the LOD for miRNA-21 was 9.2 ng/mL through linear fitting. In the FBS medium, the LOD of miRNA-155 was 1.0 ng/mL and the LOD of miRNA-21 was 17.0 ng/mL. The electrically active surface area of bulk MoS2 was larger compared to that of nanosheets, and thus the detection limit of the paper-based electrode modified by bulk MoS2 was lower. In addition, they are effective in distinguishing non-target sequences with single base mismatches. The biosensor has a low manufacturing cost and can perform highly sensitive and selective quantitative analysis of miRNAs at low sample volumes, offering great potential for the detection of miRNA biomarkers in human serum.

3.3. Other Methods

In addition to the studies mentioned above, several other near-commercial miRNA biosensors have been developed. Jin et al. [62] combined magnetic nanobeads with metal–organic frameworks loaded with glucose oxidase (MOFs@GOX) and constructed a novel self-powered electrochemical sensor based on a photocatalytic zinc–air battery (ZAB-SPES) for the detection of miRNA let-7a. ZAB-SPES has a high-power density of 22.8 μW/cm2, which is 2–3 times higher than that of commonly used photofuel cells. Gao et al. [63] reported a flexible graphene field effect transistor (Gr-FET) biosensor. The biosensor was able to achieve an miRNA detection limit as low as 10 fM within 20 min. Gr-FET-based biosensors will have prospective applications in wearable electronic devices for health monitoring and disease diagnosis. Xu et al. [64] integrated EBFCs on a flexible paper tape carrier to establish an ingenious sensor technology for the detection of tumor markers in complex samples. Multivariate detection was realized by receiving real-time instantaneous current values via a smartphone. This smartphone-based paper tape sensor platform provides an opportunity for early cancer diagnosis and lays the foundation for the construction of flexible wearable platforms.
Table 1 summarizes the characteristics of these electrochemical biosensors for the detection of HCC-associated miRNAs. The main characteristics include receptor type, electrode material, electrochemical method, linear detection range, detection limit, sensitivity, and response time. It was found that the above electrochemical biosensors had wide detection limits and high sensitivity. However, most of the sensors have poor immunity to interference and still have a long response time, which is not conducive to rapid bedside detection.

4. Optical Biosensors
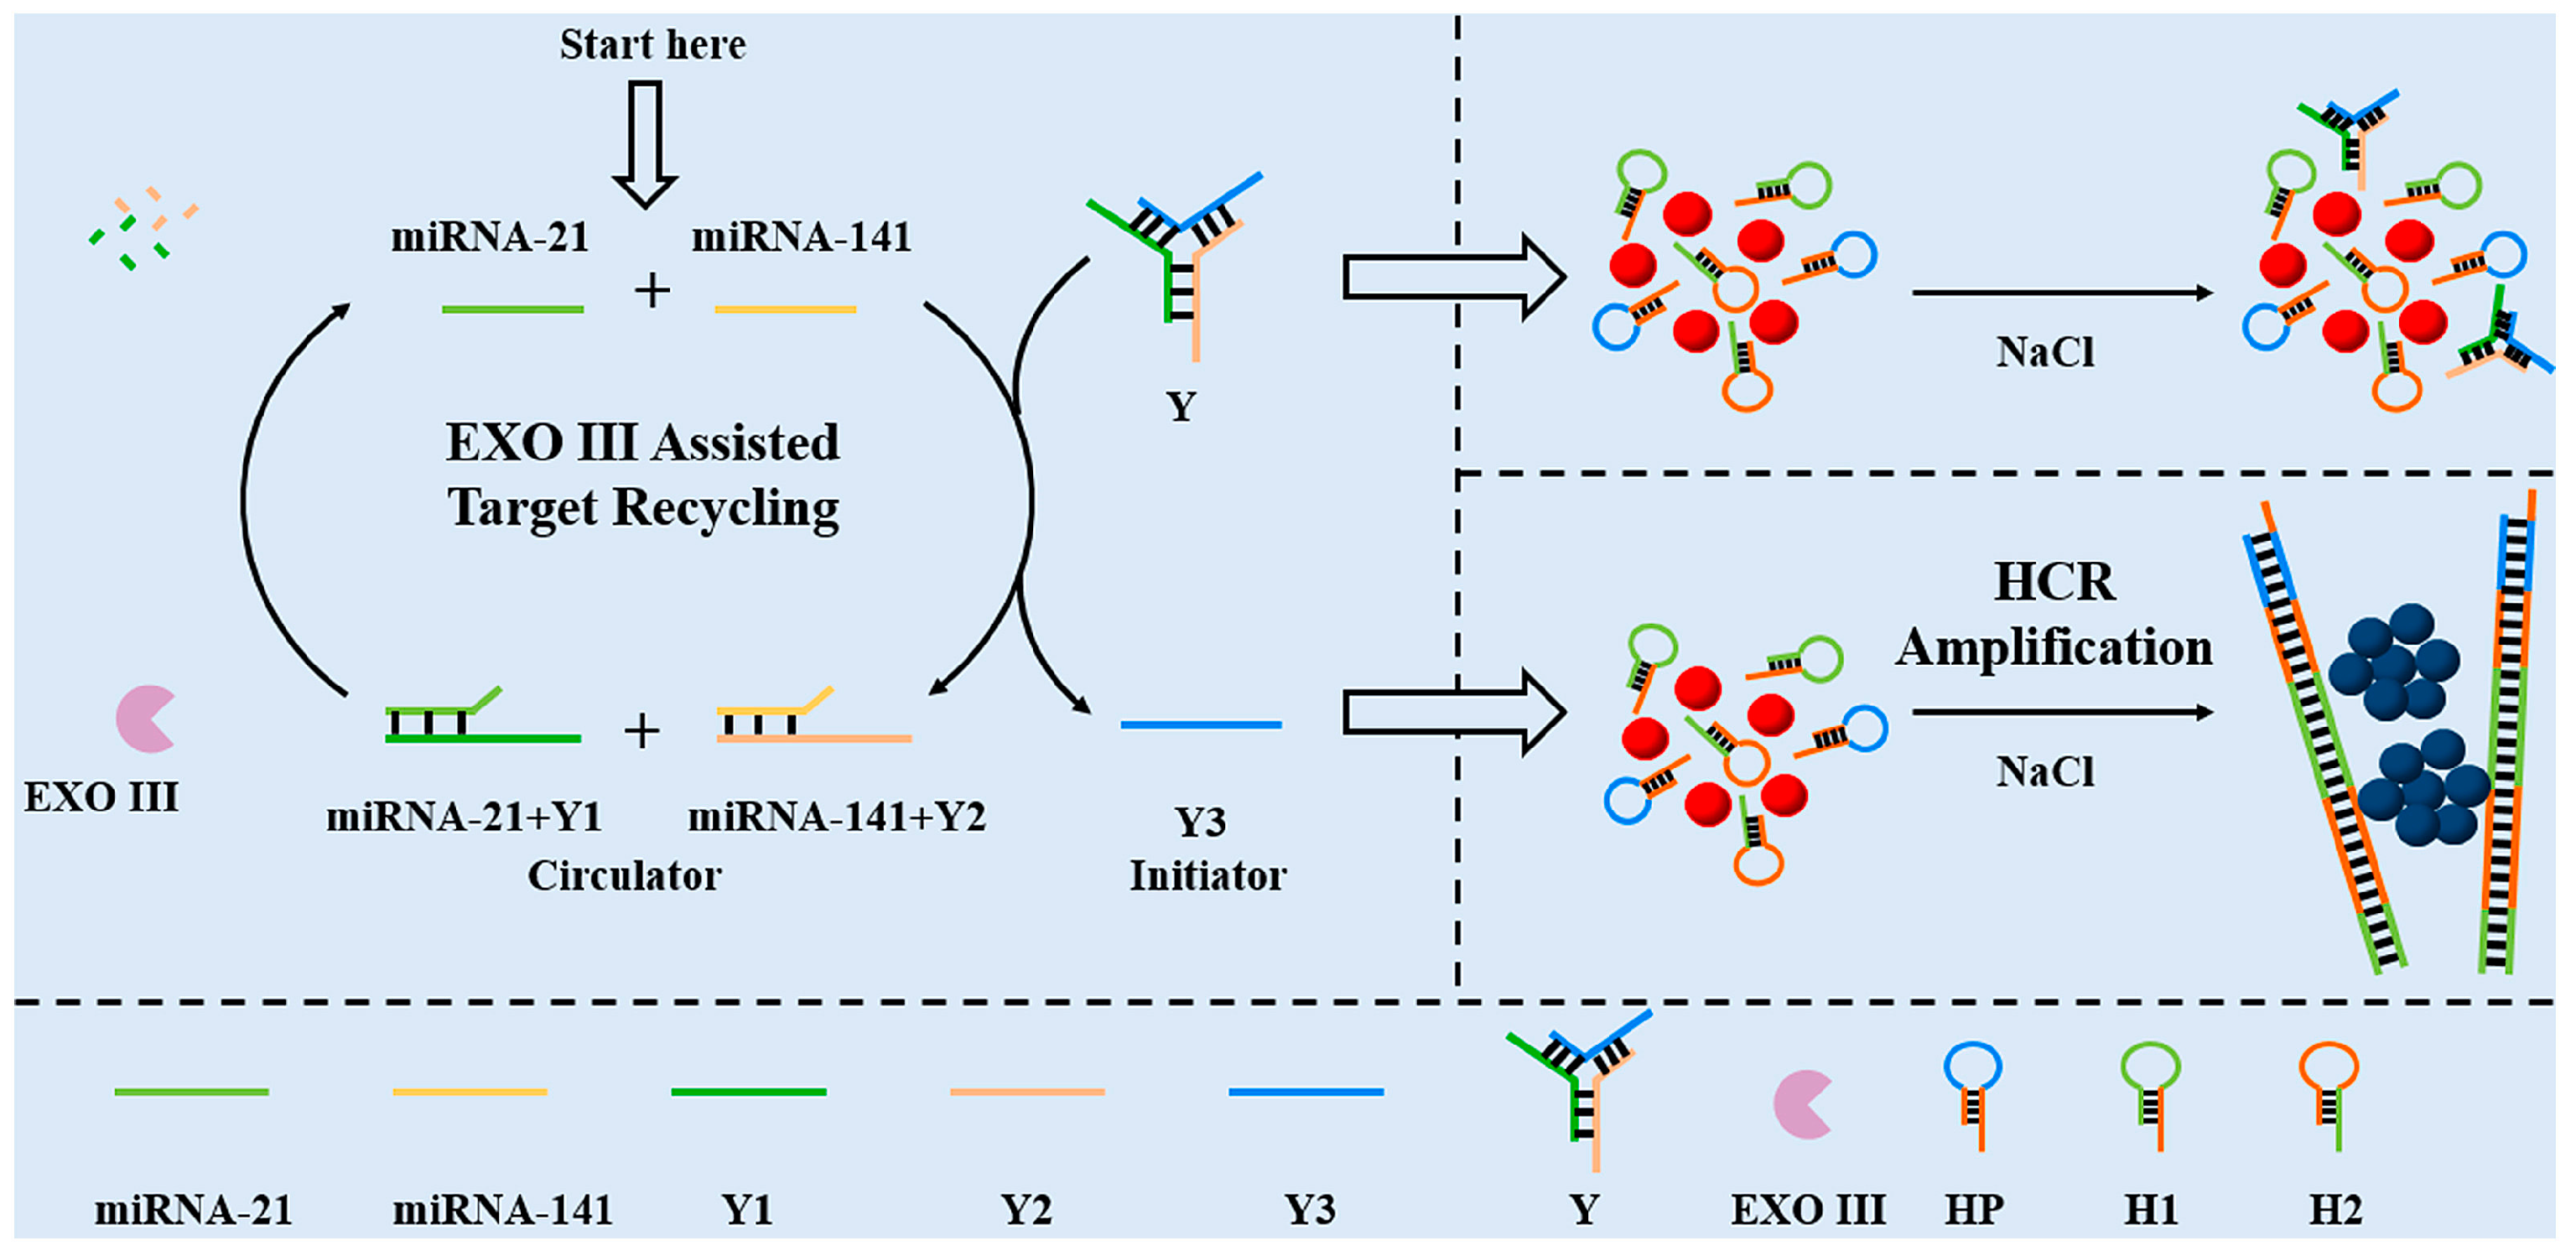
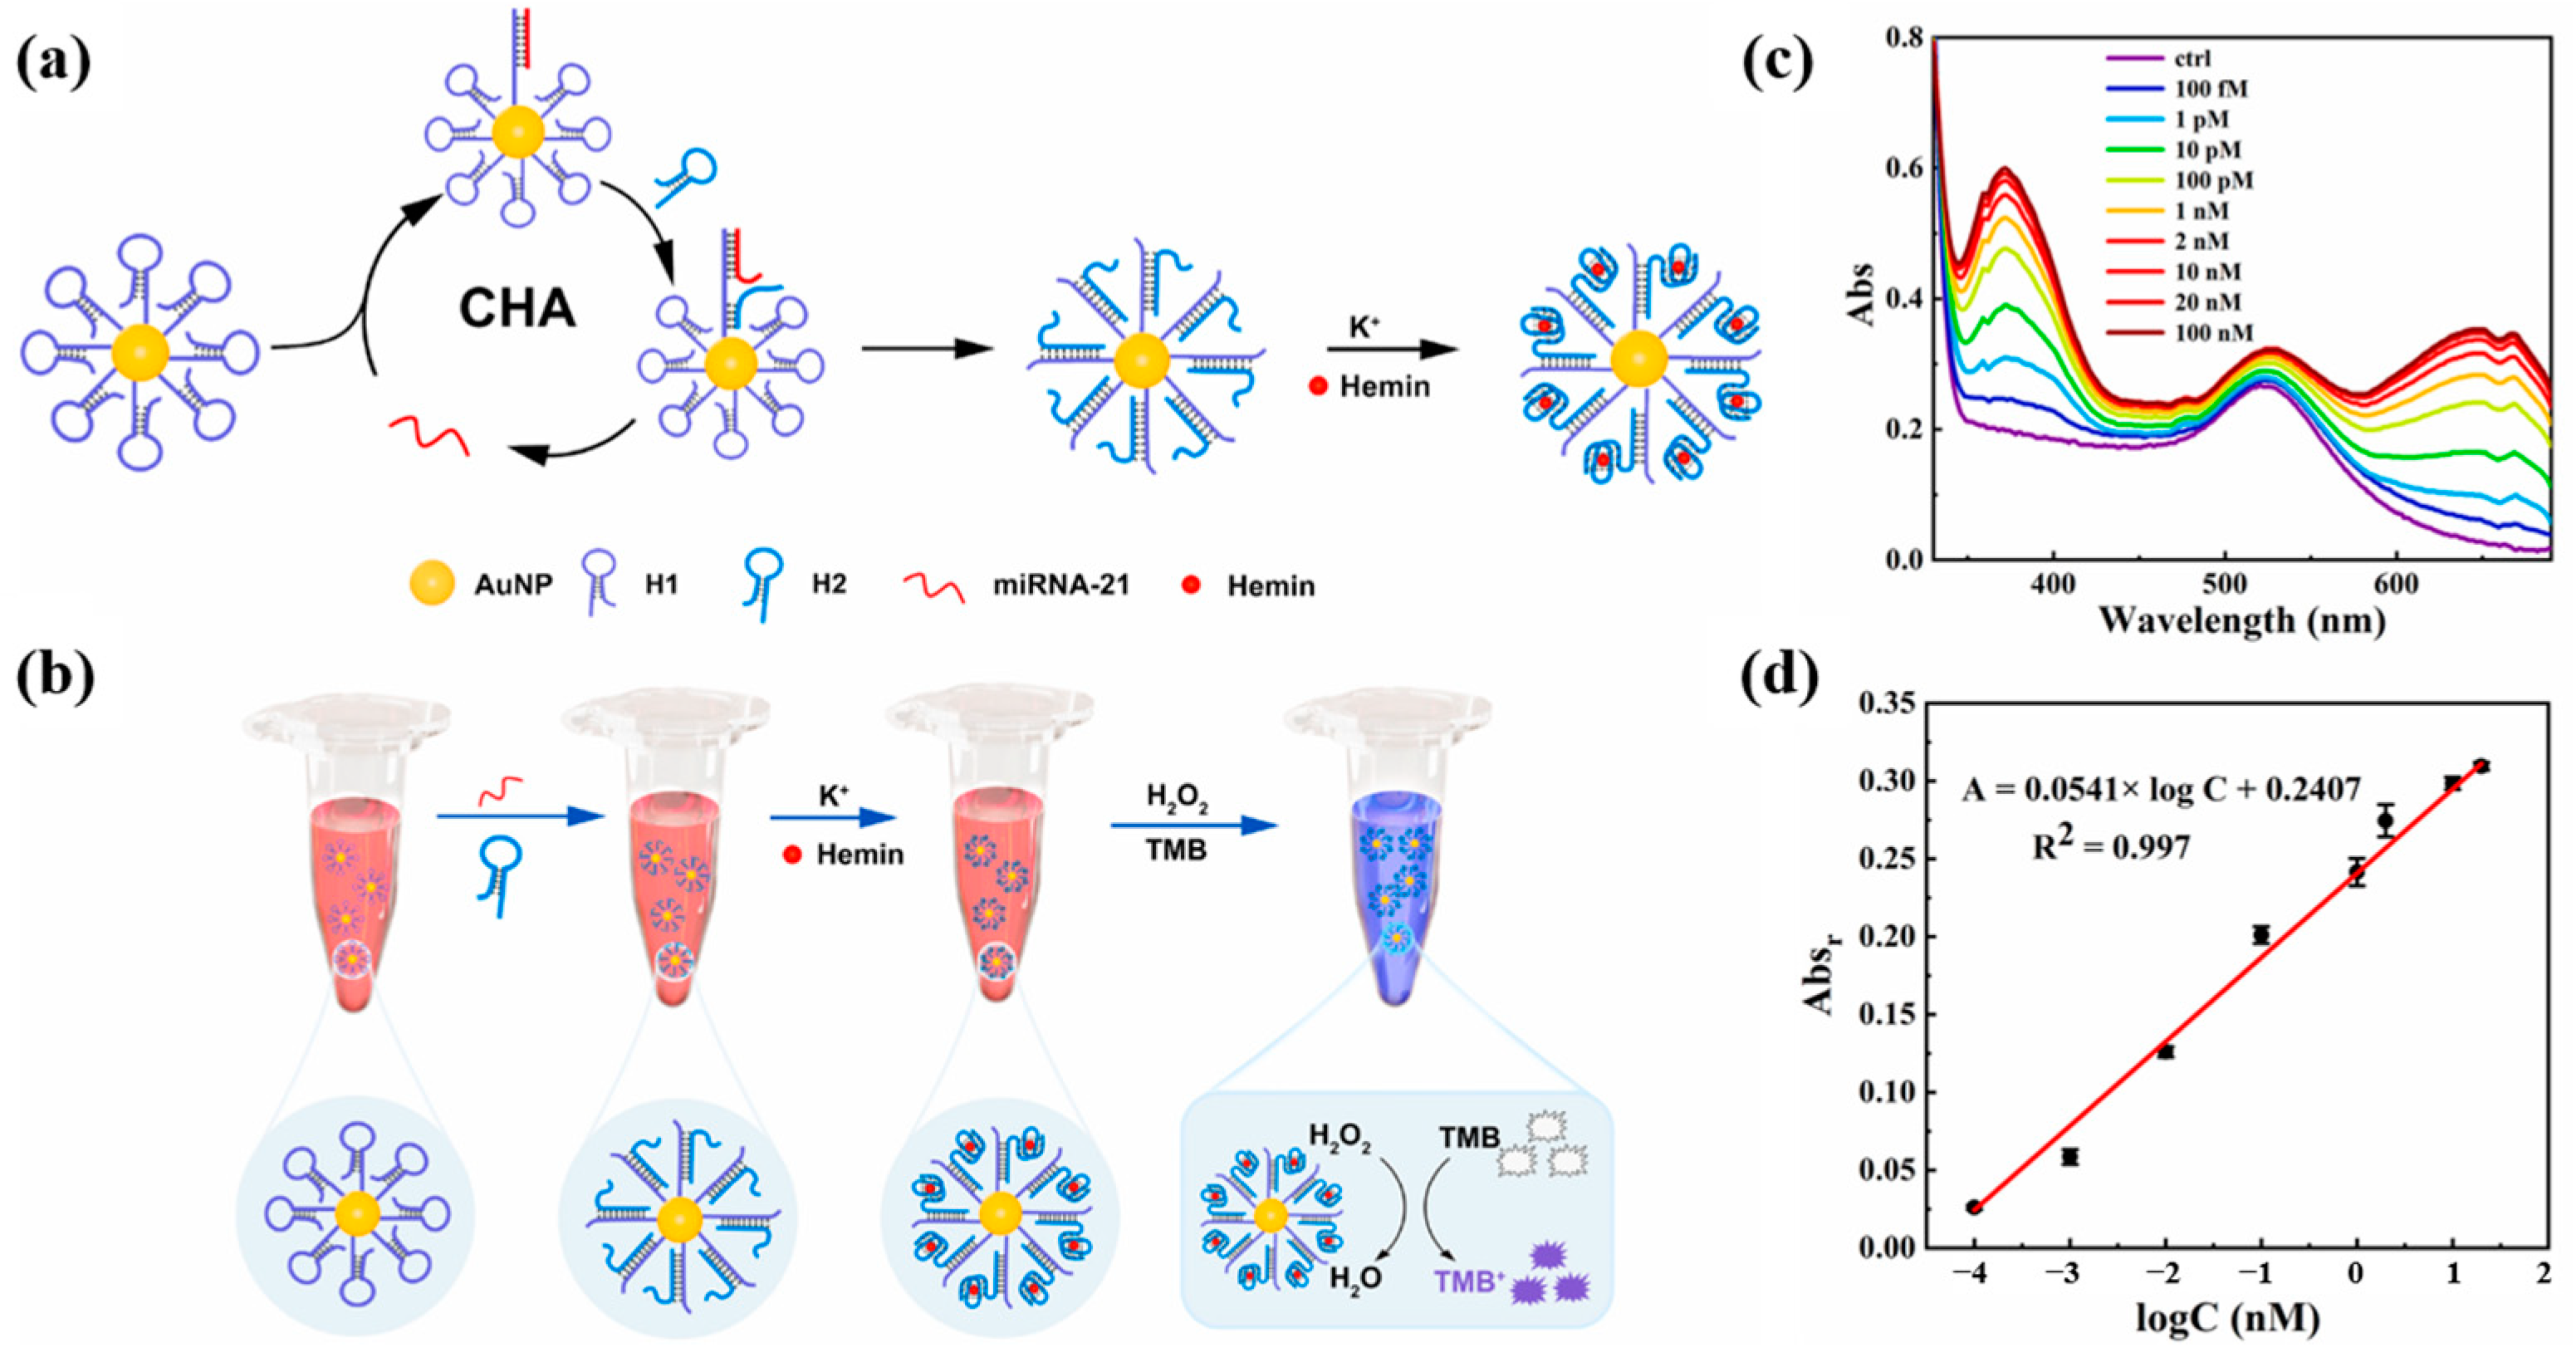
Optical signals are insensitive to noise interference, have good stability, and the spectral properties of different molecules to be tested are differentiated with high specificity. Therefore, optical biosensors can directly detect the molecules to be detected [65]. In addition, optical biosensors are easily miniaturized and have the potential to facilitate chip-level integration [66]. According to different working methods and principles, optical biosensors can be classified as colorimetric biosensors, fluorescent biosensors, SPR-based biosensors, and SERS-based biosensors. The optical biosensors for the detection of hepatocellular carcinoma-associated miRNAs are categorized and reviewed next.

4.1. Colorimetry

Colorimetry is a common method for the detection of biomolecules, which is evaluated by analyzing the change in absorbance or reflectance of the reagent [67]. Colorimetric biosensors have the advantages of naked eye determination, low cost, fast response, and ease of fabrication [68]. Colorimetric biosensors can change color in response to external physical or chemical factors, as well as through an enzyme-catalyzed chromogenic reaction inside the sensor, or with the help of metallic nanomaterials [65].
Shahsavar et al. [69] developed a novel colorimetric platform based on G-quadruplex spherical nucleic acid enzyme (SNAzyme) for the recognition of miRNA-155. Capture probe 1 and G-rich probes were attached to AuNPs via Au-S bonds to form G-quadruplexes. The G-tetramer was converted to SNAzyme in the presence of K+ and hemin under buffered conditions of Tris-HCl 100 mM, KCl 150 mM pH 7. The target miRNA-155 was able to hybridize with the capture probe 1 to form a double strand, resulting in a significant decrease in the intensity of the colorimetric response. In the range of 1–100 nM, there is a linear relationship between the decrease in colorimetric response signal and the amount of miRNA-155. The detection limit for miRNA-155 using this method was 0.7 nM. In addition, the colorimetric sensing platform successfully realized the quantitative detection of miRNA-155 in human serum samples. SNAzyme has high thermal stability and resistance to nuclease degradation, which can improve the detection performance of the colorimetric sensing platform. However, this biosensor exhibited a linear detection range and detection limit at the nanomolar level, necessitating the incorporation of an amplification strategy to improve the sensitivity of the colorimetric biosensor.
Li et al. [70] designed a specific Y-type DNA probe for the colorimetric detection of miRNA-21 and miRNA-141. The detection scheme combining EXO III-assisted target cycling and HCR dual-signal amplification is shown in Figure 7. The Y-type DNA probe consists of the capture strand of target miRNAs and the HCR promoter strand. When two miRNAs were present, the capture probe specifically recognized target miRNAs, leading to the formation of a DNA double strand, resulting in two loops and the subsequent release of the HCR promoter strand Y3. EXO III can specifically cleave the DNA double strand and release target miRNAs again. Y3 can continuously cycle to initiate HCR amplification, thus realizing the amplification of colorimetric signals. The quantitative detection of miRNA-21 and miRNA-141 was based on UV–Vis absorption spectra. The detection limit of both miRNAs was 3 pM, and the linear range was 10 pM-0.4 nM. This colorimetric biosensor incorporating a dual-signal amplification strategy can simultaneously detect miRNA-21 and miRNA-141 with high sensitivity. The Y-shaped DNA probe provided a good application basis for the detection of miRNAs due to its simple preparation, high selectivity, and high stability. In addition, this colorimetric biosensor was successfully applied to the detection of miRNAs in human serum samples, and it is expected to be successfully applied to the diagnosis of clinical cancer in the future.
Yang et al. [71] proposed a colorimetric sensing strategy for miRNA-21 based on the combination of G-quadruplex (GQ) and CHA. The design principle of the sensor and the detection process are shown in Figure 8a,b. Multiple hairpin DNA H1 probes were attached to AuNPs. When miRNA-21 was present, hairpin DNA H1 was turned on to hybridize with miRNA-21 and hairpin DNA H2, and CHA would be triggered and continue to circulate. Upon addition of K+ and hemin, the above precursors can self-assemble into a spherical DNAzyme. DNAzyme can catalyze redox reactions and color changes. As the concentration of miRNA-21 increased, the characteristic absorption signal of oxidized tetramethylbenzidine (TMBox) gradually increased and the color of the solution changed from burgundy to blue–violet. Figure 8c shows the UV–Vis absorption spectrum for the detection of miRNA-21, and Figure 8d shows the calibration curve. The developed method has a linear detection range of 100 fM to 20 nM and a detection limit of 90.3 fM. In addition, the sensing platform has been successfully used to detect miRNA-21 in human serum, providing a promising tool for the early diagnosis of hepatocellular carcinoma. Compared with the method of Li et al. [70] for detecting miRNA-21, this method has a wider linear range and lower detection limit. However, the detection throughput of this method is low, and only one miRNA can be detected at a time.

4.2. Fluorescence Method

Fluorescent biosensors are widely used in various fields such as biomedicine and environmental protection because of their high sensitivity, good selectivity, simple operation, and fast detection speed [72]. This method improves the sensitivity and selectivity of fluorescence detection by designing specific fluorescent probes or using fluorescent nanoparticles such as quantum dots and metal nanoparticles [73]. Fluorescent biosensors usually require fluorescence spectroscopy measurements with the help of specialized instruments such as fluorescence spectrophotometers.
In 2019, Wang et al. [74] designed a ratiometric fluorescent biosensor based on MnO2 nanosheets for the detection and imaging of miRNA-21 in living cells. MnO2 nanosheets were used as carriers for DNA probes H1 and H2. The recognition probe H1 of this biosensor was required to be labeled with the fluorescent donor FAM, and the amplification probe H2 was required to be labeled with the fluorescent acceptor TAMRA. As shown in Figure 9a, the target miRNA-21 in the cell hybridized with the recognition probe H1 and initiated CHA. The H1-H2 double-stranded body formed by hybridization prompted the fluorescence donor FAM to approach the fluorescence acceptor TAMRA, which induced a ratiometric fluorescence response. Figure 9b shows the fluorescence emission spectra of miRNA-21 at different concentrations, and Figure 9c demonstrates the linear fit curve about the ratio of (FA/FD)positive to (FA/FD)negative when different amounts of miRNA-21 were added. The ratio became larger with the increase in miRNA-21 concentration in the concentration range of 0.1 to 20 nM, with a detection limit of 73 pM. Li et al. [75] proposed a label-free fluorescence sensing strategy based on copper nanoclusters (CuNCs) to detect miRNA-21. The change in fluorescence of CuNCs can be used to quantify the concentration of the target miRNA-21. The DNA-CuNCs used in this biosensor were synthesized with high efficiency, which saved the preparation time of the sensor. The CuNCs have strong fluorescence properties and good biocompatibility, which improved the sensitivity of fluorescence sensing and provided a new idea for fluorescence detection of miRNAs. This strategy can quantify miRNA-21 in the range of 50–1000 pM with a detection limit of 18.7 pM. This strategy can quantitatively detect miRNA-21 in the range of 50–1000 pM with a detection limit of 18.7 pM, which is lower than the detection limit of the labeled fluorescence detection method proposed by Wang et al. [74] and has good specificity and selectivity. Compared with the labeled fluorescence detection method, the unlabeled method requires less material and is simpler to operate, which is expected to improve the detection sensitivity of miRNA fluorescence sensors.
In 2021, Forte et al. [76] developed an advanced PNA microarray system for the detection of miRNA-122 using the PNA probe. The PNA microarray substrate consisted of a multilayer structure that included a silicon support, a mirror layer (Al-SiCu) produced by the CVD method, and a spin-coated agarose layer. The microarray coating was fully characterized by electron microscopy and SEM optical techniques. By combining the mirror effect of the aluminum membrane and the positive interference of the agarose membrane on the emission wavelength of the Cy5 fluorescent label, the system achieved direct optical signal enhancement. miRNA-122 was detected by the PNA microarrays with a sensitivity of approximately 1.75 μM−1 and a limit of detection of 0.043 nM. In addition, it was demonstrated by molecular dynamics simulations that the agarose substrate had a dsPNA-RNA interaction with positive contribution and was able to avoid potential non-specific binding. The Si/Al/agarose substrate is highly promising for the development of new microarray platforms for cancer diagnostic devices.
In 2022, He et al. [77] developed a fluorescent miRNA-21 sensing strategy based on carbon dots (CDs) and AuNPs. Positively charged CDs fluorophores (PEI-CDs) and DNA probe-modified AuNPs (AuNPs-cDNAs) were assembled by electrostatic interaction, resulting in fluorescence quenching. PEI-CDs were released when miRNA-21 was present, at which point fluorescence intensity was restored. The fluorescence intensity was linearly correlated with the logarithm of miRNA-21 concentration in the range of 1–1000 fM, and the detection limit was as low as 1 fM. The results of this method for detecting miRNA-21 in real serum samples were comparable to those of qRT-PCR. This fluorescent biosensor does not require complex labeling, effectively simplifying the process. Although it had a low detection limit for miRNA-21, the detection time still required 2 h, which was unfavorable for point-of-care detection. The detection time of this sensor can be effectively shortened if combined with a molecular enrichment strategy to accelerate the binding rate of miRNA-21 molecules to DNA probes.
In 2023, He et al. [78] proposed another novel miRNA-21 fluorescence sensing strategy based on CDs. The schematic diagram of this biosensor for the detection of miRNA-21 is shown in Figure 10a. A molecular beacon (MB) probe (CDs-MB-BHQ1) was constructed using CDs as fluorophores and BHQ1 labeled at the 5′ end of the DNA probe as a bursting agent. Not only can graphene oxide (GO) act as a co-bursting agent but it can also adsorb the MB probe. When miRNA-21 hybridized with the loop region of the MB probe, the hairpin MB probe opened, increasing the distance between the CDs and BHQ1. The MB probe was released from the GO, restoring the fluorescence intensity of the CDs. Figure 10b and Figure 10c, respectively, show the fluorescence spectra and calibration curve of the sensor for miRNA-21 detection. The fluorescent biosensor can be used to determine miRNA-21 in the range of 0.5–800 pM with a detection limit of 500 fM. In addition, the MB probe can be used to detect miRNA-21 levels in real human serum. Although this sensing strategy is relatively novel, it requires labeling of DNA probes, which is complicated to operate. The detection limit of this strategy for miRNA-21 is not adequate for clinical applications, and efforts are needed to enhance the sensitivity of the fluorescent sensor.

4.3. Surface Plasmon Resonance

Surface plasmon resonance is a label-free optical detection technology. When visible or near-infrared light is incident on a metal surface, the refractive index (RI) near the metal surface can reflect the level of biomolecules [73]. Common methods used to excite surface plasmon include coupling of prisms, optical fibers, gratings, and nanoparticles [79]. The detection data of SPR biosensors can be collected and displayed in real time. It currently has a wide range of applications in biosensing, environmental monitoring, and clinical diagnosis.
Yu et al. [80] constructed a surface plasmon resonance biosensor for the combined detection of AFP and miRNA-125b markers associated with HCC. The SPR response was amplified using the double antibody sandwich method (DASM) and S9.6 antibody enhancement method to improve the sensitivity and specificity of the sensor. As shown in Figure 11a,b, the anti-AFP monoclonal antibody was modified on the surface of the CM5 chip by amide bonding, and the DNA probe paired with miRNA-125b was bound on the surface of the CM5 chip by biotin–streptavidin interaction. The linear range of AFP detection by DASM was 25–400 ng/mL, essentially covering the clinical AFP detection range (0–400 ng/mL). The S9.6 antibody enhancement method reached the detection limit of 123.044 pM for miRNA-125b in the linear range of 0–1000 pM. These results validate the feasibility of combined multi-marker detection in the early diagnosis of HCC. The detection technology of AFP as a clinical marker is relatively mature, and combining AFP with other miRNA markers can improve the accuracy and reliability of early cancer diagnosis. This combined detection strategy inspires the detection of various cancer markers.
In conventional surface plasmon resonance biosensors, the hybridization and enzymatic digestion reactions to detect biomarkers are performed on the chip surface. Huang et al. [81] proposed an innovative method to perform hybridization enzymatic digestion cyclic reactions in solution for miRNA-21 detection. The schematic diagram of this SPR biosensor is shown in Figure 12a. The target-free probe solution (bio-DNA-bio/DSN) was injected into the reference channel, the target-containing probe solution (bio-DNA-bio/miRNA-21/DSN) was injected into the detection channel, and SA-modified gold nanoparticles (SA-AuNPs) were injected into both channels. In the channel without miRNA-21, bio-DNA-bio adhered to the SA-modified chip via SA-bio binding and captured the SA-AuNPs, obtaining a stronger SPR signal. However, in the channel containing miRNA-21, the DNA hybridized with miRNA-21 was digested by DSN, and miRNA-21 was released into the next enzymatic cycle while many bio-DNA fragments were generated. The generated bio-DNA and undigested bio-DNA simultaneously bound to the SA on the surface of the chip, and the captured SA-AuNPs were reduced, leading to a decrease in the SPR signal. In Figure 12b, the SPR signal decreases with the increase in miRNA-21 concentration. Figure 12c demonstrates that the biosensor has a good linear correlation in the range of 1–15 fM. The SPR signal can be detected even when the concentration of miRNA-21 is as low as 1 fM. The sensing strategy of the SPR biosensor proposed in this study is relatively novel, and the SPR signal amplification can be realized by releasing miRNA-21 to participate in the cycle only through the DSN-digested DNA probes. Although the detection limit of this biosensor is ideal, its linear range is narrow compared to other studies of the same type, and the detection results are easily affected by errors.
Wang et al. [82] developed an in situ-prepared silver nanoparticles (AgNPs)-based SPR biosensor based on HCR for sensitive detection of miRNA let-7a. The dielectric constant property of AgNPs can significantly increase the angle of SPR. Three DNA probes (ON1, ON2, and ON3) were included in this strategy so that they could capture the miRNA let-7a, which subsequently triggered the HCR to produce a large amount of dsDNA on the SPR disk. ON2 and ON3 coexist in the reaction solution in the absence of the target miRNA, and only a small amount of dsDNA is attached to the SPR disk. Almost no AgNPs are produced on the dsDNA, resulting in smaller SPR angle changes. In the presence of target miRNA, many AgNPs were produced with the insertion of Ag+ into the dsDNA strand by NaBH4 reduction, leading to a significant increase in the SPR angle. The SPR angle was proportional to the target miRNA concentration. The AgNPs-based SPR biosensor detected miRNA let-7a with a linear range of 0.001–0.1 pM and a detection limit of 0.35 fM, which is lower than that of other SPR biosensors using variable amplification tags. This SPR sensing strategy exhibited unmodified properties and excellent sensitivity, and it has great potential for health monitoring and early cancer diagnosis.

4.4. Surface-Enhanced Raman Spectroscopy

Surface-enhanced Raman spectroscopy has been widely used in different fields because of its high sensitivity, unique molecular vibrational fingerprinting, and ease of operation [83]. It is very suitable for the analysis and detection of trace biomolecules, including the sensitive detection of low-abundance miRNAs [84]. When the target biomolecules are adsorbed onto the surface of the SERS substrate, especially after binding to the receptors of the substrate, a distinct Raman signal can be observed [85]. In recent years, many researchers have combined SERS methods with biosensors for the detection of miRNAs.
Wang et al. [86] proposed a dual-mode microfluidic chip-based sensing strategy to detect miRNA-21 by combining fluorescence and SERS spectroscopy. miRNA-21 was detected by modifying AgNPs on glass slides to form a SERS-enhanced substrate. A customized molecular beacon (MB) is then modified. The 3′ end of the MB was decorated with a thiol group, which enables the MB to attach to the substrate surface. The 5′ end of the MB was labeled with 6-FAM, which serves as both a fluorophore and a Raman reporter. Target DNA was injected in parallel channels on a microfluidic chip prepared by PDMS, and fluorescence and SERS measurements were performed after placing the reaction for 1 h. MBs maintained their hairpin structure in the absence of target miRNA-21. Due to the proximity of 6-FAM labeling to AgNPs, the fluorescence of 6-FAM was quenched, and the Raman signal was enhanced. In the presence of the target miRNA-21, specific hybridization between the miRNA and MB will open the hairpin structure of MB. Due to the increased distance between 6-FAM and AgNPs, the fluorescence of 6-FAM was restored, and the SERS signal was weakened. This method can detect miRNA-21 in a linear range of 10−9–10−7 M. Compared with the fluorescence or SERS sensing strategy alone, the combination of opposite variations of the two optical methods can improve the sensitivity and linearity of detection of miRNA-21. In addition, the introduction of microfluidic chips can shorten the reaction time and save the number of reagents while reducing the complexity of detection. However, the detection limit of this method is still unclear.
Si et al. [87] developed a novel SERS sensor array with nine sensing units based on a DNA hydrogel, which can simultaneously detect multiple cancer-related miRNAs in a single sample. After modifying SA on each sensing unit, a DNA hydrogel responsive to the target miRNA was added. Since the DNA hydrogel formed blocked the binding of the modified SA sensor unit to the SERS tag, no significant Raman signal could be observed. After the introduction of miRNA-21, the DNA probe in the DNA hydrogel of the SERS sensor unit hybridized with miRNA-21, and the DNA hydrogel was broken down accordingly. As a result, the SERS label was able to be captured onto the surface of the SA-modified sensing unit, resulting in a significant Raman signal. The detection limit of the sensor was calculated to be 0.11 nM in the range of 4–1200 nM. In this study, the smart combination of the SERS sensor array with barcodes highlights the applicability of the sensor array in multiple detection. This DNA hydrogel-based SERS sensor array is likely to be a promising candidate for early cancer screening and clinical diagnosis. However, the developed DNA hydrogel-based SERS sensor array has limited sensitivity for the detection of miRNA-21 and difficulty in detecting lower concentrations of miRNA.
Wu et al. [88] proposed a surface-enhanced Raman scattering biosensor based on magnetic nanoparticles, which consisted of a magnetic capture unit and a SERS tag for the ultrasensitive combined detection of miRNA-122, miRNA-223, and miRNA-21 biomarkers associated with HCC. Figure 13a,b show the synthesis process of the SERS tag and magnetic capture unit. The capture probe was modified on the silver shell on the surface of the magnetic bead to form a magnetic capture unit to enhance the SERS signal. After adding a mixture of target miRNA-122, miRNA-223, and miRNA-21 to hybridize with the capture probe, SERS labels, respectively, modified by rhodamine 6G (R6G), crystalline violet (CV), and 4-amino thiophenol (4-ATP) were attached to the magnetic capture unit to form a sandwich structure of capture unit/miRNAs/SERS labels. The detection process is shown in Figure 13c. The proposed strategy can simultaneously detect three miRNAs in a linear range from 1 fM to 10 nM. In human serum, the detection limits of miRNA-122, miRNA-223, and miRNA-21 were 349 aM, 374 aM, and 311 aM, respectively. The F-AuNPs constructed in this study have reusable SERS performance. This SERS biosensor allows simultaneous multiplexed detection of three miRNAs with ultra-high sensitivity with a detection limit as low as the aM level. In addition, the biosensor showed good utility for multiplex detection of three miRNAs in 92 clinical sera. This study provides a new approach for the early diagnosis of cancer, the staging of HCC patients, and the prognosis of cancer, which is highly valuable for clinical application.
Huang et al. [89] proposed a dual-mode biosensor based on SERS and fluorescence sensing strategy for the detection of miRNA-224 associated with HCC. The CHA strategy was constructed on gold nano-arrays (AuNAs) as shown in Figure 14a,b, where uniformly distributed hotspots on the AuNAs enhance the SERS signaling, and their wide surface area is very favorable for miRNA-224 adsorption. Cy3-labeled hairpin DNA H1 can capture miRNA-224. When Rox-functionalized hairpin DNA H2 was added, it was also able to hybridize with H1 to release miRNA-224, which initiated CHA cyclic amplification. The intensity of the Raman and fluorescence signals was altered by controlling the distance of Rox from the AuNAs. This dual-mode biosensor detected target miRNA-224 in the linear range of 1 fM to 1 nM, with a detection limit of 0.34 fM in SERS mode and 0.39 fM in FL mode. This dual-mode biosensor is also applicable and reliable in the analysis of human plasma samples. Figure 14c shows that the biosensor can distinguish between HCC patients and healthy individuals, monitor HCC patients before and after hepatectomy, and guide the different clinical liver cancer staging of BCLC. The AuNAs prepared in this study have a large surface area and good biocompatibility, which can be used as a generalized substrate for sensors that detect a wide range of biomarkers. In addition, the dual-mode detection results can provide double judgment and make the detection results more reliable.

4.5. Electrochemiluminescence

In the above study, electrochemical biosensors have excellent sensitivity, but the detection signal is prone to interference, which is not conducive to achieving accurate measurements. In contrast, optical biosensors have good stability and high signal-to-noise ratios, and each biomolecule has specific spectral properties, but their detection sensitivity for biomolecules is low. Therefore, electrochemiluminescence sensing technology has been investigated by many scholars. ECL is chemiluminescence triggered by an electrochemical reaction [90]. ECL technology combines the advantages of electrochemistry and chemiluminescence and is of great interest for early disease diagnosis and detection of hazardous substances [91]. So far, ECL has been widely used in various fields such as food safety, environmental monitoring, and medical diagnosis [92].
Due to the surface plasmon effect of non-metallic sulfides in the visible and near-infrared regions, Li et al. [93] designed a novel electrochemiluminescence sensing system based on SnS2 nanomaterials incorporating the SPR effect for the detection of miRNA-21. SnS2-PEI was used as the plasma source, and Figure 15a shows the preparation process of SnS2-PEI. Figure 15b demonstrates the design principle of this ECL sensor, where the CHA cycle adsorbed more SA-PTCA by capturing more H2–biotin. There was a significant spectral overlap between the ECL emission spectrum of PTCA and the UV–Vis absorption spectrum of SnS2-PEI, which can produce the SPR effect. Figure 15c shows the ECL response of this sensor, and Figure 15d shows the fitted relationship between the ECL response and miRNA-21 concentration. This ECL sensing system detects miRNA-21 in the linear range of 1 aM–1 nM with a detection limit as low as 0.6 aM. In addition, the ECL biosensor exhibited excellent selectivity, stability, reproducibility, and utility for detecting real samples. Compared to the electrochemical biosensors and optical biosensors described above, the ECL biosensor has a significantly improved sensitivity with a detection limit as low as the aM level for miRNA-21. In addition, the ECL biosensor has excellent selectivity, stability, and reproducibility, and can be used for the detection of real samples.
In 2023, Wang et al. [94] developed an electrochemiluminescent biosensor based on three-dimensional (3D) DNA nanowalkers, which combined with DSN-mediated target cycling amplification to achieve sensitive detection of miRNA-21. Ferrocene-labeled DNA (Fc-DNA) was modified on Fe3O4 MBs to form 3D DNA tracks. When the target miRNA-21 appeared, DSN digested the hybridized double strand, releasing miRNA-21 and the bipedal DNA walker. miRNA-21 was again involved in the target cycle amplification, amplifying the response signal. As the DNA walker moved through the DNA track, the Fc-DNA hybridized to the DNA walker was cleaved by nucleic acid endonuclease and released Fc-DNA fragments. Fc-DNA fragments adsorbed to the surface of C-g-C3N4-modified electrodes, leading to quenching of the ECL signal from C-g-C3N4. The ECL biosensor has a wide linear range of 10 fM to 10 nM in miRNA-21 detection with a detection limit as low as 1.0 fM. This work provides an opportunity to construct miRNA biosensors based on DNA walkers. This bipedal walker significantly increases the walking efficiency, reduces the detection time, and improves the sensitivity of the assay as compared to the unipedal DNA walker. This work provides a new idea for constructing miRNA biosensors based on DNA walkers.
Graphene oxide quantum dots (GDYO QDs) are a derivative of graphene (GDY) with good electrical conductivity and luminescence properties. Lin et al. [95] constructed an ECL biosensor for the ultrasensitive determination of miRNA-21 based on GDYO QDs. The sensor utilized AuNPs/GDY as the electrode substrate material, which not only connected to the capture probe via Au-S bonds but also enhanced the conductivity of the electrode surface. Combined with DNA walker and HCR amplification technologies, the target miRNA-21 can drive DNA walker movement to generate many H1-H2 double strands. H3 and H4-GDYO QDs partially hybridized with H1-H2 via HCR, and the GDYO QDs enhanced ECL signals through electron transfer. This ECL biosensor can detect miRNA-21 in the linear range of 0.1 fM to 1 nM with a low detection limit of 0.023 fM. GDYO QDs prepared in this study have excellent conductivity, biocompatibility, and outstanding stability. Compared with other related studies, the ECL biosensor in this study detected miRNA-21 with a large linear range and a small detection limit.
Shen et al. [96] developed an ECL biosensor for the sensitive detection of miRNA-155 based on DNA nanoframe carrier luminophores (DNF-Dox-ABEI). Figure 16a demonstrates the preparation process of DNF-Dox-ABEI. Multiple luminescent molecules of Dox-ABEI were loaded on DNF-Dox-ABEI. As shown in Figure 16b, the double strand formed by the hybridization of DNA probes and cDNA could hybridize with miRNA-155. Then T7 exonuclease was able to digest the DNA probe, releasing miRNA-155 and cDNA at the same time. This process drove the targeting cycle, leading to signal amplification and the realization of the amplified ECL signal. Figure 16c shows the preparation process of TiO2@Ag nanocomposites. The modified TiO2@Ag on the GCE electrode exhibited excellent peroxide activity, and the generated reactive oxygen species further reacted with ABEI to generate an ECL signal. Figure 16d shows the schematic diagram of the ECL sensing strategy based on DNF-Dox-ABEI for the detection of miRNA-155. Figure 16e and Figure 16f, respectively, show the standard ECL response and calibration curves for the detection of miRNA-155 by this sensor. The ECL biosensor can detect miRNA-155 in the linear range of 1.0 fM to 500.0 pM with a detection limit as low as 0.45 fM. Various signal enhancement strategies such as nanocomposites and target cycling amplification were applied in this study, which significantly improved the sensitivity of the sensor to detect miRNA-155. This work provides a potential cancer biomarker detection tool for early cancer diagnosis.
Table 2 summarizes the characteristics of these optical biosensors used to detect HCC-associated miRNAs. The main characteristics include receptor type, electrode material, optical method, spectral peak, linear detection range, detection limit, and response time. Most optical biosensors have poorer detection sensitivity and longer detection time than electrochemical biosensors. However, the SERS method has relatively superior sensitivity for miRNA detection.

5. Summary and Outlook

This paper reviews the biosensors used for the detection of miRNAs associated with hepatocellular carcinoma in recent years, mainly including electrochemical and optical biosensors. A detailed analysis was provided for the sensor probe types, electrode designs, sensing strategies, and detection effects. Among the electrochemical methods mentioned above, voltammetry is susceptible to noise interference despite its high detection sensitivity. Electrochemical impedance spectroscopy is a quasi-steady-state method, and the mathematical processing of the measurement results is relatively simple. Among the optical methods, colorimetry has the advantages of low cost and fast response, and can be determined by the naked eye, but is limited by the relative simplicity of the sample composition and the color development of the solution is not susceptible to interference. Fluorescence methods are characterized by high analytical sensitivity and selectivity but require the labeling of the probe and are prone to false positive or false negative results. SPR does not require the labeling of the substance to be measured and can monitor the dynamic process of molecular binding in real time and continuously, but it is sensitive to the composition of the sample and interferences such as temperature. SERS has high sensitivity and good reproducibility, with the disadvantage of low signal-to-noise ratio, which is difficult to realize and requires strict control of experimental parameters. In addition, electrochemiluminescent biosensors do not require a light source and have low background, high sensitivity, and good reproducibility.
With the continuous development of nanomaterials, it provides greater possibilities to realize the ultra-sensitive detection of microRNAs. Nanomaterials with multidimensional structures and composite nanomaterials usually have excellent conductive or luminescent properties and provide a larger active surface area for the attachment of capture probes, thus increasing the sensitivity of the assay. In addition, noble metal nanomaterials such as AuNPs and AgNPs have shown good biocompatibility as well as low toxicity in cancer marker detection. Microfluidic chips provide a pathway for the realization of portable and miniaturized detection of microRNAs. It utilizes a micrometer-scale structure to realize the detection process of the target within a microchannel or reaction chamber, with the advantages of controllable liquid flow, high throughput, and minimal consumption of samples and reagents. It has been recognized as an ideal technology for the development of diagnostic tests for point-of-care testing. In the above study, the combination of multiple signal amplification strategies was used to improve the sensitivity and reliability of the assay. Bimodal detection can provide dual judgment to the researcher and make the test results more reliable. By improving the probe structure, the capture efficiency of the probe was improved while reducing the background noise. In summary, the development of multi-modal biosensors, the application of multi-signal amplification strategies, the combined detection of multiple biomarkers, and the improvement of probe structures have greatly improved the sensitivity and specificity of miRNA biosensors.
However, the process of preparation and assay operation is also more complicated for many novel assays proposed so far. In order to design novel and efficient biosensors with simple preparation, further research is needed by relevant researchers. In addition, the long assay time of most biosensors is not conducive to point-of-care detection, so the introduction of fast enrichment detection strategies to shorten the binding time of the target and the probe needs to be considered. Whether the prepared biosensors can achieve detection in real samples is also one of the issues that researchers need to consider due to the complexity of the actual sample composition, which is also a necessary path for the developed biosensors to be applied in clinical testing. In the future, more new nanomaterials, microfluidic analysis techniques, and signal amplification strategies will emerge, and these materials and strategies will also lead to the development of more novel miRNA biosensors with high detection performance, which will provide more opportunities for realizing the clinical application of early cancer diagnosis.

Author Contributions

Methodology, formal analysis, investigation, data curation, writing—original draft, K.W., M.Y. and C.L.; conceptualization, validation, writing—review and editing, supervision, project administration, funding acquisition, X.L. and J.W.; resources, writing—original draft, X.L. and J.W. All authors have read and agreed to the published version of the manuscript.

Funding

This research was funded by the Natural Science Foundation of Chongqing, China (grant number CSTB2022NSCQ-MSX0560), the National foreign expert project (grant number G2022165024L), Graduate Research and Innovation Foundation of Chongqing, China (grant number CYS22108).

Institutional Review Board Statement

Not applicable.

Informed Consent Statement

Not applicable.

Data Availability Statement

Not applicable.

Conflicts of Interest

The authors declare no conflict of interest. The funders had no role in the design of the study; in the collection, analyses, or interpretation of data; in the writing of the manuscript; or in the decision to publish the results.

References

  1. Massarweh, N.N.; El-Serag, H.B. Epidemiology of Hepatocellular Carcinoma and Intrahepatic Cholangiocarcinoma. Cancer Control 2017, 24, 1–11. [Google Scholar] [CrossRef] [PubMed]
  2. Han, T.-S.; Hur, K.; Cho, H.-S.; Ban, H.S. Epigenetic Associations between LncRNA/CircRNA and MiRNA in Hepatocellular Carcinoma. Cancers 2020, 12, 2622. [Google Scholar] [CrossRef] [PubMed]
  3. Al-Saeed, Y.; Gab-Allah, W.A.; Soliman, H.; Abulkhair, M.F.; Shalash, W.M.; Elmogy, M. Efficient Computer Aided Diagnosis System for Hepatic Tumors Using Computed Tomography Scans. Comput. Mater. Contin. 2022, 71, 4871–4894. [Google Scholar] [CrossRef]
  4. Zhang, G.; Liu, D. Comparative the Clinical Value of Contrast-Enhanced Ultrasonography, Enhancement CT and MRI for Diagnosing of Liver Lesions. Clin. Hemorheol. Microcirc. 2022, 80, 241–251. [Google Scholar] [CrossRef] [PubMed]
  5. Winder, M.; Grabowska, S.; Hitnarowicz, A.; Barczyk-Gutkowska, A.; Gruszczyńska, K.; Steinhof-Radwańska, K. The Application of Abbreviated MRI Protocols in Malignant Liver Lesions Surveillance. Eur. J. Radiol. 2023, 164, 110840. [Google Scholar] [CrossRef]
  6. Huang, L.; Sun, H.; Sun, L.; Shi, K.; Chen, Y.; Ren, X.; Ge, Y.; Jiang, D.; Liu, X.; Knoll, W.; et al. Rapid, Label-Free Histopathological Diagnosis of Liver Cancer Based on Raman Spectroscopy and Deep Learning. Nat. Commun. 2023, 14, 48. [Google Scholar] [CrossRef]
  7. Falahi, S.; Rafiee-Pour, H.-A.; Zarejousheghani, M.; Rahimi, P.; Joseph, Y. Non-Coding RNA-Based Biosensors for Early Detection of Liver Cancer. Biomedicines 2021, 9, 964. [Google Scholar] [CrossRef]
  8. Liao, Z.; Zhou, Q.; Gao, B. AIEgens-Doped Photonic Crystals for High Sensitivity Fluorescence Detection of Tumor Markers. Biosensors 2023, 13, 276. [Google Scholar] [CrossRef]
  9. Forner, A. Hepatocellular Carcinoma Surveillance with MiRNAs. Lancet Oncol. 2015, 16, 743–745. [Google Scholar] [CrossRef]
  10. Wu, X.; Li, J.; Gassa, A.; Buchner, D.; Alakus, H.; Dong, Q.; Ren, N.; Liu, M.; Odenthal, M.; Stippel, D.; et al. Circulating Tumor DNA as an Emerging Liquid Biopsy Biomarker for Early Diagnosis and Therapeutic Monitoring in Hepatocellular Carcinoma. Int. J. Biol. Sci. 2020, 16, 1551–1562. [Google Scholar] [CrossRef]
  11. Ghidini, M.; Braconi, C. Non-Coding RNAs in Primary Liver Cancer. Front. Med. 2015, 2, 36. [Google Scholar]
  12. Rowe, M.M.; Kaestner, K.H. The Role of Non-Coding RNAs in Liver Disease, Injury, and Regeneration. Cells 2023, 12, 359. [Google Scholar] [CrossRef] [PubMed]
  13. Ling, H.; Fabbri, M.; Calin, G.A. MicroRNAs and Other Non-Coding RNAs as Targets for Anticancer Drug Development. Nat. Rev. Drug Discov. 2013, 12, 847–865. [Google Scholar]
  14. Kamel, R.R.; Amr, K.S.; Afify, M.; Elhosary, Y.A.; Hegazy, A.E.; Fahim, H.H.; Ezzat, W.M. Relation between MicroRNAs and Apoptosis in Hepatocellular Carcinoma. Open Access Maced. J. Med. Sci. 2016, 4, 31–37. [Google Scholar] [CrossRef] [PubMed]
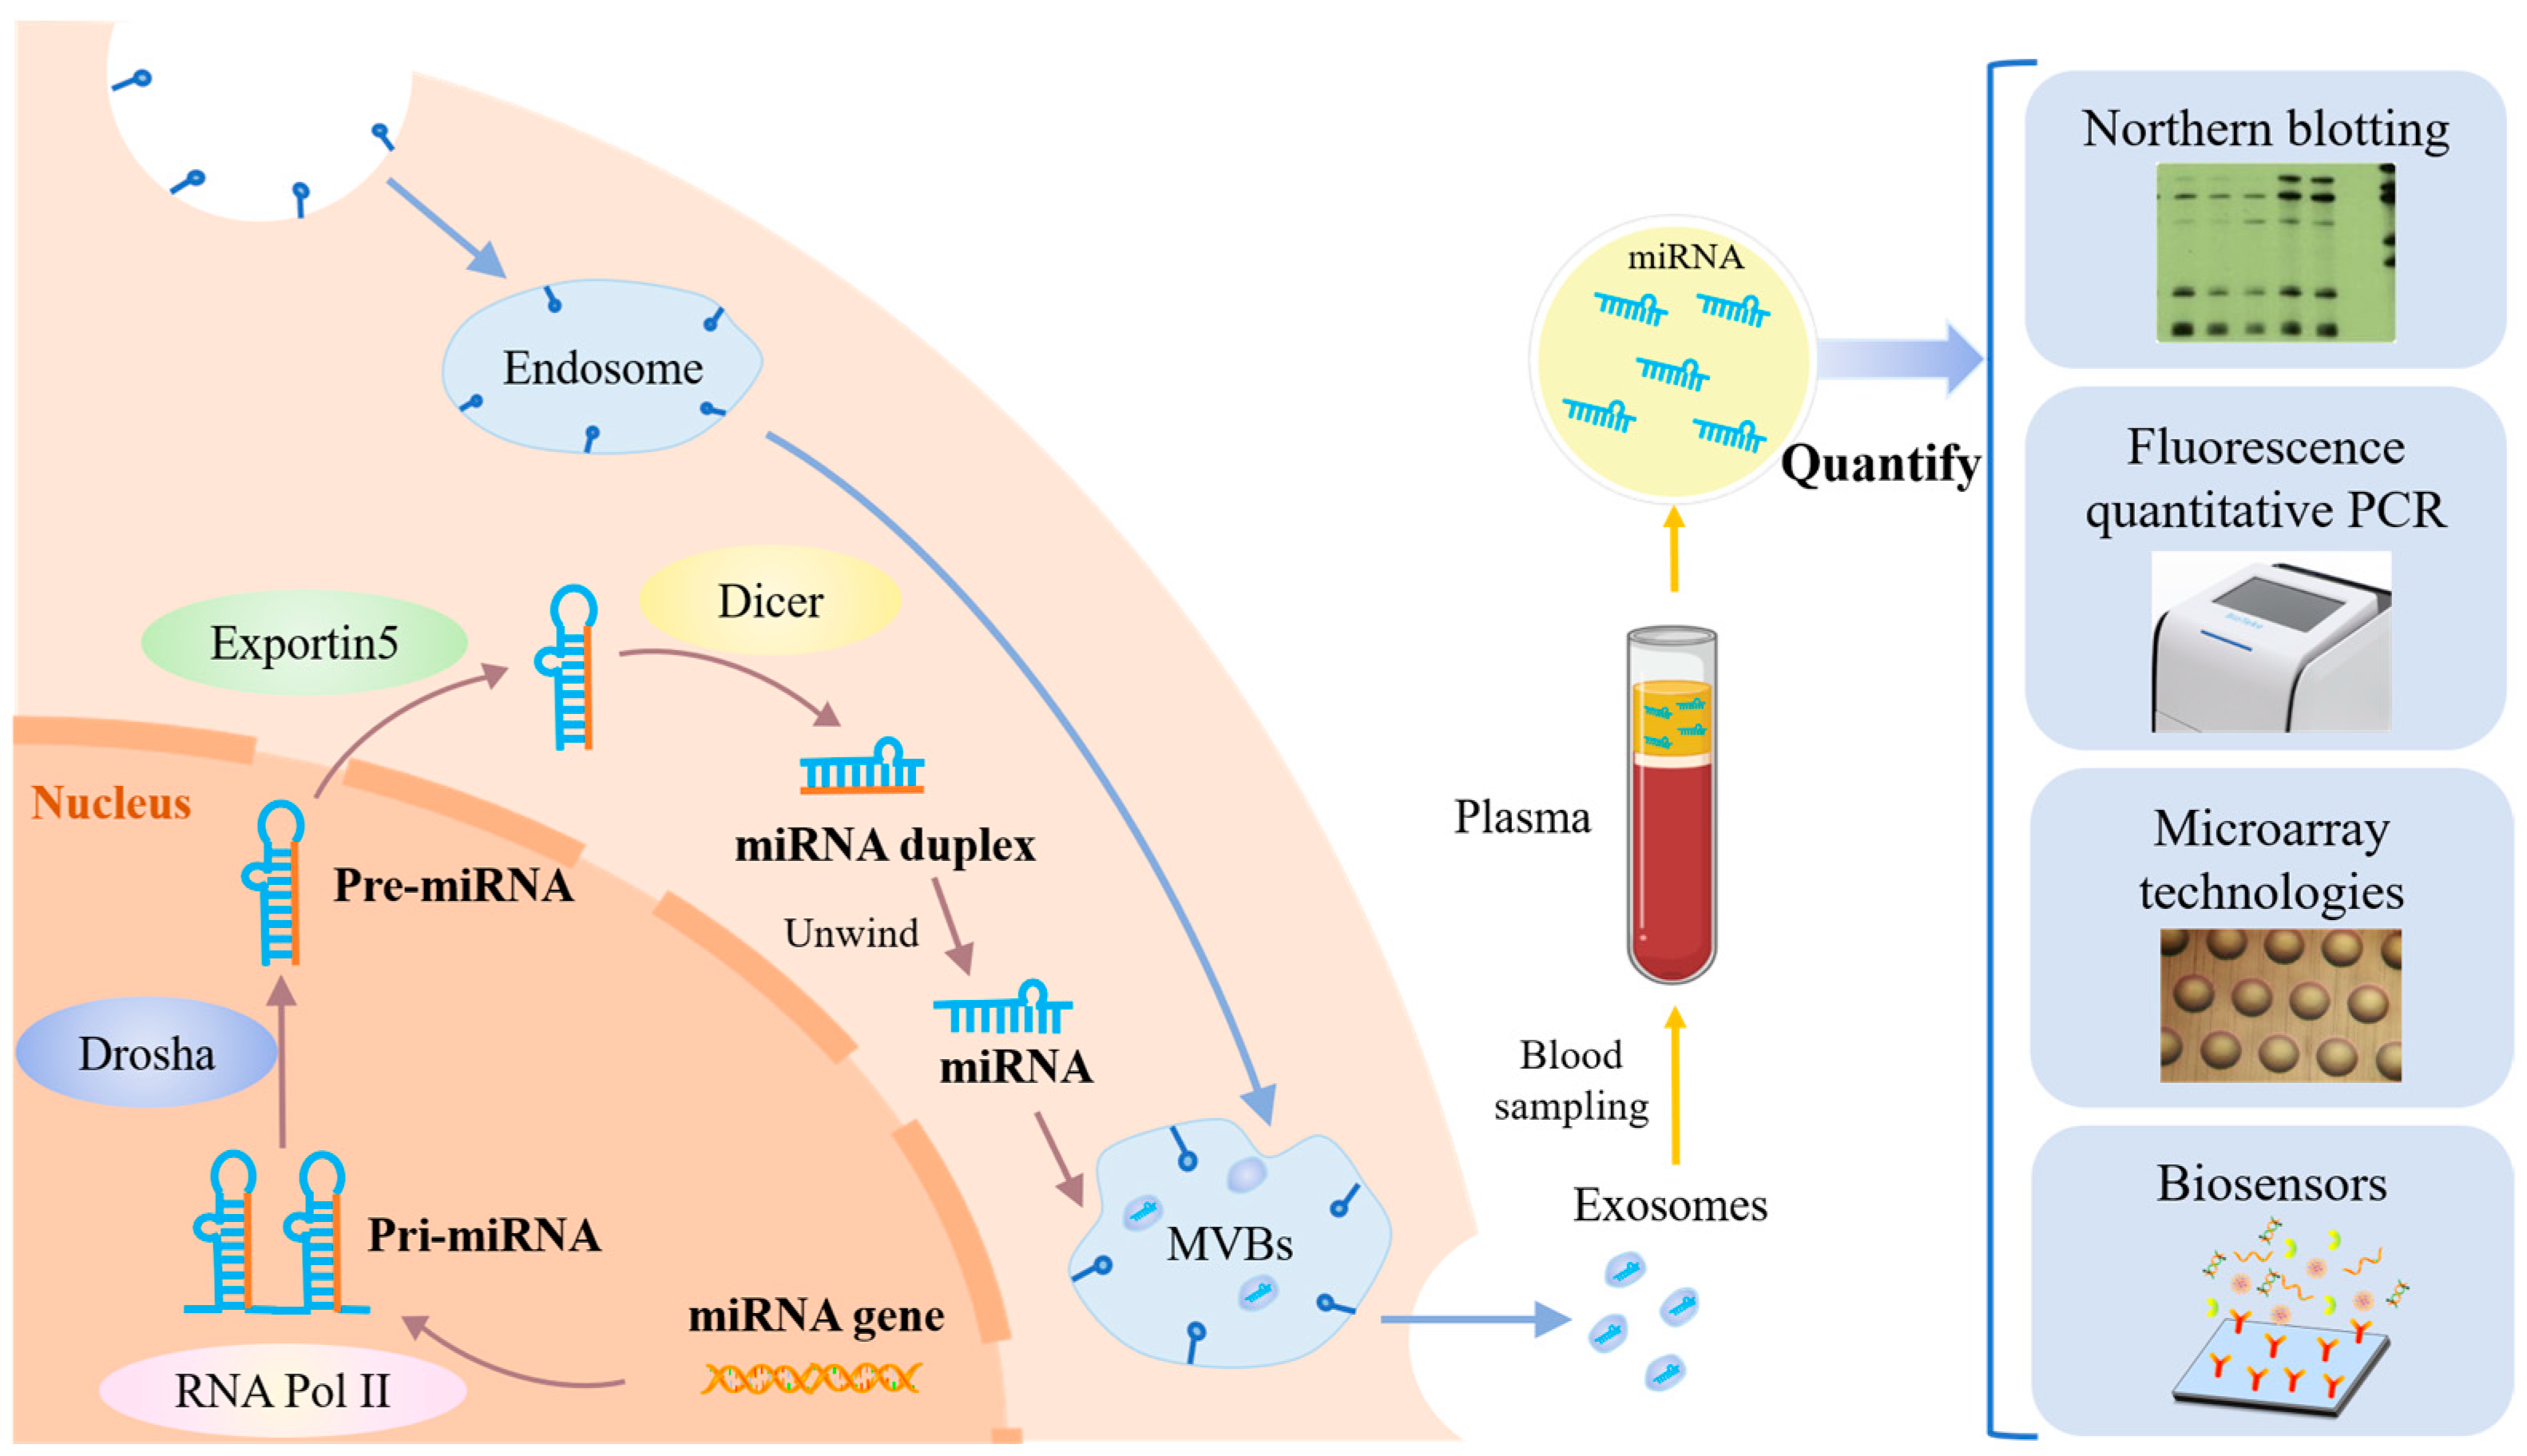
  15. O’Brien, J.; Hayder, H.; Zayed, Y.; Peng, C. Overview of MicroRNA Biogenesis, Mechanisms of Actions, and Circulation. Front. Endocrinol. 2018, 9, 402. [Google Scholar] [CrossRef]
  16. Song, C.; Chen, W.; Kuang, J.; Yao, Y.; Tang, S.; Zhao, Z.; Guo, X.; Shen, W.; Lee, H.K. Recent Advances in the Detection of Multiple MicroRNAs. TrAC Trends Anal. Chem. 2021, 139, 116269. [Google Scholar] [CrossRef]
  17. Chen, Y.-X.; Huang, K.-J.; Niu, K.-X. Recent Advances in Signal Amplification Strategy Based on Oligonucleotide and Nanomaterials for MicroRNA Detection-a Review. Biosens. Bioelectron. 2018, 99, 612–624. [Google Scholar] [PubMed]
  18. Kilic, T.; Erdem, A.; Ozsoz, M.; Carrara, S. MicroRNA Biosensors: Opportunities and Challenges among Conventional and Commercially Available Techniques. Biosens. Bioelectron. 2018, 99, 525–546. [Google Scholar] [CrossRef]
  19. Singh, R.P. Prospects of Nanobiomaterials for Biosensing. Int. J. Electrochem. 2011, 2011, 125487. [Google Scholar] [CrossRef]
  20. Zhang, L.; Su, W.; Liu, S.; Huang, C.; Ghalandari, B.; Divsalar, A.; Ding, X. Recent Progresses in Electrochemical DNA Biosensors for MicroRNA Detection. Phenomics 2022, 2, 18–32. [Google Scholar] [PubMed]
  21. Tian, R.; Zheng, X. Sensitive Colorimetric Detection of MicroRNA Based on Target Catalyzed Double-arm Hairpin DNA Assembling. Anal. Sci. 2016, 32, 751–755. [Google Scholar] [CrossRef] [PubMed]
  22. Guk, K.; Hwang, S.G.; Lim, J.; Son, H.; Choi, Y.; Huh, Y.-M.; Kang, T.; Jung, J.; Lim, E.-K. Fluorescence Amplified Sensing Platforms Enabling MiRNA Detection by Self-Circulation of a Molecular Beacon Circuit. Chem. Commun. 2019, 55, 3457–3460. [Google Scholar] [CrossRef] [PubMed]
  23. Nie, W.; Wang, Q.; Yang, X.; Zhang, H.; Li, Z.; Gao, L.; Zheng, Y.; Liu, X.; Wang, K. High Sensitivity Surface Plasmon Resonance Biosensor for Detection of MicroRNA Based on Gold Nanoparticles-Decorated Molybdenum Sulfide. Anal. Chim. Acta 2017, 993, 55–62. [Google Scholar] [CrossRef] [PubMed]
  24. Wu, Y.; Li, Y.; Han, H.; Zhao, C.; Zhang, X. Dual Cycle Amplification and Dual Signal Enhancement Assisted Sensitive SERS Assay of MicroRNA. Anal. Biochem. 2019, 564, 16–20. [Google Scholar] [CrossRef]
  25. Huang, Y.; Yao, Y.; Wang, Y.; Chen, L.; Zeng, Y.; Li, L.; Guo, L. Strategies for Enhancing the Sensitivity of Electrochemiluminescence Biosensors. Biosensors 2022, 12, 750. [Google Scholar] [CrossRef] [PubMed]
  26. Toh, T.B.; Lim, J.J.; Chow, E.K. Epigenetics of Hepatocellular Carcinoma. Clin. Transl. Med. 2019, 8, 13. [Google Scholar] [CrossRef] [PubMed]
  27. Zhang, J.; Li, D.; Zhang, R.; Gao, P.; Peng, R.; Li, J. The MiR-21 Potential of Serving as a Biomarker for Liver Diseases in Clinical Practice. Biochem. Soc. Trans. 2020, 48, 2295–2305. [Google Scholar] [CrossRef]
  28. Kalfert, D.; Ludvikova, M.; Pesta, M.; Ludvik, J.; Dostalova, L.; Kholová, I. Multifunctional Roles of MiR-34a in Cancer: A Review with the Emphasis on Head and Neck Squamous Cell Carcinoma and Thyroid Cancer with Clinical Implications. Diagnostics 2020, 10, 563. [Google Scholar] [CrossRef]
  29. Zhang, H.; Wang, Y.; Han, Y. MicroRNA-34a Inhibits Liver Cancer Cell Growth by Reprogramming Glucose Metabolism. Mol. Med. Rep. 2018, 17, 4483–4489. [Google Scholar] [CrossRef]
  30. Coulouarn, C.; Factor, V.M.; Andersen, J.B.; Durkin, M.E.; Thorgeirsson, S.S. Loss of MiR-122 Expression in Liver Cancer Correlates with Suppression of the Hepatic Phenotype and Gain of Metastatic Properties. Oncogene 2009, 28, 3526–3536. [Google Scholar] [CrossRef] [PubMed]
  31. Liang, L.; Wong, C.-M.; Ying, Q.; Fan, D.N.-Y.; Huang, S.; Ding, J.; Yao, J.; Yan, M.; Li, J.; Yao, M.; et al. MicroRNA-125b Suppressesed Human Liver Cancer Cell Proliferation and Metastasis by Directly Targeting Oncogene LIN28B2. Hepatology 2010, 52, 1731–1740. [Google Scholar] [CrossRef]
  32. Shaker, O.G.; Khairy, A.M.; Ali, R.M.M.; Badr, A.M. MiRNA-141 and Its Target Long Non-Coding RNA HOTAIR as Diagnostic Marker in Hepatocellular Carcinoma on Top of Hepatitis C Virus. Gene Rep. 2020, 21, 100807. [Google Scholar] [CrossRef]
  33. Ratnasari, N.; Lestari, P.; Renovaldi, D.; Raditya Ningsih, J.; Qoriansas, N.; Wardana, T.; Hakim, S.; Signa Aini Gumilas, N.; Indrarti, F.; Triwikatmani, C.; et al. Potential Plasma Biomarkers: MiRNA-29c, MiRNA-21, and MiRNA-155 in Clinical Progression of Hepatocellular Carcinoma Patients. PLoS ONE 2022, 17, e0263298. [Google Scholar] [CrossRef] [PubMed]
  34. Elmougy, F.A.F.; Mohamed, R.A.; Hassan, M.M.; Elsheikh, S.M.; Marzban, R.N.; Ahmed, F.M.; Elaraby, R.E. Study of Serum MicroRNA19a and MicroRNA223 as Potential Biomarkers for Early Diagnosis of Hepatitis C Virus-Related Hepatocellular Carcinoma. Gene Rep. 2019, 15, 100398. [Google Scholar] [CrossRef]
  35. Shehab-Eldeen, S.; Nada, A.; Abou-Elela, D.; El-Naidany, S.; Arafat, E.; Omar, T. Diagnostic Performance of MicroRNA-122 and MicroRNA-224 in Hepatitis C Virus-Induced Hepatocellular Carcinoma (HCC). Asian Pac. J. Cancer Prev. 2019, 20, 2515–2522. [Google Scholar] [CrossRef]
  36. Qiu, D.; Chen, J.; Liu, J.; Luo, Z.; Jiang, W.; Huang, J.; Qiu, Z.; Yue, W.; Wu, L. Expression of MicroRNA Let-7a Positively Correlates with Hepatitis B Virus Replication in Hepatocellular Carcinoma Tissues. Exp. Biol. Med. 2017, 242, 939–944. [Google Scholar] [CrossRef]
  37. Wang, Y.; Mo, Y.; Wang, L.; Su, P.; Xie, Y. Let-7b Contributes to Hepatocellular Cancer Progression through Wnt/β-Catenin Signaling. Saudi J. Biol. Sci. 2018, 25, 953–958. [Google Scholar] [CrossRef]
  38. Wang, K.; Peng, Z.; Lin, X.; Nian, W.; Zheng, X.; Wu, J. Electrochemical Biosensors for Circulating Tumor DNA Detection. Biosensors 2022, 12, 649. [Google Scholar] [CrossRef]
  39. Singh, A.; Sharma, A.; Ahmed, A.; Sundramoorthy, A.K.; Furukawa, H.; Arya, S.; Khosla, A. Recent Advances in Electrochemical Biosensors: Applications, Challenges, and Future Scope. Biosensors 2021, 11, 336. [Google Scholar] [CrossRef]
  40. Gulaboski, R. Future of Voltammetry. Maced. J. Chem. Chem. Eng. 2022, 41, 151–162. [Google Scholar] [CrossRef]
  41. Kanoun, O. Impedance Spectroscopy: From Laboratory Instrumentation to Field Sensors. IEEE Instrum. Meas. Mag. 2020, 23, 4–7. [Google Scholar] [CrossRef]
  42. Feng, X.; Gan, N.; Zhang, H.; Li, T.; Cao, Y.; Hu, F.; Jiang, Q. Ratiometric Biosensor Array for Multiplexed Detection of MicroRNAs Based on Electrochemiluminescence Coupled with Cyclic Voltammetry. Biosens. Bioelectron. 2016, 75, 308–314. [Google Scholar] [CrossRef] [PubMed]
  43. Aamri, M.E.; Mohammadi, H.; Amine, A. Novel Label-Free Colorimetric and Electrochemical Detection for MiRNA-21 Based on the Complexation of Molybdate with Phosphate. Microchem. J. 2022, 182, 107851. [Google Scholar] [CrossRef]
  44. Torul, H.; Yarali, E.; Eksin, E.; Ganguly, A.; Benson, J.; Tamer, U.; Papakonstantinou, P.; Erdem, A. Paper-Based Electrochemical Biosensors for Voltammetric Detection of MiRNA Biomarkers Using Reduced Graphene Oxide or MoS2 Nanosheets Decorated with Gold Nanoparticle Electrodes. Biosensors 2021, 11, 236. [Google Scholar] [CrossRef]
  45. Amr, K.S.; Elmawgoud Atia, H.A.; Elazeem Elbnhawy, R.A.; Ezzat, W.M. Early Diagnostic Evaluation of MiR-122 and MiR-224 as Biomarkers for Hepatocellular Carcinoma. Genes Dis. 2017, 4, 215–221. [Google Scholar] [CrossRef]
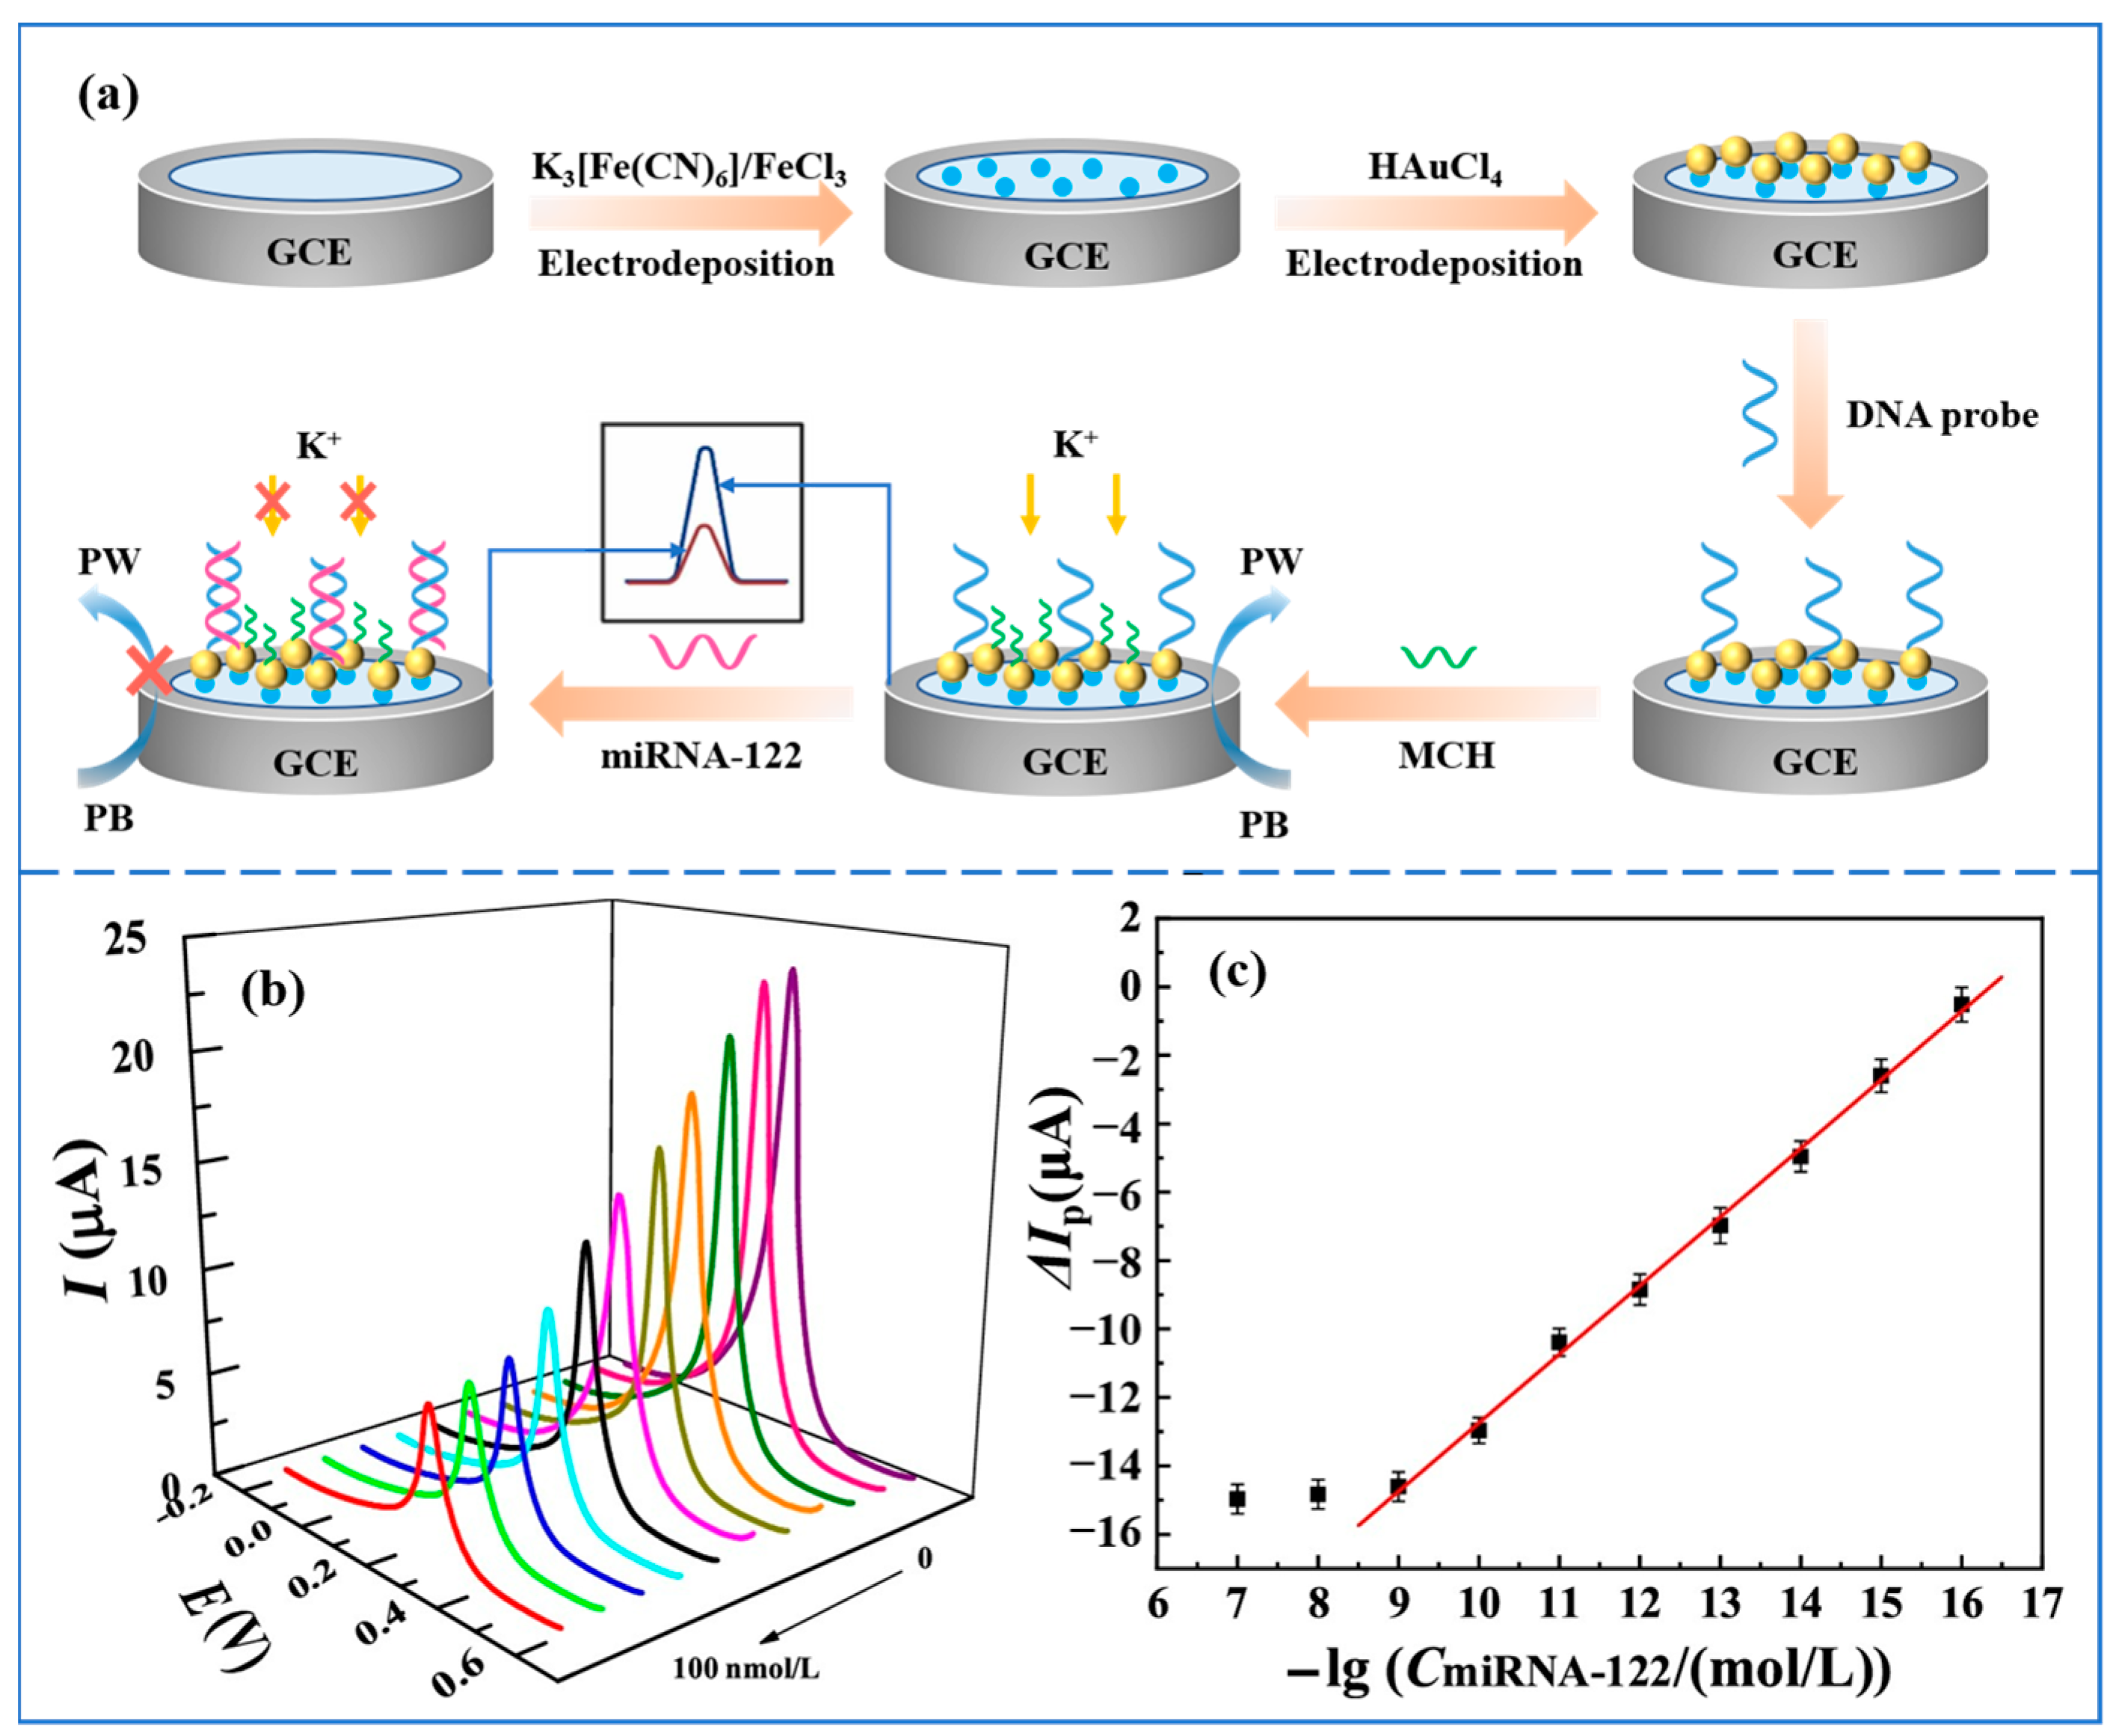
  46. Gao, F.; Chu, Y.; Ai, Y.; Yang, W.; Lin, Z.; Wang, Q. Hybridization Induced Ion-Barrier Effect for the Label-Free and Sensitive Electrochemical Sensing of Hepatocellular Carcinoma Biomarker of MiRNA-122. Chin. Chem. Lett. 2021, 32, 2192–2196. [Google Scholar] [CrossRef]
  47. Gonzalez-Losada, P.; Freisa, M.; Poujouly, C.; Gamby, J. An Integrated Multiple Electrochemical MiRNA Sensing System Embedded into a Microfluidic Chip. Biosensors 2022, 12, 145. [Google Scholar] [CrossRef]
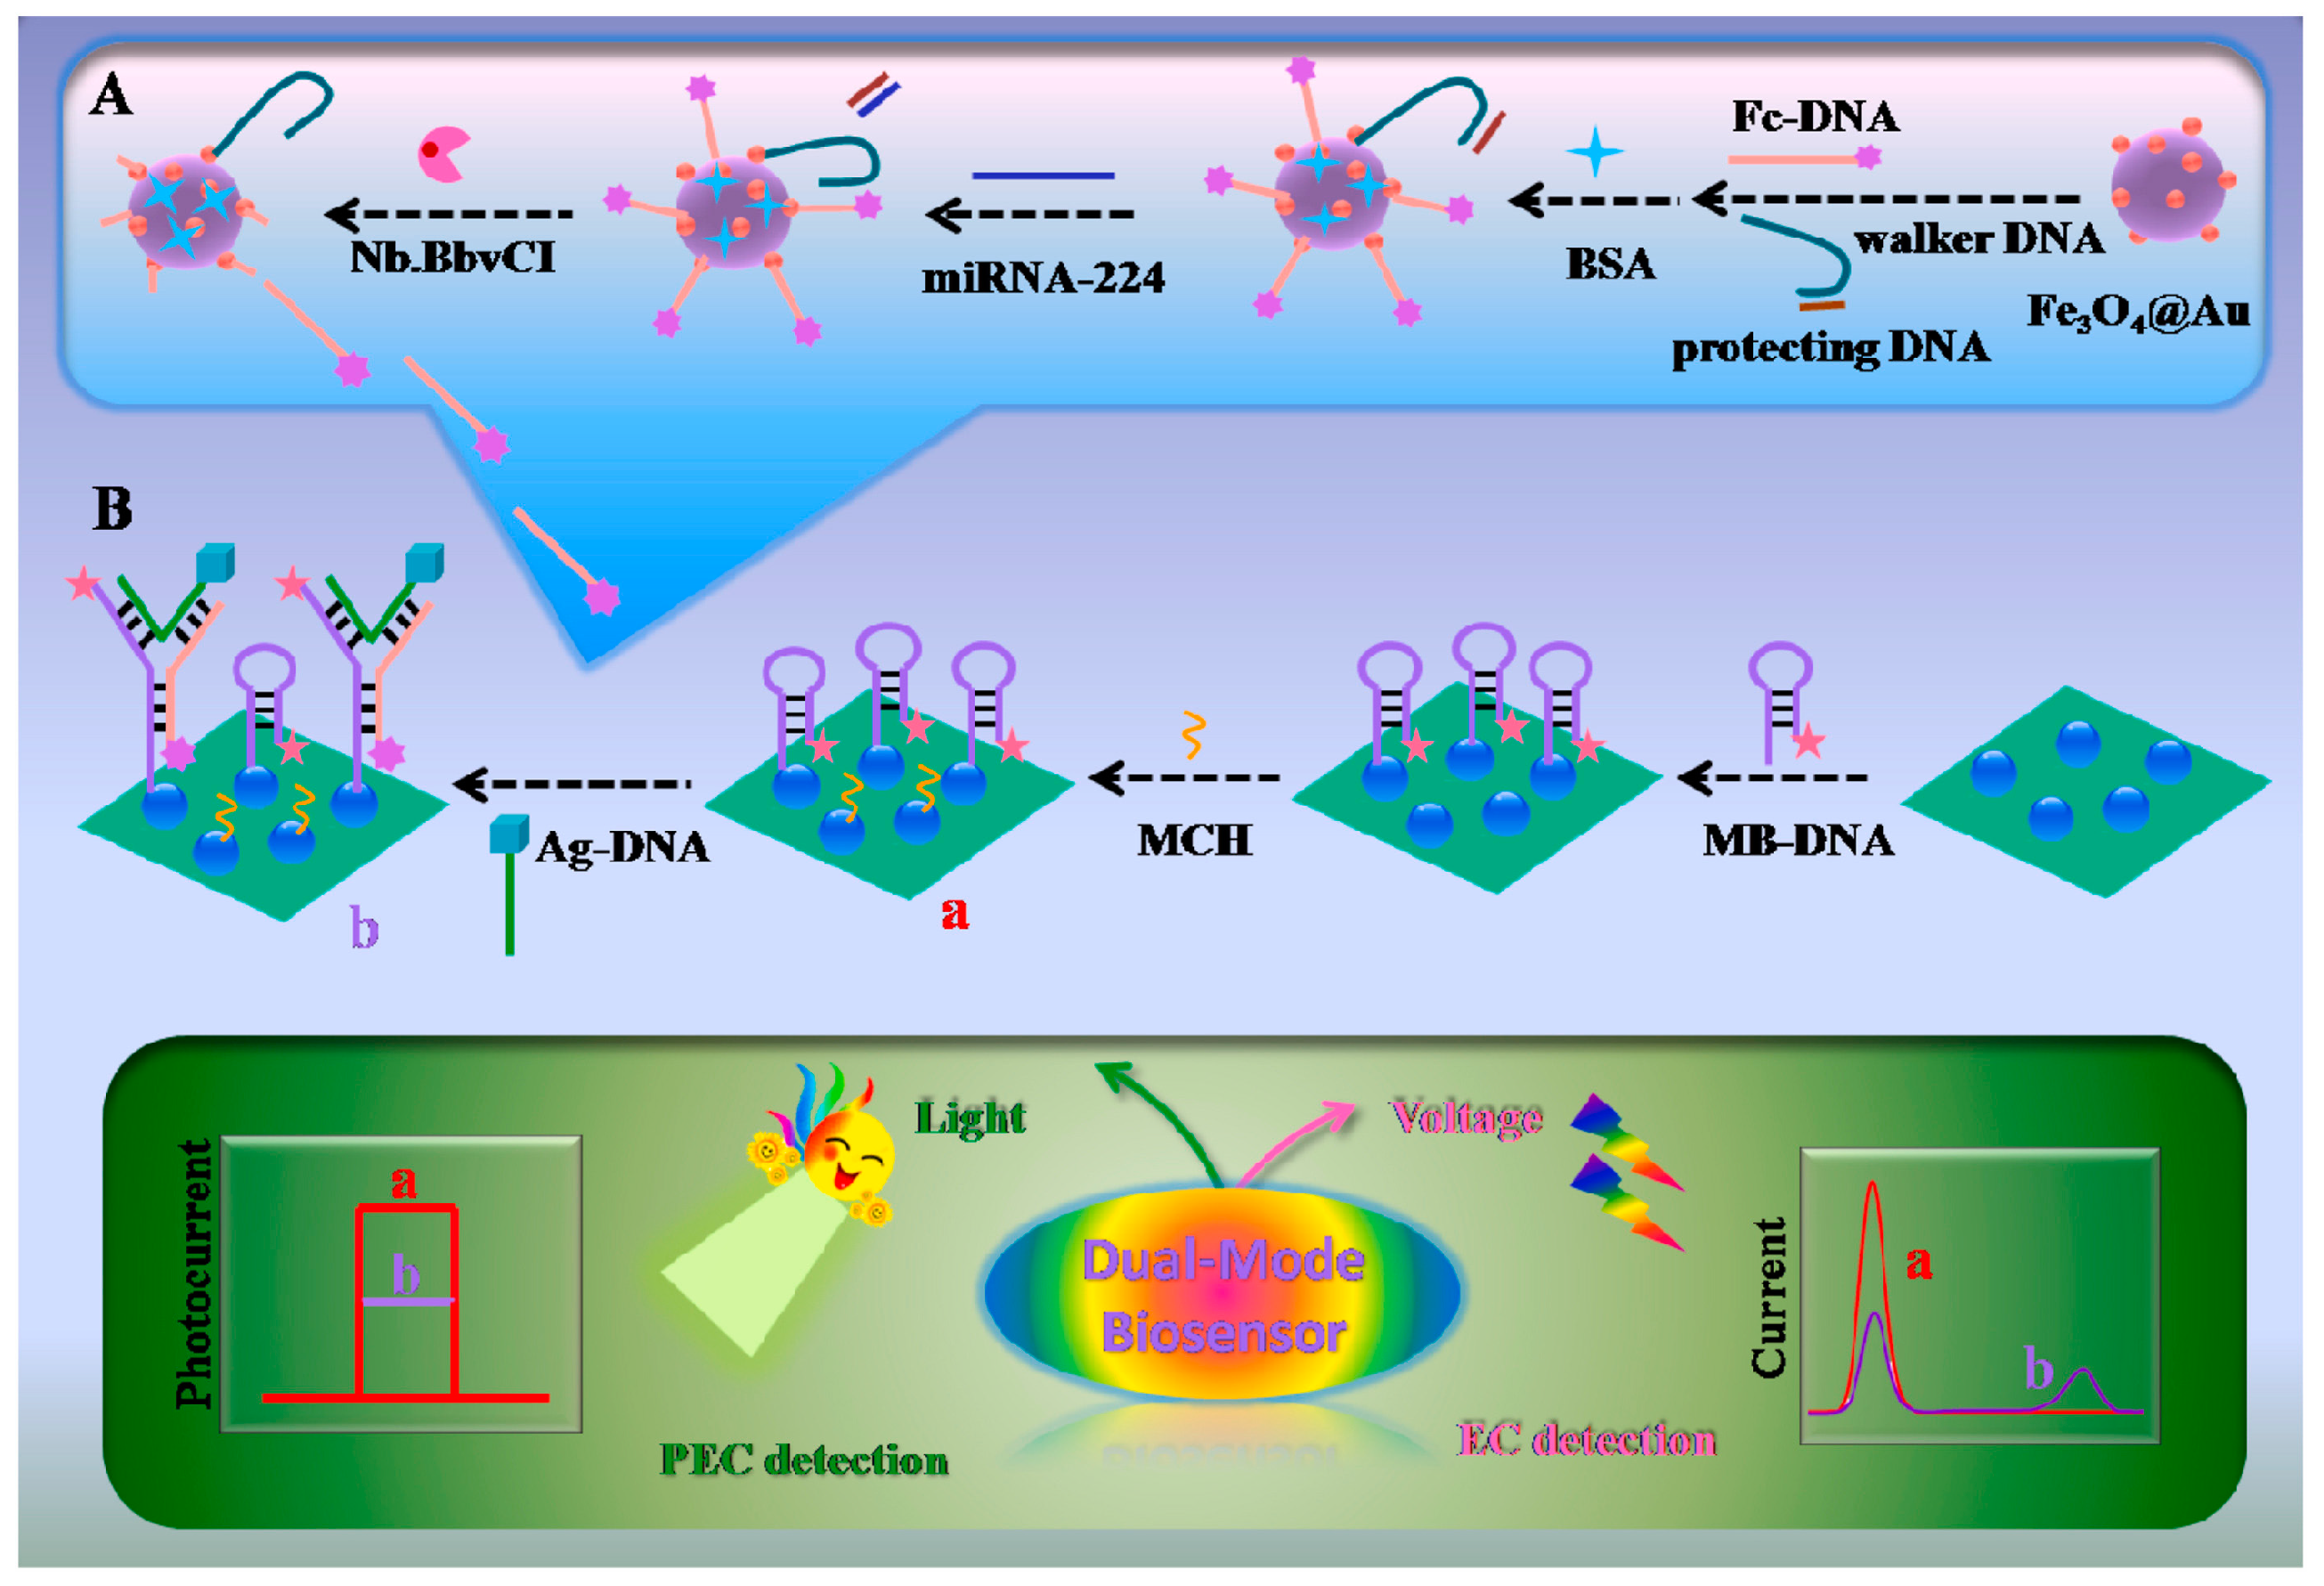
  48. Yang, R.; Jiang, G.; Liu, H.; He, L.; Yu, F.; Liu, L.; Qu, L.; Wu, Y. A Dual-Model “on-Super off” Photoelectrochemical/Ratiometric Electrochemical Biosensor for Ultrasensitive and Accurate Detection of MicroRNA-224. Biosens. Bioelectron. 2021, 188, 113337. [Google Scholar] [CrossRef]
  49. Wu, J.; Lv, W.; Yang, Q.; Li, H.; Li, F. Label-Free Homogeneous Electrochemical Detection of MicroRNA Based on Target-Induced Anti-Shielding against the Catalytic Activity of Two-Dimension Nanozyme. Biosens. Bioelectron. 2021, 171, 112707. [Google Scholar] [CrossRef]
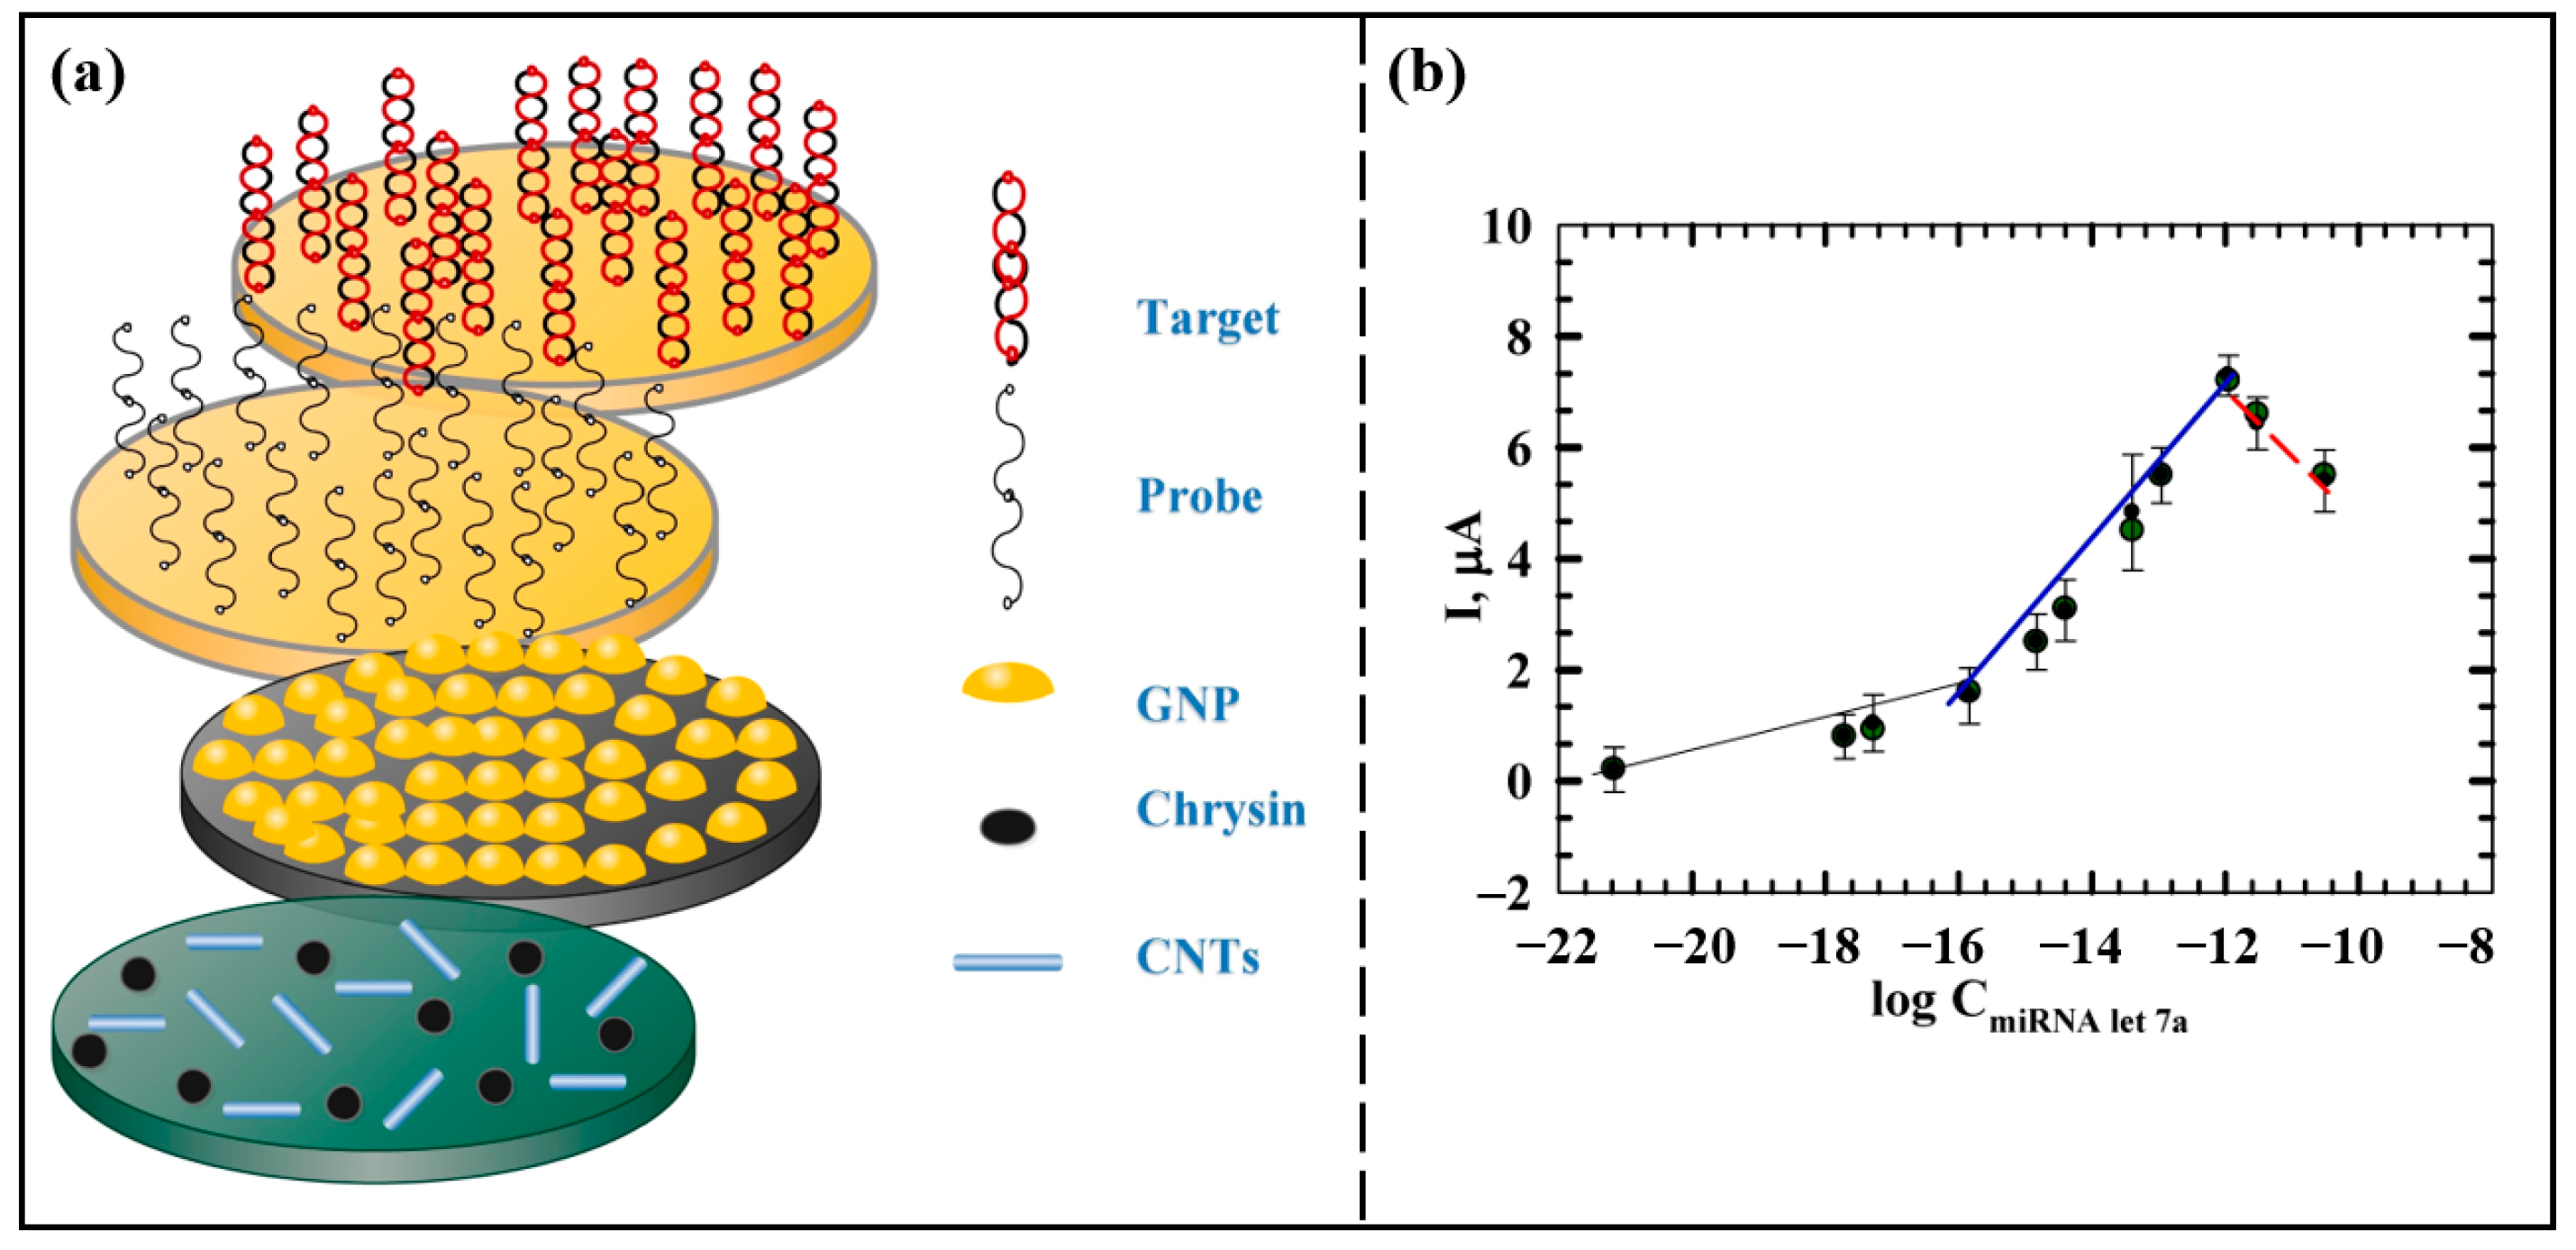
  50. Azab, S.M.; Elhakim, H.K.A.; Fekry, A.M. The Strategy of Nanoparticles and the Flavone Chrysin to Quantify MiRNA-Let 7a in Zepto-Molar Level: Its Application as Tumor Marker. J. Mol. Struct. 2019, 1196, 647–652. [Google Scholar] [CrossRef]
  51. Cai, B.; Huang, L.; Zhang, H.; Sun, Z.; Zhang, Z.; Zhang, G.-J. Gold Nanoparticles-Decorated Graphene Field-Effect Transistor Biosensor for Femtomolar MicroRNA Detection. Biosens. Bioelectron. 2015, 74, 329–334. [Google Scholar] [CrossRef] [PubMed]
  52. Cadoni, E.; Manicardi, A.; Madder, A. PNA-Based MicroRNA Detection Methodologies. Molecules 2020, 25, 1296. [Google Scholar] [CrossRef] [PubMed]
  53. Erdem, A.; Eksin, E. Zip Nucleic Acid-Based Genomagnetic Assay for Electrochemical Detection of MicroRNA-34a. Biosensors 2023, 13, 144. [Google Scholar] [CrossRef]
  54. Zeng, R.; Xu, J.; Lu, L.; Lin, Q.; Huang, X.; Huang, L.; Li, M.; Tang, D. Photoelectrochemical Bioanalysis of MicroRNA on Yolk-in-Shell Au@CdS Based on the Catalytic Hairpin Assembly-Mediated CRISPR-Cas12a System. Chem. Commun. 2022, 58, 7562–7565. [Google Scholar] [CrossRef] [PubMed]
  55. Ouyang, R.; Jiang, L.; Xie, X.; Yuan, P.; Zhao, Y.; Li, Y.; Tamayo, A.I.B.; Liu, B.; Miao, Y. Ti3C2@Bi2O3 Nanoaccordion for Electrochemical Determination of MiRNA-21. Microchim. Acta 2023, 190, 52. [Google Scholar] [CrossRef]
  56. Bahadır, E.B.; Sezgintürk, M.K. A Review on Impedimetric Biosensors. Artif. Cell. Nanomed. Biotechnol. 2016, 44, 248–262. [Google Scholar] [CrossRef]
  57. Ciucci, F. Modeling Electrochemical Impedance Spectroscopy. Curr. Opin. Electrochem. 2019, 13, 132–139. [Google Scholar] [CrossRef]
  58. Brett, C.M.A. Electrochemical Impedance Spectroscopy in the Characterisation and Application of Modified Electrodes for Electrochemical Sensors and Biosensors. Molecules 2022, 27, 1497. [Google Scholar] [CrossRef]
  59. La, M.; Zhang, Y.; Gao, Y.; Li, M.; Liu, L.; Chang, Y. Impedimetric Detection of MicroRNAs by the Signal Amplification of Streptavidin Induced In Situ Formation of Biotin Phenylalanine Nanoparticle Networks. J. Electrochem. Soc. 2020, 167, 117505. [Google Scholar] [CrossRef]
  60. Eksin, E.; Torul, H.; Yarali, E.; Tamer, U.; Papakonstantinou, P.; Erdem, A. Paper-Based Electrode Assemble for Impedimetric Detection of MiRNA. Talanta 2021, 225, 122043. [Google Scholar] [CrossRef]
  61. Yarali, E.; Eksin, E.; Torul, H.; Ganguly, A.; Tamer, U.; Papakonstantinou, P.; Erdem, A. Impedimetric Detection of MiRNA Biomarkers Using Paper-Based Electrodes Modified with Bulk Crystals or Nanosheets of Molybdenum Disulfide. Talanta 2022, 241, 123233. [Google Scholar] [CrossRef] [PubMed]
  62. Jin, Y.; Wu, Z.; Li, L.; Yan, R.; Zhu, J.; Wen, W.; Zhang, X.; Wang, S. Zinc-Air Battery-Based Self-Powered Sensor with High Output Power for Ultrasensitive MicroRNA Let-7a Detection in Cancer Cells. Anal. Chem. 2022, 94, 14368–14376. [Google Scholar] [CrossRef] [PubMed]
  63. Han, L. Ultrasensitive Label-Free MiRNA Sensing Based on a Flexible Graphene Field-Effect Transistor without Functionalization. ACS Appl. Electron. Mater. 2020, 2, 1090–1098. [Google Scholar]
  64. Xu, J.; Liu, Y.; Li, Y.; Liu, Y.; Huang, K.-J. Smartphone-Assisted Flexible Electrochemical Sensor Platform by a Homology DNA Nanomanager Tailored for Multiple Cancer Markers Field Inspection. Anal. Chem. 2023, 95, 13305–13312. [Google Scholar] [CrossRef]
  65. Yan, T.; Guo, C.; Wang, C.; Zhu, K. Optical Biosensing Systems for a Biological Living Body. View 2023, 4, 20220059. [Google Scholar] [CrossRef]
  66. Chen, C.; Wang, J. Optical Biosensors: An Exhaustive and Comprehensive Review. Analyst 2020, 145, 1605–1628. [Google Scholar] [CrossRef]
  67. Yan, T.; Zhang, G.; Chai, H.; Qu, L.; Zhang, X. Flexible Biosensors Based on Colorimetry, Fluorescence, and Electrochemistry for Point-of-Care Testing. Front. Bioeng. Biotechnol. 2021, 9, 753692. [Google Scholar] [CrossRef]
  68. Zhu, D.; Liu, B.; Wei, G. Two-Dimensional Material-Based Colorimetric Biosensors: A Review. Biosensors 2021, 11, 259. [Google Scholar] [CrossRef]
  69. Shahsavar, K.; Shokri, E.; Hosseini, M. Sensitive Colorimetric Detection of MiRNA-155 via G-Quadruplex DNAzyme Decorated Spherical Nucleic Acid. Microchim. Acta 2022, 189, 357. [Google Scholar] [CrossRef]
  70. Li, Z.-H.; Yang, M.; Zhao, C.-X.; Shu, Y. Bifunctional Y-Shaped Probe Combined with Dual Amplification for Colorimetric Sensing and Molecular Logic Operation of Two MiRNAs. Talanta 2023, 259, 124480. [Google Scholar] [CrossRef]
  71. Yang, X. Target-Catalyzed Self-Assembled Spherical G-Quadruplex/Hemin DNAzymes for Highly Sensitive Colorimetric Detection of MicroRNA in Serum. Anal. Chim. Acta 2023, 1247, 340879. [Google Scholar] [CrossRef]
  72. Son, M.H.; Park, S.W.; Sagong, H.Y.; Jung, Y.K. Recent Advances in Electrochemical and Optical Biosensors for Cancer Biomarker Detection. BioChip J. 2023, 17, 44–67. [Google Scholar] [CrossRef]
  73. Camarca, A.; Varriale, A.; Capo, A.; Pennacchio, A.; Calabrese, A.; Giannattasio, C.; Murillo Almuzara, C.; D’Auria, S.; Staiano, M. Emergent Biosensing Technologies Based on Fluorescence Spectroscopy and Surface Plasmon Resonance. Sensors 2021, 21, 906. [Google Scholar] [CrossRef]
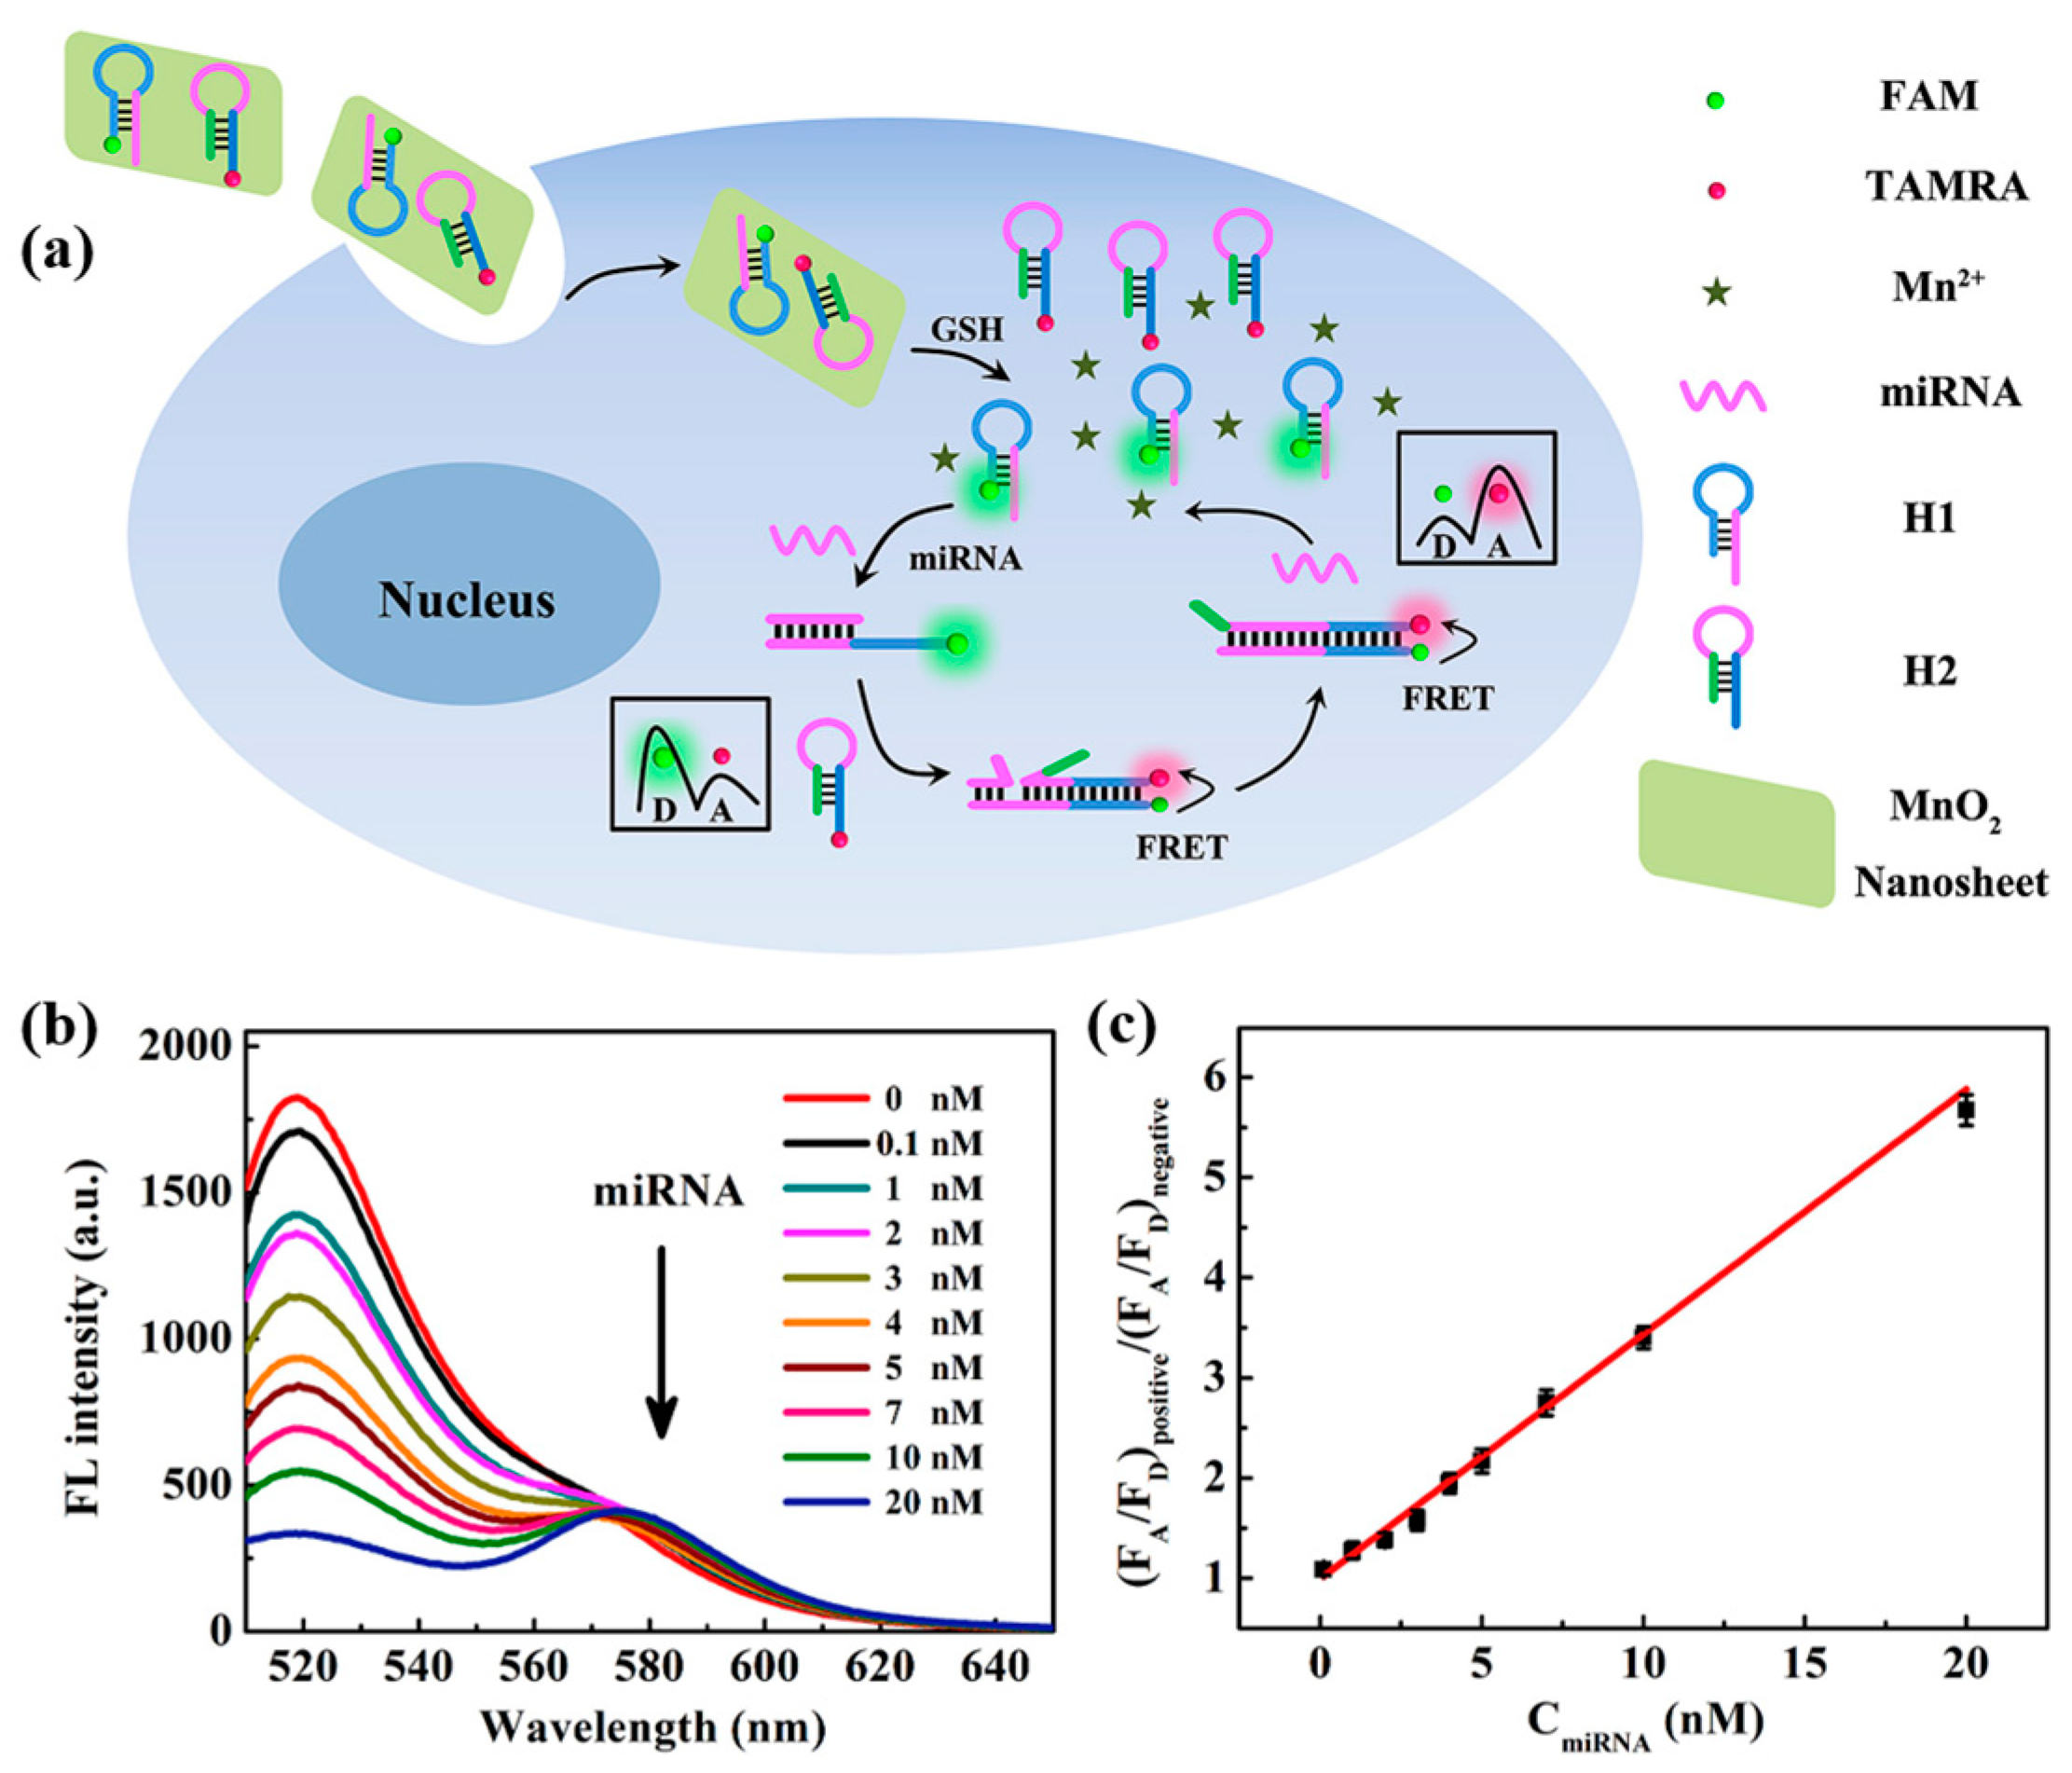
  74. Wang, S.; Wang, L.; Xu, X.; Li, X.; Jiang, W. MnO2 Nanosheet-Mediated Ratiometric Fluorescence Biosensor for MicroRNA Detection and Imaging in Living Cells. Anal. Chim. Acta 2019, 1063, 152–158. [Google Scholar] [CrossRef]
  75. Li, Y.; Tang, D.; Zhu, L.; Cai, J.; Chu, C.; Wang, J.; Xia, M.; Cao, Z.; Zhu, H. Label-Free Detection of MiRNA Cancer Markers Based on Terminal Deoxynucleotidyl Transferase-Induced Copper Nanoclusters. Anal. Biochem. 2019, 585, 113346. [Google Scholar] [CrossRef]
  76. Forte, G.; Ventimiglia, G.; Pesaturo, M.; Petralia, S. A Highly Sensitive PNA-microarray System for MiRNA122 Recognition. Biotechnol. J. 2022, 17, 2100587. [Google Scholar] [CrossRef]
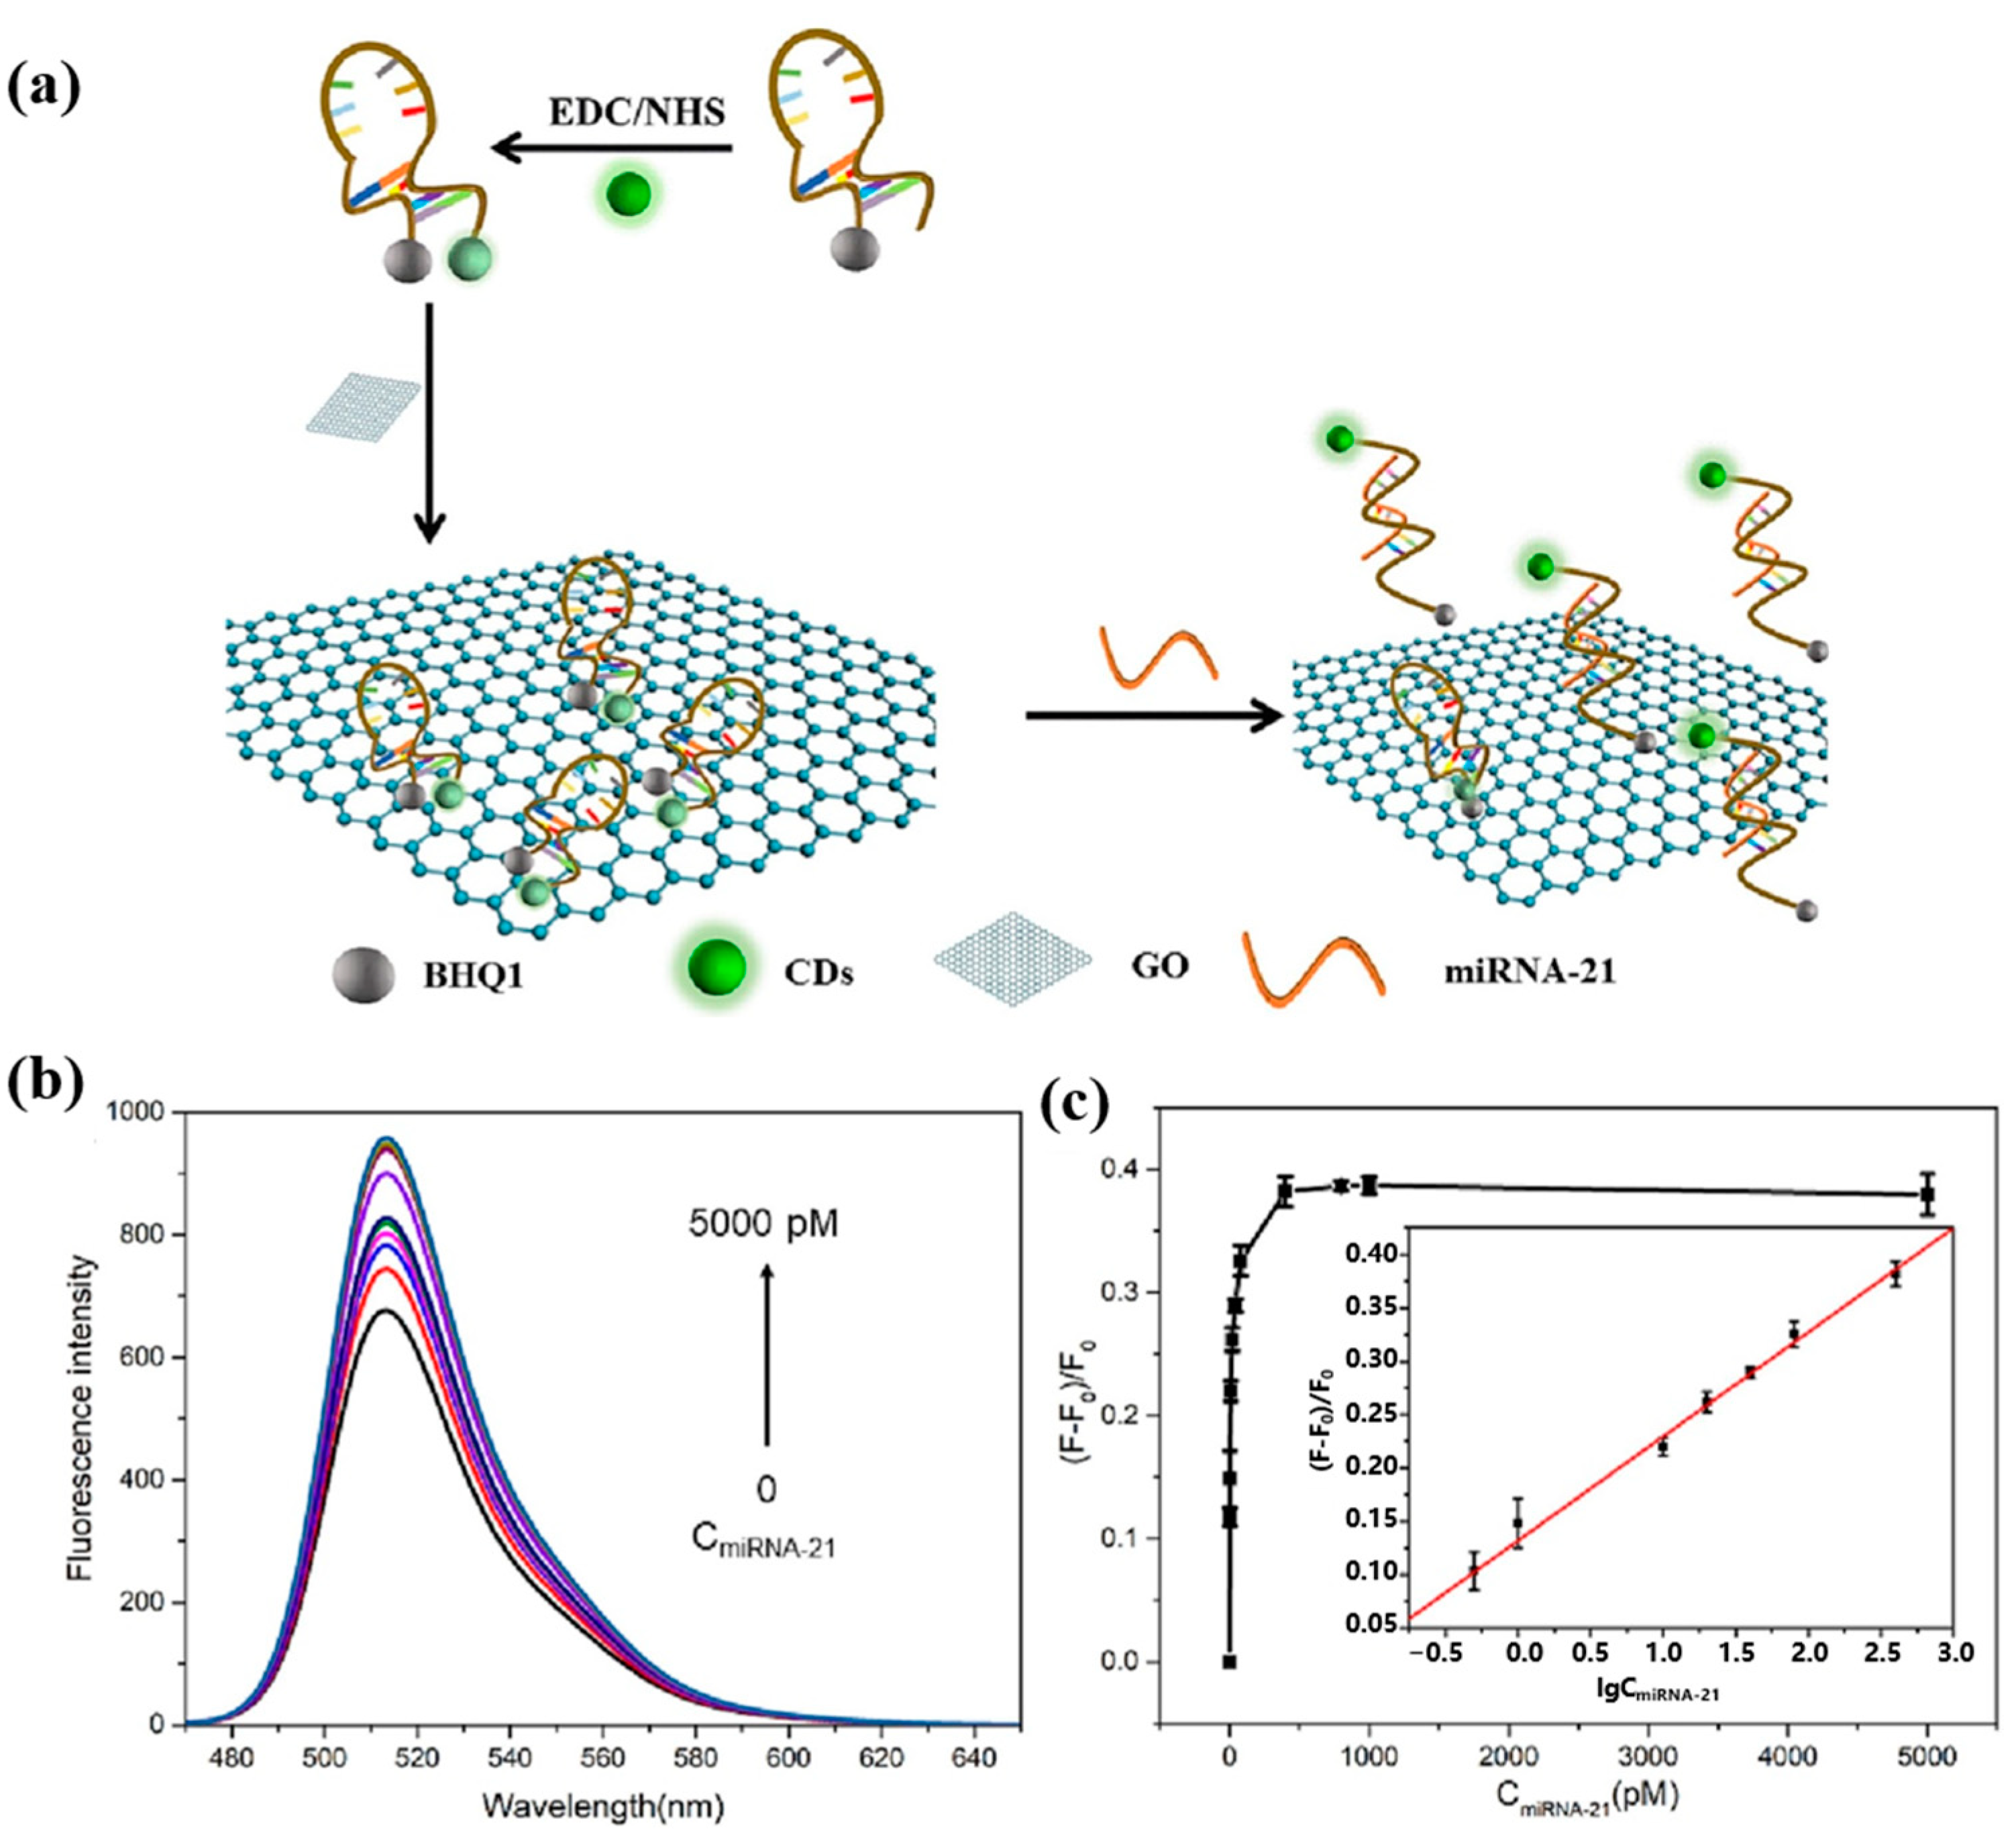
  77. He, M.; Shang, N.; Zheng, B.; Yue, G.; Han, X.; Hu, X. Ultrasensitive Fluorescence Detection of MicroRNA through DNA-Induced Assembly of Carbon Dots on Gold Nanoparticles with No Signal Amplification Strategy. Microchim. Acta 2022, 189, 217. [Google Scholar] [CrossRef]
  78. He, M.; Zheng, B.; Shang, N.; Xiao, Y.; Wei, Y.; Hu, X. Synergistic Effect Enhancing the Energy Transfer Efficiency of Carbon Dots-Based Molecular Beacon Probe for Ultrasensitive Detection of MicroRNA. Microchem. J. 2023, 190, 108593. [Google Scholar] [CrossRef]
  79. Nurrohman, D.T.; Chiu, N.-F. A Review of Graphene-Based Surface Plasmon Resonance and Surface-Enhanced Raman Scattering Biosensors: Current Status and Future Prospects. Nanomaterials 2021, 11, 216. [Google Scholar] [CrossRef]
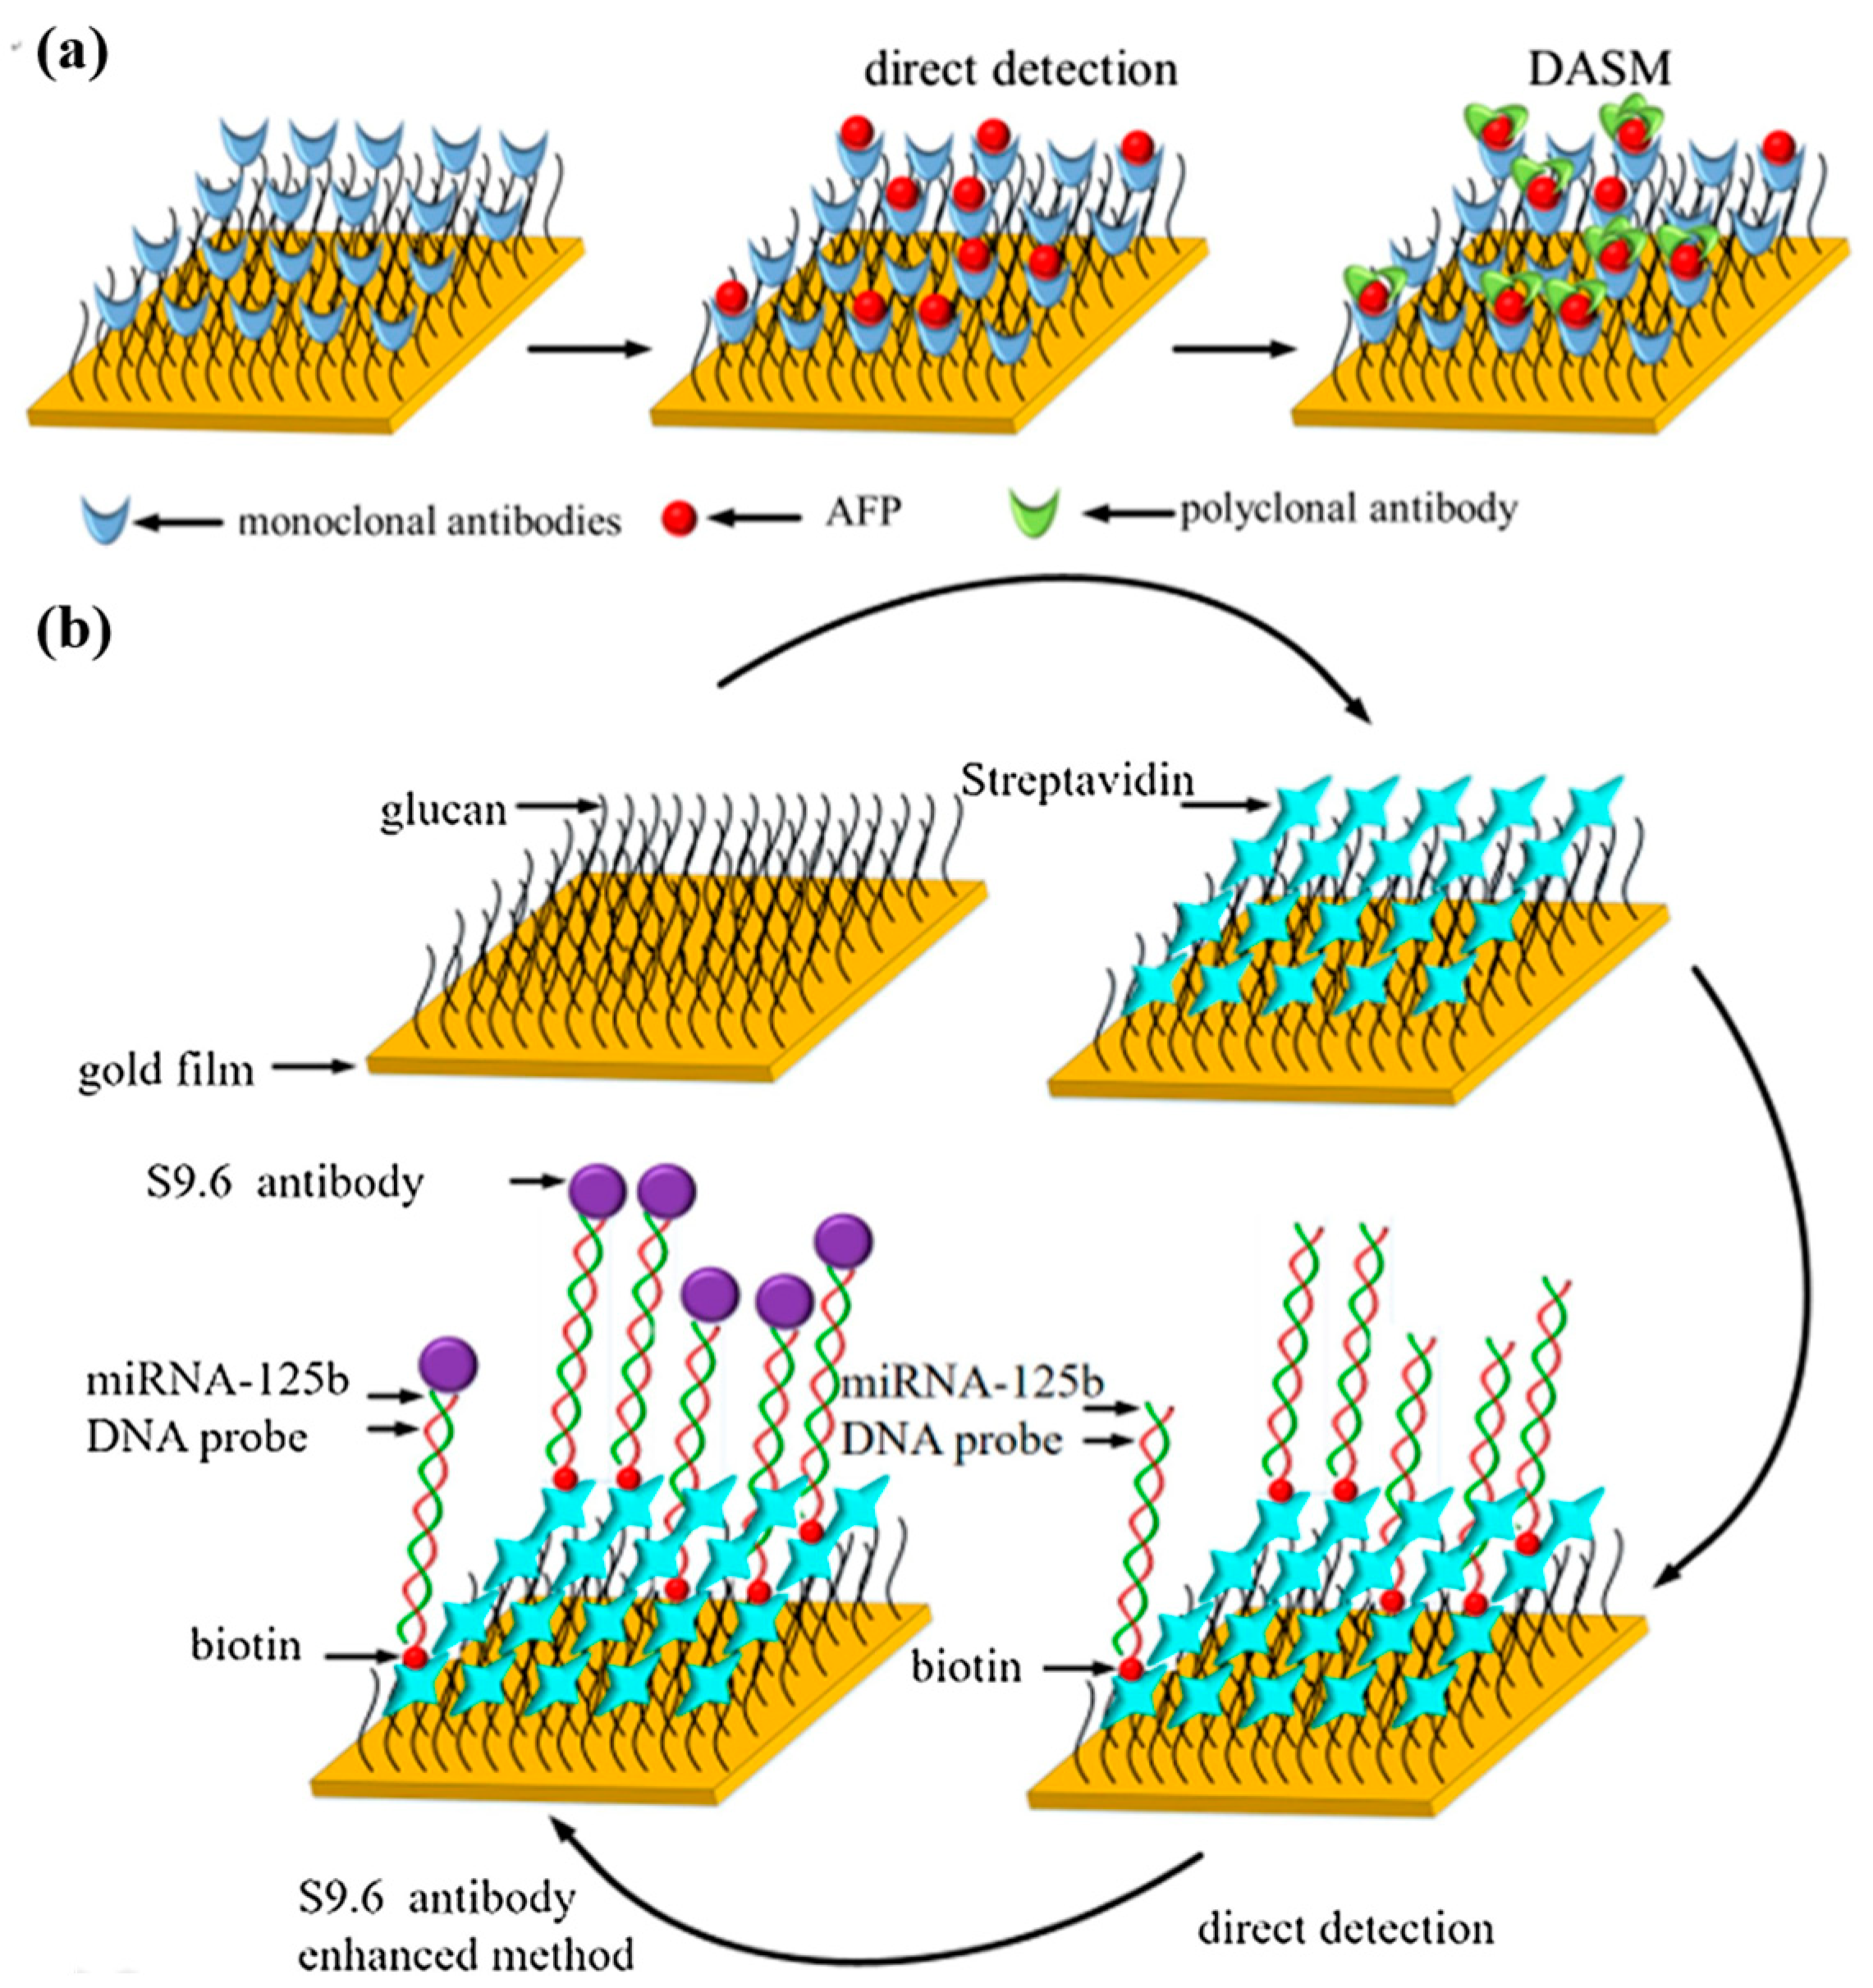
  80. Yu, H.; Han, R.; Su, J.; Chen, H.; Li, D. Multi-Marker Diagnosis Method for Early Hepatocellular Carcinoma Based on Surface Plasmon Resonance. Clin. Chim. Acta 2020, 502, 9–14. [Google Scholar] [CrossRef] [PubMed]
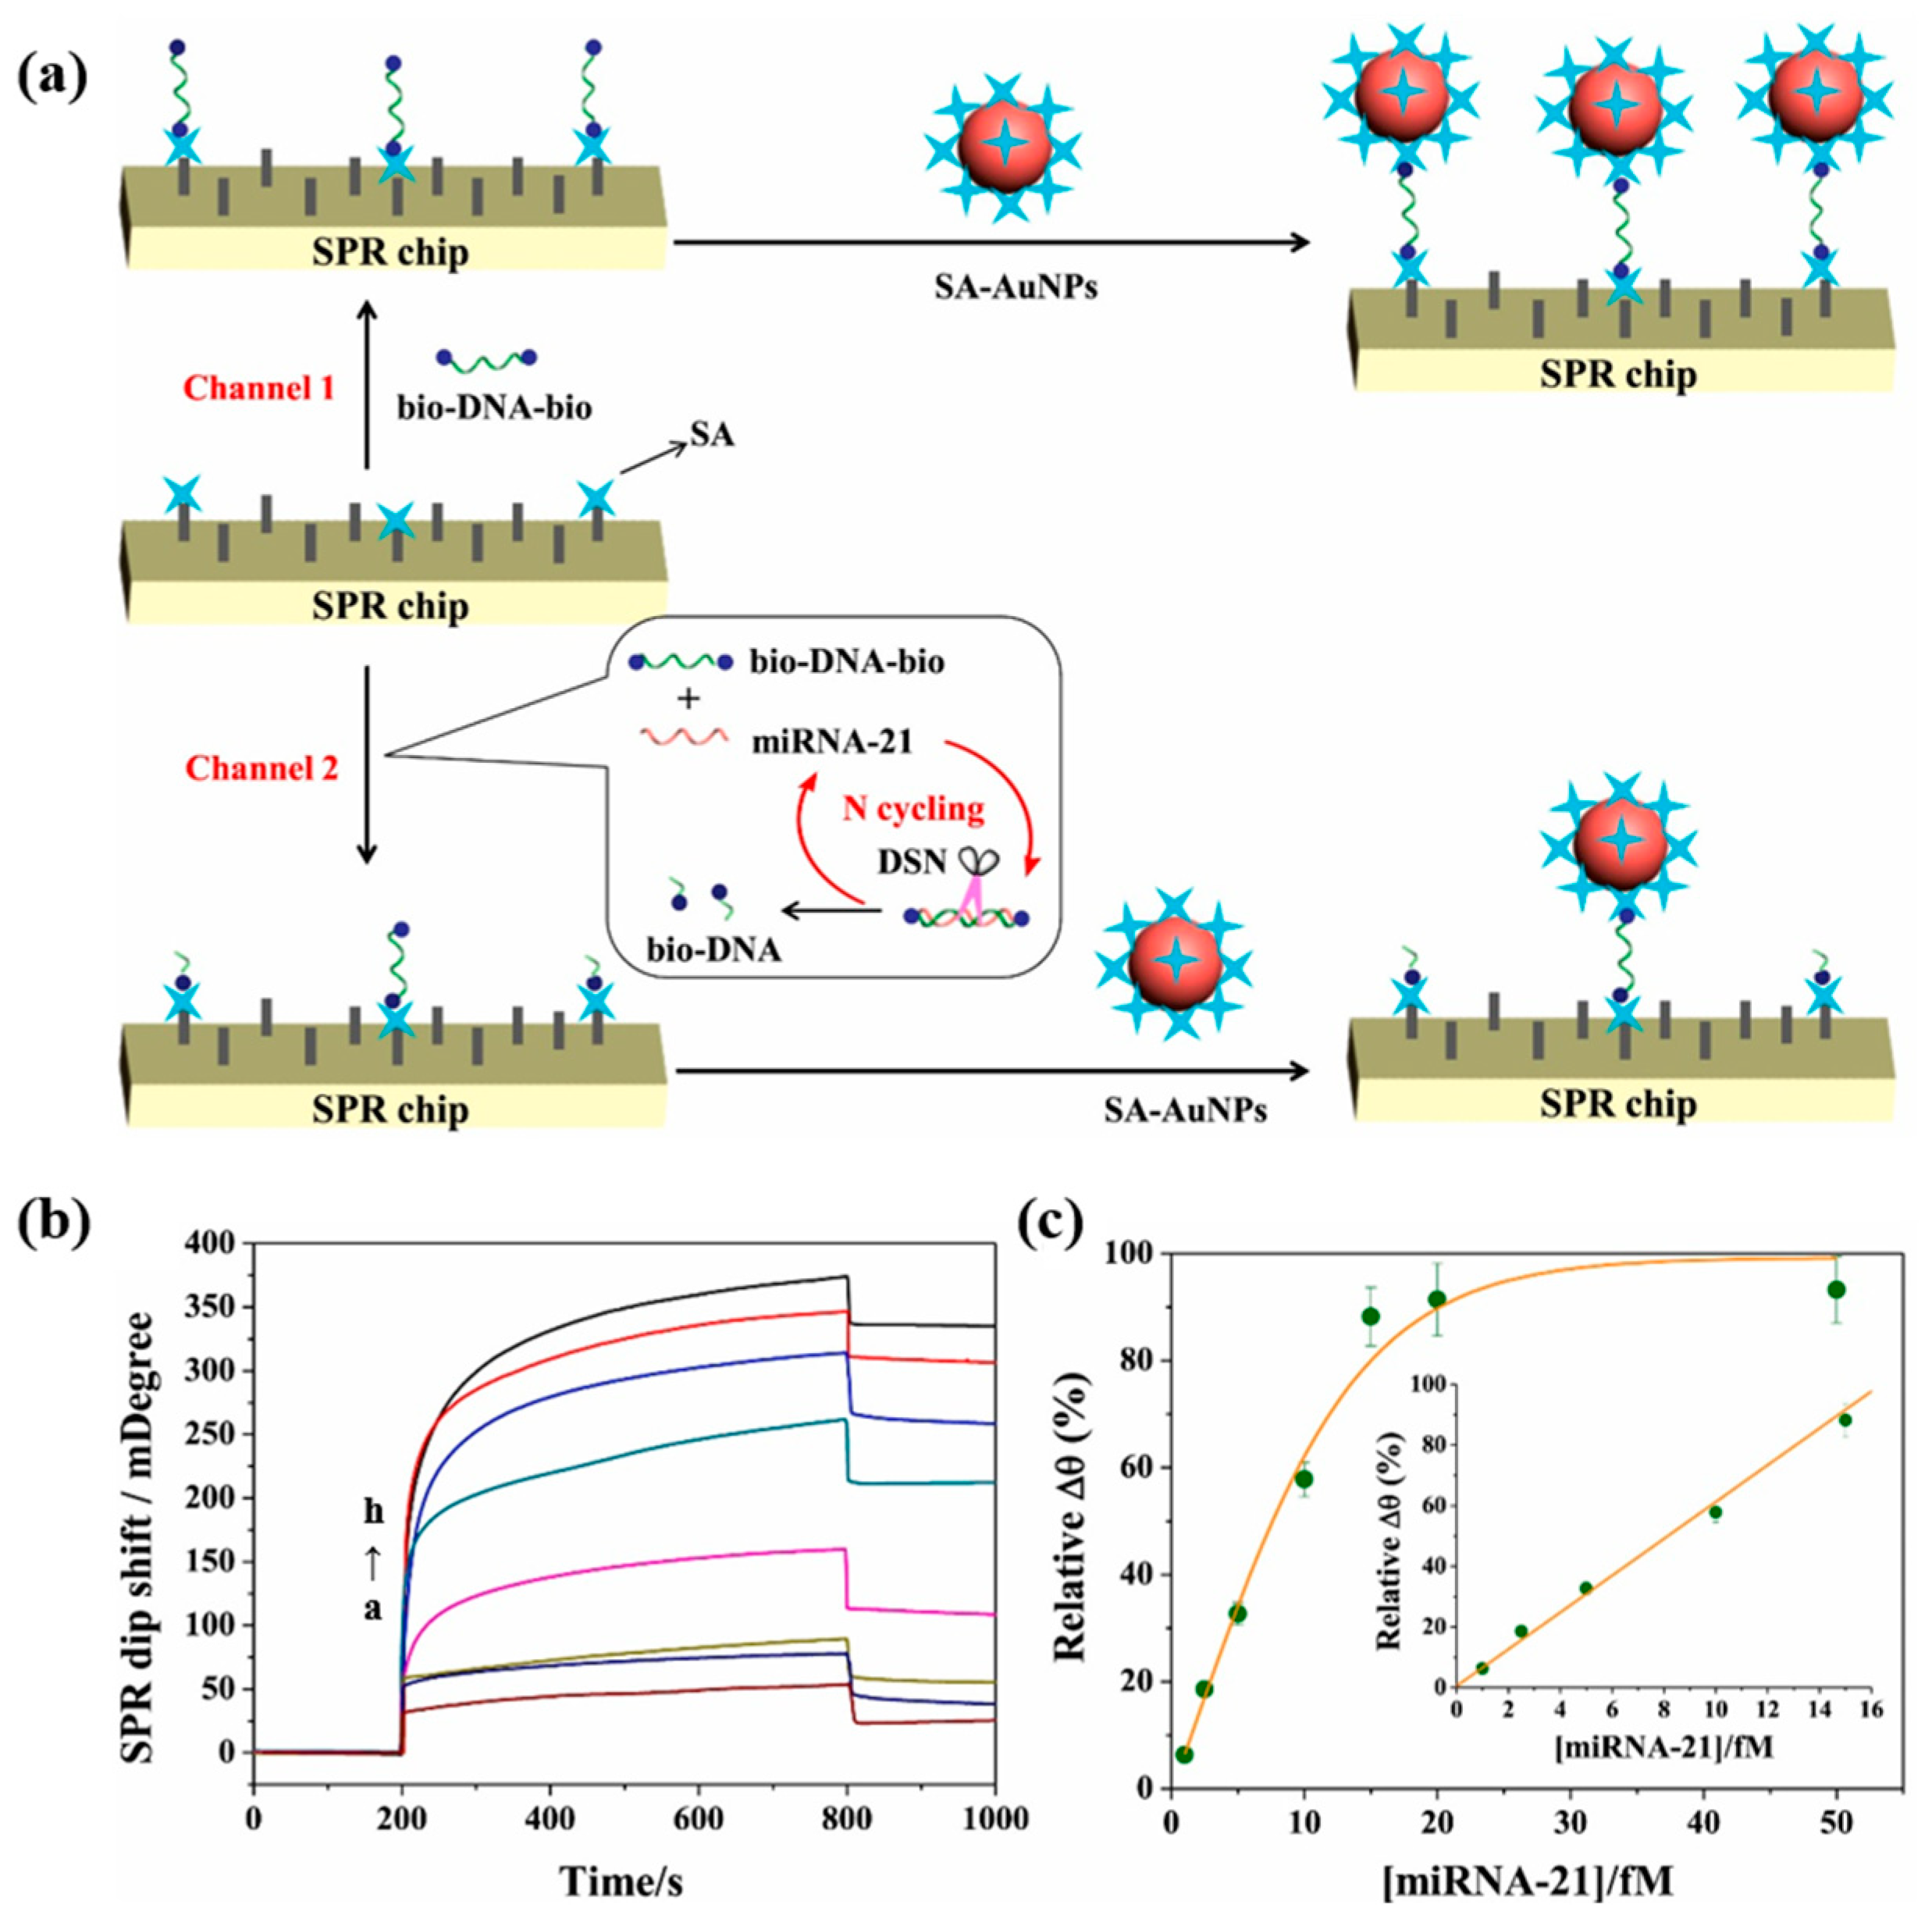
  81. Huang, Y.; Sun, T.; Liu, L.; Xia, N.; Zhao, Y.; Yi, X. Surface Plasmon Resonance Biosensor for the Detection of MiRNAs by Combining the Advantages of Homogeneous Reaction and Heterogeneous Detection. Talanta 2021, 234, 122622. [Google Scholar] [CrossRef]
  82. Wang, X.; Hou, T.; Lin, H.; Lv, W.; Li, H.; Li, F. In Situ Template Generation of Silver Nanoparticles as Amplification Tags for Ultrasensitive Surface Plasmon Resonance Biosensing of MicroRNA. Biosens. Bioelectron. 2019, 137, 82–87. [Google Scholar] [CrossRef]
  83. Muhammad, M.; Huang, Q. A Review of Aptamer-Based SERS Biosensors: Design Strategies and Applications. Talanta 2021, 227, 122188. [Google Scholar] [CrossRef] [PubMed]
  84. Li, C.; Li, S.; Qu, A.; Xu, C.; Xu, L.; Kuang, H. Dimensional Surface-Enhanced Raman Scattering Nanostructures for MicroRNA Profiling. Small Struct. 2021, 2, 2000150. [Google Scholar] [CrossRef]
  85. Wang, H.-X.; Zhao, Y.-W.; Li, Z.; Liu, B.-S.; Zhang, D. Development and Application of Aptamer-Based Surface-Enhanced Raman Spectroscopy Sensors in Quantitative Analysis and Biotherapy. Sensors 2019, 19, 3806. [Google Scholar] [CrossRef] [PubMed]
  86. Wang, Z.; Zong, S.; Wang, Z.; Wu, L.; Chen, P.; Yun, B.; Cui, Y. Microfluidic Chip Based Micro RNA Detection through the Combination of Fluorescence and Surface Enhanced Raman Scattering Techniques. Nanotechnology 2017, 28, 105501. [Google Scholar] [CrossRef]
  87. Si, Y.; Xu, L.; Wang, N.; Zheng, J.; Yang, R.; Li, J. Target MicroRNA-Responsive DNA Hydrogel-Based Surface-Enhanced Raman Scattering Sensor Arrays for MicroRNA-Marked Cancer Screening. Anal. Chem. 2020, 92, 2649–2655. [Google Scholar] [CrossRef] [PubMed]
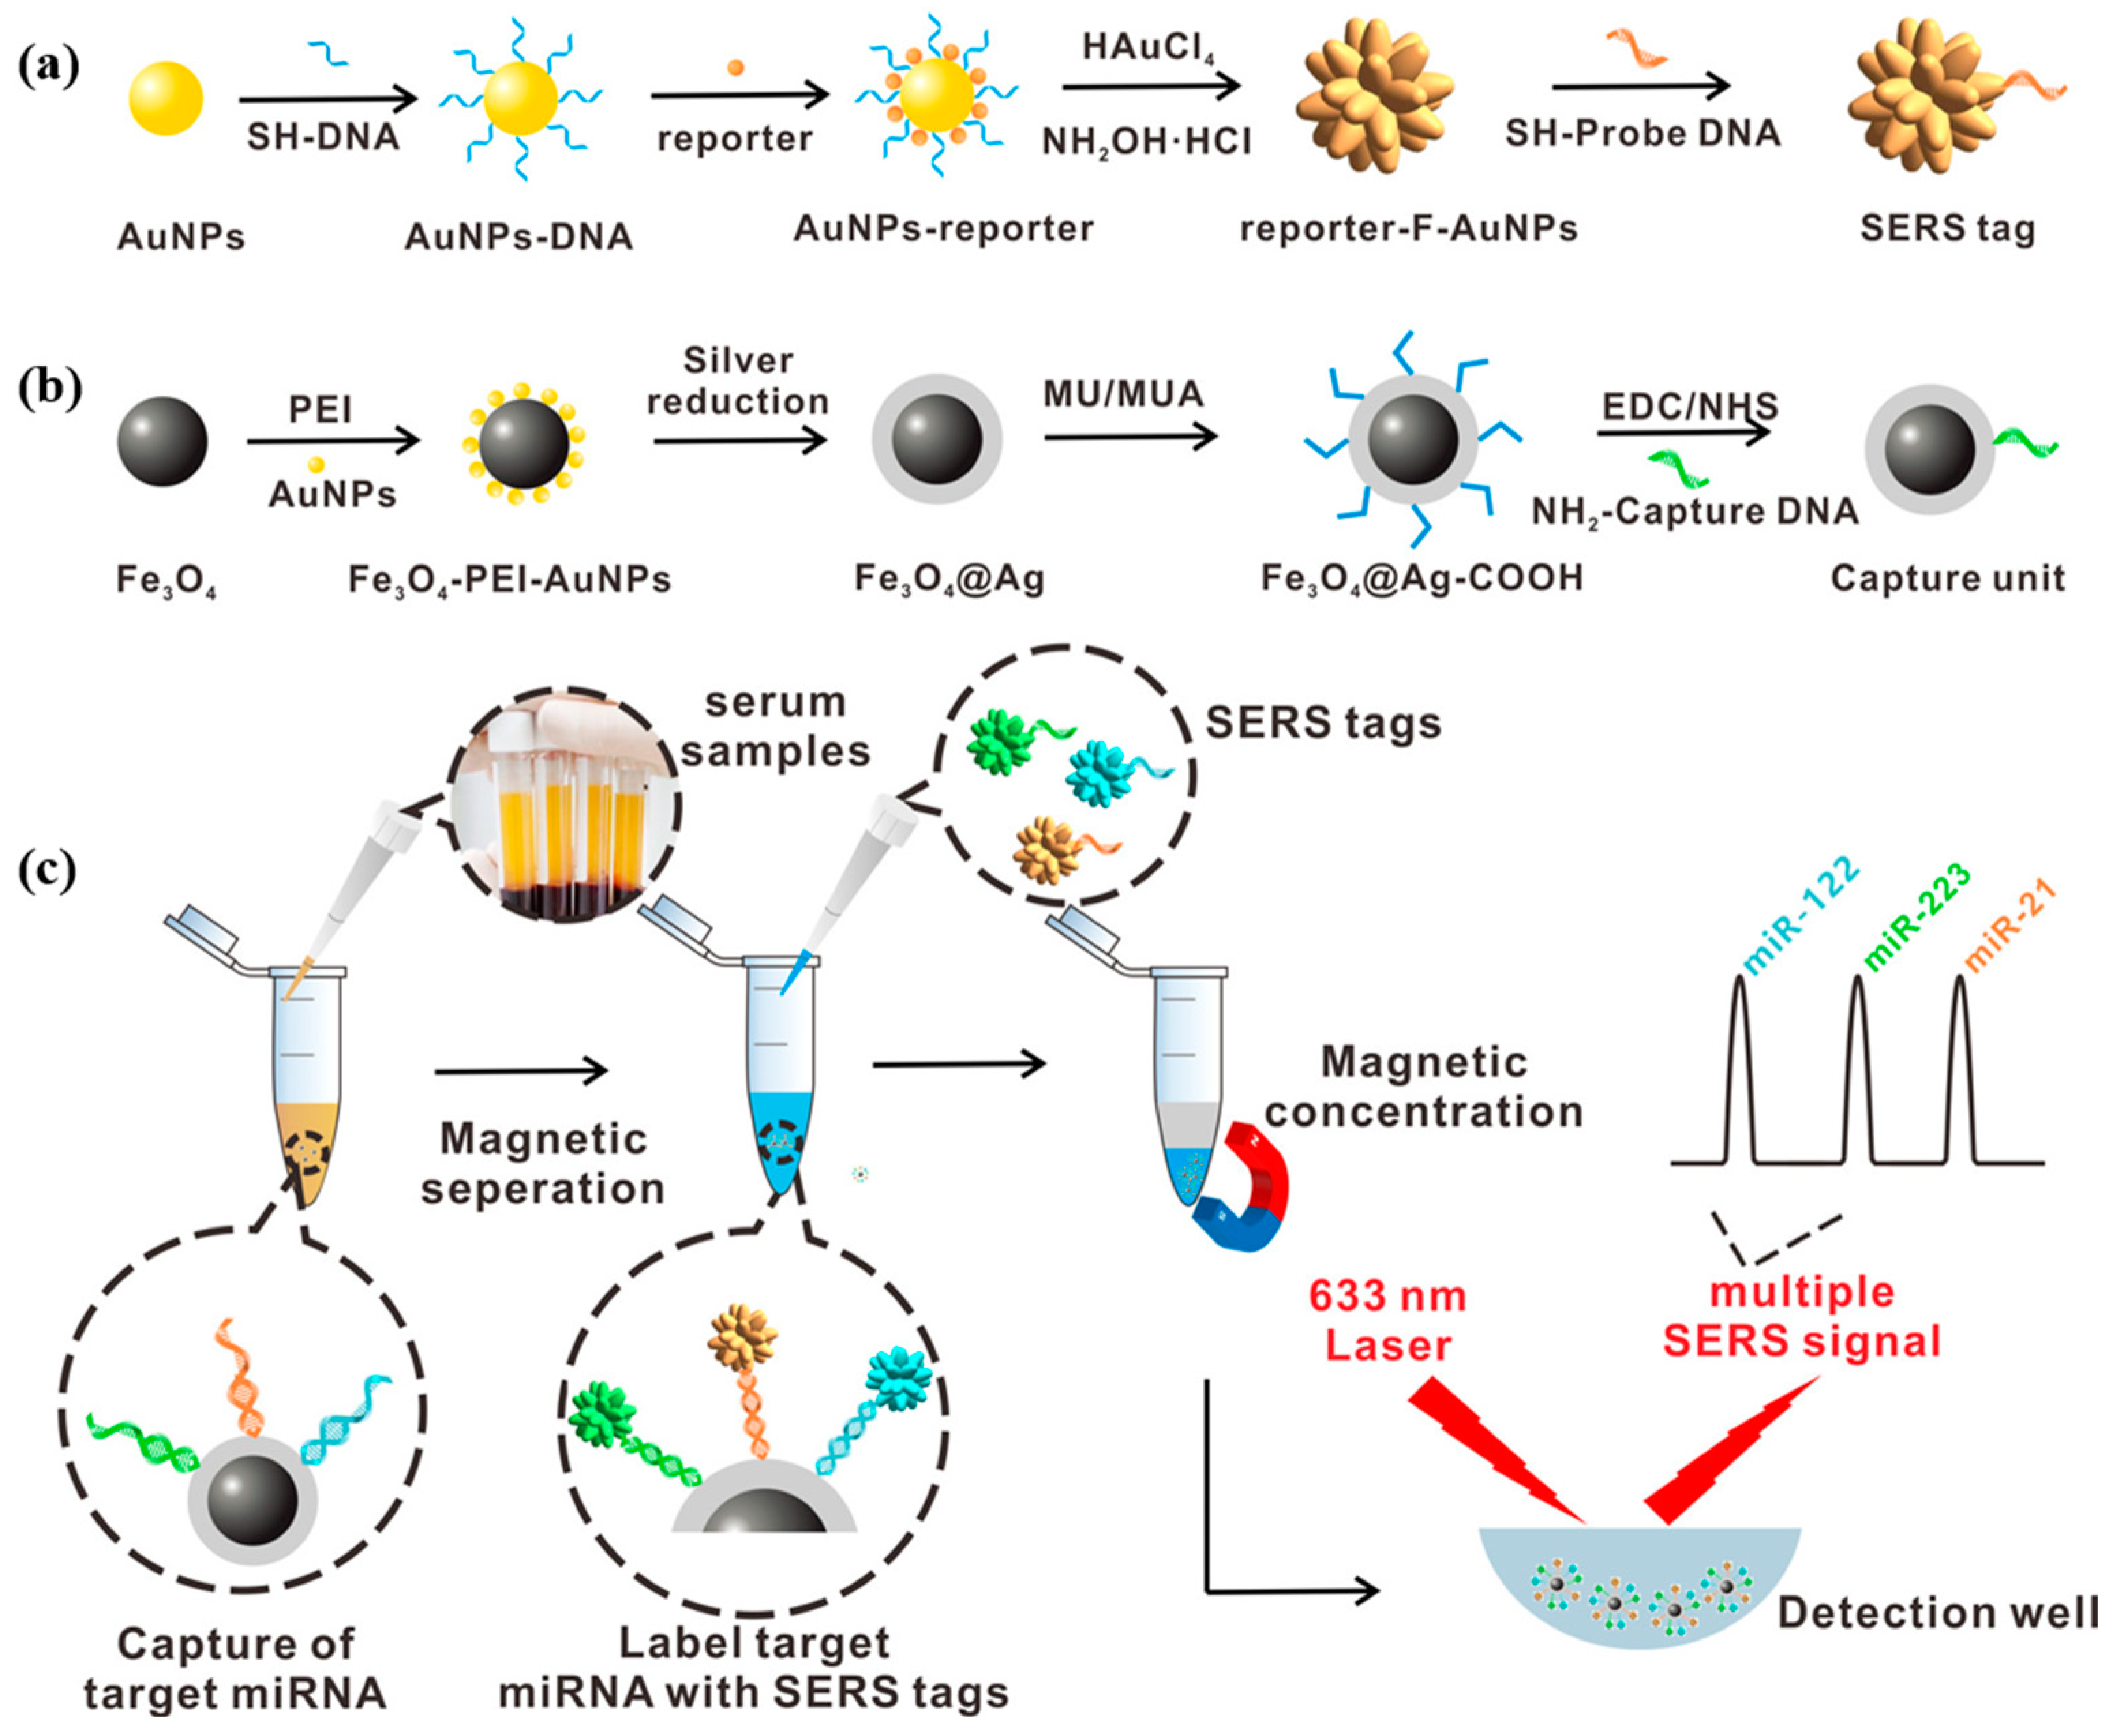
  88. Wu, J.; Zhou, X.; Li, P.; Lin, X.; Wang, J.; Hu, Z.; Zhang, P.; Chen, D.; Cai, H.; Niessner, R.; et al. Ultrasensitive and Simultaneous SERS Detection of Multiplex MicroRNA Using Fractal Gold Nanotags for Early Diagnosis and Prognosis of Hepatocellular Carcinoma. Anal. Chem. 2021, 93, 8799–8809. [Google Scholar] [CrossRef] [PubMed]
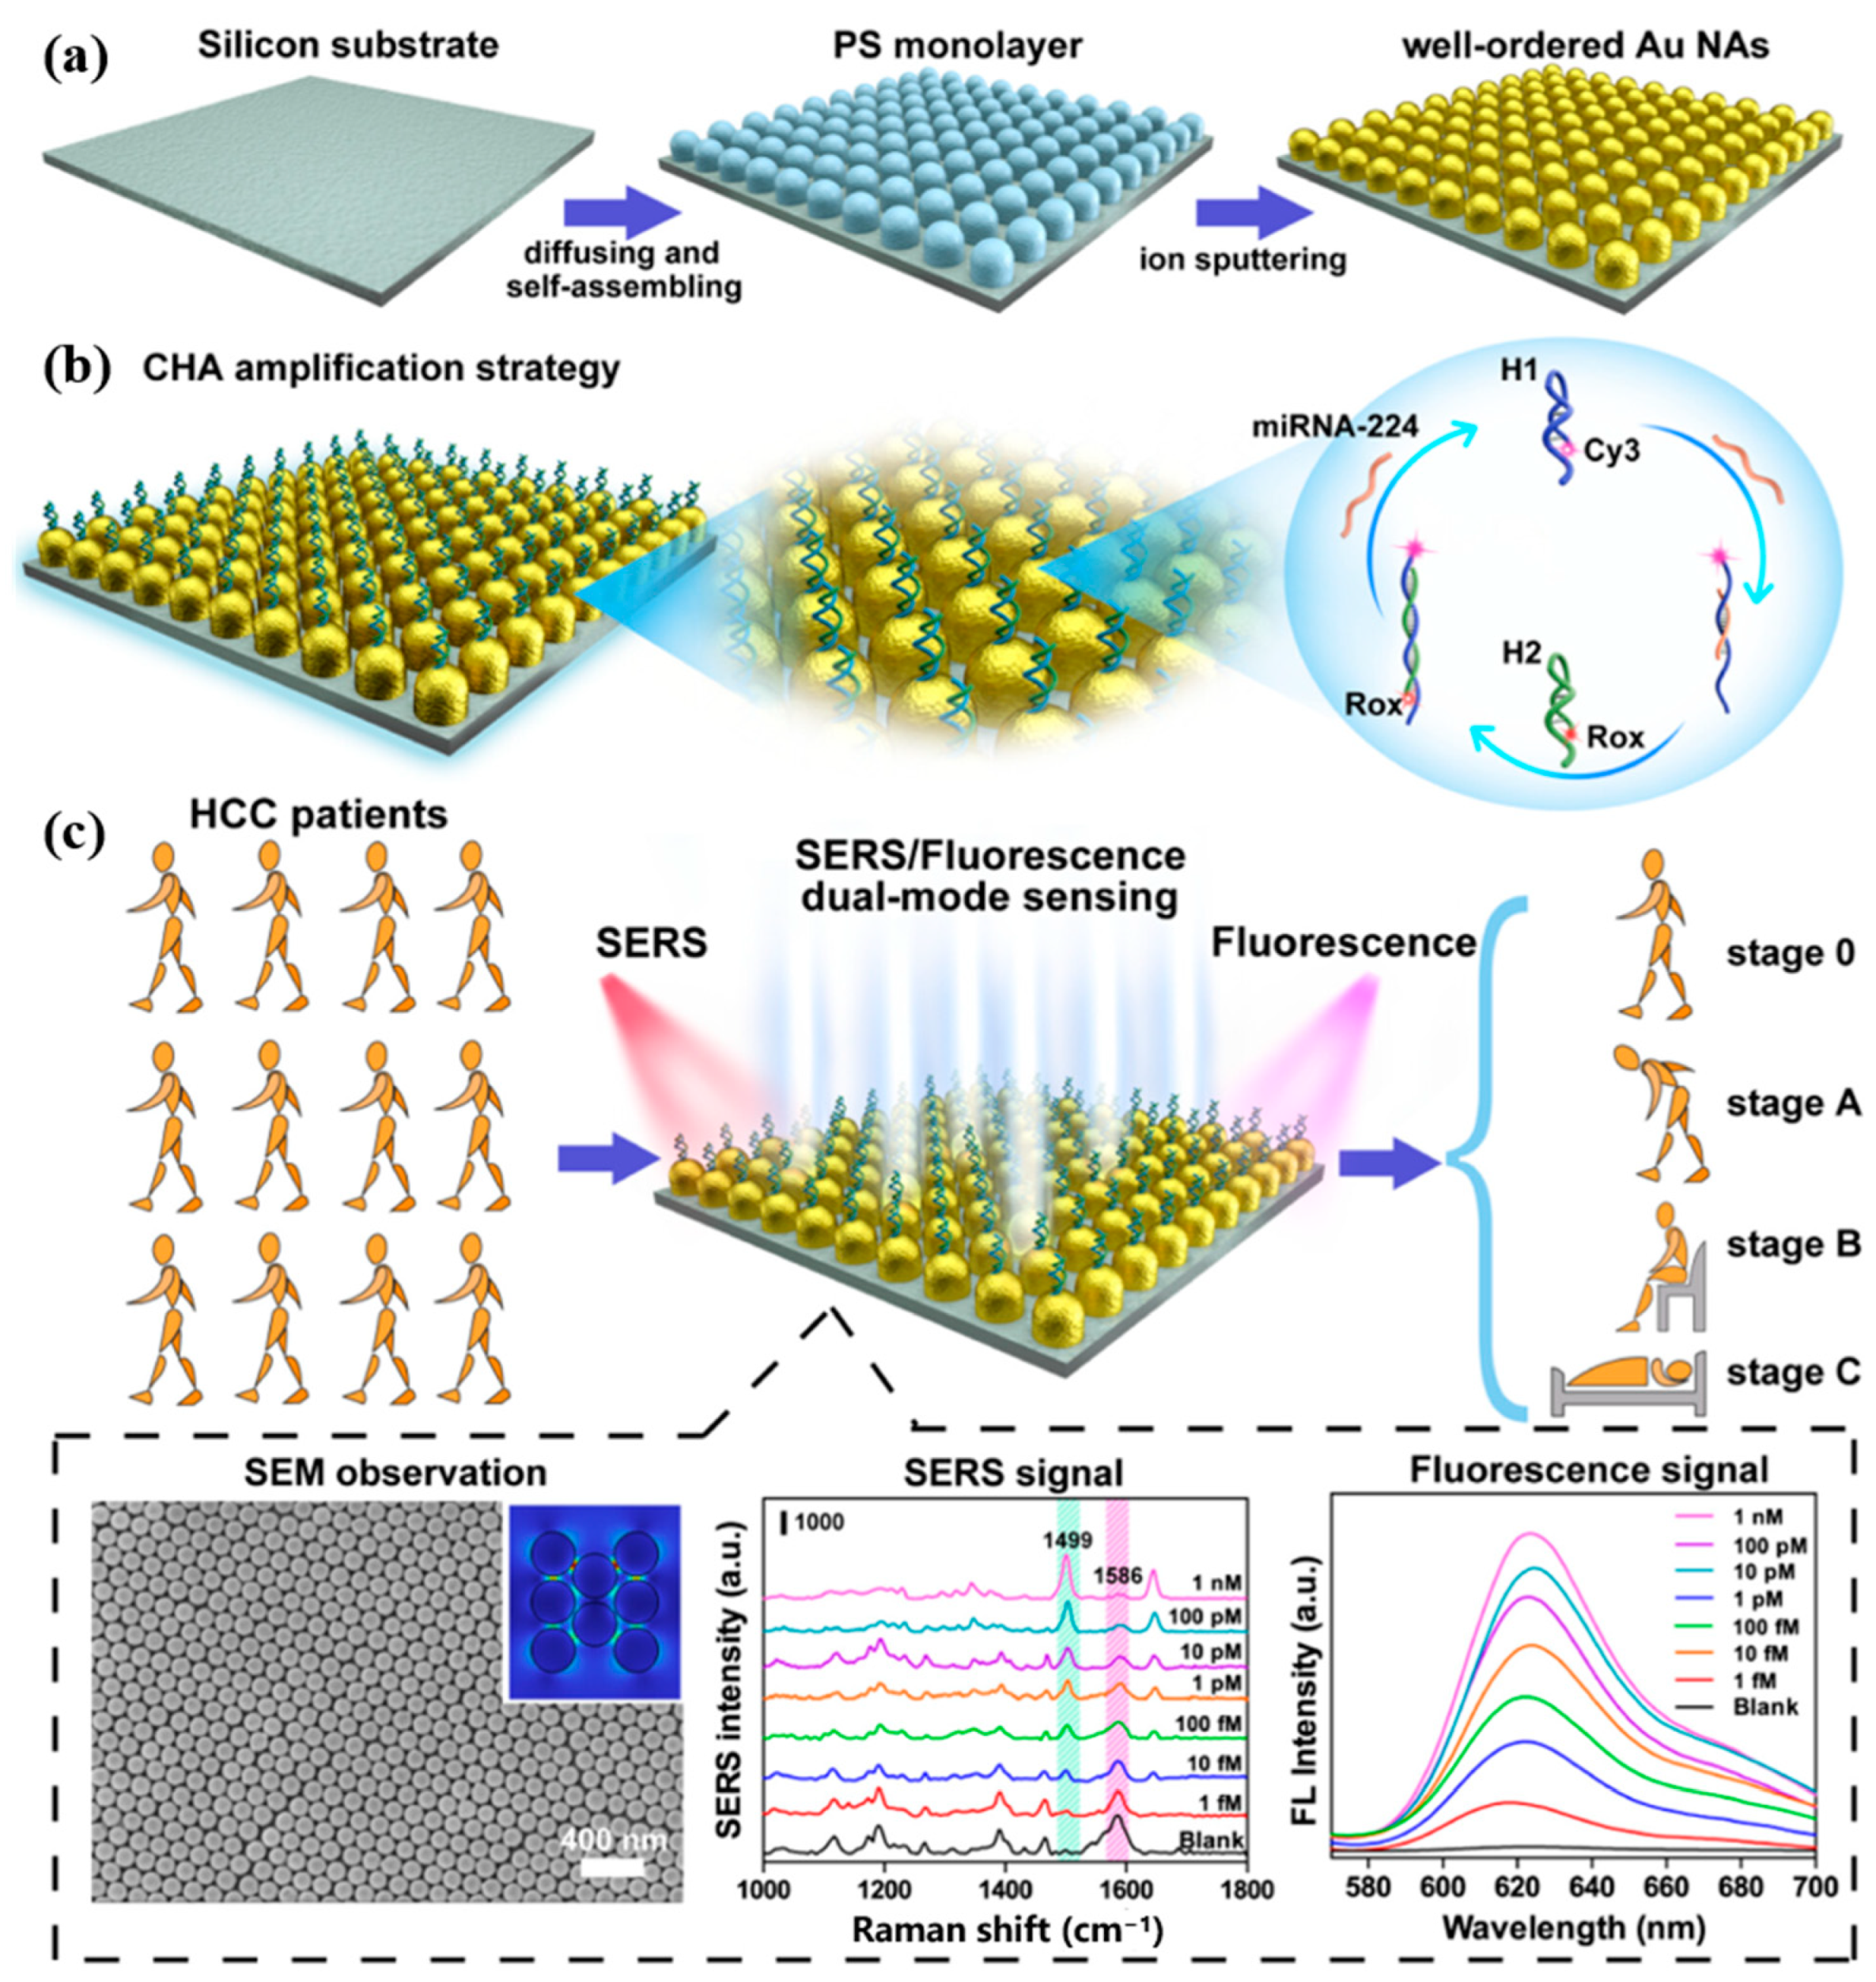
  89. Huang, X.; Tian, H.; Huang, L.; Chen, Q.; Yang, Y.; Zeng, R.; Xu, J.; Chen, S.; Zhou, X.; Liu, G.; et al. Well-Ordered Au Nanoarray for Sensitive and Reproducible Detection of Hepatocellular Carcinoma-Associated MiRNA via CHA-Assisted SERS/Fluorescence Dual-Mode Sensing. Anal. Chem. 2023, 95, 5955–5966. [Google Scholar] [CrossRef]
  90. Fiorani, A.; Valenti, G.; Iurlo, M.; Marcaccio, M.; Paolucci, F. Electrogenerated Chemiluminescence: A Molecular Electrochemistry Point of View. Curr. Opin. Electrochem. 2018, 8, 31–38. [Google Scholar] [CrossRef]
  91. Hou, L. Electrochemiluminescent Biosensors for the Detection of MicroRNAs: A Review. Int. J. Electrochem. Sci. 2019, 14, 2489–2508. [Google Scholar] [CrossRef]
  92. Fiorani, A.; Merino, J.P.; Zanut, A.; Criado, A.; Valenti, G.; Prato, M.; Paolucci, F. Advanced Carbon Nanomaterials for Electrochemiluminescent Biosensor Applications. Curr. Opin. Electrochem. 2019, 16, 66–74. [Google Scholar] [CrossRef]
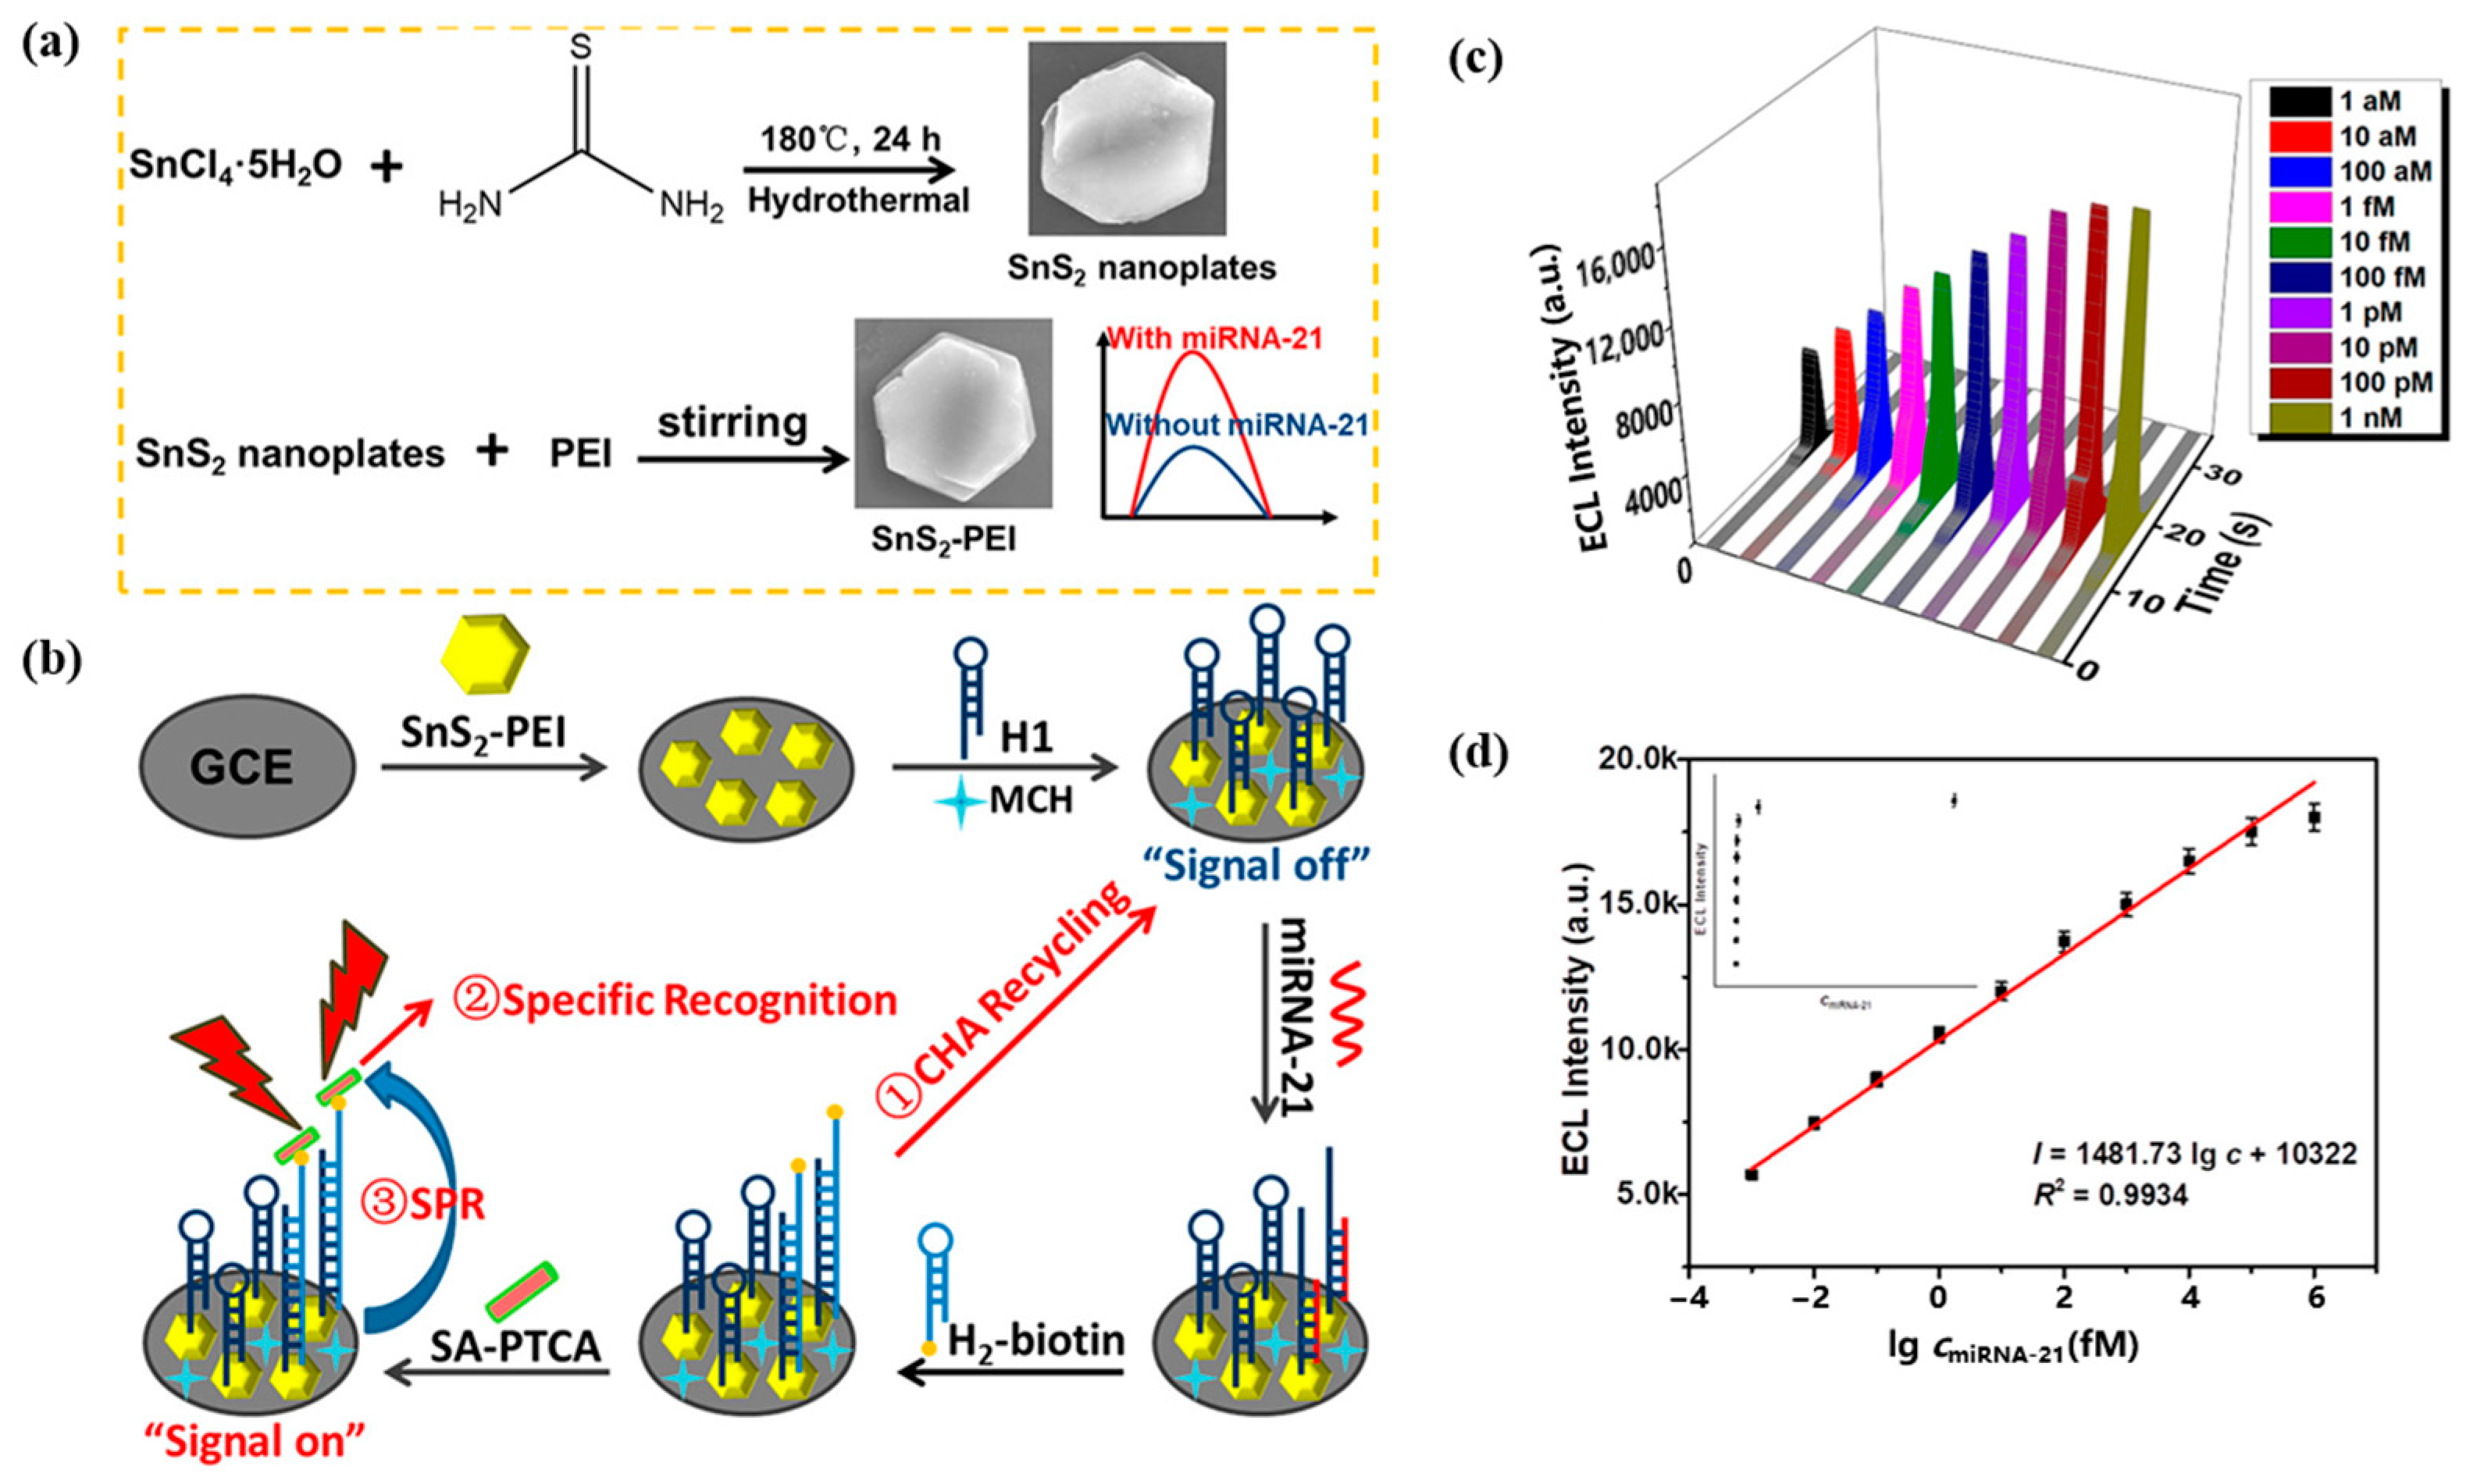
  93. Li, J.; Cai, R.; Tan, W. A Novel ECL Sensing System for Ultrahigh Sensitivity MiRNA-21 Detection Based on Catalytic Hairpin Assembly Cascade Nonmetallic SPR Effect. Anal. Chem. 2022, 94, 12280–12285. [Google Scholar] [CrossRef]
  94. Wang, M.-Y.; Jing, W.-J.; Wang, L.-J.; Jia, L.-P.; Ma, R.-N.; Zhang, W.; Shang, L.; Li, X.-J.; Xue, Q.-W.; Wang, H.-S. Electrochemiluminescence Detection of MiRNA-21 Based on Dual Signal Amplification Strategies: Duplex-Specific Nuclease -Mediated Target Recycle and Nicking Endonuclease-Driven 3D DNA Nanomachine. Biosens. Bioelectron. 2023, 226, 115116. [Google Scholar] [CrossRef] [PubMed]
  95. Lin, Y.; Wu, J.; Wu, Y.; Ma, R.; Zhou, Y.; Shi, J.; Li, M.; Tan, X.; Huang, K. An All-Graphdiyne Electrochemiluminescence Biosensor for the Ultrasensitive Detection of MicroRNA-21 Based on Target Recycling with DNA Cascade Reaction for Signal Amplification. Analyst 2023, 148, 1330–1336. [Google Scholar] [CrossRef]
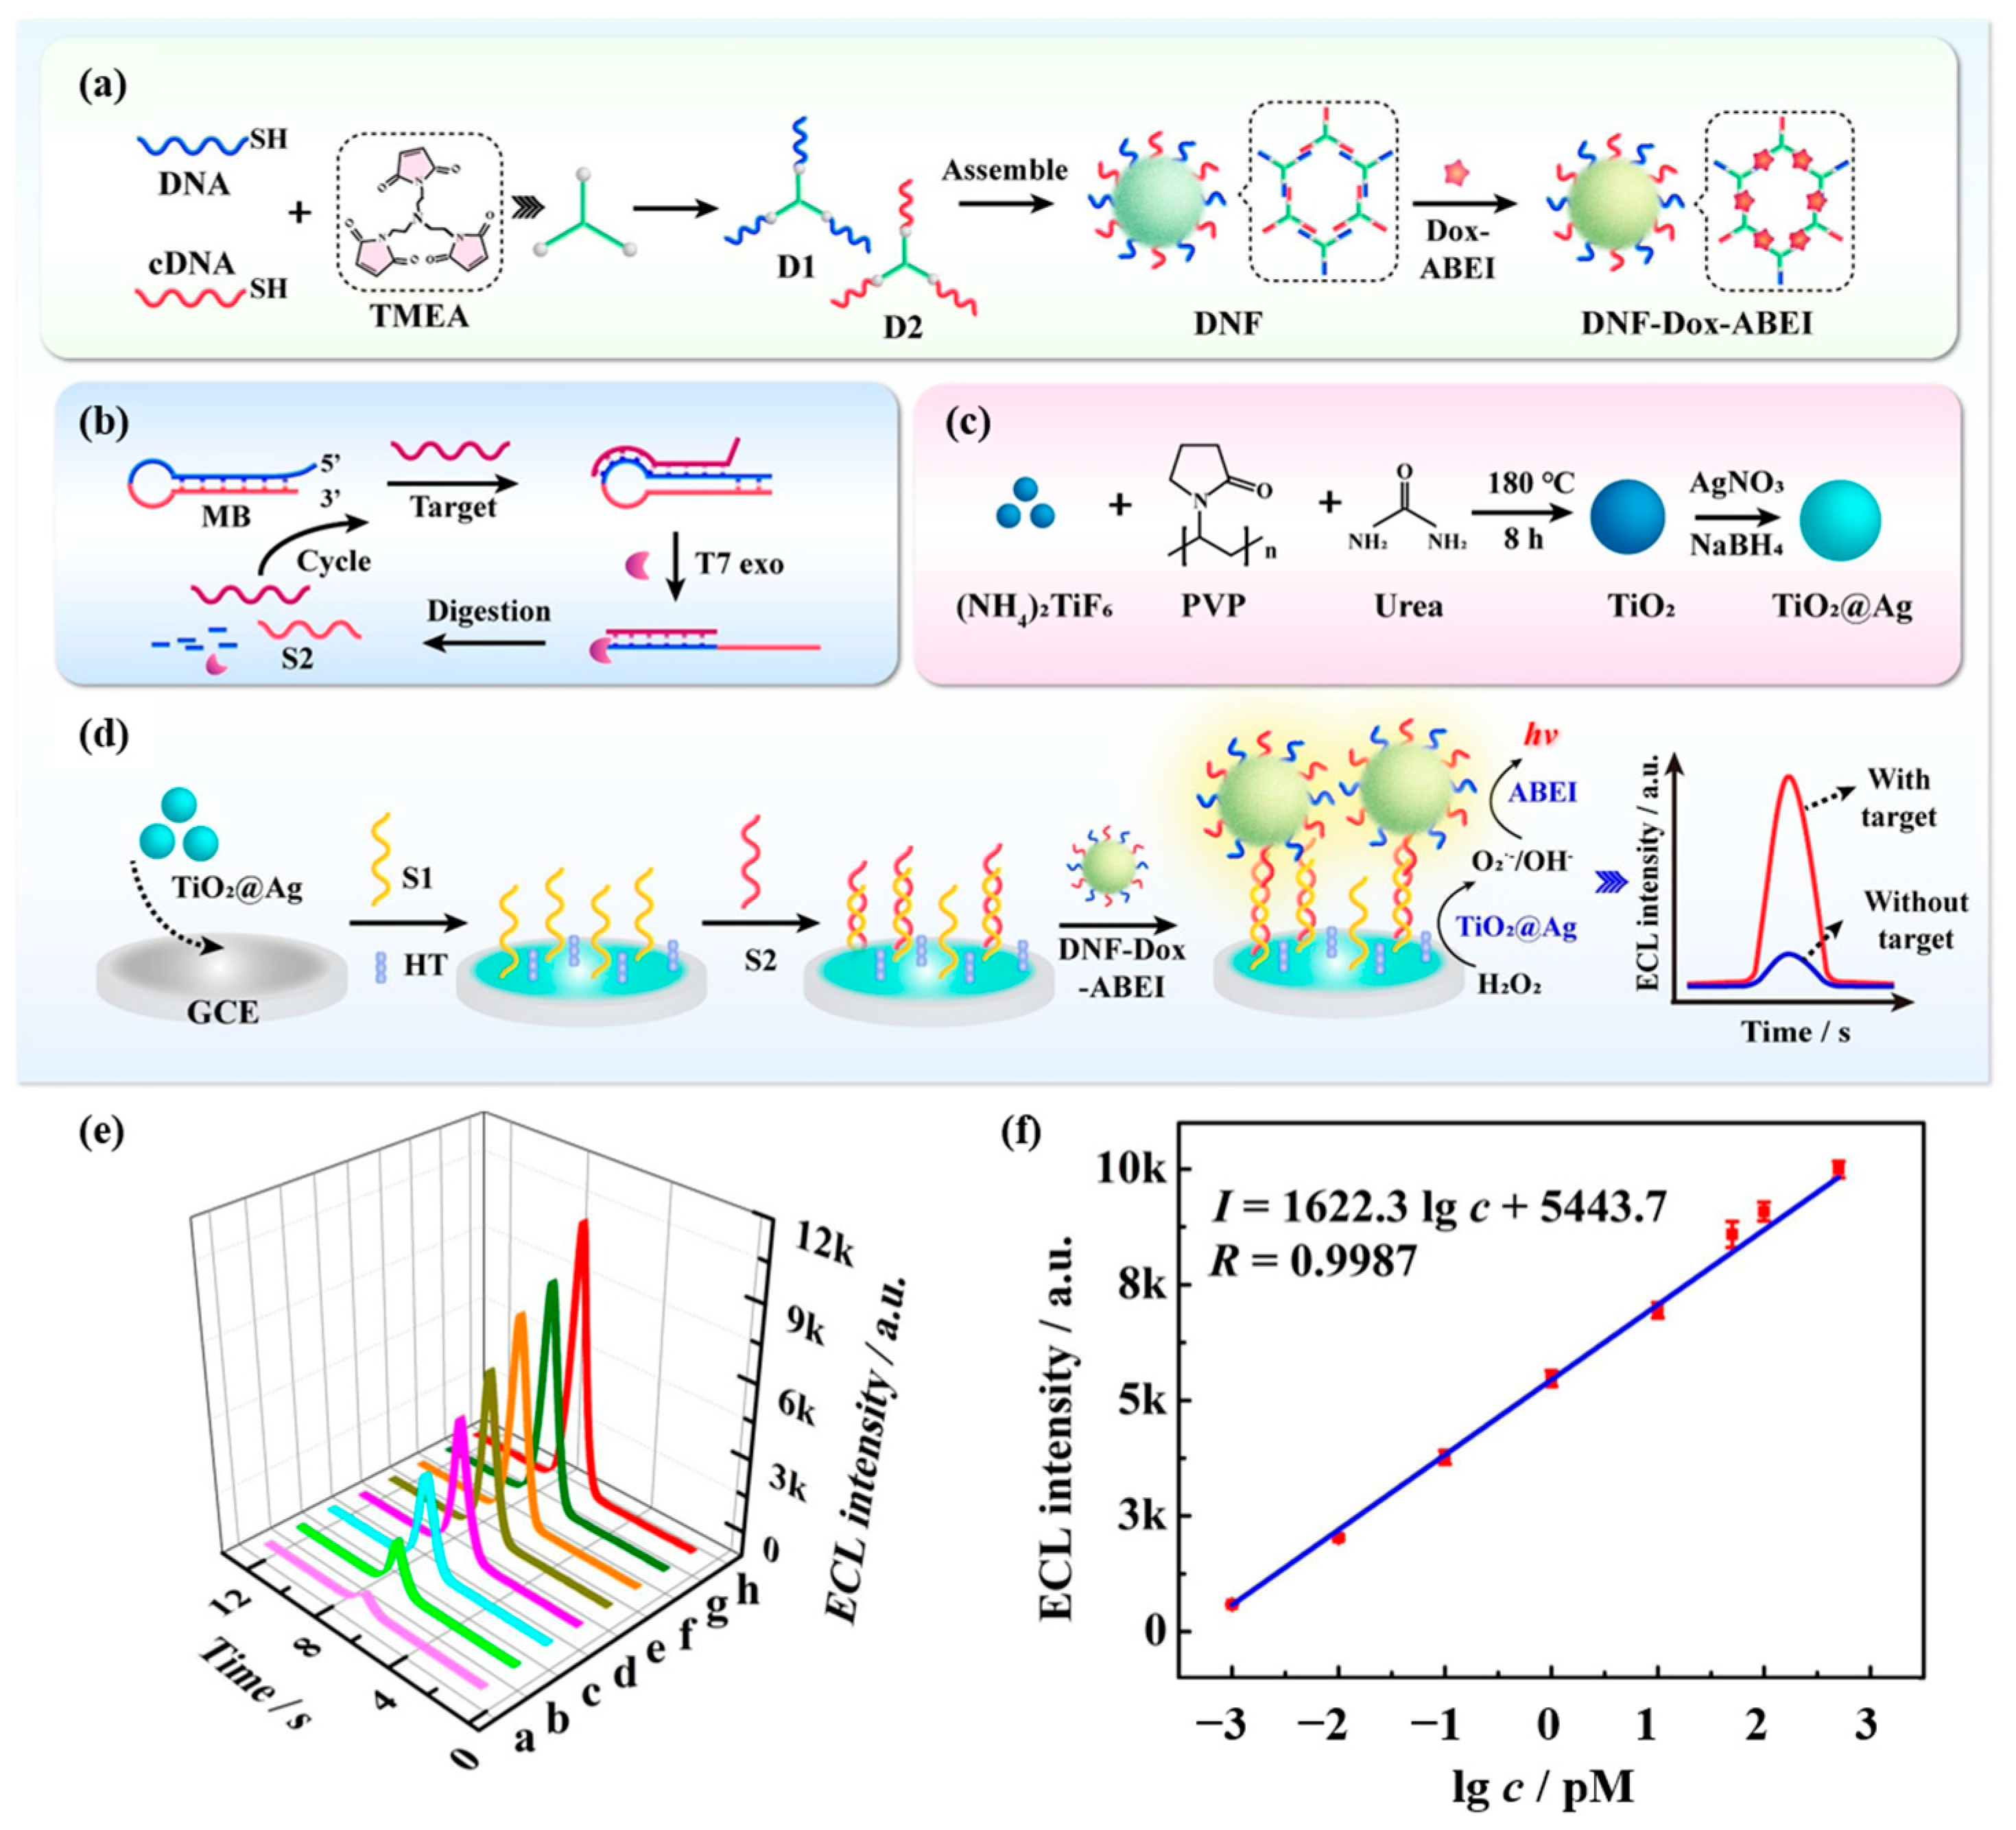
  96. Shen, B.; Wu, Q.; Fan, Y.; Wu, H.; Li, X.; Zhao, X.; Wang, Y.; Ding, S.; Zhang, J. TiO2@Ag Nanozyme Enhanced Electrochemiluminescent Biosensor Coupled with DNA Nanoframework-Carried Emitters and Enzyme-Assisted Target Recycling Amplification for Ultrasensitive Detection of MicroRNA. Chem. Eng. J. 2022, 445, 136820. [Google Scholar] [CrossRef]
Figure 1. The principle of miRNA production in cancer cells, the process of obtaining miRNA, and commonly used miRNA quantification methods.
Chemosensors 11 00504 g001
Figure 2. (a) Schematic diagram of the preparation and operation of the electrochemical biosensor based on the ion barrier effect for the detection of miRNA-122. (b) DPV response curves in the range of 0–100 nmol/L after hybridization of the biosensor with miRNA-122 (DPV responses curves at different concentrations are indicated by different colors. DPV response decreases with increasing concentration). (c) Correction curve for the amount of change in peak current versus the negative logarithm of miRNA-122 concentration. (Reproduced with permission from [46]).
Chemosensors 11 00504 g002
Figure 3. Schematic diagram of the dual model PEC and EC biosensor for miRNA-224 detection. (A). The process of 3D DNA walker-induced ring amplification. (B). Preparation process of the biosensor for the detection of miRNA-224. In the process from a to b, the hairpin structure probe transforms into a “Y” structure. (Reproduced with permission from [48]).
Chemosensors 11 00504 g003
Figure 4. (a) Schematic diagram of the principle of miRNA let-7a detection by the sandwich-type biosensor. (b) The relationship between the ∆I peak and the logarithm of miRNA let-7a concentration. The ∆I response increased with miRNA let-7a concentration in two linear ranges with different slopes in the range of 1.0 zm to 11 nM. When the concentration was higher than 11 nM, the ∆I peak started to decrease due to the electrostatic repulsion between the probe and the target reducing the hybridization efficiency. (Reproduced with permission from [50]).
Chemosensors 11 00504 g004
Figure 5. (a) Schematic of ZNA probe-based electrochemical analysis of miRNA-34a. (b) DPV response curves of different concentrations of miRNA-34a (a: 2 µg/mL, b: 4 µg/mL, c: 6 µg/mL, d: 8 µg/mL, and e: 10 µg/mL) detected by this biosensor. (c) Curve of average values of DPV peaks versus different concentrations of miRNA-34a. (d) Calibration curve of the average of DPV peaks versus 2–8 µg/mL miRNA-34a. (Reproduced with permission from [53]).
Chemosensors 11 00504 g005
Figure 6. (a) Schematic diagram of a paper-based electrochemical biosensor. (b) Nyquist curves after hybridization of DNA probe and different concentrations of miRNA-155. (c) Calibration curve of Rct versus 0–1.5 μg/mL miRNA-155. (Reproduced with permission from [60]).
Chemosensors 11 00504 g006
Figure 7. The Y-shaped probe combined with double amplification for colorimetric sensing of two miRNAs. (Reproduced with permission from [70]).
Chemosensors 11 00504 g007
Figure 8. (a) Schematic diagram of CHA reaction and spherical DNAzyme self-assembly. (b) Schematic diagram of the colorimetric reaction principle of miRNA-21. (c) UV–Vis absorption spectra of the probe solutions after incubation with different concentrations of miRNA-21. (d) Calibration curve between absorbance change at 650 nm and the logarithm of the concentration (logC). (Reproduced with permission from [71]).
Chemosensors 11 00504 g008
Figure 9. (a) Schematic diagram of the MnO2 nanosheet-mediated ratiometric fluorescent biosensor for miRNA detection and imaging. (b) Fluorescence emission spectra of different concentrations of miRNA-21. (c) Variation of (FA/FD)positive/(FA/FD)negative values with miRNA-21 concentration. (FA/FD)positive and (FA/FD)negative, respectively, indicate the ratio of acceptor to donor fluorescence in the presence and absence of miRNA-21. (Reproduced with permission from [74]).
Chemosensors 11 00504 g009
Figure 10. (a) Schematic illustration of CDs-MB-BHQ1/GO system for miRNA-21 detection. (b) Fluorescence spectra of CDs-MB-BHQ1/GO probe with the addition of various amounts of miRNA-21 (0, 0.5, 1, 10, 20, 40, 80, 400, 800, 1000, 5000 pM). (c) The relationship between (F−F0)/F0 and miRNA-21 concentration (Insert: calibration curve between (F−F0)/F0 and the logarithm of miRNA-21 concentration within the range of 0.5–800 pM). (Reproduced with permission from [78]).
Chemosensors 11 00504 g010
Figure 11. (a) Schematic diagram of AFP measurement principle. (b) Schematic diagram of miRNA-125b measurement principle. (Reproduced with permission from [80]).
Chemosensors 11 00504 g011
Figure 12. (a) Schematic representation of SPR biosensor for miRNA-21 detection based on dual-signal amplification of DSN and SA-AuNPs. (b) Representative SPR sensing plots for miRNA-21 assay at different concentrations (a: 0 fM, b: 1 fM, c: 2.5 fM, d: 5 fM, e: 10 fM, f: 15 fM, g: 20 fM, and h: 50 fM) with an enzymatic digestion time of 60 min. (c) Calibration curve of miRNA-21 concentrations versus relative Δθ. (Reproduced with permission from [81]).
Chemosensors 11 00504 g012
Figure 13. (a) Schematic diagram of the synthesis process of SERS tag. (b) Design and synthesis of capture substrate. (c) Multiple miRNA detection methods based on the capture substrate/miRNA/SERS tag sandwich structure. (Reproduced with permission from [88]).
Chemosensors 11 00504 g013
Figure 14. (a) Schematic diagram of the self-assembly process of AuNAs substrate. (b) Principle of AuNAs substrate for miR-224 detection combined with CHA amplification strategy. (c) SERS/FL dual-mode sensing procedure based on AuNAs substrate and its application in clinical staging. (Reproduced with permission from [89]).
Chemosensors 11 00504 g014
Figure 15. (a) Preparation of SnS2-PEI. (b) Design of ECL biosensor for miRNA-21 assay. (c) Response of ECL to different concentrations of miRNA-21. (d) Quantitative calibration curve of miRNA-21 from 1 aM–1 nM. (Reproduced with permission from [93]).
Chemosensors 11 00504 g015
Figure 16. (a) Assembling of DNF-Dox-ABEI emitters. (b) Schematic description of T7 exo-TRA. (c) The synthesis procedure of TiO2@Ag nanocomposites. (d) The construction process of the ECL biosensor. (e) Standard ECL response of the biosensor for different miRNA-155 concentrations (a: 1 fM, b: 10 fM, c: 100 fM, d: 1 pM, e: 10 pM, f: 50 pM, g: 100 pM, h: 500 pM). (f) Calibration plot to the ECL intensity and the logarithm of miRNA-155 concentrations. (Reproduced with permission from [96]).
Chemosensors 11 00504 g016
Table 1. Electrochemical biosensors for the detection of hepatocellular carcinoma-associated miRNAs.
AnalyteReceptorElectrodeElectrochemical
Method
Linearity RangeLODSensitivityAssay TimeRef.
miRNA-122DNA probeGCEDPV0.1 fmol/L–1.0 nmol/L0.021 fmol/L60 min[46]
miRNA-122DNA probeAuCV10−18–10−6 mol/L10−18 mol/L30 min[47]
miRNA-224DNA probeITOSWV0.52–500 fM0.061 fM[48]
miRNA-let 7aDNA probeMnO2DPV0.4–140 nM0.25 nM[49]
miRNA-let 7aDNA probeCPEDPV1.0 zM–11 nM1.0 zM30 min[50]
miRNA-let 7bPNA probeAuNPsVoltammetry1 fM–100 pM10 fM30 min[51]
miRNA-34aZNA probePGEDPV2–8 μg/mL0.87 μg/mL60 min[53]
miRNA-21DNA probeAu@CdSPhotocurrent0.01 pM–10 nM4.2 fM[54]
miRNA-21DNA probeGCEDPV1 fM–100 pM0.16 fM30 min[55]
miRNA-21AuEIS0.1–250 fM0.1 fM>2 h[59]
miRNA-155DNA probeAuNPs-PEEIS0–1.5 μg/mL33.8 nM15 min[60]
miRNA-21
miRNA-155
DNA probeMoS2-PEEIS0.025–0.75 μg/mL
0.05–0.15 μg/mL
9.2 ng/mL
17.0 ng/mL
1372.4 kOhm.mL.μg−1.cm−2
1361 kOhm.mL.μg−1.cm−2
30 min[61]
Table 2. Optical biosensors for the detection of miRNAs associated with hepatocellular carcinoma.
AnalyteReceptorElectrodeOptical MethodSpectral PeakLinearity RangeLODAssay TimeRef.
miRNA-155DNA probeColorimetry450 nm1–100 nM0.7 nM[69]
miRNA-21
miRNA-141
DNA probeColorimetry520 nm/650 nm10 pM–0.4 nM3 pM[70]
miRNA-21DNA probeColorimetry650 nm100 fM–20 nM90.3 fM20 min[71]
miRNA-21DNA probeFluorescent520 nm/570 nm0.1–20 nM73 pM40 min[74]
miRNA-21DNA probeFluorescent605 nm50–1000 pM18.7 pM[75]
miRNA-122PNA probeFluorescent650 nm0.1–10 nM0.043 nM60 min[76]
miRNA-21DNA probeFluorescent500 nm1–1000 fM1 fM2 h[77]
miRNA-21DNA probeFluorescent513 nm0.5–800 pM500 fM[78]
miRNA-224DNA probeFluorescent618 nm1 fM–1 nM0.39 fM1.5 h[89]
miRNA-125bDNA probeSPR0–1000 pM123.044 pM[80]
miRNA-21DNA probeSPR1–15 fM1 fM60 min[81]
miRNA let-7aDNA probeSPR0.001–0.1 pM0.35 fM[82]
miRNA-21DNA probeFluorescent +SERS10−9–10−7 M1h[86]
miRNA-21DNA probeSERS4−1200 nM0.11 nM[87]
miRNA-122
miRNA-223
miRNA-21
DNA probeSERS615 cm−1
918 cm−1
1140 cm−1
1 fM–10 nM349 aM
374 aM
311 aM
[88]
miRNA-224DNA probeSERSCy3: 1586 cm−1
Rox: 1499 cm−1
1 fM–1 nM0.34 fM1.5 h[89]
miRNA-21DNA probeGCEECL1 aM–1 nM0.6 aM[93]
miRNA-21DNA probeGCEECL10 fM–10 nM1.0 fM[94]
miRNA-21DNA probeGCEECL0.1 fM–1 nM0.023 fM[95]
miRNA-155DNA probeGCEECL1.0 fM–500.0 pM0.45 fM[96]
Disclaimer/Publisher’s Note: The statements, opinions and data contained in all publications are solely those of the individual author(s) and contributor(s) and not of MDPI and/or the editor(s). MDPI and/or the editor(s) disclaim responsibility for any injury to people or property resulting from any ideas, methods, instructions or products referred to in the content.

