
Acrylamide–Fat Correlation in Californian-Style Black Olives Using Near-Infrared Spectroscopy
 , , , and
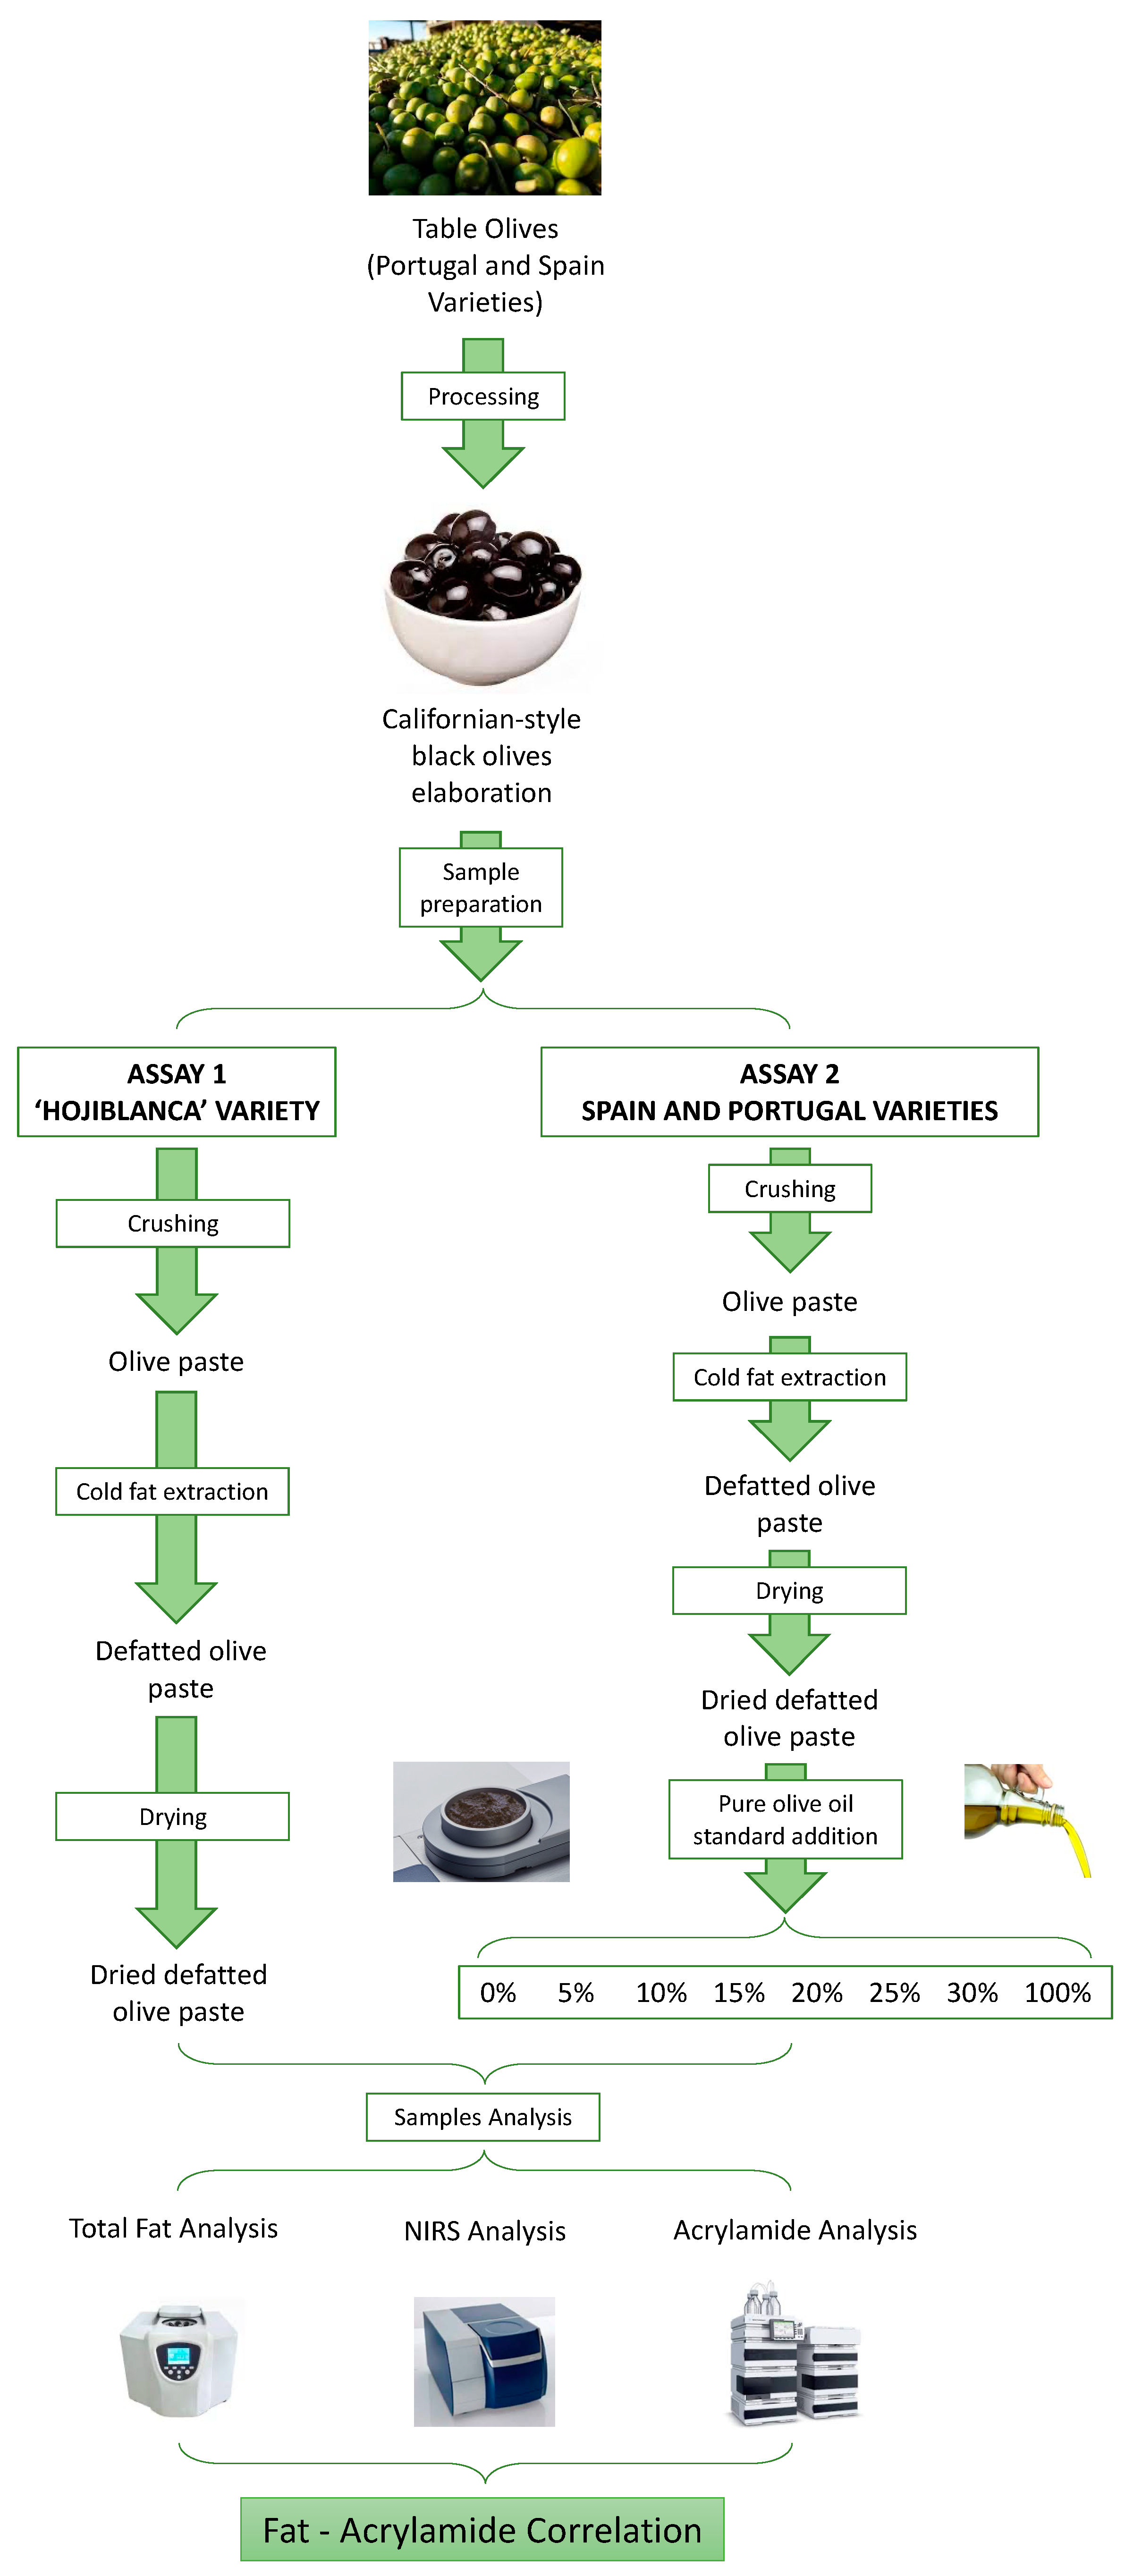
Abstract
:1. Introduction
2. Materials and Methods
2.1. Olive Samples
2.2. Manufacture Processes of Californian-Style Table Olives
2.3. Experimental Design
2.4. Reference Protocols and Analysis
2.4.1. Total Fat
2.4.2. Near-Infrared Spectroscopy Analysis
2.4.3. Acrylamide Analysis
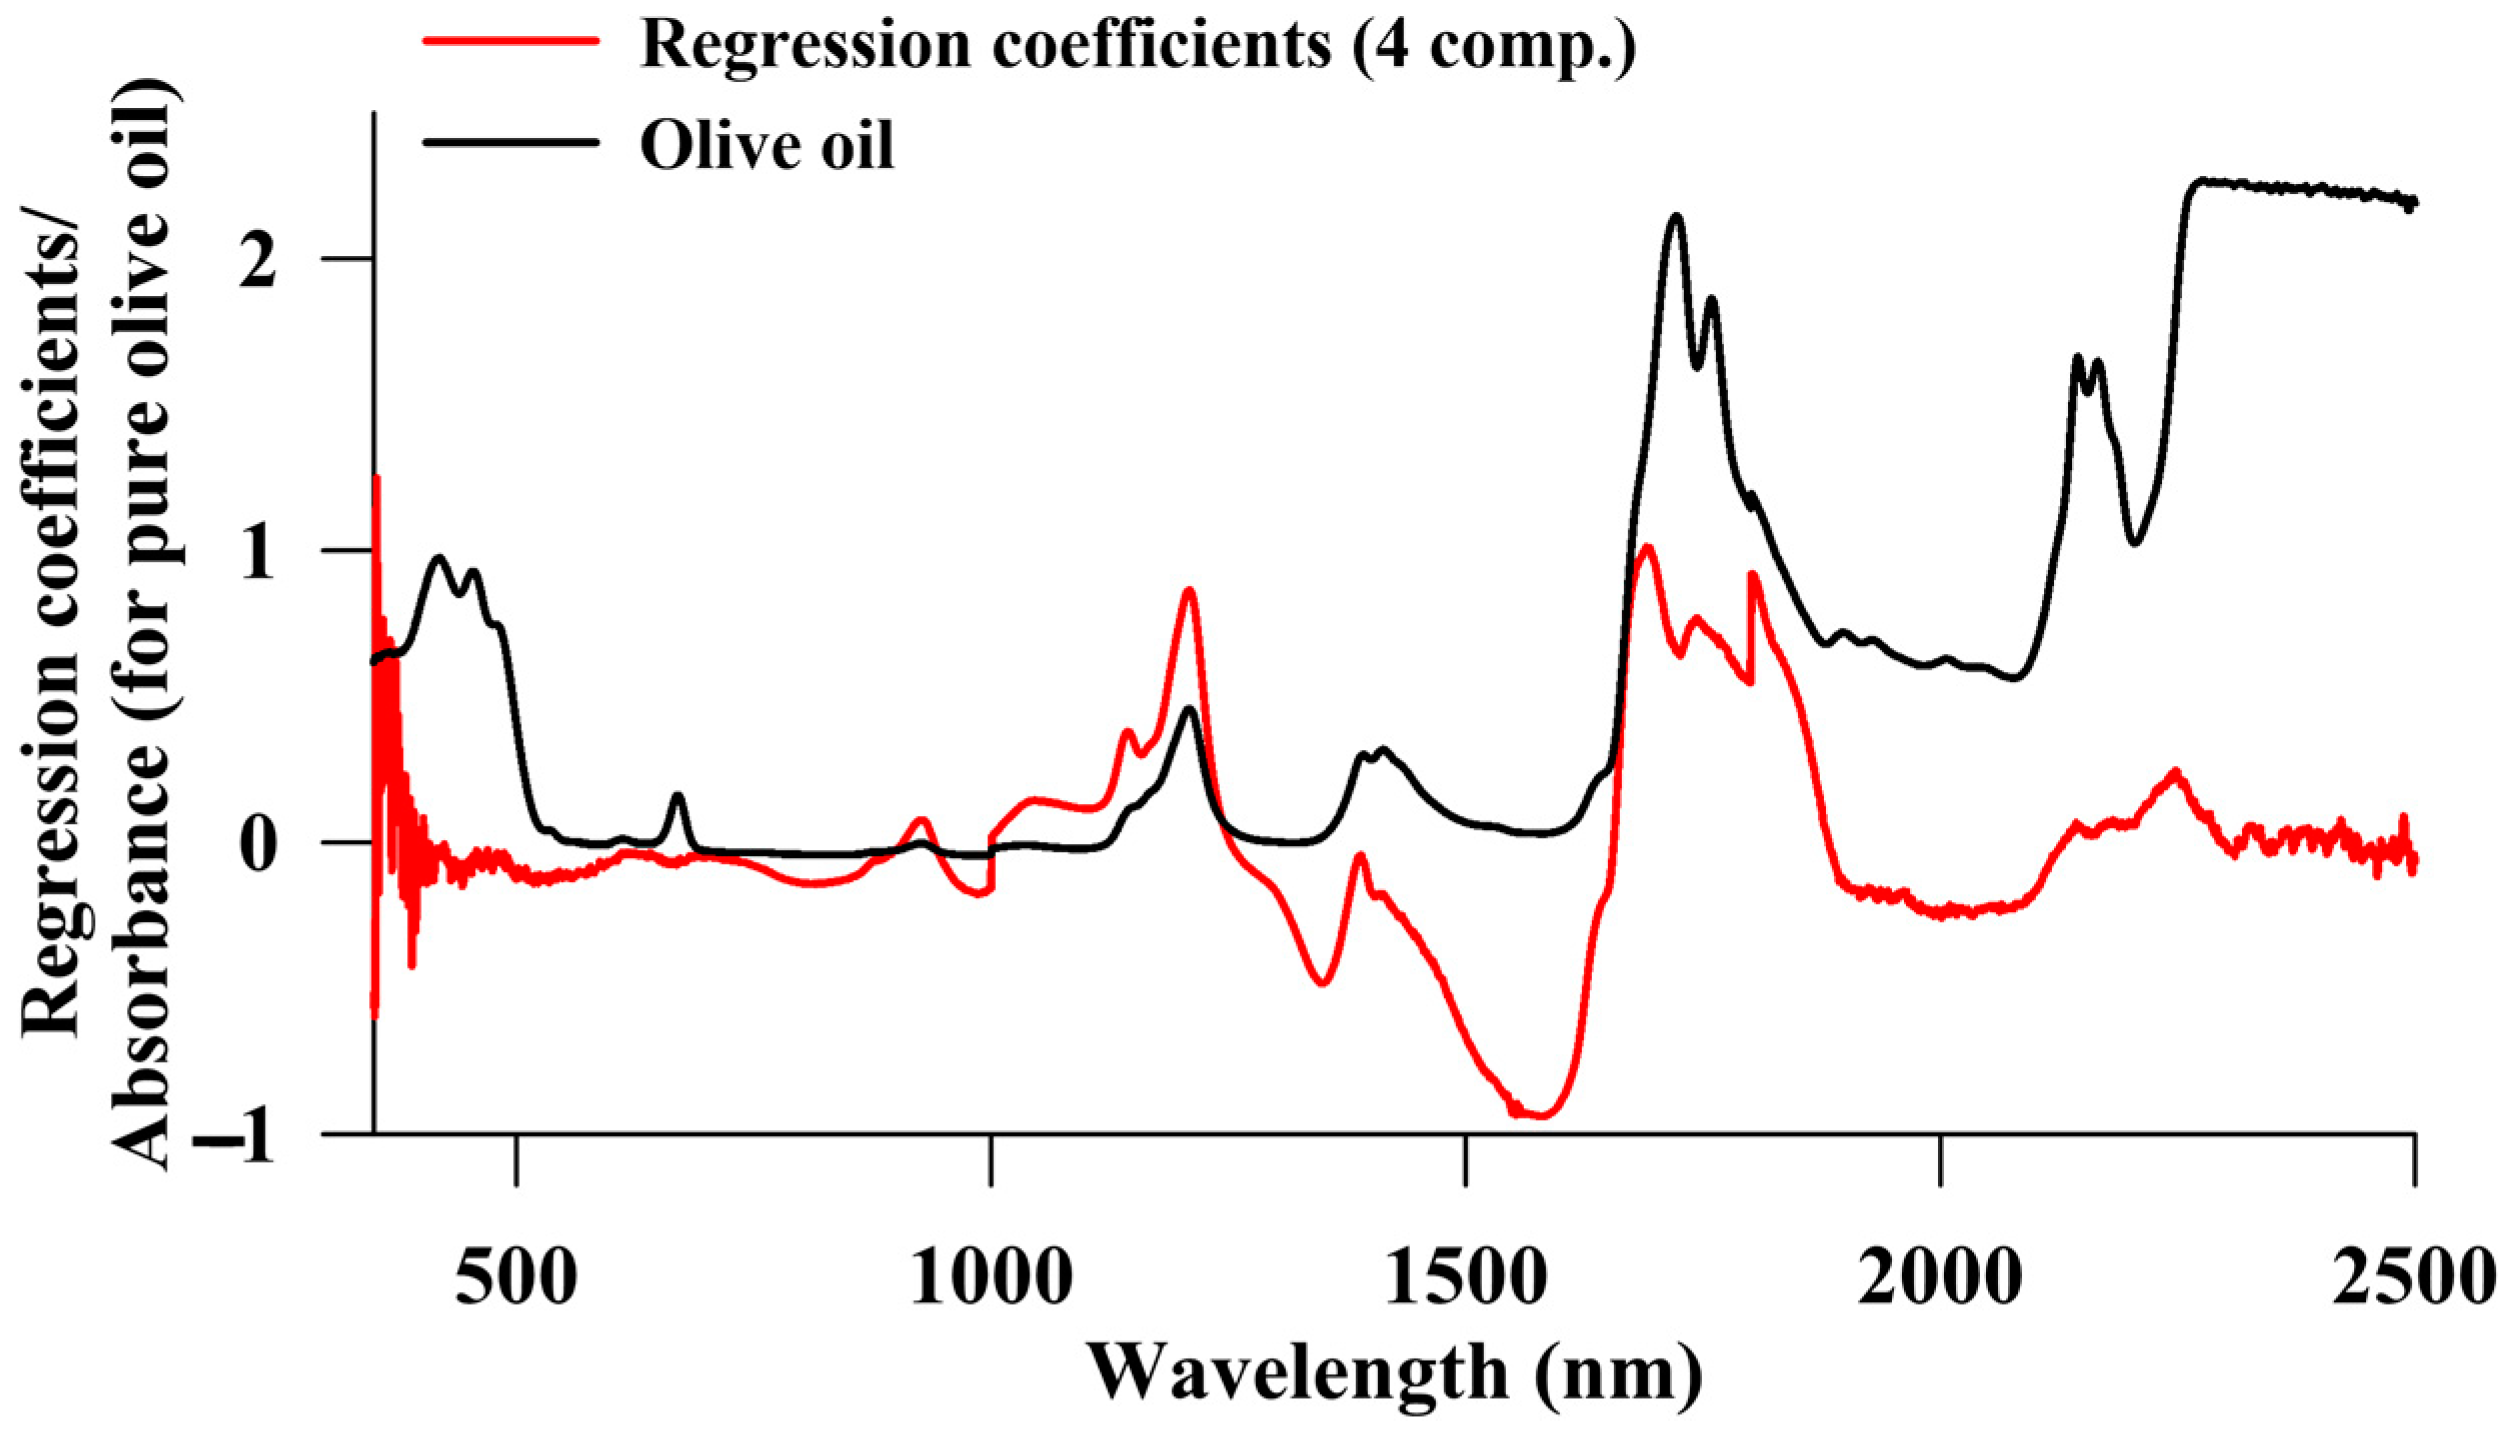
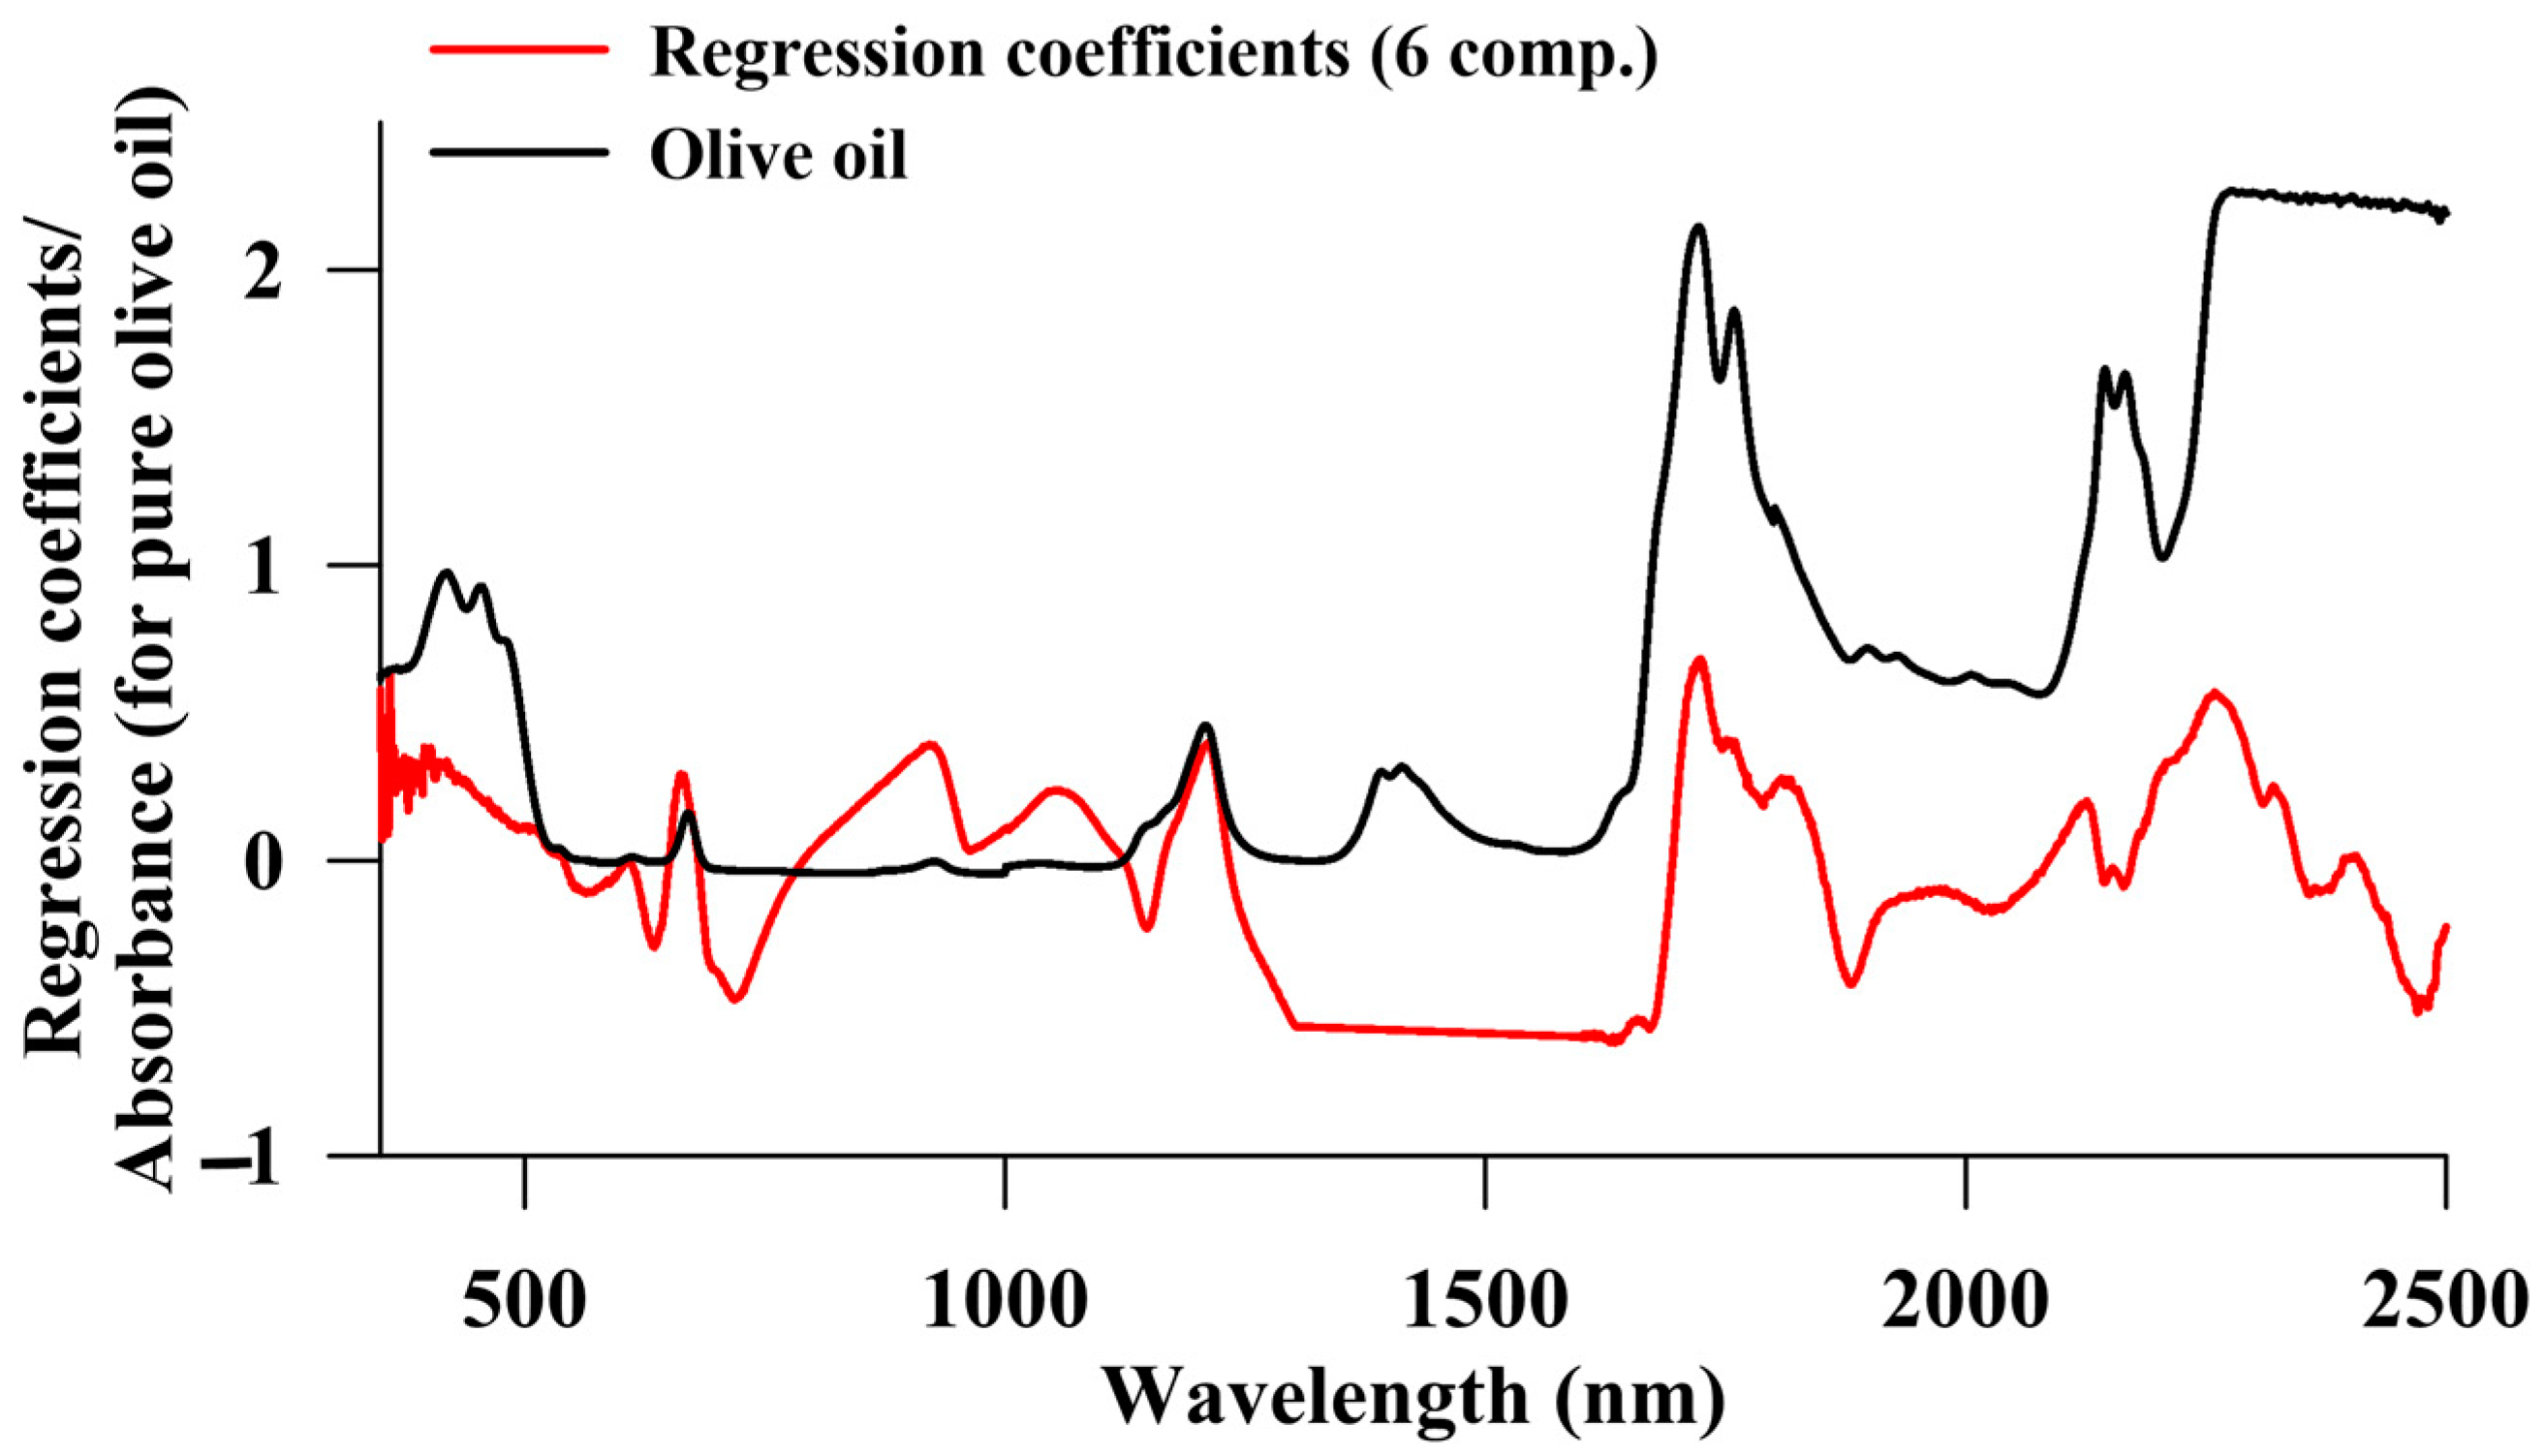
2.5. Multivariate Data Analysis
2.6. Statistical Analysis
3. Results
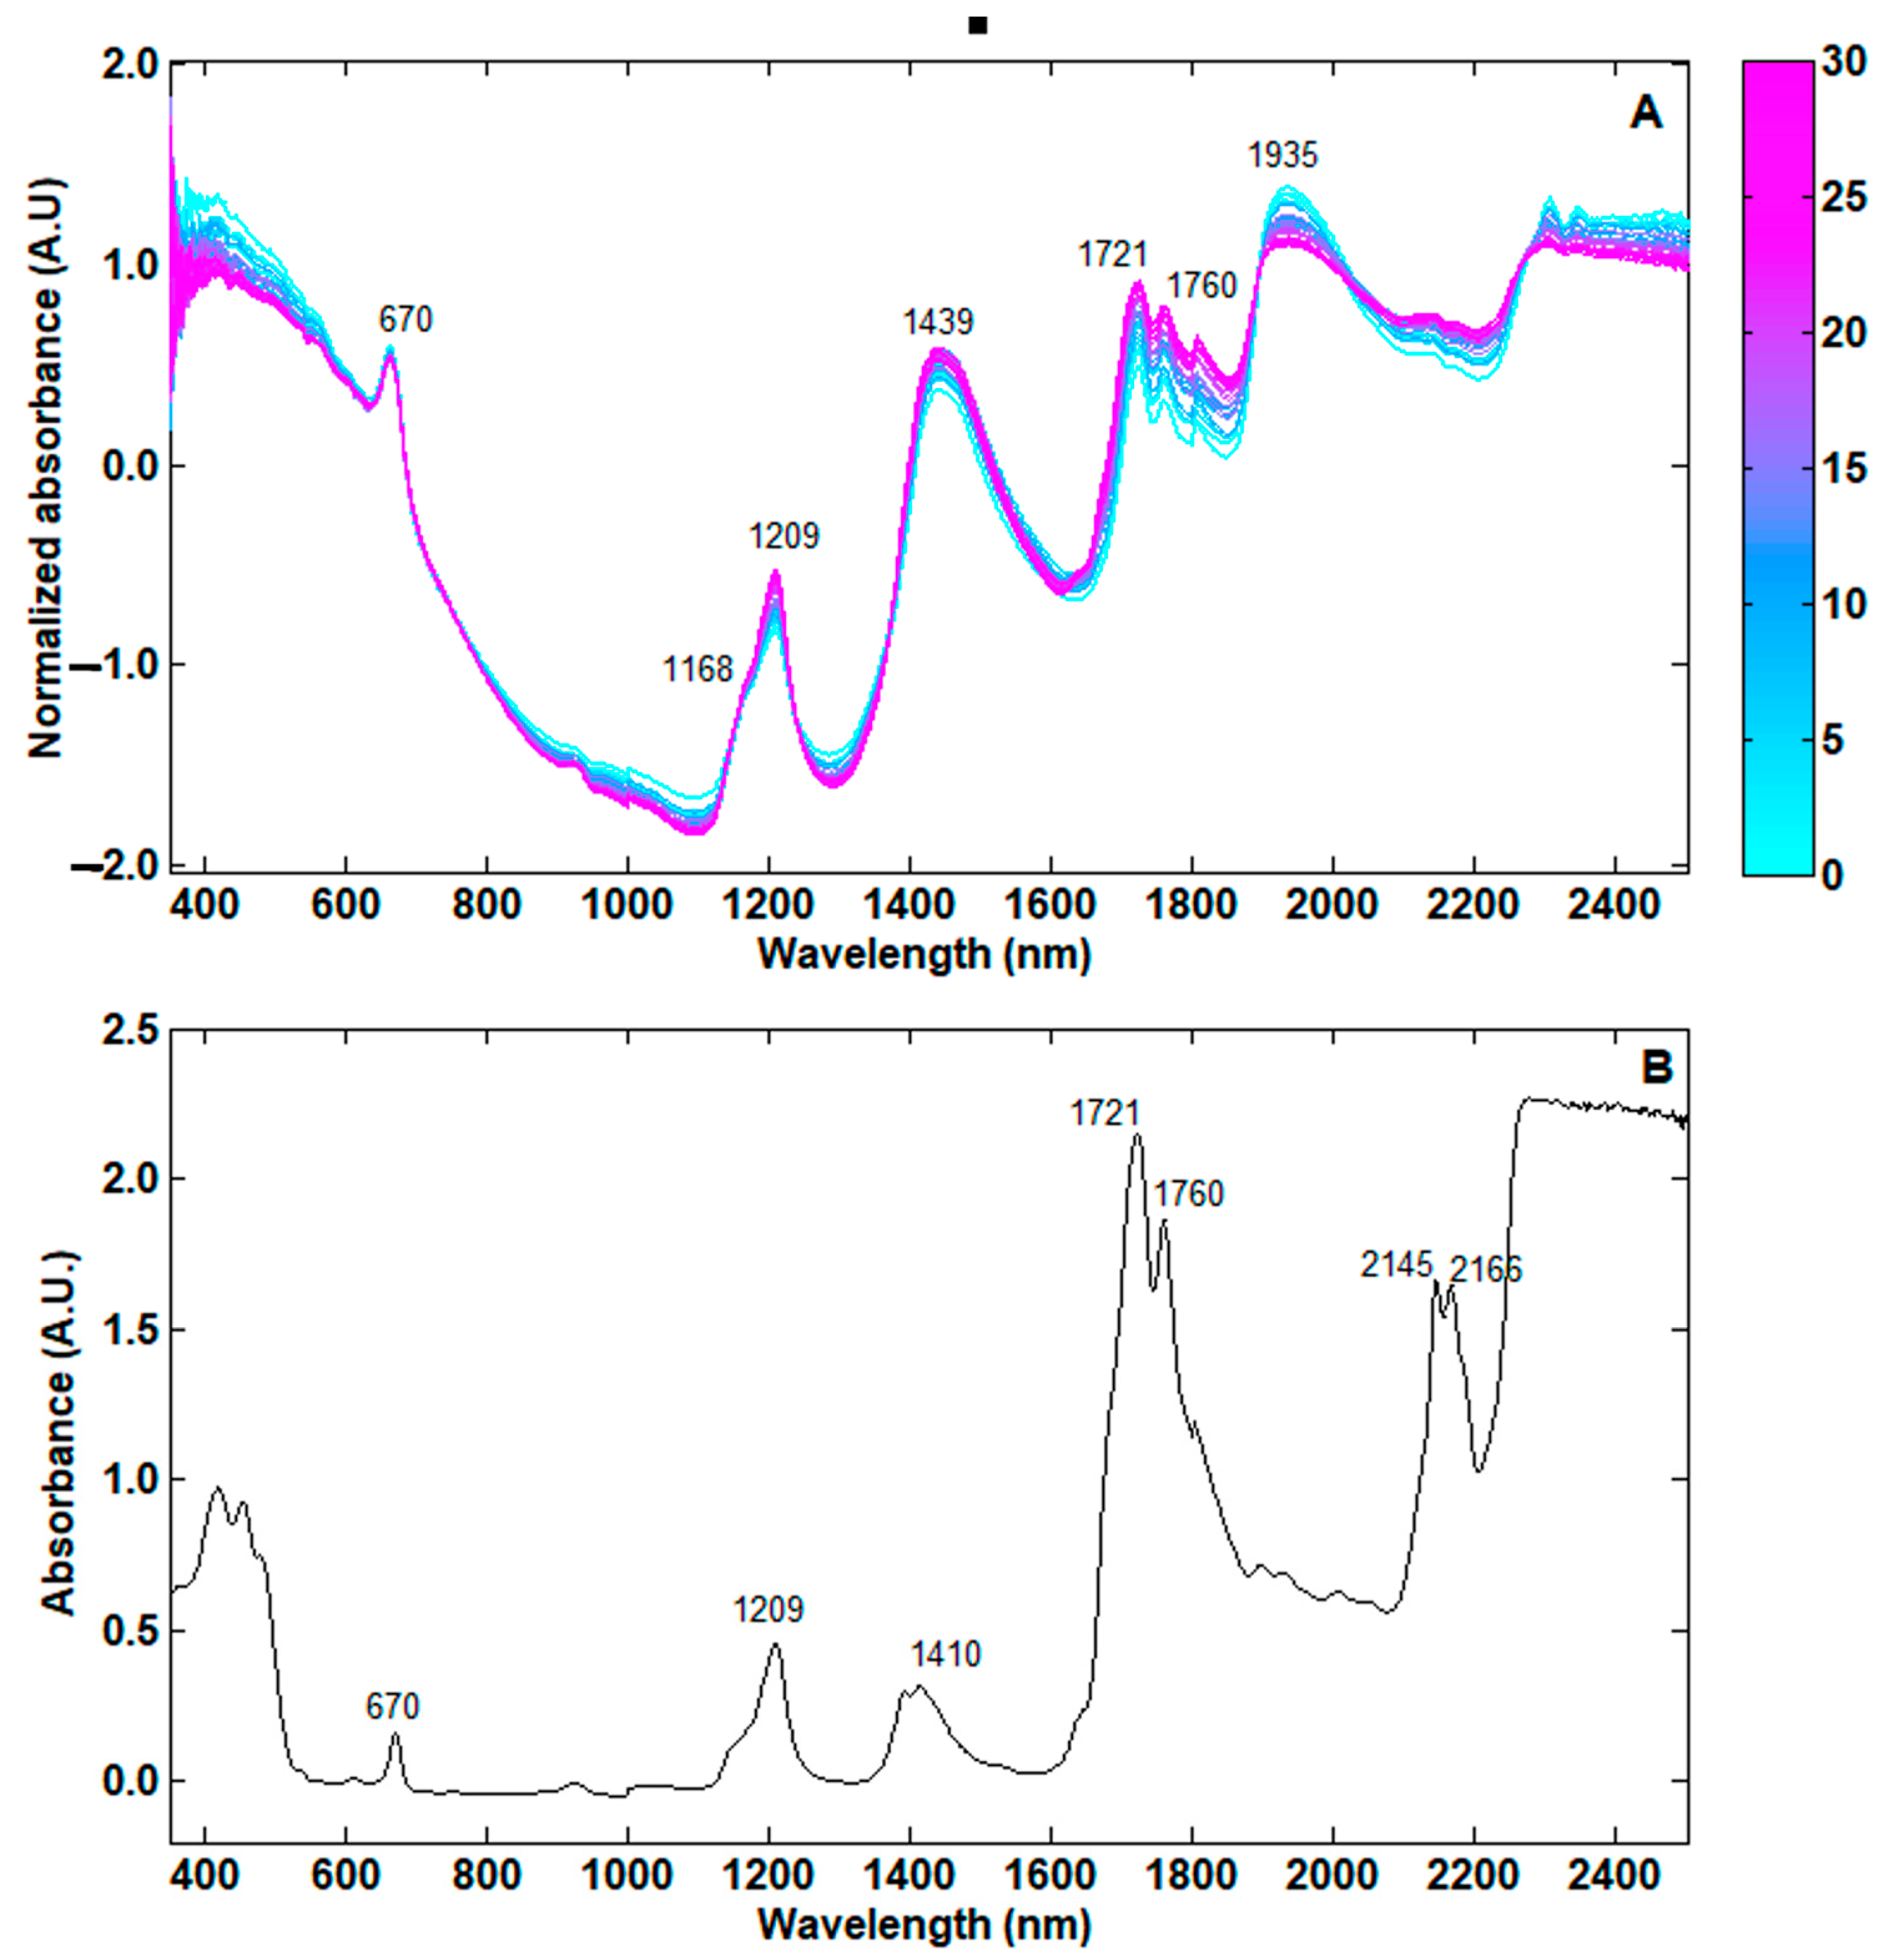
3.1. NIR Spectra Information
3.2. Total Fat Quantification
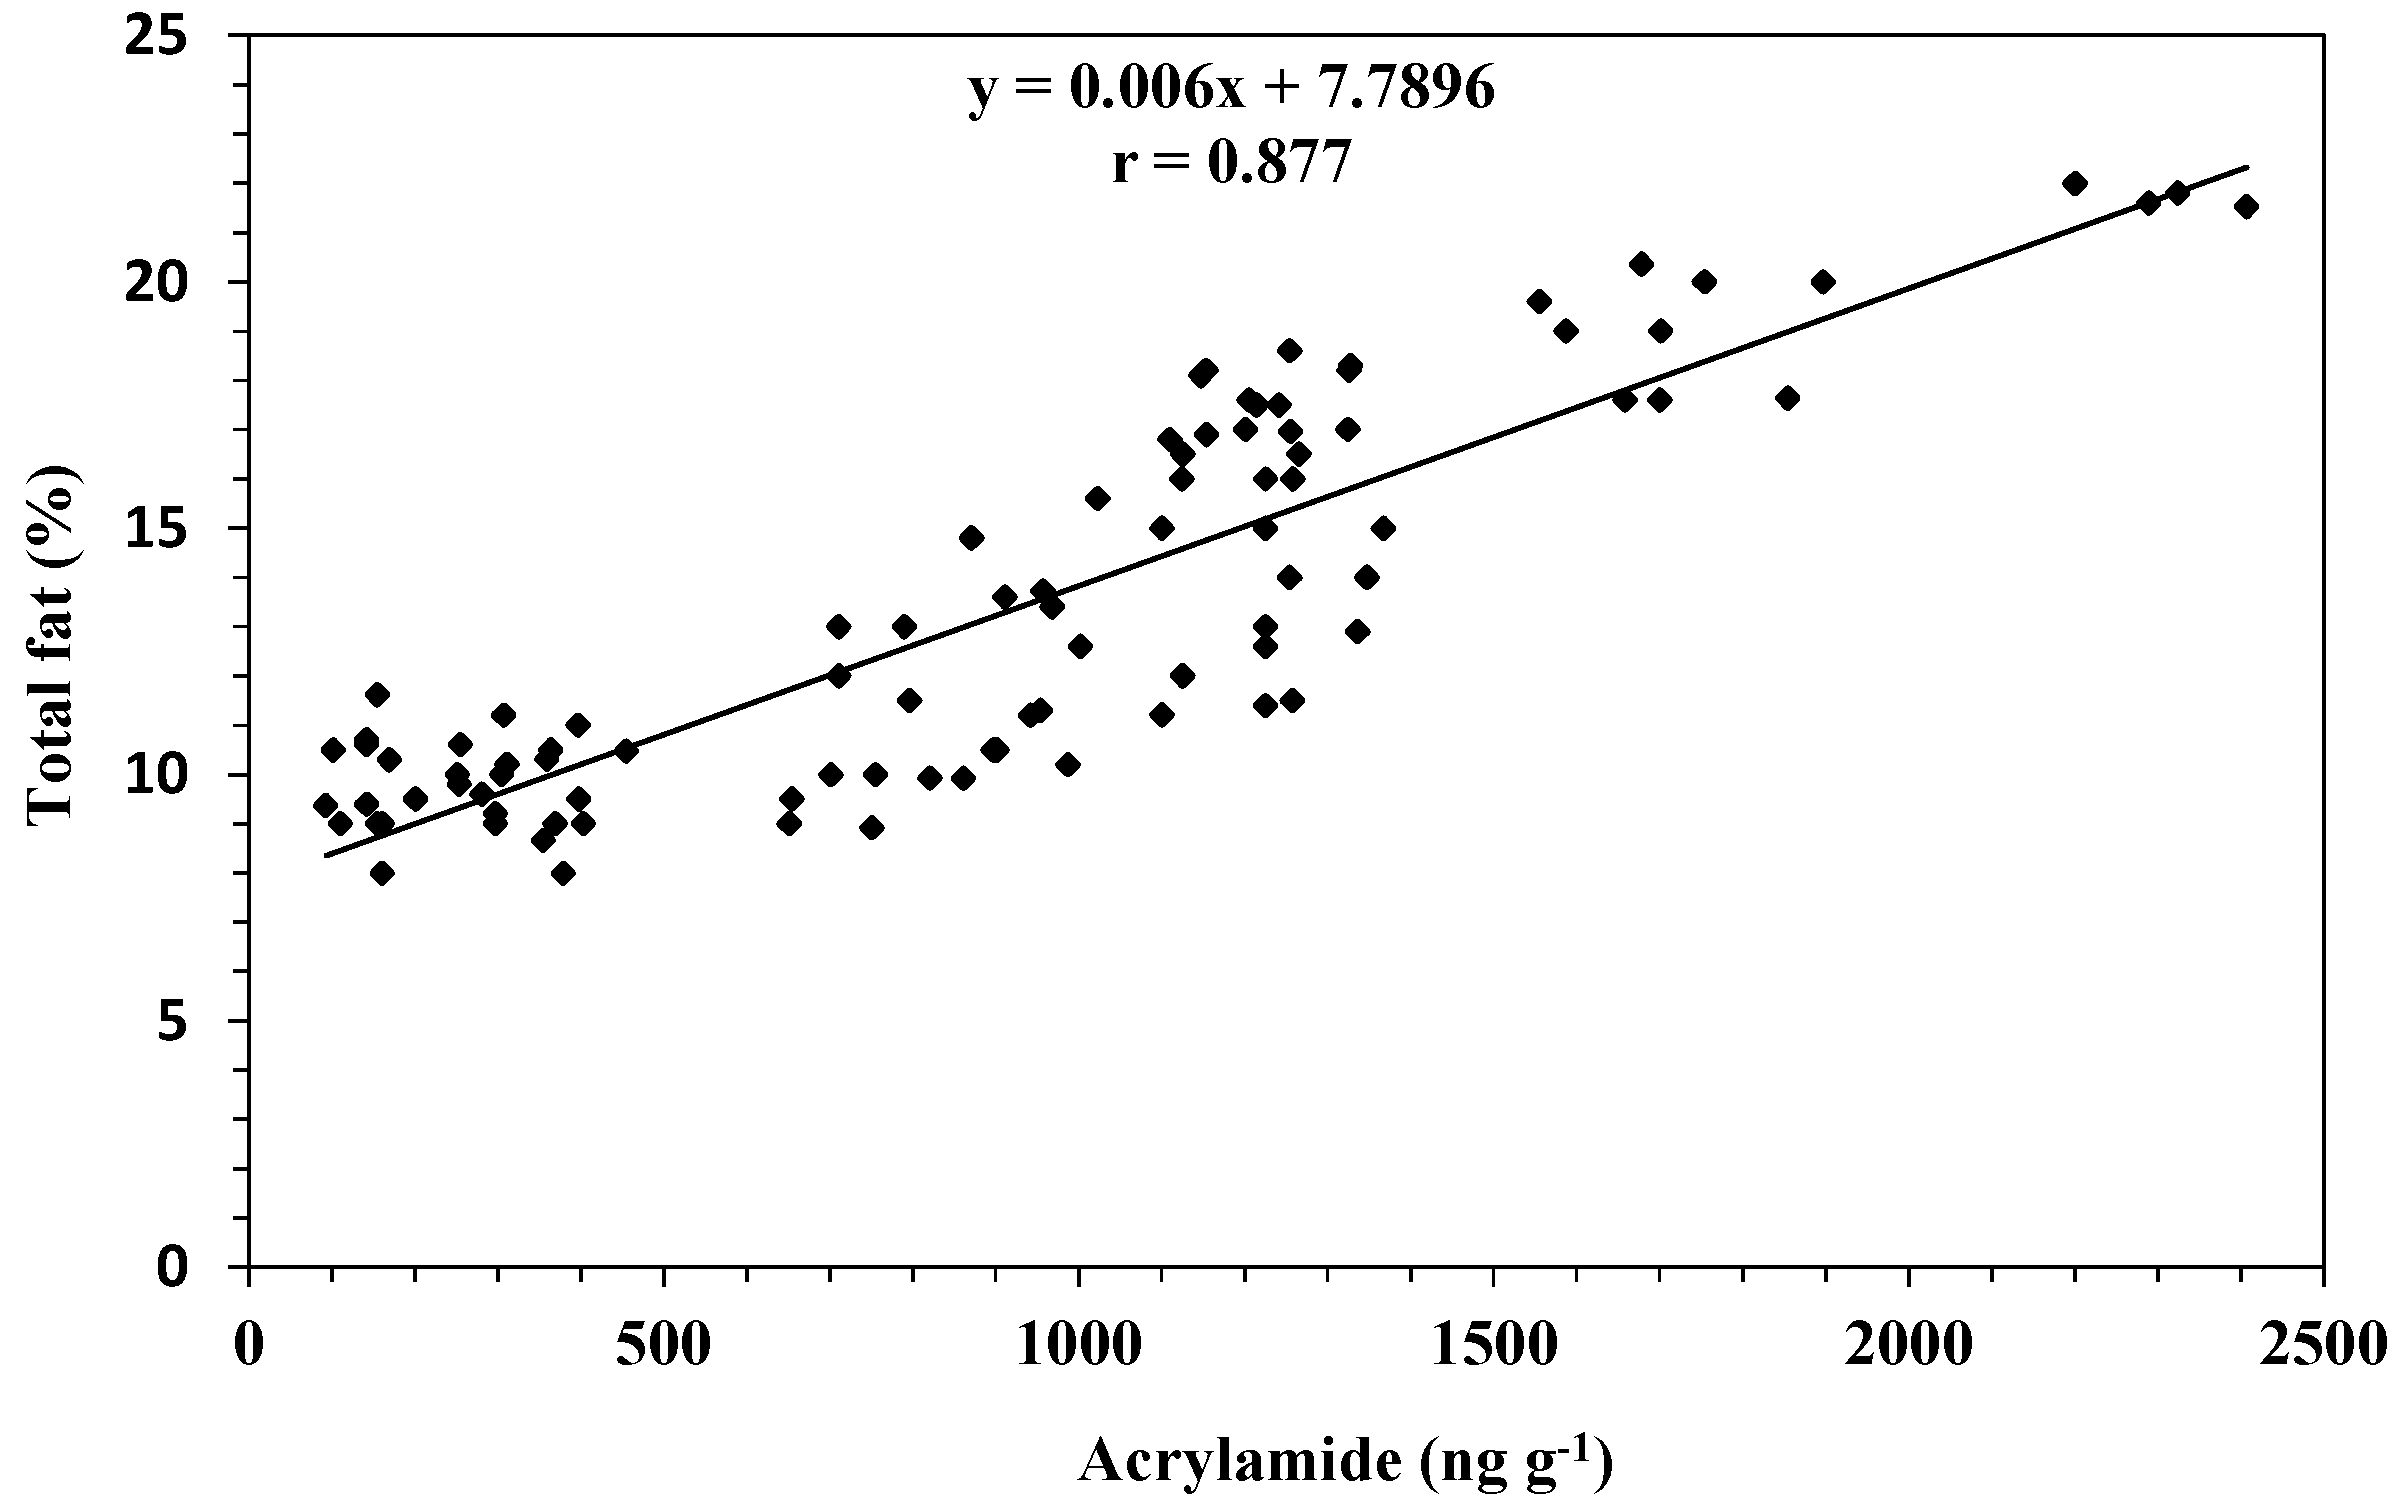
3.3. Relationship between Acrylamide and Fat
4. Discussion
5. Conclusions
Author Contributions
Funding
Institutional Review Board Statement
Informed Consent Statement
Data Availability Statement
Conflicts of Interest
References
- Cabrera-Bañegil, M.; Martín-Vertedor, D.; Boselli, E.; Durán-Merás, I. Control of Olive Cultivar Irrigation by Front-Face Fluorescence Excitation-Emission Matrices in Combination with PARAFAC. J. Food Compos. Anal. 2018, 69, 189–196. [Google Scholar] [CrossRef]
- Mele, M.A.; Islam, M.Z.; Kang, H.M.; Giuffrè, A.M. Pre-and Post-Harvest Factors and Their Impact on Oil Composition and Quality of Olive Fruit. Emir. J. Food Agric. 2018, 30, 592–603. [Google Scholar] [CrossRef]
- European Commission. COMMISSION DELEGATED REGULATION (EU) 2015/1830 of 8 July 2015 Amending Regulation No 2568/91/EEC on the Characteristics of Olive Oil and Olive-residue Oil and on the Relevant Methods of Analysis. Off. J. Eur. Comm. 2015, 266, 9–13. [Google Scholar]
- International Agency for Research on Cancer. Monographs on the Evaluation of Carcinogenic Risks to Humans: Some Industrial Chemicals. Acrylamide. In IARC Monographs on the Evaluation of Carcinogenic Risks to Humans; Lyons Press: Guilford, CT, USA, 1994; pp. 389–433. ISBN 9283212606. [Google Scholar]
- World Health Organization International Agency for Research on Cancer. IARC Monographs on the Evaluation of Carcinogenic Risks to Humans: Some Industrial Chemicals. Acrylamide; World Health Organization International Agency for Research on Cancer: Lyon, France, 2012; Volume 100D, ISBN 978 92 832 1319 2. [Google Scholar]
- European Food Safety Authority (EFSA). Scientific Opinion on Acrylamide in Food. EFSA J. 2015, 13, 4104. [Google Scholar] [CrossRef]
- Pan, M.; Liu, K.; Yang, J.; Hong, L.; Xie, X.; Wang, S. Review of Research into the Determination of Acrylamide in Foods. Foods 2020, 9, 524. [Google Scholar] [CrossRef] [PubMed]
- Pérez-Nevado, F.; Cabrera-Bañegil, M.; Repilado, E.; Martillanes, S.; Martín-Vertedor, D. Effect of Different Baking Treatments on the Acrylamide Formation and Phenolic Compounds in Californian-Style Black Olives. Food Control 2018, 94, 22–29. [Google Scholar] [CrossRef]
- European Commission. COMMISSION RECOMMENDATION (EU) 2019/1888 of 7 November 2019 on the Monitoring of the Presence of Acrylamide in Certain Foods. Off. J. Eur. Union 2019, 62, 31–33. [Google Scholar]
- European Food Safety Authority (EFSA). REGLAMENTO (UE) 2017/2158 DE LA COMISIÓN—de 20 de Noviembre de 2017—Por El Que Se Establecen Medidas de Mitigación y Niveles de Referencia Para Reducir La Presencia de Acrilamida En Los Alimentos. Off. J. Eur. Union 2017, 304, 24–44. [Google Scholar]
- Casado, F.J.; Montaño, A. Influence of Processing Conditions on Acrylamide Content in Black Ripe Olives. J. Agric. Food Chem. 2008, 56, 2021–2027. [Google Scholar] [CrossRef]
- Casado, F.J.; Montaño, A.; Spitzner, D.; Carle, R. Investigations into Acrylamide Precursors in Sterilized Table Olives: Evidence of a Peptic Fraction Being Responsible for Acrylamide Formation. Food Chem. 2013, 141, 1158–1165. [Google Scholar] [CrossRef]
- Martín-Vertedor, D.; Fernández, A.; Mesías, M.; Martínez, M.; Díaz, M.; Martín-Tornero, E.; Martínez, M.; Díaz, M.; Martín-Tornero, E. Industrial Strategies to Reduce Acrylamide Formation in Californian-Style Green Ripe Olives. Foods 2020, 9, 1202. [Google Scholar] [CrossRef]
- Casado, F.J.; Sánchez, A.H.; Montaño, A. Reduction of Acrylamide Content of Ripe Olives by Selected Additives. Food Chem. 2010, 119, 161–166. [Google Scholar] [CrossRef]
- Martín-Vertedor, D.; Fernández, A.; Hernández, A.; Arias-Calderón, R.; Delgado-Adámez, J.; Pérez-Nevado, F. Acrylamide Reduction after Phenols Addition to Californian-Style Black Olives. Food Control 2020, 108, 106888. [Google Scholar] [CrossRef]
- Lodolini, E.M.; Cabrera-Bañegil, M.; Fernández, A.; Delgado-Adámez, J.; Ramírez, R.; Martín-Vertedor, D. Monitoring of Acrylamide and Phenolic Compounds in Table Olive after High Hydrostatic Pressure and Cooking Treatments. Food Chem. 2019, 286, 250–259. [Google Scholar] [CrossRef] [PubMed]
- Beć, K.B.; Grabska, J.; Huck, C.W. In Silico NIR Spectroscopy—A Review. Molecular Fingerprint, Interpretation of Calibration Models, Understanding of Matrix Effects and Instrumental Difference. Spectrochim. Acta-Part A Mol. Biomol. Spectrosc. 2022, 279, 121438. [Google Scholar] [CrossRef]
- Porep, J.U.; Kammerer, D.R.; Carle, R. On-Line Application of near Infrared (NIR) Spectroscopy in Food Production. Trends Food Sci. Technol. 2015, 46, 211–230. [Google Scholar] [CrossRef]
- Tahir, H.E.; Xiaobo, Z.; Jianbo, X.; Mahunu, G.K.; Jiyong, S.; Xu, J.L.; Sun, D.W. Recent Progress in Rapid Analyses of Vitamins, Phenolic, and Volatile Compounds in Foods Using Vibrational Spectroscopy Combined with Chemometrics: A Review. Food Anal. Methods 2019, 12, 2361–2382. [Google Scholar] [CrossRef]
- Vanstone, N.; Moore, A.; Martos, P.; Neethirajan, S. Detection of the Adulteration of Extra Virgin Olive Oil by Near-Infrared Spectroscopy and Chemometric Techniques. Food Qual. Saf. 2018, 2, 189–198. [Google Scholar] [CrossRef]
- Vega-Castellote, M.; Pérez-Marín, D.; Torres, I.; Sánchez, M.T. Non-Destructive Determination of Fatty Acid Composition of in-Shell and Shelled Almonds Using Handheld NIRS Sensors. Postharvest Biol. Technol. 2021, 174, 111459. [Google Scholar] [CrossRef]
- Ozaki, Y.; Huck, C.W.; Bec, K.B. Near Infrared Spectroscopy and Its Applications; Elsevier: Amsterdam, The Netherlands, 2017; pp. 11–38. [Google Scholar]
- Czarnecki, M.A.; Morisawa, Y.; Futami, Y.; Ozaki, Y. Advances in Molecular Structure and Interaction Studies Using Near-Infrared Spectroscopy. Chem. Rev. 2015, 115, 9707–9744. [Google Scholar] [CrossRef]
- Beganović, A.; Beć, K.B.; Grabska, J.; Stanzl, M.T.; Brunner, M.E.; Huck, C.W. Vibrational Coupling to Hydration Shell—Mechanism to Performance Enhancement of Qualitative Analysis in NIR Spectroscopy of Carbohydrates in Aqueous Environment. Spectrochim. Acta-Part A Mol. Biomol. Spectrosc. 2020, 237, 118359. [Google Scholar] [CrossRef] [PubMed]
- Martín-Vertedor, D.; Fernández, A.; Mesías, M.; Martínez, M.; Martín-Tornero, E. Identification of Mitigation Strategies to Reduce Acrylamide Levels during the Production of Black Olives. J. Food Compos. Anal. 2021, 102, 104009. [Google Scholar] [CrossRef]
- Kozłowska, M.; Gruczyńska, E.; Ścibisz, I.; Rudzińska, M. Fatty Acids and Sterols Composition, and Antioxidant Activity of Oils Extracted from Plant Seeds. Food Chem. 2016, 213, 450–456. [Google Scholar] [CrossRef]
- Bermudo, E.; Moyano, E.; Puignou, L.; Galceran, M.T. Determination of Acrylamide in Foodstuffs by Liquid Chromatography Ion-Trap Tandem Mass-Spectrometry Using an Improved Clean-up Procedure. Anal. Chim. Acta 2006, 559, 207–214. [Google Scholar] [CrossRef]
- Paul, G.; Bruce, R.K. Partial Least-Squares Regression: A Tutorial. Anal. Chim. Acta 1986, 185, 1–17. [Google Scholar]
- Alamprese, C.; Grassi, S.; Tugnolo, A.; Casiraghi, E. Prediction of Olive Ripening Degree Combining Image Analysis and FT-NIR Spectroscopy for Virgin Olive Oil Optimisation. Food Control 2021, 123, 107755. [Google Scholar] [CrossRef]
- Meng, X.; Yin, C.; Yuan, L.; Zhang, Y.; Ju, Y.; Xin, K.; Chen, W.; Lv, K.; Hu, L. Rapid Detection of Adulteration of Olive Oil with Soybean Oil Combined with Chemometrics by Fourier Transform Infrared, Visible-near-Infrared and Excitation-Emission Matrix Fluorescence Spectroscopy: A Comparative Study. Food Chem. 2023, 405, 134828. [Google Scholar] [CrossRef]
- Armenta, S.; Moros, J.; Garrigues, S.; De La Guardia Cirugeda, M. Determination of Olive Oil Parameters by Near Infrared Spectrometry. In Olives and Olive Oil in Health and Disease Prevention; Elsevier: Amsterdam, The Netherlands, 2010; pp. 533–544. ISBN 9780123744203. [Google Scholar]
- Salguero-Chaparro, L.; Baeten, V.; Fernández-Pierna, J.A.; Peña-Rodríguez, F. Near Infrared Spectroscopy (NIRS) for on-Line Determination of Quality Parameters in Intact Olives. Food Chem. 2013, 139, 1121–1126. [Google Scholar] [CrossRef]
- Cayuela, J.A.; García, J.F. Sorting Olive Oil Based on Alpha-Tocopherol and Total Tocopherol Content Using near-Infra-Red Spectroscopy (NIRS) Analysis. J. Food Eng. 2017, 202, 79–88. [Google Scholar] [CrossRef]
- Ehling, S.; Hengel, M.; Shibamoto, T. Formation of Acrylamide from Lipids. Adv. Exp. Med. Biol. 2005, 561, 223–233. [Google Scholar] [CrossRef]
- Xu, X.; An, X. Study on Acrylamide Inhibitory Mechanism in Maillard Model Reaction: Effect of p-Coumaric Acid. Food Res. Int. 2016, 84, 9–17. [Google Scholar] [CrossRef]
- Liu, J. Acrylamide Is Formed in the Maillard Reaction. J. Sci. Food Agric. 2018, 98, 448–449. [Google Scholar] [CrossRef]
- Rocha, J.; Borges, N.; Pinho, O. Table Olives and Health: A Review. J. Nutr. Sci. 2020, 9, e57. [Google Scholar] [CrossRef]
- Friedman, M. Acrylamide: Inhibition of Formation in Processed Food and Mitigation of Toxicity in Cells, Animals, and Humans. Food Funct. 2015, 6, 1752–1772. [Google Scholar] [CrossRef] [PubMed]
- Fernández, A.; Martillanes, S.; Lodolini, E.M.; Martínez, M.; Arias-Calderón, R.; Martín-Vertedor, D. Effect of Elaboration Process, Crop Year and Irrigation on Acrylamide Levels of Potential Table Olive Varieties. J. Sci. food Agric. 2023. Online ahead of print. [Google Scholar] [CrossRef] [PubMed]
- Yaylayan, V.A.; Stadler, R.H. Acrylamide Formation in Food: A Mechanistic Perspective. J. AOAC Int. 2005, 88, 262–267. [Google Scholar] [CrossRef]
- Granvogl, M.; Jezussek, M.; Koehler, P.; Schieberle, P. Quantitation of 3-Aminopropionamide in Potatoes—A Minor but Potent Precursor in Acrylamide Formation. J. Agric. Food Chem. 2004, 52, 4751–4757. [Google Scholar] [CrossRef]
- Kerimi, A.; Nyambe-Silavwe, H.; Pyner, A.; Oladele, E.; Gauer, J.S.; Stevens, Y.; Williamson, G. Nutritional Implications of Olives and Sugar: Attenuation of Post-Prandial Glucose Spikes in Healthy Volunteers by Inhibition of Sucrose Hydrolysis and Glucose Transport by Oleuropein. Eur. J. Nutr. 2019, 58, 1315–1330. [Google Scholar] [CrossRef]


Disclaimer/Publisher’s Note: The statements, opinions and data contained in all publications are solely those of the individual author(s) and contributor(s) and not of MDPI and/or the editor(s). MDPI and/or the editor(s) disclaim responsibility for any injury to people or property resulting from any ideas, methods, instructions or products referred to in the content. |
© 2023 by the authors. Licensee MDPI, Basel, Switzerland. This article is an open access article distributed under the terms and conditions of the Creative Commons Attribution (CC BY) license (https://creativecommons.org/licenses/by/4.0/).
Share and Cite
Fernández, A.; Montero-Fernández, I.; Monago-Maraña, O.; Martín-Tornero, E.; Martín-Vertedor, D. Acrylamide–Fat Correlation in Californian-Style Black Olives Using Near-Infrared Spectroscopy. Chemosensors 2023, 11, 491. https://doi.org/10.3390/chemosensors11090491
Fernández A, Montero-Fernández I, Monago-Maraña O, Martín-Tornero E, Martín-Vertedor D. Acrylamide–Fat Correlation in Californian-Style Black Olives Using Near-Infrared Spectroscopy. Chemosensors. 2023; 11(9):491. https://doi.org/10.3390/chemosensors11090491
Chicago/Turabian StyleFernández, Antonio, Ismael Montero-Fernández, Olga Monago-Maraña, Elísabet Martín-Tornero, and Daniel Martín-Vertedor. 2023. "Acrylamide–Fat Correlation in Californian-Style Black Olives Using Near-Infrared Spectroscopy" Chemosensors 11, no. 9: 491. https://doi.org/10.3390/chemosensors11090491