Article

MoS2@Au as Label for Sensitive Sandwich-Type Immunoassay of Neuron-Specific Enolase

1
Shandong Provincial Key Laboratory of Molecular Engineering, School of Chemistry and Chemical Engineering, Qilu University of Technology (Shandong Academy of Sciences), Jinan 250353, China
2
Collaborative Innovation Center for Green Chemical Manufacturing and Accurate Detection, Key Laboratory of Interfacial Reaction & Sensing Analysis in Universities of Shandong, School of Chemistry and Chemical Engineering, University of Jinan, Jinan 250022, China
3
Provincial Key Laboratory of Rural Energy Engineering in Yunnan, School of Energy and Environment Science, Yunnan Normal University, Kunming 650500, China
*
Authors to whom correspondence should be addressed.
Chemosensors 2023, 11(6), 349; https://doi.org/10.3390/chemosensors11060349
Submission received: 22 April 2023 / Revised: 13 June 2023 / Accepted: 17 June 2023 / Published: 19 June 2023

Abstract

:
Neuron-specific enolase (NSE) has gained extensive attention as a reliable target for detecting small cell carcinoma of lungs. In this paper, an electrochemical immunoassay method based on molybdenum disulfide (MoS2) is proposed to detect NSE sensitively. By an in-situ growth method, MoS2 and Au nanoclusters (Au NCs) were composited to form a MoS2@Au nanozyme, and then the secondary antibodies were modified. Primary antibodies were immobilized on amino-reduced graphene oxides to capture NSE. The flower-like MoS2 nanozyme provided abundant sites to load Au NCs and catalyze the decomposition of H2O2, which were beneficial to amplify an amperometric response as well as build up sensitivity. Under optimum conditions, the detection range of this strategy was 0.1 pg·mL−1–10 ng·mL−1 and the limit of detection was 0.05 pg·mL−1. This sensing strategy achieved the prospect of sensitively detecting NSE. Moreover, the prepared electrochemical immunosensor provides a theoretical basis and technical support for the detection of other disease markers.

1. Introduction

According to global cancer data compiled by the international agency for research on cancer of the World Health Organization, there were 19.29 million new cancer cases around the world in 2020. Lung cancer has a high incidence and ranks first among all cancer cases. The proportion of early-onset cancers has been on the rise since 1990. The low cure rate of cancer is mainly due to late clinical diagnosis, and it is extremely difficult for patients in the advanced stage of cancer to be completely cured. Therefore, early diagnosis and the treatment of cancer is a key factor in reducing fatality rates. Tumor markers as biomarkers are very important for the early diagnosis of cancer. Lung cancer, with a high fatality rate, is mainly divided into small cell carcinoma of the lung (SCLC) and non-small cell carcinoma the lung (NSCLC) [1]. SCLC is an invasive neuroendocrine tumor with the characteristics of rapid proliferation, swift division, and poor prognosis, resulting in a low early cure rate of SCLC patients [2,3,4]. Therefore, early diagnosis is expected to improve the survival rate of SCLC patients. Neuron-specific enolase (NSE) is a unique type of acidic protease produced by neurons and neuroendocrine cells, and its normal level is 4–12 ng·mL−1 in human serum [5,6,7]. The concentration of NSE in human serum can distinguish SCLC from NSCLC and be adjunctive to clinical treatment in certain circumstances [8]. Therefore, the rapid and accurate detection of NSE is of great significance for the diagnosis and therapy of lung cancer.
At present, the detection methods of NSE mainly include electrochemical analysis [9], colorimetry [10], fluorescence analysis [11], liquid chromatography-tandem mass spectrometry [12], surface-enhanced Raman scattering [13], and immunochromatographic [14]. Xu et al. [15] designed a colorimetric analysis strategy to detect NSE, employing MnO2 as label materials. MnO2 catalyzed the oxidation of 3, 3′, 5,5′-tetramethylbenzidine (TMB) and gained blue oxidation products. In the light of this color reaction, visual detection of NSE was realized. Gao et al. [13] introduced sandwich nanoparticles as surface enhanced Raman scattering probes, which improved the stability of bare gold nanoparticles and significantly improved the sensitivity in measuring actual samples. Xiao et al. [14] proposed an immunochromatographic analysis platform that consisted of quantum dot beads and nitrocellulose membranes to quantify NSE and CEA. The sensitivity of NSE detected by this method was up to 97%. Among them, electrochemical immunosensors attracted more attention from researchers on account of their merits, such as high specificity, fine accuracy, and satisfactory stability [16]. The mechanism of the immunosensor for detecting NSE is that the output signal can be recorded before and after the specific recognition of the target through the sensor. In recent years, the performance of sensors has been greatly improved owing to the application of functionalized nanomaterials. An immunoassay strategy was proposed based on nitrogen-doped carbon quantum dots (N-CQDs) which were prepared by hydrothermal carbonization. Reduced graphene oxide (rGO) modified by N-CQDs effectively enhanced the luminescence intensity and improved the performance of the immunosensor in measuring NSE [17]. Tang et al. designed N atom-doped graphenes (NGR) functionalized with hollow porous Pt-skin Ag–Pt alloy as a signal amplification platform [18]. The signal was amplified by the hollow Pt skins with abundant active sites and NGR with well-catalytic activity. Electrochemical immunosensors are more prominent in NSE detection because of their advantages of high sensitivity, simple operation, and simple equipment. Amani et al. [19] synthesized poly p-phenylenediamine and graphene (PPD-GR) nanocomposites for fabricating sensors. PPD-GR nanocomposites were modified in screen-printed electrodes and then PPD-GR electro-catalyzed oxidation of ascorbic acid (AA) to amplify signal amplification. With high catalytic activity, PtCu nanoparticles were utilized to catalyze the reaction of iodide and trigger cascade reactions, which could improve the performance of immunosensors. Due to the PtCu nanoprobe reducing the concentration of iodide in the solution, mercaptan substances in the electrode surface cannot be catalyzed, resulting in an increase of the SWV signal. On the grounds of the above mechanism, the immunoassay of NSE was realized. [20]. Yu et al. [21] obtained single-walled carbon nanotubes-NSE (NSE-SWNTs) by immobilizing NSE in single-walled carbon nanotubes (SWNTs) with ample antigen domains. When specific recognition occurred, free NSE and NSE on NSE-SWNTs competed with NSE-Ab1, which resulted in a difference in the amount of anti-NSE-Ab1 labeled by an enzyme on the electrode, leading to the change of electrochemical signals. Given the above research, the application of nanomaterials was crucial to improving the practicability and sensitivity of the sensors in the analysis and detection of targets.
As a kind of special nanomaterials, nanozymes can mimic the activity of natural enzymes and possess better application prospects than other nanomaterials in sensing analysis, antibacterial performance, and other fields [22,23]. In addition, the activity of nanozymes can be controlled by changing the size, morphology, and surface modification of nanozymes. Nanozymes are favored by researchers for their outstanding environmental adaptability, fine stability, and low cost [24,25]. Zhou et al. [26] prepared Cu/N co-doped carbon-based nanozymes (Cu/N NS) by calcination, which catalyzed the decomposition of H2O2 and obtained superoxide radicals that could oxidize TMB to oxTMB in blue. A multi-enzyme cascade colorimetric sensing platform was designed based on a complex consisting of Cu/NC NS, β-galactosidase, and galactose oxidase. Wang et al. [27] prepared a hollow porous carbon-frame (Au/Co@HNCF) nanozyme modified with Au/Co bimetallic nanoparticles from zeolite imidazole frame-67 (ZIF-67) etched by pyrolytic Au (III). Au/Co NPs with excellent uric acid (UA) oxidase activity catalyzed the oxidation of UA, leading to significant changes in the electrochemical signal. Remarkably, the layered and ordered porous carbon structure and interface characteristics showed high selectivity in detecting UA in complex environments. Therefore, the constructed electrochemical analysis platform based on Au/Co@HNCF realized the sensitive detection of UA. Yang et al. [28] proposed a dual-model analysis strategy based on a bismuth-based MOF (BiO-BDC-NH2) nanozyme for the detection of trace/ultra-trace Cr6+. The BiO-BDC-NH2 nanozyme with peroxidase-like activity could effectively build up the properties of surface adsorption and electron conversion, which was beneficial to efficiently catalyzing the color reaction of a TMB-H2O2 system. As TMB was oxidized, the color of the solution became darker. According to this change, a colorimetric detection platform was established. In the meantime, the electrochemical signal decreased as a result of the oxidization of TMB, which accomplished a transformation from the visual colorimetric analysis platform to the electrochemical analysis platform. Bi et al. [29] designed a boron-doped graphdiyne (B-GDY) nanozyme as an effective bactericidal agent. The change of the mimic activity of B-GDY was mainly related to B doping. The change of the GDY electron cloud distribution was in favor of the rapid transfer of electrons to H2O2, which caused the O–O bond to break easily. The introduction of B atoms increased the number of defect sites of GDY and improved the adsorption properties of hydroxyl radicals. Therefore, B-GDY could produce reactive oxygen species (ROS) efficiently to achieve bacteriostasis. Analogously, •OH was produced in the process of glutathione decomposition catalyzed by the PdFe/GDY complex nanozyme, which effectively inhibited bacterial proliferation [30]. Biocompatibility is one of the problems that limit the further application of nanozymes.
It was reported that a molybdenum-based nanozyme is the key to solving this problem. In recent years, based on the strength of the multi-phase and polyvalence characteristics of molybdenum-based nanomaterials, researchers have gradually applied them to catalysis, energy storage, sensing, and other fields [31,32]. As the typical molybdenum-based nanomaterials, molybdenum disulfide (MoS2) consisting of vertically stacked S–Mo–S interlayers possesses a graphene-like 2D layered structure [33]. Owing to the weak interaction forces between the interlayers, MoS2 is easily stripped into thin layers and facilitates modification [34]. MoS2 owns multi-enzyme activities, which can catalyze diverse reactions of different substrates [35]. Furthermore, abundant dangling bands at the edge of MoS2 are capable of providing plentifully active sites [36,37]. Benefiting from excellent biocompatibility, low levels of toxicity, and wonderfully enzyme-like activity, MoS2 is favored by researchers in the fields of sensors and tumor therapy [38,39]. Ma et al. [40] employed ultra-thin 2H-MoS2/Co3O4 nanocomposites to detect nitroaromatic compounds. Ultra-thin 2H-MoS2 possessed a nitroreductase-mimicking activity. After the modification of Co3O4 nanosheets, the oxygen vacancy of 2H-MoS2/Co3O4 was increased, thus improving the nitroreductase-like activity. 2H-MoS2/Co3O4 provided the basis for the fabrication of an electrochemical sensor. Zhang et al. [41] fabricated an aptamer sensor, applying MoS2 quantum dots and Cu nanowires composites (MoS2 QDs@Cu NWs) as the labeled materials to detect amyloid-beta oligomers (AβO). When AβO was not present, MoS2 QDs as bio-enzymes catalyzed the reaction of produce 4-chloro-1-naphthol, producing precipitates, which significantly reduced photocurrents. Cu NWs, as an LSPR sensitizer, and MoS2 QDs amplified the signal together. The tubular C@MoS2 nanozyme owned a fine oxidase-like activity [42]. Because of Hg-S chelation, the C@MoS2 nanozyme possessed an Hg2+-enhanced oxidase-like activity. Based on this mechanism, C@MoS2 was used to construct a colorimetric sensing strategy to detect Hg2+. Zhang et al. [43] proposed a cascade platform based on antioxidant MoS2 nanosheets to inhibit the production of ROS and effectively alleviate the process of hepatic fibrosis. MoS2, which mimics the activity of multiple enzymes, could block the transfer of electrons from cytochrome c to H2O2 and remove excess ROS under pathological conditions. Therefore, the MoS2 nanosheets reduced cell damage caused by ROS. MoS2 loading in carbon nanotubes (CNTs@MoS2 NSs) combined with hydrogels to inhibit the reproduction of bacteria and promote wound healing [44]. The application of CNTs and near-infrared light treatment significantly increased the peroxidase activity of MoS2 NSs, resulting in the enhancement of antibacterial performance. In addition, because of the superoxidase-like activity and catalase-like activity of the nanozyme, MoS2 catalyzed the generation of O2, which was of benefit to effectively promote wound healing.
In this study, a MoS2@Au complex nanozyme was successfully synthesized for the detection of NSE. The NSE secondary antibody (Ab2) was coupled with the MoS2@Au nanozyme to form a MoS2@Au-Ab2 bioconjugate by electrostatic interaction between Au and the amino group. A sandwich-type immunosensor was fabricated, in which an NSE primary antibody (Ab1) was immobilized on the rGO-tetraethylene pentamine (rGO-TEPA) bound in the electrode. Whereafter, NSE and the MoS2@Au-Ab2 bioconjugate was successively modified on the electrode with antigen–antibody reaction. Ultimately, the performance of the immunosensor was measured through catalytic signals toward H2O2. Applications of the MoS2@Au nanozyme amplified the current response, and rGO-TEPA provided abundant sites to anchor Ab1. The constructed immunosensor with fine selectivity and reproducibility provided potential applications for the sensitive detection of other disease markers.

2. Materials and Methods

2.1. Apparatus and Reagents

NSE and NSE antibodies were purchased from Linc-Bio Science Co. Ltd. (Shanghai, China). Reduced graphene oxide-tetraethylene pentamine (rGO-TEPA) was purchased from XFNANO Nanotechnology Co., Ltd. (Nanjing, China). Bovine serum albumin (BSA) was purchased from Macklin Biochemical Co., Ltd. (Shanghai, China). HAuCl4∙4H2O, NaBH4, (NH4)6Mo7O24∙4H2O, glutaraldehyde (GA), polyvinylpyrrolidone K30 (PVP), and thiourea (CH4N2S) was purchased from Sinopharm Chemical Reagent Co., Ltd. (Shanghai, China).
Electrochemical measurements were performed on a CHI760E electrochemical workstation (Chenhua Instruments Shanghai Co., Ltd., Shanghai, China). X-ray diffraction patterns (XRD) were obtained by the X-ray Powder Diffractometer (Rigaku, Japan). Scanning electron microscopy (SEM) images and energy dispersion spectrum (EDS) were acquired using a field emission SEM (ZEISS, Oberkochen, Germany).

2.2. Synthesis of MoS2 and MoS2@Au Nanozyme

Firstly, the MoS2 nanozyme was prepared through a hydrothermal process in the light of the reported literature with some modifications [45]. Firstly, 1.05 g of (NH4)6Mo7O24∙4H2O and 2.28 g of CH4N2S was dissolved in 30 mL deionized water, and then the mixture solution was transferred into a 50 mL Teflon-line autoclave. After 10 h of reaction at 180 °C, the autoclave cooled to room temperature. The final product was washed with water and ethanol successively. Additionally, it was collected after drying in a vacuum overnight.
Secondly, the MoS2@Au nanozyme was prepared by referring to the literature [46]. A total of 2 mg of MoS2 and 12 mL of ethanol containing 0.6 g of PVP were mixed. After sonicating for 0.5 h, HAuCl4∙4H2O (500 μL, 0.02842 mol·L−1) and NaBH4 (500 μL, 0.06 mol·L−1) were introduced into the above solution under magnetic agitation. Thirty minutes later, the MoS2@Au nanozyme was washed with ethanol.

2.3. Fabrication of the Immunosensor

The preparation process of the MoS2@Au-Ab2 bioconjugate is shown in Scheme 1A. Ab2 (200 μL, 10 μg·mL−1) was introduced into 2 mL of a phosphate buffered solution (PBS, pH 7.4) which dispersed with 4 mg of MoS2@Au. After incubation at 4 °C for 12 h, the MoS2@Au-Ab2 bioconjugate was washed at 4 °C. The obtained precipitate was redispersed in 2 mL of PBS. Moreover, the mixture was stored at 4 °C.
The fabrication process of the immunosensor is shown in Scheme 1B. First of all, aluminum oxide powder, with sizes of 1.0, 0.3, and 0.05 μm, was employed to polish glassy carbon electrodes (GCE), while rinsing the powder off GCE with ultrapure water. Subsequently, the bare GCE was modified by rGO-TEPA suspension (6 μL). A total of 40 min later, GA (6 μL, 2.5%) was dropped onto the modified GCE and kept for 1 h. Afterward, Ab1 (6 μL, 10 μg·mL−1) was introduced onto the above modified GCE, while incubating at 4 °C for 1.5 h. After that, 1% BSA was present on the surface of electrodes to stem the nonspecific binding sites. After reacting at 4 °C for 1 h, the electrodes were modified by different concentrations of NSE and stored at 4 °C for 2 h. Ultimately, the MoS2@Au-Ab2 bioconjugate was introduced onto the surface of the modified electrodes with incubating at 4 °C for 2 h. Whereafter, the electrodes were rinsed and then dried for measuring subsequently.

2.4. The Detection of NSE

In all of the electrochemical measurements, this work adopted a conventional three-electrode system, consisting of a modified GCE with a diameter of 4 mm, a saturated calomel electrode, and a platinum wire, which was used as the working electrode, the reference electrode, and the counter electrode, respectively. A total of a 5.0 mmol·L−1 of [Fe(CN)6]3−/4− solution with 0.1 mol·L−1 KCl was employed to measure the electrochemical impedance spectroscopy (EIS). The amperometric responses were recorded by amperometric i–t curve. After stabilization of the background, 5 mmol·L−1 of H2O2 was introduced into the PBS under stirring, while recording the current response.

3. Results and Discussion

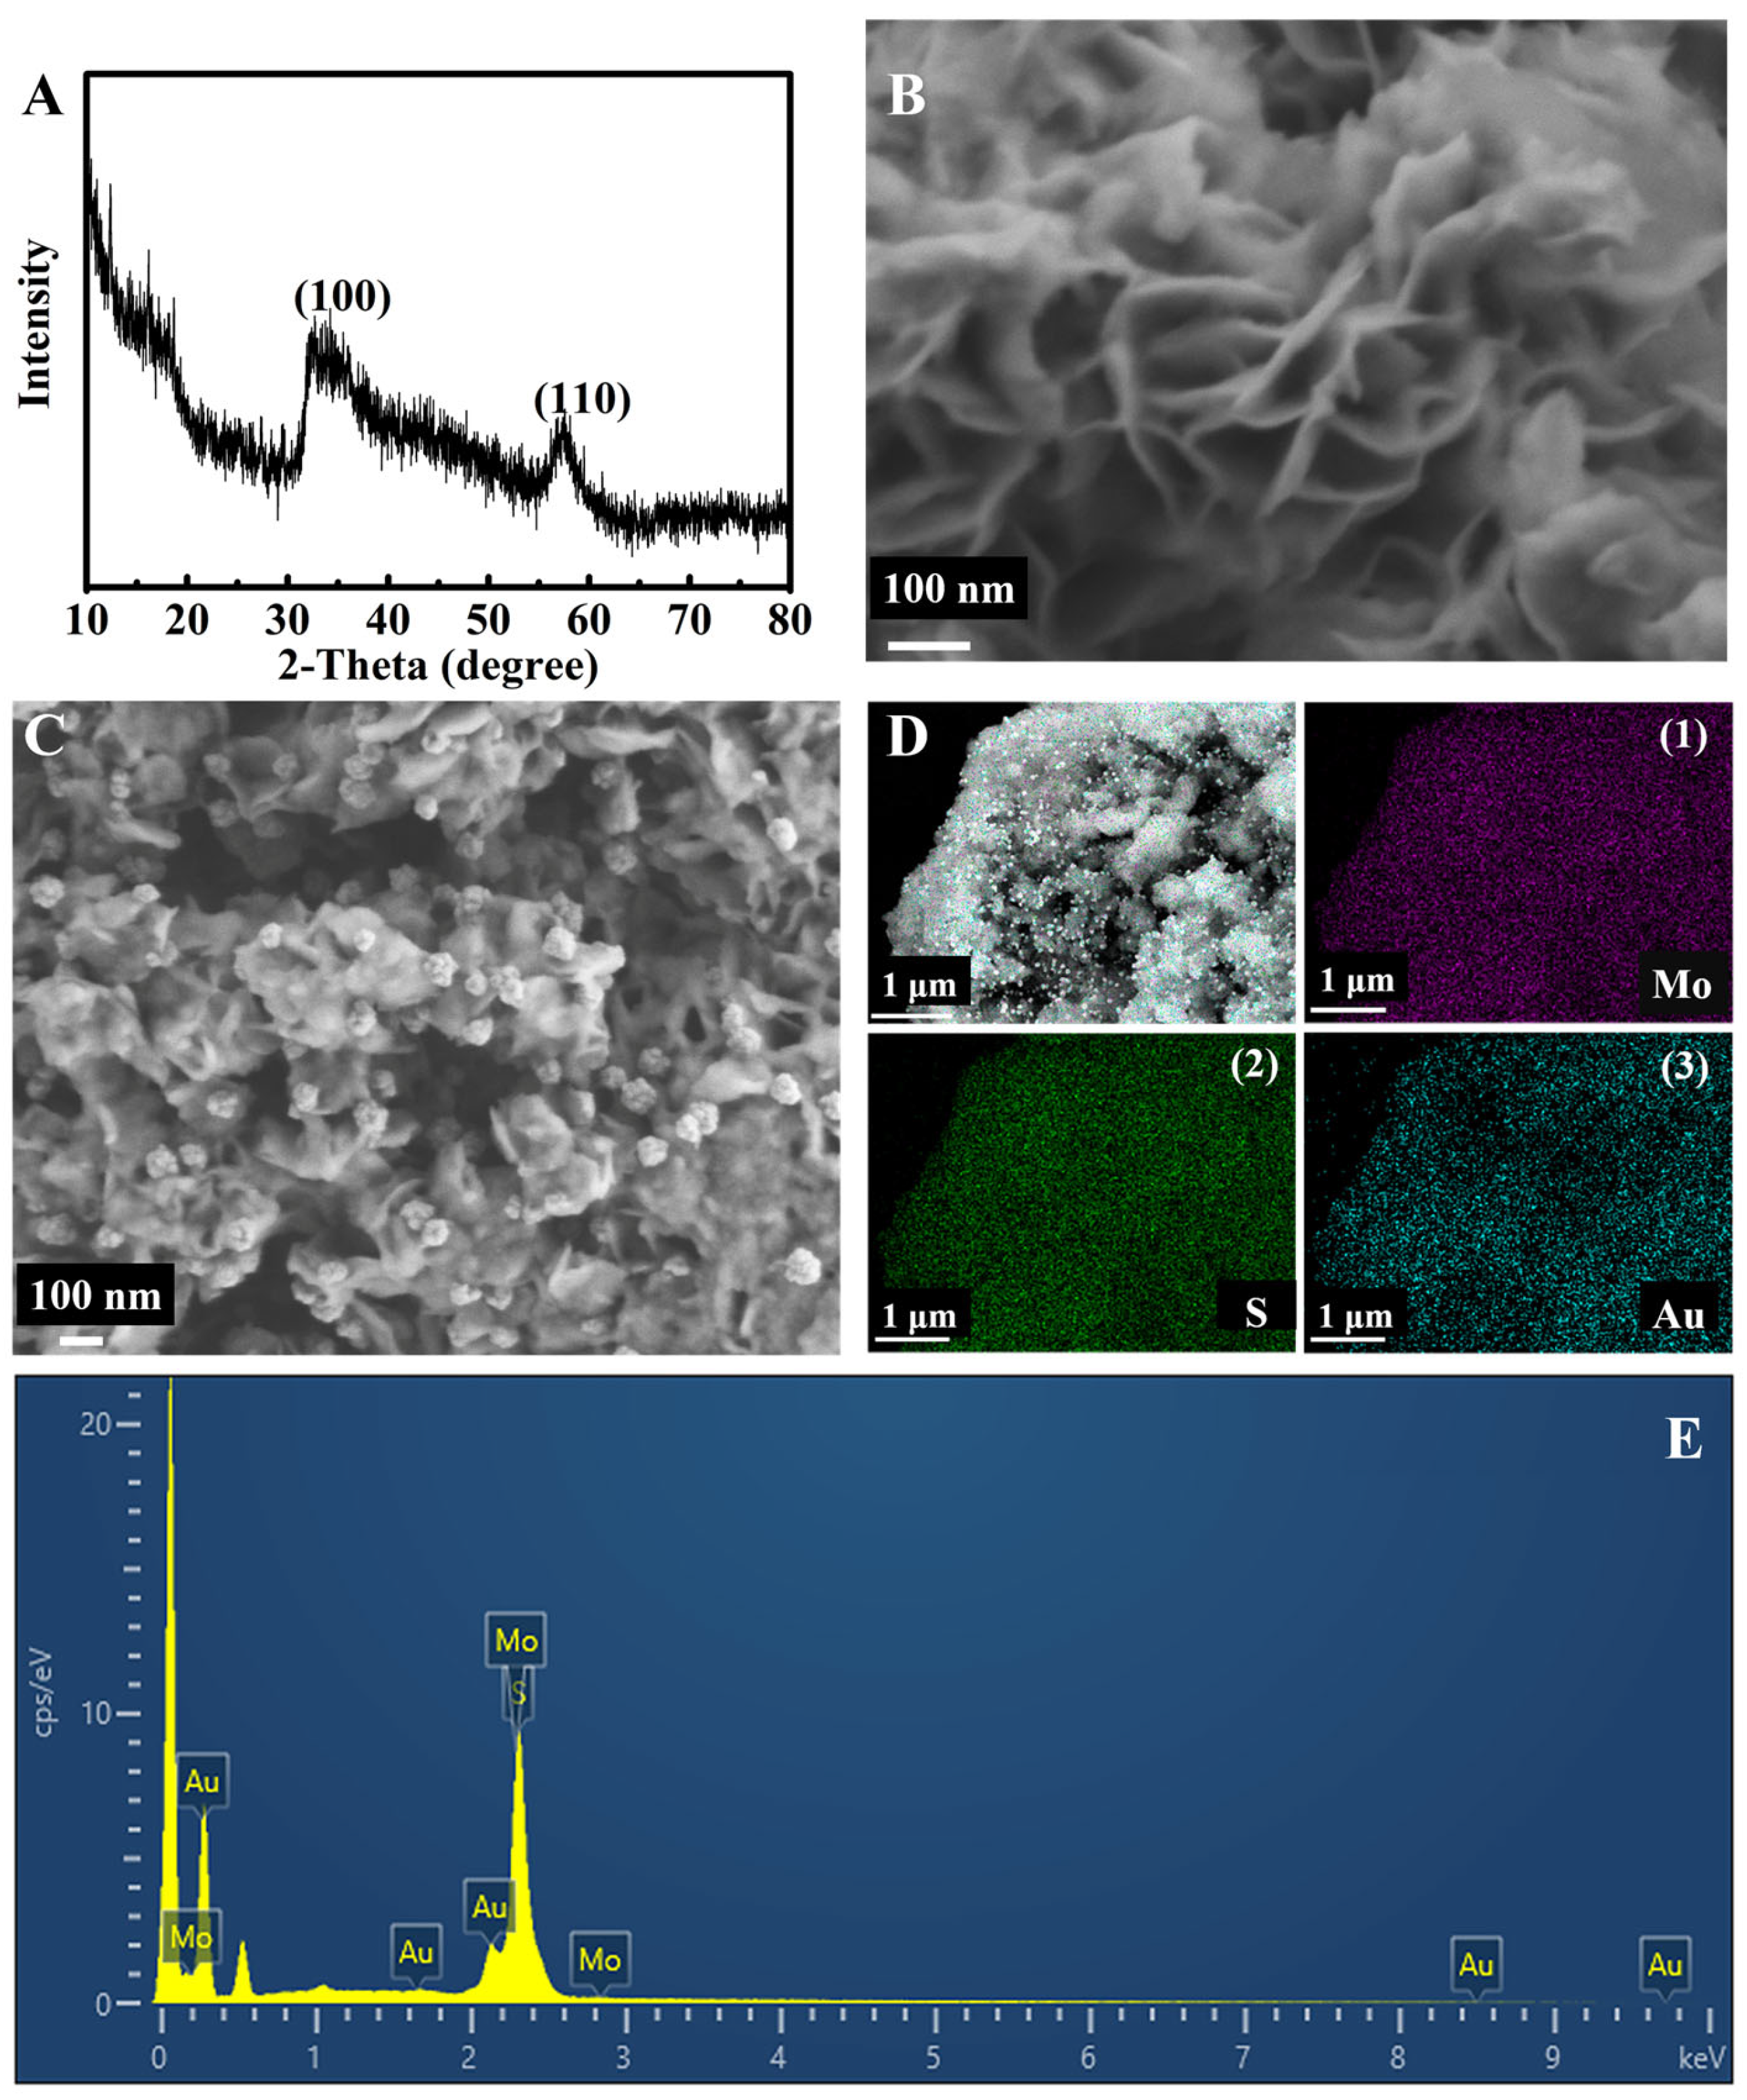
3.1. Characterization of MoS2 and MoS2@Au Nanozyme

The XRD result of the prepared MoS2 is exhibited in Figure 1A. The diffraction peak at 32.6° and 58.3° corresponded to (100) and (110) crystal planes, respectively, which belonged to hexagonal MoS2 (JCPDS 37-1492) [47,48,49]. In addition, the morphology of MoS2 was characterized by SEM. Observed from Figure 1B, the MoS2 nanoflowers were stacked by MoS2 nanosheets. The flower-like MoS2 also had some stacking. Flower-like MoS2 provided abundant sites to load Au nanoclusters (Au NCs) and catalyze the decomposition of H2O2. The raspberry-like Au NCs are exhibited in Figure 1C. Au NCs anchored on the MoS2 nanozyme were composed of Au nanoparticles. In addition, the diameter of Au NCs ranged between 45 nm and 100 nm, which were employed to immobilize Ab2. As shown in Figure 1D(1–3), three elements were presented in the sample: Mo, S, and Au. Figure 1C–E clearly show that the three elements were distributed evenly in the complex nanozyme. In brief, the above analyses demonstrated that the MoS2@Au nanozyme was synthesized successfully. Moreover, the characterization of the peroxidase-mimetic activity of MoS2@Au and the i–t curve are shown in Figure S1.

3.2. Optimization of Experimental Conditions

In order to obtain the optimum analytical performance of the immunosensor, this work optimized the pH of the PBS solution (4.5, 5.7, 6.6, 7.4, and 8.3), the concentration of rGO-TEPA (0.5, 1.0, 1.5, 2.0, and 2.5 mg·mL−1), and the incubation time of the NSE antibody and NSE (0.5, 1.0, 1.5, 2.0, 2.5, and 3.0 h). In the process of optimization, the immunosensors were fabricated with 1 ng·mL−1 of NSE. Under acidic conditions, MoS2 owns a fine electrocatalytic activity; however, the NSE and NSE antibody can only maintain excellent stability under near-neutral conditions [31]. In order to obtain the optimal pH value, a PBS buffer solution in the pH range of 4.5 to 8.3 was configured for detecting NSE. The measuring result is shown in Figure 2A, and the optimum amperometric response occurred at pH 5.7. Hence, a PBS buffer solution with pH 5.7 was selected for the subsequent study.
The amount of rGO-TEPA modified on the GCE is also a significant factor in current responses. Observed from Figure 2B, as the concentration range is between 0.5 mg·mL−1 and 2.5 mg·mL−1, the current responses possessed a peak value, appearing at 1.0 mg·mL−1. This may be attributed to the outstanding capability of electron transfer at 1.0 mg·mL−1. Hence, 1.0 mg·mL−1 of rGO-TEPA was chosen for measurement throughout this research.
Moreover, the incubation time of NSE and the detector antibody also was investigated in this work. Figure 2C shows that amperometric responses gradually increased with the incubation time ranging from 0.5 h to 2.0 h. Nevertheless, amperometric responses decreased inch by inch at an incubation time ranging from 2.0 h to 3.0 h. Based on the above results, an incubation time of 2.0 h was chosen for follow-up testing. Additionally, the impact of varying concentrations of both H2O2 and Au NPs was investigated (Figure 2D and Figure S2). The results have demonstrated that the optimal concentrations of H2O2 and Au NPs were 5 mmol·mL−1 and 28.42 mmol·mL−1, respectively.

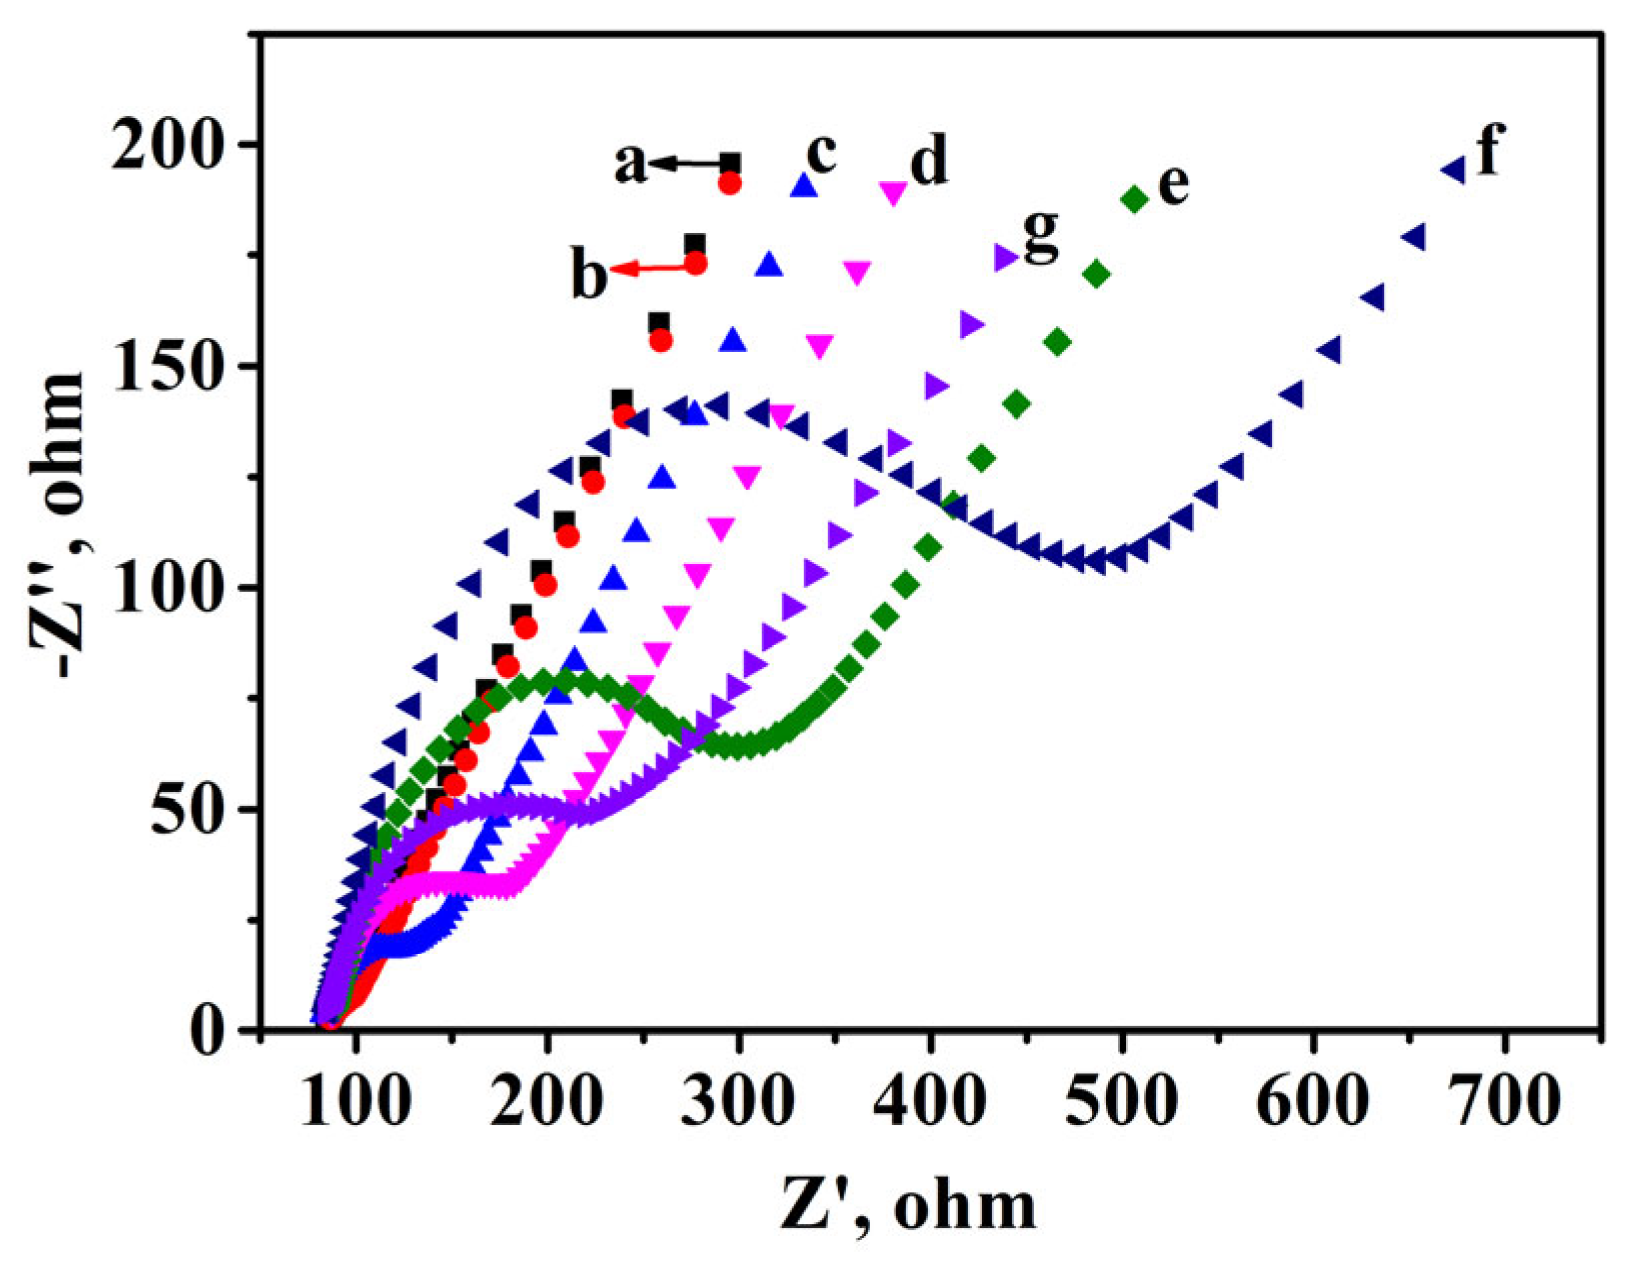
3.3. Characterization of the Immunosensor

Observed from Figure 3, EIS spectrum was composed of two parts: the semicircle portion was on behalf of the electron transfer limited process, and the linear portion represented the diffusion limited process. [50,51]. Compared with the undecorated electrode (curve a), the resistance of GCE decorated by rGO-TEPA (curve b) was barely changed, which indicates that rGO-TEPA scarcely impeded the electrode conductivity. The SEM analysis of both the bare GCE and rGO-TEPA modified GCE was utilized to confirm the successful modification of rGO-TEPA, as shown in Figure S3. After GA was modified on the electrode (curve c), the resistance increased because of the ability to block the electron transfer of GA. Subsequently, the resistance further increased with the immobilization of Ab1 (curve d) by the reaction between amino groups which, respectively, belonged to GA and Ab1. Afterward, the resistance was increased for introducing BSA (curve e). When the Ab1 captured the NSE (curve f), the resistance increased significantly, proving that the protein greatly hindered the transfer of electrons. In the end, owing to the outstanding capability of MoS2@Au, the resistance decreased with the modification of the MoS2@Au-Ab2 bioconjugate (curve g).
Under optimum conditions, a suite of electrochemical immunosensors was constructed to detect different concentrations of NSE. Electrochemical signals of the immunosensor were researched through adding the H2O2 into a continually stirring buffer. Observed from Figure 4A, as the NSE concentration increased, the amperometric responses increased. This could be attributed to the greater concentration of NSE and the more MoS2@Au-Ab2 bioconjugate modification on the electrode through antigen- and antibody-specific binding. Observed from Figure 4B, the current signal exhibited a linear relation toward the logarithmic value of NSE concentrations varying from 0.1 pg·mL−1 to 10 ng·mL−1. I regression equation was I = 3.07 lgc + 31.79, and the correlation coefficient was 0.998. The low limit of detection (LOD) was 0.05 pg·mL−1, according to the definition of the detection limit prescribed by the International Union of Pure and Applied Chemistry (IUPAC) [52]. The calculation could be acquired from the SI. Observed from Table 1, compared with the reported methods, this proposed strategy exhibited satisfactory performances, such as a lower LOD and reasonable sensitivity. This may be mainly ascribed to the following reasons. In the beginning, a mass of Ab1 can be immobilized due to abundant amino groups on rGO-TEPA [51]. Additionally, the MoS2@Au nanozyme provides ample sites to bind with Ab2. Moreover, an unexceptionable capability in decomposing H2O2 is conducive to improving the sensitivity of immunosensors.

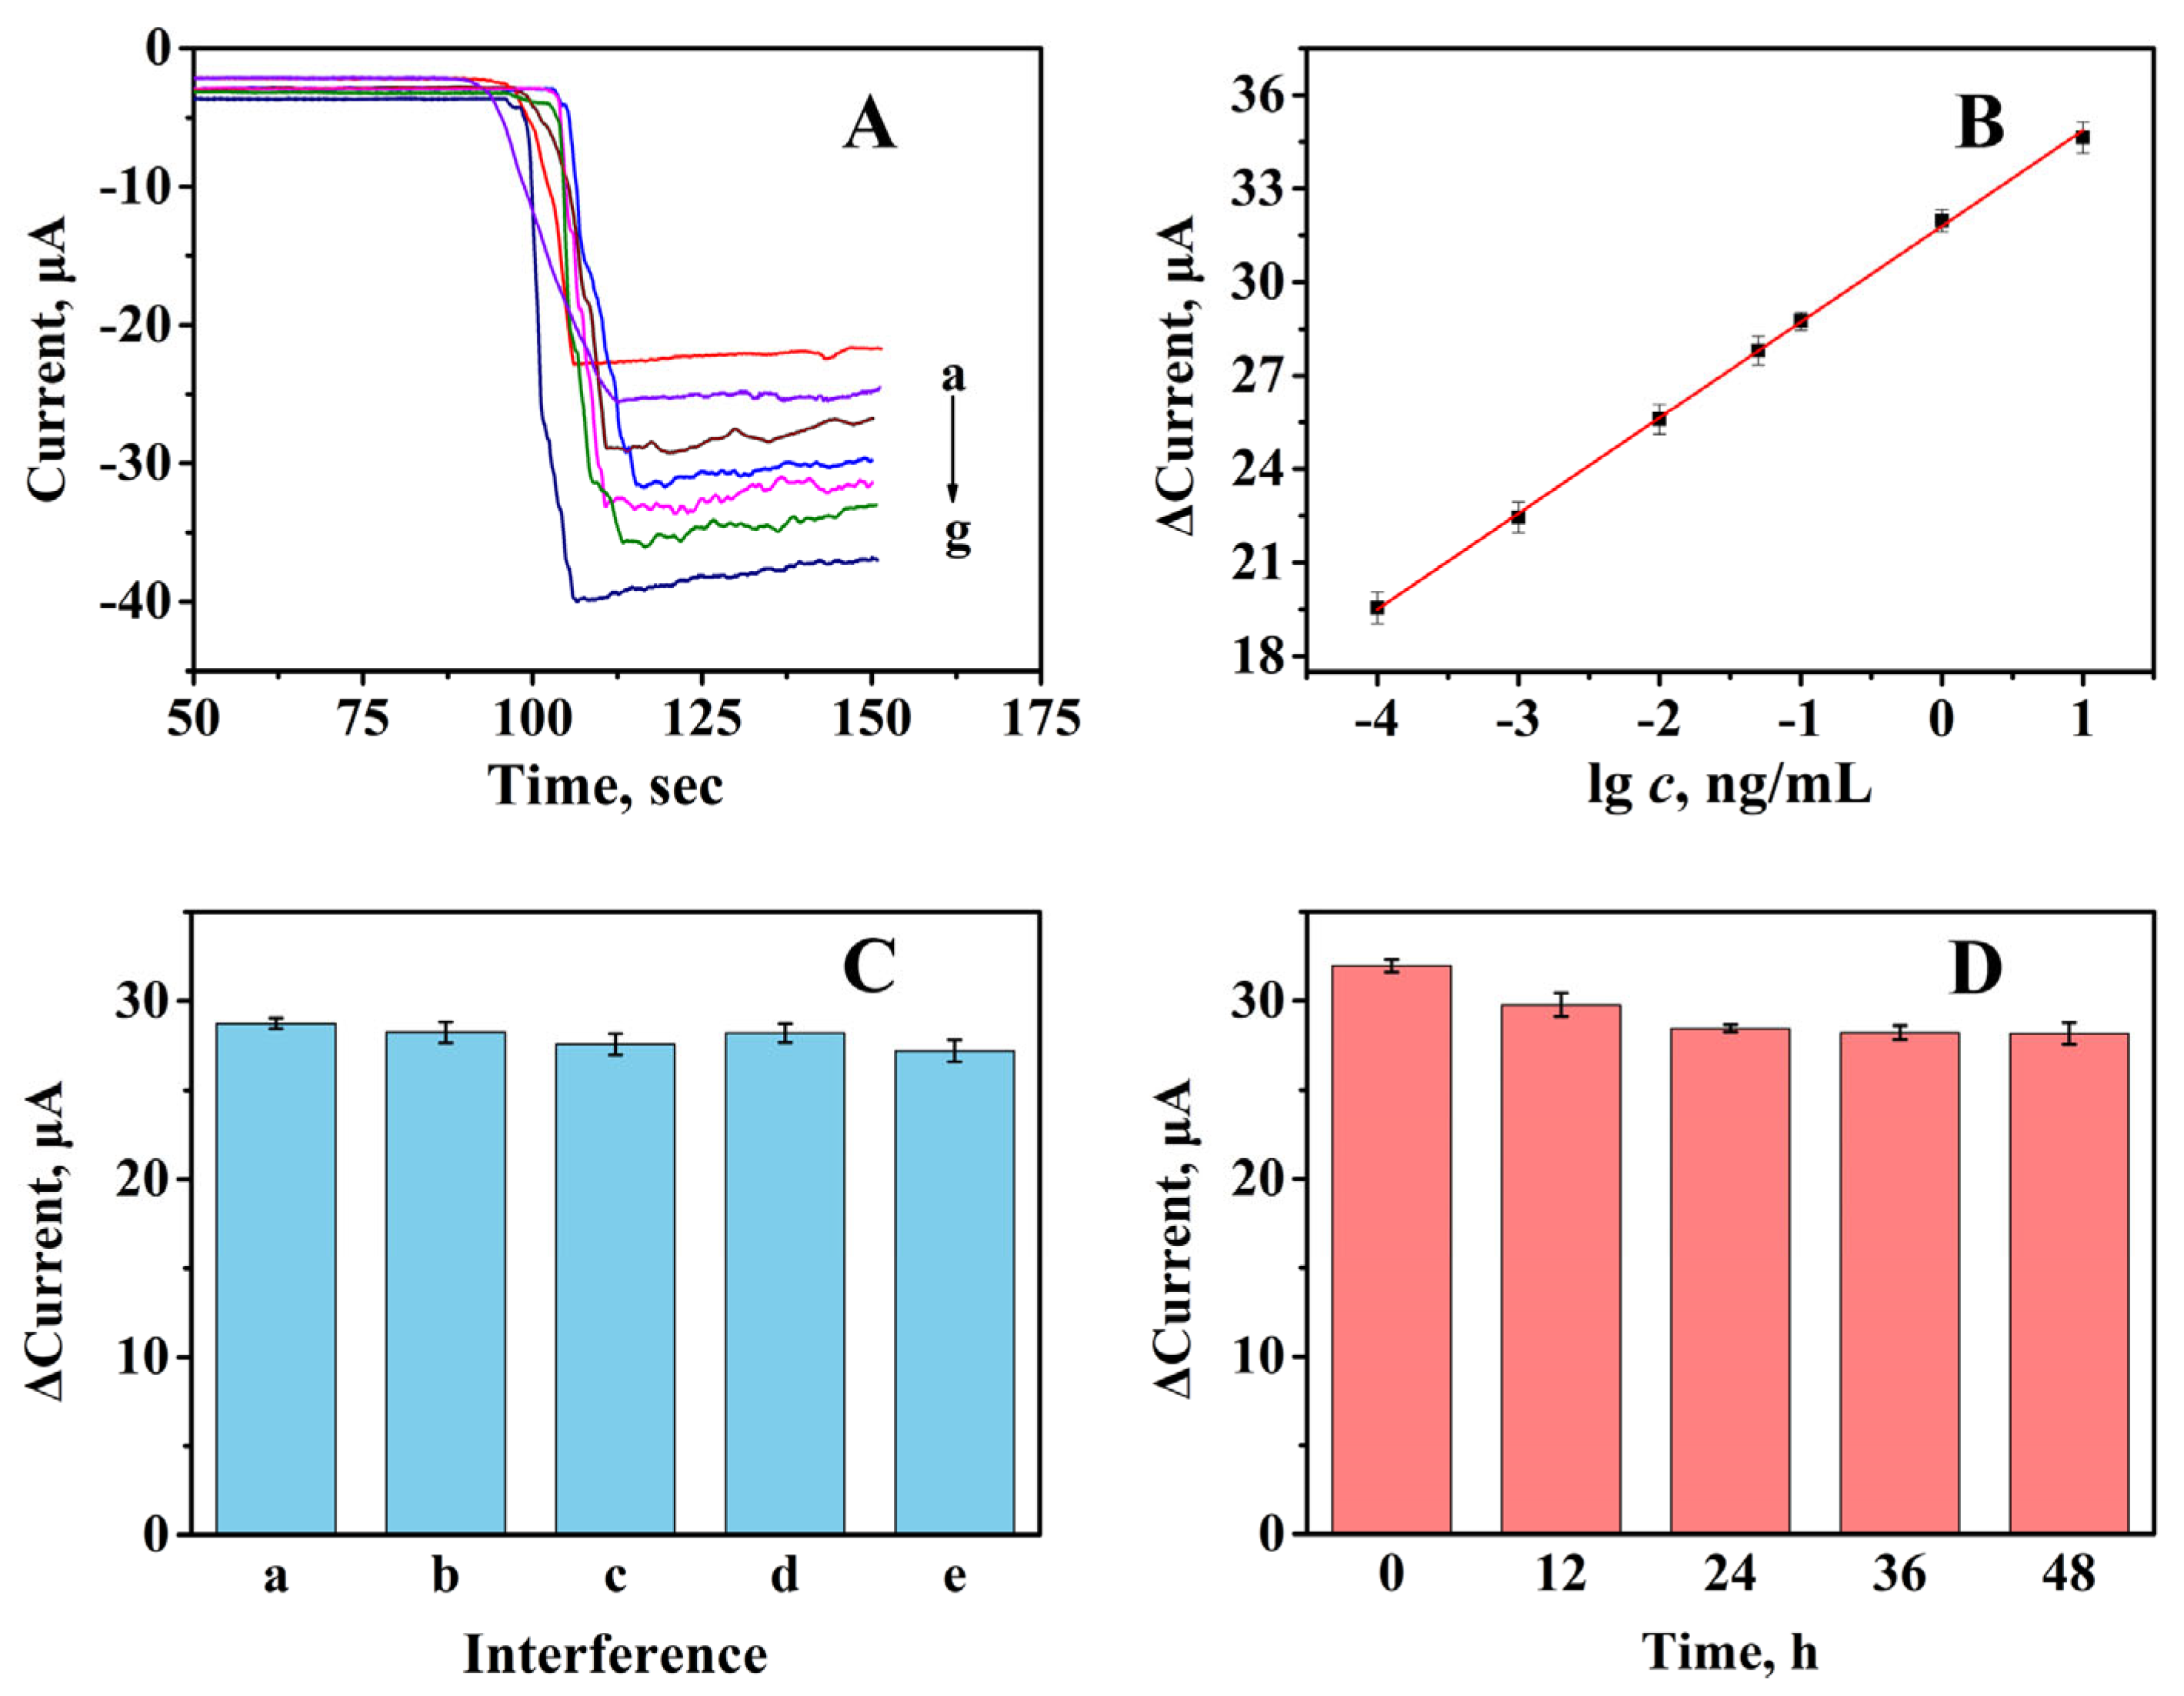
3.4. Reproducibility, Selectivity and Stability

In the case of evaluating the reproducibility of the proposed immunoassay, five immunosensors were fabricated to measure 1 ng·mL−1 NSE under identical conditions. The relative standard deviation (RSD) of the current response for the above immunosensors was 1.51%, which demonstrated that the prepared immunosensor possessed satisfactory reproducibility.
The cytokeratins21-1 (cyfra21-1), carcinoembryonic antigen (CEA), and BSA were employed as interferences for the purpose of evaluating the selectivity of the proposed immunosensor. In the process of this measurement, 0.1 ng·mL−1 NSE with a 10 ng·mL−1 interference was detected, and the results are exhibited in Figure 4C. Moreover, the response to 10 ng·mL−1 interferences is shown in Figure S4. The current responses varied between 2% and 5%, demonstrating that the selectivity of this strategy was quite well.
The Stability of the proposed immunosensor was tested. As shown in Figure 4D, after 12 h at 4 °C, the amperometric response clearly decreased. However, the amperometric response decreased tardily as the storage time increased, and 48 h later, the amperometric response dropped to 87% of the initial amperometric response. Those above showed that the immunosensor owned certain stability in 48 h.

3.5. Detection of NSE in Serum Samples

The concentration of NSE in the human serum sample was measured through the standard addition method for evaluating the practicability of the proposed immunosensor. The obtained serum sample was diluted 20 times with a PBS solution (pH = 7.4). Observed from Table 2, the recovery was from 97.6% to 99.9% and the RSD ranged from 1.48% to 3.35%, manifesting that the proposed immunosensor was expected to monitor real samples.

4. Conclusions

In brief, a sandwich-type immunosensor which employed the MoS2@Au nanozyme was constructed to achieve sensitivity detection of NSE. The rGO-TEPA offered luxuriant sites for immobilizing enough Ab1. Furthermore, the catalase activity and structural properties of MoS2 efficiently amplified the amperometric response as well as enhanced the sensitivity of the proposed strategy. Under optimal experimental conditions, the linear detection range was 0.1 pg·mL−1–10 ng·mL−1, and regression equation was I = 3.07 lgc + 31.79, with a correlation coefficient of 0.998. This immunosensor possessed low LOD (0.05 pg·mL−1), high interference resistance, and outstanding reproducibility, which is expected to be applied to the early diagnosis of NSE. Furthermore, the proposed immunosensor holds tremendous promise for determining other disease markers.

Supplementary Materials

The following supporting information can be downloaded at: https://www.mdpi.com/article/10.3390/chemosensors11060349/s1. Figure S1: (A) UV−vis absorption spectra of TMB with different substrates. (B) The i−t curve of 0.5 mg·mL−1 MoS2@Au; Figure S2: Effect of the concentration of Au NPs on the current responses of immunosensor; Figure S3: The SEM of bare GCE (A) and rGO−TEPA/GCE (B−C); Figure S4: The response of immunosensor in detecting interference: (a) 10 ng·mL−1 CEA; (b) 10 ng·mL−1 cyfra21−1; (c) 10 ng·mL−1 BSA; (d) 10 ng·mL−1 CEA + 10 ng·mL−1 cyfra21−1 + 10 ng·mL−1 BSA. Calculation of detection limit.

Author Contributions

Conceptualization, Y.W. (Yaoguang Wang) and H.C.; methodology, Y.W. (Yingying Wang), H.W., Y.Z. and Y.W. (Yaoguang Wang); software, Y.W. (Yingying Wang) and H.W.; validation, Y.B., G.Z. and Y.Z.; formal analysis, Y.W. (Yingying Wang), G.Z. and N.Z.; investigation, Y.W. (Yingying Wang) and Y.B.; resources, Y.W. (Yaoguang Wang) and H.C.; data curation, Y.W. (Yingying Wang) and G.Z.; writing—original draft preparation, Y.W. (Yingying Wang); writing—review and editing, Y.W. (Yaoguang Wang) and H.C.; visualization, H.W., Y.B. and N.Z.; supervision, N.Z., Y.W. (Yaoguang Wang) and H.C.; project administration, Y.Z. and Y.W. (Yaoguang Wang); funding acquisition, Y.W. (Yaoguang Wang). All authors have read and agreed to the published version of the manuscript.

Funding

This research was funded by the National Natural Science Foundation of China (Nos. 22006080 and 22264025), the Shandong Provincial Natural Science Foundation (Nos. ZR2021YQ07, ZR2020QB094, and ZR2020QB097), the Science, Education and Industry Integration Innovation Pilot Project from Qilu University of Technology (Shandong Academy of Sciences) (2022JBZ02-04), and the Program for Scientific Research Innovation Team in Colleges and Universities of Shandong Province.

Institutional Review Board Statement

Not applicable.

Informed Consent Statement

Not applicable.

Data Availability Statement

The data are available upon request to the corresponding authors.

Conflicts of Interest

The authors declare no conflict of interest.

References

  1. Blandin Knight, S.; Crosbie, P.A.; Balata, H.; Chudziak, J.; Hussell, T.; Dive, C. Progress and prospects of early detection in lung cancer. Open Biol. 2017, 7, 170070. [Google Scholar] [CrossRef] [PubMed] [Green Version]
  2. Du, J.; Li, Y.; Wang, L.; Zhou, Y.; Shen, Y.; Xu, F.; Chen, Y. Selective application of neuroendocrine markers in the diagnosis and treatment of small cell lung cancer. Clin. Chim. Acta 2020, 509, 295–303. [Google Scholar] [CrossRef]
  3. Sutherland, K.D.; Proost, N.; Brouns, I.; Adriaensen, D.; Song, J.; Berns, A. Cell of origin of small cell lung cancer: Inactivation of Trp53 and Rb1 in distinct cell types of adult mouse lung. Cancer Cell 2011, 19, 754–764. [Google Scholar] [CrossRef] [PubMed] [Green Version]
  4. Gazdar, A.F.; Bunn, P.A.; Minna, J.D. Small-cell lung cancer: What we know, what we need to know and the path forward. Nat. Rev. Cancer 2017, 17, 725–737. [Google Scholar] [CrossRef]
  5. Huang, X.; Miao, J.; Fang, J.; Xu, X.; Wei, Q.; Cao, W. Ratiometric electrochemical immunosensor based on L-cysteine grafted ferrocene for detection of neuron specific enolase. Talanta 2022, 239, 123075. [Google Scholar] [CrossRef] [PubMed]
  6. Marangos, P.J.; Schmechel, D.E. Neuron specific enolase, a clinically useful marker for neurons and neuroendocrine cells. Ann. Rev. Neurosci. 1987, 10, 269–295. [Google Scholar] [CrossRef]
  7. Ma, E.; Wang, P.; Yang, Q.; Yu, H.; Pei, F.; Zheng, Y.; Liu, Q.; Dong, Y.; Li, Y. Electrochemical immunosensors for sensitive detection of neuron-specific enolase based on small-size trimetallic Au@Pd^Pt nanocubes functionalized on ultrathin MnO2 nanosheets as signal labels. ACS Biomater. Sci. Eng. 2020, 6, 1418–1427. [Google Scholar] [CrossRef]
  8. Dong, H.; Liu, S.; Liu, Q.; Li, Y.; Li, Y.; Zhao, Z. A dual-signal output electrochemical immunosensor based on Au-MoS2/MOF catalytic cycle amplification strategy for neuron-specific enolase ultrasensitive detection. Biosens. Bioelectron. 2022, 195, 113648. [Google Scholar] [CrossRef]
  9. Yu, X.; Li, X.; Zhang, S.; Jia, Y.; Xu, Z.; Li, X.; Chen, Z.; Li, Y. Ultrasensitive electrochemical detection of neuron-specific enolase based on spiny core-shell Au/CuxO@CeO2 nanocubes. Bioelectrochemistry 2021, 138, 107693. [Google Scholar] [CrossRef]
  10. Lin, Y.; Kannan, P.; Zeng, Y.; Qiu, B.; Guo, L.; Lin, Z. Enzyme-free multicolor biosensor based on Cu2+-modified carbon nitride nanosheets and gold nanobipyramids for sensitive detection of neuron specific enolase. Sensor. Actuat. B-Chem. 2019, 283, 138–145. [Google Scholar] [CrossRef]
  11. Kalkal, A.; Kadian, S.; Kumar, S.; Manik, G.; Sen, P.; Kumar, S.; Packirisamy, G. Ti3C2-MXene decorated with nanostructured silver as a dual-energy acceptor for the fluorometric neuron specific enolase detection. Biosens. Bioelectron. 2022, 195, 113620. [Google Scholar] [CrossRef]
  12. McKitterick, N.; Bicak, T.C.; Cormack, P.A.G.; Reubsaet, L.; Halvorsen, T.G. Facilitating serum determination of neuron specific enolase at clinically relevant levels by coupling on-line molecularly imprinted solid-phase extraction to LC-MS/MS. Anal. Chim. Acta 2020, 1140, 210–218. [Google Scholar] [CrossRef]
  13. Gao, X.; Zheng, P.; Kasani, S.; Wu, S.; Yang, F.; Lewis, S.; Nayeem, S.; Engler-Chiurazzi, E.B.; Wigginton, J.G.; Simpkins, J.W.; et al. Paper-based surface-enhanced raman scattering lateral flow strip for detection of neuron-specific enolase in blood plasma. Anal. Chem. 2017, 89, 10104–10110. [Google Scholar] [CrossRef] [PubMed]
  14. Xiao, K.; Wang, K.; Qin, W.; Hou, Y.; Lu, W.; Xu, H.; Wo, Y.; Cui, D. Use of quantum dot beads-labeled monoclonal antibody to improve the sensitivity of a quantitative and simultaneous immunochromatographic assay for neuron specific enolase and carcinoembryonic antigen. Talanta 2017, 164, 463–469. [Google Scholar] [CrossRef]
  15. Xu, R.; Xu, K.; Du, Y.; Li, J.; Ren, X.; Ma, H.; Wu, D.; Li, Y.; Wei, Q. Dual direct z-scheme heterojunction with growing photoactive property for sensitive photoelectrochemical and colorimetric bioanalysis. Anal. Chem. 2022, 94, 9888–9893. [Google Scholar] [CrossRef]
  16. Khatri, R.; Puri, N.K. Electrochemical biosensor utilizing dual-mode output for detection of lung cancer biomarker based on reduced graphene oxide-modified reduced-molybdenum disulfide multi-layered nanosheets. J. Mater. Res. 2022, 37, 1451–1463. [Google Scholar] [CrossRef]
  17. Zheng, X.; Mo, G.; He, Y.; Qin, D.; Jiang, X.; Mo, W.; Deng, B. Electrochemiluminescent immunoassay for neuron specific enolase by using amino-modified reduced graphene oxide loaded with N-doped carbon quantum dots. Microchim. Acta 2019, 186, 817. [Google Scholar] [CrossRef]
  18. Tang, C.; Wang, P.; Zhou, K.; Ren, J.; Wang, S.; Tang, F.; Li, Y.; Liu, Q.; Xue, L. Electrochemical immunosensor based on hollow porous Pt skin AgPt alloy/NGR as a dual signal amplification strategy for sensitive detection of neuron-specific enolase. Biosens. Bioelectron. 2022, 197, 113779. [Google Scholar] [CrossRef] [PubMed]
  19. Amani, J.; Maleki, M.; Khoshroo, A.; Sobhani-Nasab, A.; Rahimi-Nasrabadi, M. An electrochemical immunosensor based on poly p-phenylenediamine and graphene nanocomposite for detection of neuron-specific enolase via electrochemically amplified detection. Anal. Biochem. 2018, 548, 53–59. [Google Scholar] [CrossRef] [PubMed]
  20. Zhang, C.; Ma, Z. PtCu nanoprobe-initiated cascade reaction modulated iodide-responsive sensing interface for improved electrochemical immunosensor of neuron-specific enolase. Biosens. Bioelectron. 2019, 143, 111612. [Google Scholar] [CrossRef]
  21. Yu, T.; Cheng, W.; Li, Q.; Luo, C.; Yan, L.; Zhang, D.; Yin, Y.; Ding, S.; Ju, H. Electrochemical immunosensor for competitive detection of neuron specific enolase using functional carbon nanotubes and gold nanoprobe. Talanta 2012, 93, 433–438. [Google Scholar] [CrossRef] [PubMed]
  22. Wang, Z.; Zhang, Y.; Wang, X.; Han, L. Flow-homogeneous electrochemical sensing system based on 2D metal-organic framework nanozyme for successive microRNA assay. Biosens. Bioelectron. 2022, 206, 114120. [Google Scholar] [CrossRef]
  23. Han, L.; Zhang, H.; Li, F. Bioinspired nanozymes with pH-independent and metal ions-controllable activity: Field-programmable logic conversion of sole logic gate system. Part. Part. Syst. Char. 2018, 35, 1800207. [Google Scholar] [CrossRef]
  24. Gai, P.; Pu, L.; Wang, C.; Zhu, D.; Li, F. CeO2@NC nanozyme with robust dephosphorylation ability of phosphotriester: A simple colorimetric assay for rapid and selective detection of paraoxon. Biosens. Bioelectron. 2023, 220, 114841. [Google Scholar] [CrossRef] [PubMed]
  25. Zhu, D.; Zhang, M.; Wang, C.; Gai, P.; Li, F. Metal-free carbon nanozyme as nicotinamide adenine dinucleotide oxidase mimic over a broad pH range for coenzyme regeneration. Chem. Mater. 2022, 34, 11072–11080. [Google Scholar] [CrossRef]
  26. Zhou, X.; Wang, M.; Chen, J.; Su, X. Cascade reaction biosensor based on Cu/N co-doped two-dimensional carbon-based nanozyme for the detection of lactose and beta-galactosidase. Talanta 2022, 245, 123451. [Google Scholar] [CrossRef]
  27. Wang, K.; Wu, C.; Wang, F.; Liao, M.; Jiang, G. Bimetallic nanoparticles decorated hollow nanoporous carbon framework as nanozyme biosensor for highly sensitive electrochemical sensing of uric acid. Biosens. Bioelectron. 2020, 150, 111869. [Google Scholar] [CrossRef] [PubMed]
  28. Yang, Q.Y.; Wan, C.Q.; Wang, Y.X.; Shen, X.F.; Pang, Y.H. Bismuth-based metal-organic framework peroxidase-mimic nanozyme: Preparation and mechanism for colorimetric-converted ultra-trace electrochemical sensing of chromium ion. J. Hazard. Mater. 2023, 451, 131148. [Google Scholar] [CrossRef]
  29. Bi, X.; Bai, Q.; Wang, L.; Du, F.; Liu, M.; Yu, W.W.; Li, S.; Li, J.; Zhu, Z.; Sui, N.; et al. Boron doped graphdiyne: A metal-free peroxidase mimetic nanozyme for antibacterial application. Nano Res. 2021, 15, 1446–1454. [Google Scholar] [CrossRef]
  30. Wang, T.; Bai, Q.; Zhu, Z.; Xiao, H.; Jiang, F.; Du, F.; Yu, W.W.; Liu, M.; Sui, N. Graphdiyne-supported palladium-iron nanosheets: A dual-functional peroxidase mimetic nanozyme for glutathione detection and antibacterial application. Chem. Eng. J. 2021, 413, 127537. [Google Scholar] [CrossRef]
  31. Zu, Y.; Yao, H.; Wang, Y.; Yan, L.; Gu, Z.; Chen, C.; Gao, L.; Yin, W. The age of bioinspired molybdenum-involved nanozymes: Synthesis, catalytic mechanisms, and biomedical applications. View 2021, 2, 20200188. [Google Scholar] [CrossRef]
  32. Chen, Y.; Zhang, G.; Ji, Q.; Liu, H.; Qu, J. Triggering of low-valence molybdenum in multiphasic MoS2 for effective reactive oxygen species output in catalytic fenton-like reactions. ACS Appl. Mater. Inter. 2019, 11, 26781–26788. [Google Scholar] [CrossRef]
  33. Lv, Q.; Chen, L.; Liu, H.; Zou, L. Peony-like 3D-MoS2/graphene nanostructures with enhanced mimic peroxidase performance for colorimetric determination of dopamine. Talanta 2022, 247, 123553. [Google Scholar] [CrossRef] [PubMed]
  34. Yu, Y.; Lu, L.; Yang, Q.; Zupanic, A.; Xu, Q.; Jiang, L. Using MoS2 nanomaterials to generate or remove reactive oxygen species: A review. ACS Appl. Nano Mater. 2021, 4, 7523–7537. [Google Scholar] [CrossRef]
  35. Chen, T.; Zou, H.; Wu, X.; Liu, C.; Situ, B.; Zheng, L.; Yang, G. Nanozymatic antioxidant system based on MoS2 nanosheets. ACS Appl. Mater. Inter. 2018, 10, 12453–12462. [Google Scholar] [CrossRef]
  36. Guo, X.; Wang, Y.; Wu, F.; Ni, Y.; Kokot, S. A colorimetric method of analysis for trace amounts of hydrogen peroxide with the use of the nano-properties of molybdenum disulfide. Analyst 2015, 140, 1119–1126. [Google Scholar] [CrossRef]
  37. Hwang, J.H.; Islam, M.A.; Choi, H.; Ko, T.J.; Rodriguez, K.L.; Chung, H.S.; Jung, Y.; Lee, W.H. Improving electrochemical Pb2+ detection using a vertically aligned 2D MoS2 nanofilm. Anal. Chem. 2019, 91, 11770–11777. [Google Scholar] [CrossRef]
  38. Wang, J.; Sui, L.; Huang, J.; Miao, L.; Nie, Y.; Wang, K.; Yang, Z.; Huang, Q.; Gong, X.; Nan, Y.; et al. MoS2-based nanocomposites for cancer diagnosis and therapy. Bioact. Mater. 2021, 6, 4209–4242. [Google Scholar] [CrossRef] [PubMed]
  39. Sethulekshmi, A.S.; Saritha, A.; Joseph, K.; Aprem, A.S.; Sisupal, S.B. MoS2 based nanomaterials: Advanced antibacterial agents for future. J. Control. Release 2022, 348, 158–185. [Google Scholar] [CrossRef]
  40. Ma, Y.; Deng, M.; Wang, X.; Gao, X.; Song, H.; Zhu, Y.; Feng, L.; Zhang, Y. 2H-MoS2/Co3O4 nanohybrid with type I nitroreductase-mimicking activity for the electrochemical assays of nitroaromatic compounds. Anal. Chim. Acta 2022, 1221, 340078. [Google Scholar] [CrossRef]
  41. Zhang, J.; Zhang, X.; Gao, Y.; Yan, J.; Song, W. Integrating CuO/g-C3N4 p-n heterojunctioned photocathode with MoS2 QDs@Cu NWs multifunctional signal amplifier for ultrasensitive detection of AβO. Biosens. Bioelectron. 2021, 176, 112945. [Google Scholar] [CrossRef]
  42. Feng, L.; Zhang, L.; Gong, Y.; Du, Z.; Chen, X.; Qi, X.; Zhang, X.; Mao, G.; Wang, H. Hollow C@MoS2 nanotubes with Hg2+-triggered oxidase-like catalysis: A colorimetric method for detection of Hg2+ ions in wastewater. Sens. Actuat. B-Chem. 2022, 361, 131725. [Google Scholar] [CrossRef]
  43. Zhang, X.; Zhang, S.; Yang, Z.; Wang, Z.; Tian, X.; Zhou, R. Self-cascade MoS2 nanozymes for efficient intracellular antioxidation and hepatic fibrosis therapy. Nanoscale 2021, 13, 12613–12622. [Google Scholar] [CrossRef] [PubMed]
  44. Li, Y.; Fu, R.; Duan, Z.; Zhu, C.; Fan, D. Adaptive hydrogels based on nanozyme with dual-enhanced triple enzyme-like activities for wound disinfection and mimicking antioxidant defense system. Adv. Healthc. Mater. 2022, 11, 2101849. [Google Scholar] [CrossRef] [PubMed]
  45. Wei, F.; Cui, X.; Wang, Z.; Dong, C.; Li, J.; Han, X. Recoverable peroxidase-like Fe3O4@MoS2-Ag nanozyme with enhanced antibacterial ability. Chem. Eng. J. 2021, 408, 127240. [Google Scholar] [CrossRef]
  46. Chang, M.; Hou, Z.; Wang, M.; Wang, M.; Dang, P.; Liu, J.; Shu, M.; Ding, B.; Al Kheraif, A.A.; Li, C.; et al. Cu2MoS4/Au heterostructures with enhanced catalase-like activity and photoconversion efficiency for primary/metastatic tumors eradication by phototherapy-induced immunotherapy. Small 2020, 16, 1907146. [Google Scholar] [CrossRef] [PubMed]
  47. Hoshyargar, F.; Yella, A.; Panthöfer, M.; Tremel, W. Diffusion-driven formation of MoS2 nanotube bundles containing MoS2 nanopods. Chem. Mater. 2011, 23, 4716–4720. [Google Scholar] [CrossRef]
  48. Hu, L.; Ren, Y.; Yang, H.; Xu, Q. Fabrication of 3D hierarchical MoS2/polyaniline and MoS2/C architectures for lithium-ion battery applications. ACS Appl. Mater. Inter. 2014, 6, 14644–14652. [Google Scholar] [CrossRef]
  49. Sheng, M.; Bin, X.; Yang, Y.; Tang, Y.; Que, W. Defect engineering-driven phase structure design of 2H@1T MoS2 for electrochemical hydrogen evolution reaction. Mater. Lett. 2022, 311, 131624. [Google Scholar] [CrossRef]
  50. Cui, M.; Wang, Y.; Wang, H.; Wu, Y.; Luo, X. A label-free electrochemical DNA biosensor for breast cancer marker BRCA1 based on self-assembled antifouling peptide monolayer. Sens. Actuat. B-Chem. 2017, 244, 742–749. [Google Scholar] [CrossRef]
  51. Wang, Y.; Li, Y.; Ma, H.; Guo, A.; Du, B.; Yan, T.; Wei, Q. An ultrasensitive electrochemical immunosensor for the detection of CD146 based on TiO2 colloidal sphere laden Au/Pd nanoparticles. Analyst 2015, 140, 3557–3564. [Google Scholar] [CrossRef] [PubMed]
  52. Fassel, V. Nomenclature, symbols, units, and their usage in spectrochemical analysis—II. Data interpretation. Spectrochim. Acta B 1978, 33, 241–245. [Google Scholar]
  53. Xing, Z.; Zhang, S.; Wang, H.; Ma, H.; Wu, D.; Fan, D.; Ren, X.; Wei, Q.; Ju, H. Addressable label-free photoelectric sensor array with self-calibration for detection of neuron specific enolase. Anal. Chem. 2022, 94, 6996–7003. [Google Scholar] [CrossRef] [PubMed]
  54. Wang, B.; Liang, T.; Li, J.; Yu, H.; Chu, X. Fabrication of immunosensor based on au-silica nanocomposite for neuron-specific enolase detection. Int. J. Electrochem. Sci. 2017, 7607–7615. [Google Scholar] [CrossRef]
  55. Liu, R.; Wang, Y.; Wong, W.; Li, H.; Li, C. Photoelectrochemical immunoassay platform based on MoS2 nanosheets integrated with gold nanostars for neuron-specific enolase assay. Microchim. Acta 2020, 187, 480. [Google Scholar] [CrossRef] [PubMed]
  56. Zhi, L.; Sun, A.; Tang, D. In situ amplified photothermal immunoassay for neuron-specific enolase with enhanced sensitivity using prussian blue nanoparticle-loaded liposomes. Analyst 2020, 145, 4164–4172. [Google Scholar] [CrossRef]
Scheme 1. Schematic diagram for the preparation of the MoS2@Au-Ab2 bioconjugate (A) and fabrication of the electrochemical immunosensor (B).
Chemosensors 11 00349 sch001
Figure 1. XRD pattern (A) and SEM (B) of the MoS2 nanozyme; SEM (C) and EDS mapping images of the MoS2@Au nanozyme (D), (1–3); EDS spectrum of the MoS2@Au nanozyme (E).
Chemosensors 11 00349 g001
Figure 2. Effects of the pH value of PBS (A), the concentration of rGO−TEPA (B), the incubation time (C), and the concentration of H2O2 (D) on the current responses of the immunosensor. Error bar = SD (n = 5).
Chemosensors 11 00349 g002
Figure 3. EIS recorded from 1 to 105 Hz for bare GCE (a), GCE/rGO−TEPA (b), GCE/rGO−TEPA/GA (c), GCE/rGO−TEPA/GA/Ab1 (d), GCE/rGO−TEPA/GA/Ab1/BSA (e), GCE/rGO−TEPA/GA/Ab1/BSA/NSE (f), and GCE/rGO−TEPA/GA/Ab1/BSA/NSE/MoS2@Au−Ab2 (g).
Chemosensors 11 00349 g003
Figure 4. Current responses of the proposed immunosensor toward different concentrations of NSE (A): a–g: 0.0001, 0.001, 0.01, 0.05, 0.1, 1, and 10 ng·mL−1; calibration curve of the immunosensor toward different concentrations of NSE (B). Selectivity of the immunosensor for the detection of NSE (C): NSE (a); NSE + CEA (b), NSE + cyfra21-1 (c), NSE + BSA (d), and NSE + CEA + cyfra21-1 + BSA (e). Stability of the immunosensor (D). The values of (BD) are absolute values. Error bar = SD (n = 5).
Chemosensors 11 00349 g004
Table 1. The proposed immunosensor compared with other methods in detecting NSE.
MethodTechniqueTypeSampleLinear Range (ng·mL−1)LOD (pg·mL−1)SelectivityRef.
Photoelectric immunosensor based on TiO2/CdSPhotoelectric analysisLabel-free immunosensorNSE0.01–1002.49PSA, CEA, cTnI[53]
Fluorescent method based on immunochromatographic test strip and quantum dot beadsFluorescence analysisSandwich-type immunosensorNSE5–5042.6PSA, CA72-4, AFP[14]
Electrochemical immunosensor based on Au-silica
nanocomposite
Electrochemical analysisLabel-free immunosensorNSE0.1–200050.0——[54]
Photoelectrochemical immunosensor based on MoS2
nanosheets integrated with gold nanostars
Photoelectrochemical analysisLabel-free immunosensorNSE0.005–1.53.50AFP, CEA, PSA, LAD, GST[55]
Photothermal immunoassay based on prussian
blue nanoparticles-loaded liposomes
Photothermal analysisSandwich-type immunosensorNSE0.1–100 53.0L-Cys, Gly, Glc, HSA, collagen, IgG[56]
Electrochemical immunoassay based on MoS2@Au nanozyme.Electrochemical analysisSandwich-type immunosensorNSE0.0001–100.05CEA, BSA cyfra21-1This paper
Table 2. Detecting concentrations of NSE in the serum sample.
Concentration of NSE in Serum Sample (ng·mL−1)The Addition Content (ng·mL−1)The Detection Content (ng·mL−1)RSD
(%)
Recovery (%)
0.510.50
2.00
8.00
0.97, 0.96, 1.00, 1.02, 1.04
2.52, 2.46, 2.53, 2.55, 2.48
8.55, 8.35, 8.47, 8.22, 8.53
3.35
1.48
1.64
97.6
99.9
98.9
Disclaimer/Publisher’s Note: The statements, opinions and data contained in all publications are solely those of the individual author(s) and contributor(s) and not of MDPI and/or the editor(s). MDPI and/or the editor(s) disclaim responsibility for any injury to people or property resulting from any ideas, methods, instructions or products referred to in the content.

