
Additive Manufacturing Sensor for Stress Biomarker Detection
by
 , ,
, ,
Vinicius A. O. P. da Silva
1,
Jéssica S. Stefano
1,
Cristiane Kalinke
2 ,
,
Juliano A. Bonacin
2 and
Bruno C. Janegitz
1,*
1
Department of Nature Sciences, Mathematics and Education, Federal University of São Carlos, Araras 13600-970, São Paulo, Brazil
2
Institute of Chemistry, University of Campinas, Campinas 13083-970, São Paulo, Brazil
*
Author to whom correspondence should be addressed.
Chemosensors 2023, 11(5), 306; https://doi.org/10.3390/chemosensors11050306
Submission received: 10 April 2023
/
Revised: 8 May 2023
/
Accepted: 18 May 2023
/
Published: 20 May 2023
(This article belongs to the Special Issue Novel Biosensors for Medical Diagnostics)
Abstract
:This work presents a new additive manufacturing electrochemical device with conductive graphene and polylactic acid (PLA) filament and its application for epinephrine sensing. A three-electrode configuration based on a screen-printed electrode architecture and an easy-to-connect connector was designed. The sensor surface was chemically treated with dimethylformamide (DMF) to remove the insulating thermoplastic and expose the graphene binding groups. The scanning electron microscopy (SEM) results showed that the surface PLA was removed and the graphene nanofibers exposed, which corroborated the X-ray diffraction spectra (XRD). As a proof of concept, the G-PLA electrode was applied for the determination of epinephrine in human blood samples by square wave voltammetry with a linear range from 4.0 to 100 µmol L−1 and a limit of detection of 0.2 µmol L−1. Based on the results obtained and sensor application, 3D-printed G-PLA proved an excellent choice for epinephrine sensing purposes.
1. Introduction
Psychological stress is understood as an overload of demands that exceed the individual’s adaptive capacity. From the response to the stress stimulus, responses of the endocrine system are induced: the hypothalamic–pituitary–adrenocortical axis and the sympathetic–adrenal–medullary system [1]. However, this prolonged activation caused by stress can interfere with immunological and inflammatory processes, influencing depression, infectious, autoimmune, and coronary artery diseases, and at least some cancers [2].
Despite being adaptable, chronic overactivation of the hypothalamic–pituitary–adrenocortical and sympathetic–adrenal–medullary endocrine system induces a “domino effect” in the biological system, stimulating overcompensation, leading to breakdown, and exposing the organism to stress-related diseases. In this case, there is a prolonged production of specific hormones related to the stress process (epinephrine, norepinephrine, and cortisol), which fail to fulfill their function of protecting a suffering individual and start to damage the brain and body.
Many bodily functions are controlled by glands and variations in the proportions of neurotransmitters. Their concentrations are used as parameters of the state of the body and are therefore called biomarkers. Excessive concentrations of cortisol, serotonin, epinephrine (EP), and dopamine biomarkers correspond to variations in emotional conditions or disease [3]. Given these facts, the development of simple and relatively low-cost techniques for the monitoring levels of these biomarkers in body fluids (blood, urine, sweat, and saliva) has been receiving increasing attention. In this regard, many works in the literature have used voltammetric techniques, such as the work by Hongchao et al. [4], in which a film-modified glassy carbon electrode (GCE) composed of multi-walled carbon nanotubes, brilliant Cresyl Blue, and dihexadecyl phosphate was presented for the determination of low concentrations of EP. Mekassa et al. [5] constructed a simple and sensitive glassy carbon electrode modified with poly (L-aspartic acid) and electrochemically reduced graphene oxide for the detection of EP in pharmaceutical samples.
A new and recently explored technology applied in several fields of research is 3D printing, which has stood out for its great potential for prototyping in a practical way and a short period. The advancement of this technology has allowed resolutions to micrometric levels and, together with this, a production process with relatively low cost [6,7]. This technology allows the construction of objects of infinite types and designs using only one printing machine, giving it a high production potential when compared to other prototyping and object construction techniques [8].
Among the existing printing methods, the most common is the extrusion method, known as fused deposition modeling (FDM). In this method, the materials used are thermoplastics (for example, PLA—polylactic acid, acrylonitrile butadiene styrene, polyethylene terephthalate-glycol, etc.) which, in contact with the heated extruder nozzle, change from a solid to a semi-melted state. These materials are then deposited in contact with a lower-temperature surface, solidifying again and thus forming the first layers. From this, the next layers are deposited on top of the previous layer, one by one, until the entire object is printed [9].
In recent years, the literature has presented studies on thermoplastic filaments with conductive materials [10,11,12]. Among these, filaments with graphene stand out. This type of filament has characteristics that distinguish it from the others, including its electrical conductivity and its high physical resistance [13]. One of the first works reporting on sensor printing was carried out by Foster et al. [13], in which a 3D-printed disc electrode was developed using a graphene/PLA filament. Electrodes were developed as energy storage devices and electrocatalysts in hydrogen evolution reactions [13]. Another example is reported in the work by Foo et al. [14], in which supercapacitor platforms and photoelectrochemical sensors were developed. Palenzuela et al. [15] produced ring and disk-shaped sensors using a graphene/PLA filament for the detection of picric acid and ascorbic acid. Dos Santos et al. [16] carried out a study on the electrochemical pretreatment and its influence on the electrochemical behavior of electrodes printed in 3D with graphene filament, demonstrating an improvement in the electrocatalytic activity. Therefore, there is a wide area of application and several compositions and modifications proposed for the use of 3D technology with conductive filaments, including in the area of electrochemistry with the development of analytical devices. To our knowledge, there are no works in the literature so far reporting the use of 3D-printed electrodes in the detection of epinephrine.
In this work, we propose the development of an electrochemical sensor with graphene/polylactic acid (G-PLA) filament and chemical treatment. The approach consists of a sensor based on a screen-printed electrode, together with the development of a proper connector to carry out measurements with a quick and easy connection. The sensor was applied for epinephrine detection in the human serum sample.
2. Materials and Methods
2.1. Chemicals, Solutions, and Samples
The reagents used in this work were of analytical grade. Potassium chloride (≥99 wt%), ferrocene-methanol (97 wt%), epinephrine (95 wt%), and human serum from male AB clotted whole blood (sterile-filtered) (Code: H6914) were purchased from Sigma-Aldrich (St. Louis, MO, USA). Anhydrous mono and bibasic sodium phosphate (≥98 and 99 wt%, respectively) were acquired from Synth (Diadema, Brazil). Dimethylformamide (99.8 vol%) was obtained from Dinamica Química (Indaiatuba, Brazil). Ethanol (99.9 vol%) was obtained from Qhemis (Indaiatuba, Brazil). Clear enamel was used to delimit the drop region on the sensor surface (Cora, São Paulo, Brazil). Solutions were prepared using ultrapure water (Heal Force® system, resistivity ≥ 18.0 MΩ cm). A 0.1 mol L−1 phosphate buffer solution (pH 7.0) was used as the supporting electrolyte for voltammetric measurements. Epinephrine stock solution was prepared daily in the supporting electrolyte immediately before the experiments. The sensor was applied for the determination of epinephrine in the human blood serum sample, which was diluted in a proportion of 1:10 (human serum: phosphate buffer), using the standard addition method at three levels: 8.00, 10.0, and 20.0 μmol L−1.
2.2. Additive Manufacturing and Device Assembly
A 3D printer (Sethi3D S3, Campinas, Brazil), powered by non-conductive (Sethi3D, Campinas, Brazil) and graphene-doped conductive polylactic acid (PLA) thermoplastic filaments (Black Magic 3D, New York, NY, USA), was used for the fabrication of non-conductive parts of the connector, the base for the electrodes, and the electrodes by FDM. All the parts were designed in Autodesk AutoCAD® software, version 2019.0.1.
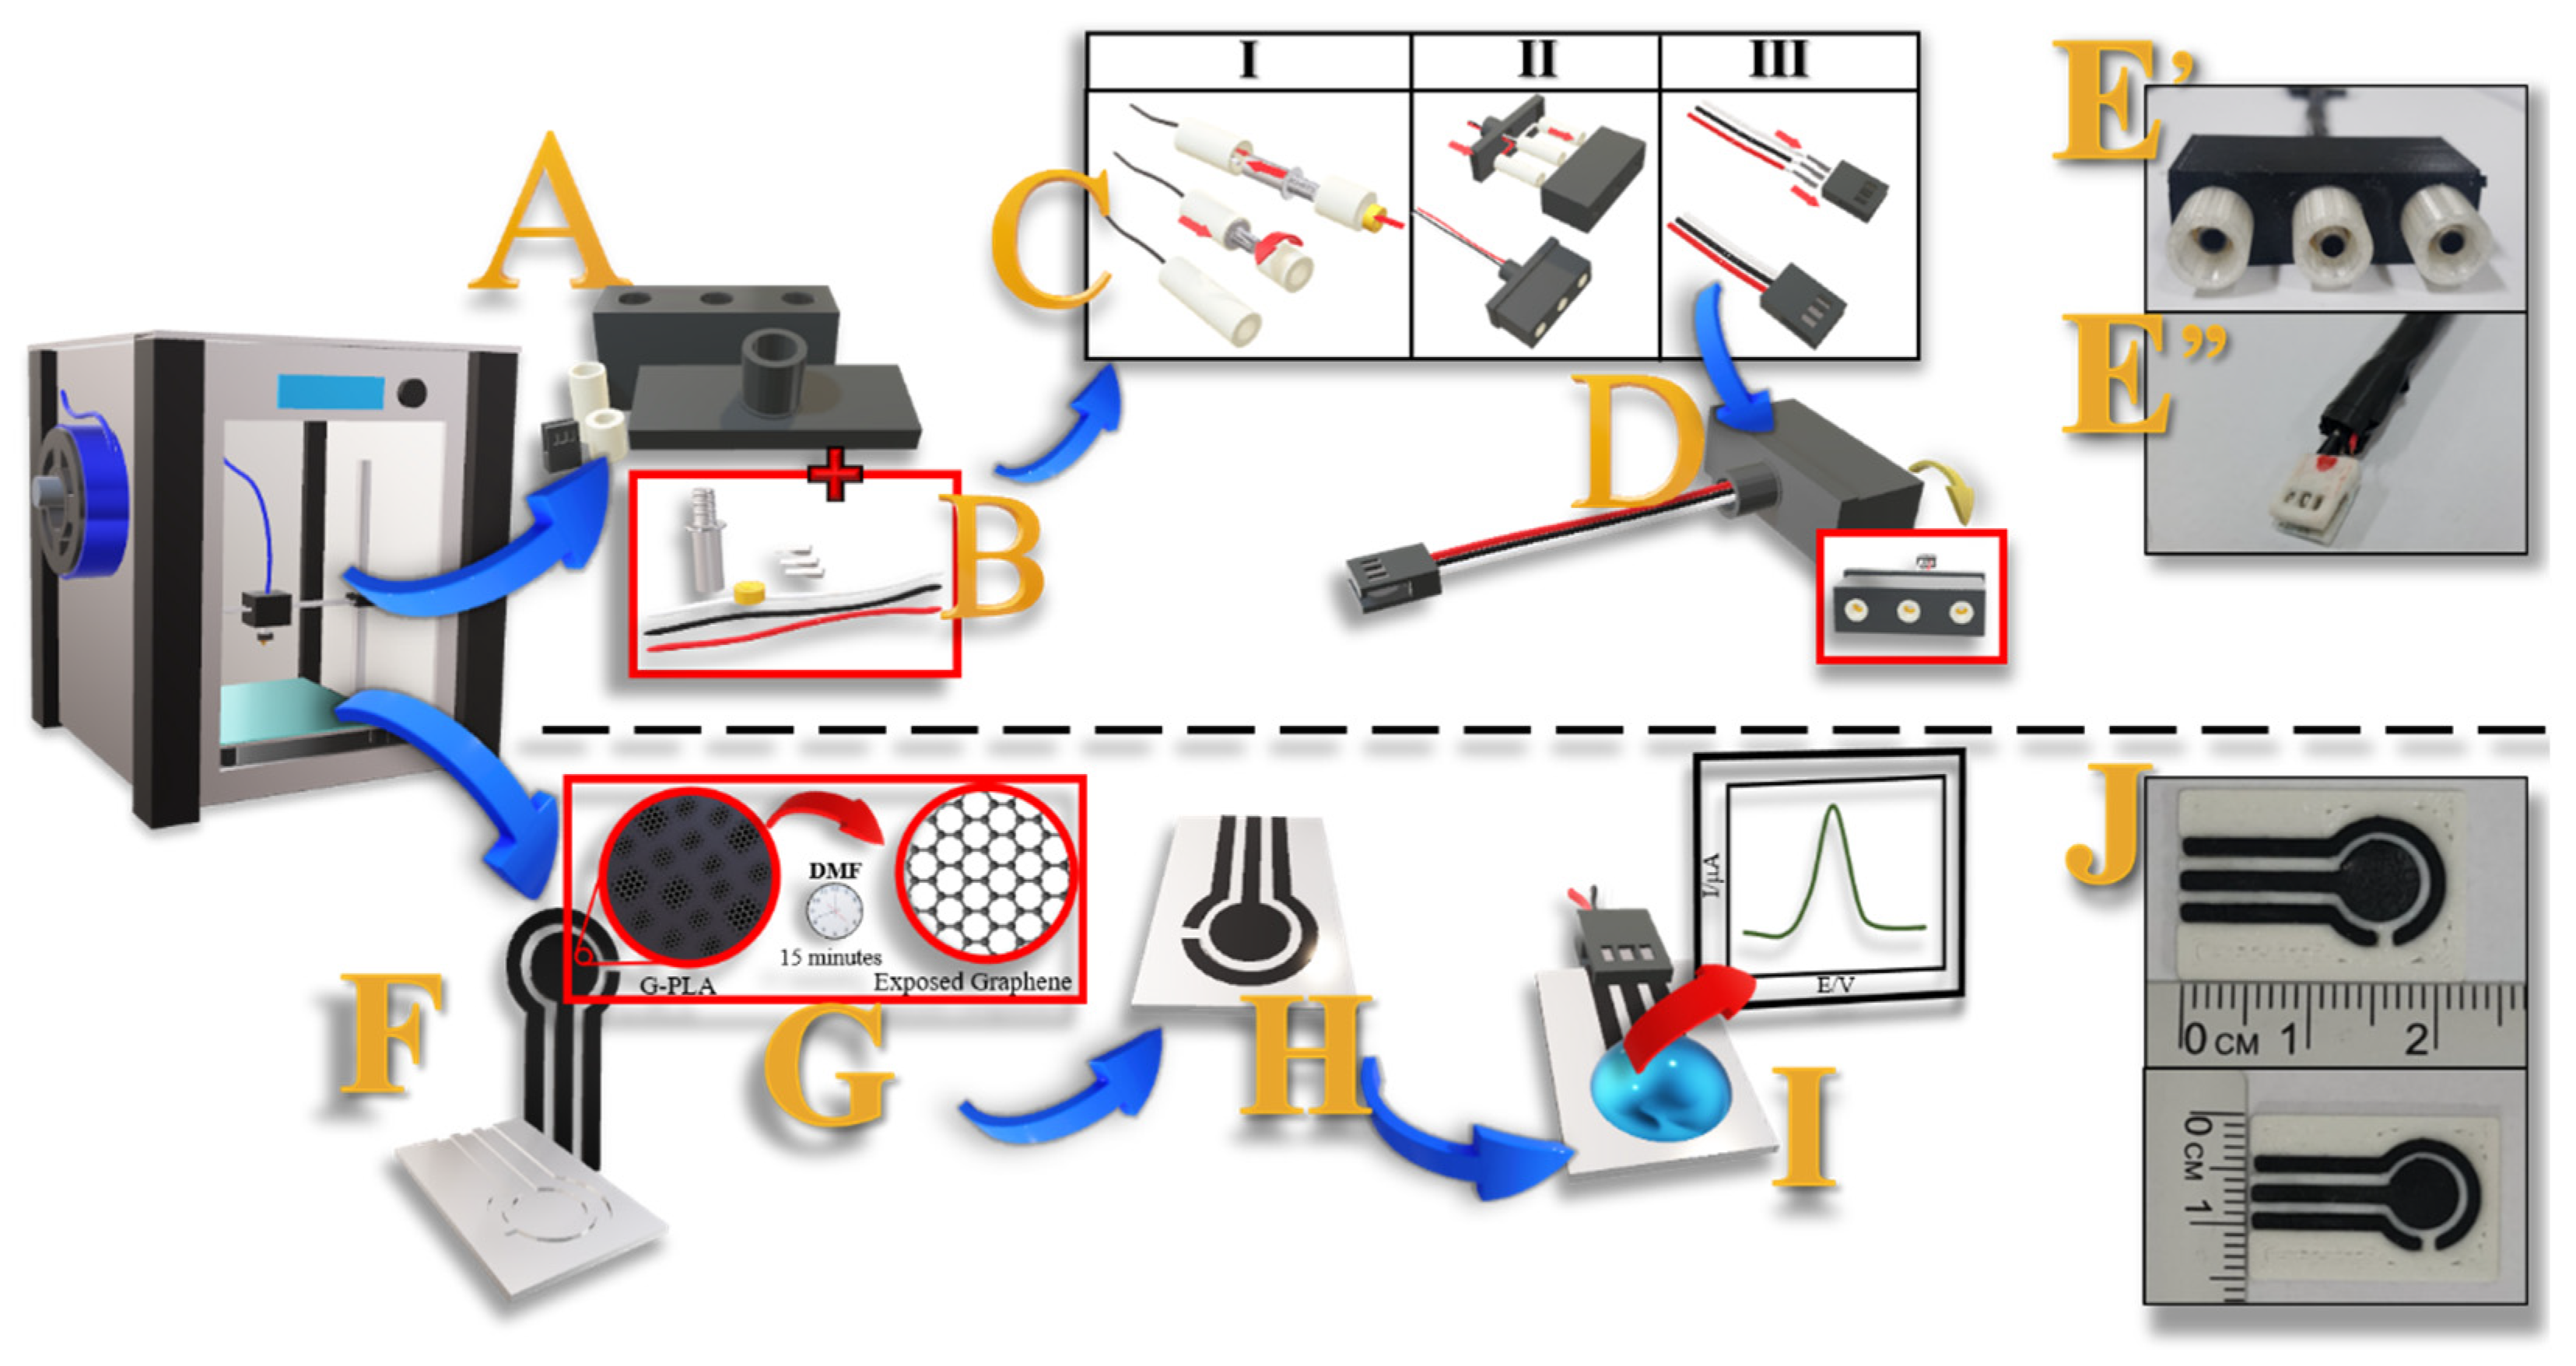
To make an easy and quick connection to the potentiostat, a proper connector was built using 3D-printed parts and electrical connection materials. The parts and electrical materials as well as the connector assembly procedure are illustrated in Figure 1A–C. For the box construction, three 3D-printed cylinders were developed to involve the female metallic connection of the potentiostat cables, and the other three smaller cylinders to involve a thread for fixing the connector to the box. In the female connection, one of the edges of the conductor wire was soldered, as illustrated in Figure 1CI. Each female connector was coupled to an inlet of the box and locked by a cover with a passage for electrical wiring; the assembly is illustrated in Figure 1CII. At the other edge of each wire, a metallic piece responsible for the electrical connection of each electrode individually was soldered. The three connectors were positioned inside the 3D-printed connector, as shown in Figure 1CIII. Real photos of the connector are shown in Figure 1E. The ready-to-use connector is shown in Figure S1.
The architecture of the electrodes was based on a screen-printed electrode design, in which they were fitted on a rectangular base (2.3 × 1.5 cm) and fixed using enamel. The electrodes are 1.5 mm wide, except for the working region of the working electrode, which is a circular shape 6.0 mm in diameter. The insulating material (enamel base) was applied to the electrode surface to delimit the contact region of the sample on the three electrodes. The sensor construction procedure is represented in Figure 1F–I. The region delimited as the geometric area (Ag) of the working electrode was 0.28 cm2. The STL files were generated by the Simplify 3D software, version 4.1.2. All electrochemical measurements were performed in a PGSTAT204 Metrohm potentiostat/galvanostat (Eco Chemie), with a FRA32M module, managed by NOVA software (version 2.1.4). A video summarizing the process is available on the journal’s website.
2.3. Treatment of the Additive Manufacturing Graphene/Polylactic Acid (G-PLA) Electrodes
After the manufacturing, the three electrodes (working, counter, and pseudo-reference) were subjected to a chemical treatment according to the method of Manzanares et al. [15] to remove part of the PLA, a non-conductive polymer, from the surface and expose the conductive material. For this, the electrodes were immersed in DMF for 15 min, followed by washing with ethanol and left to dry in the environment for 24 h. After drying, the sensor was ready for electrochemical testing. Figure 1F–I illustrates the sensor print scheme, as well as the treatment and performance of electrochemical measurements.
2.4. Characterization of the Additive Manufacturing Electrodes
Scanning electron microscopy (SEM) images of the electrode surface were obtained using a Philips XL−30 FEG scanning electron microscope operating at 3 kV with the electrodes covered by a thin layer of gold. X-ray diffraction was obtained using a Miniflex X-ray diffractometer (Rigaku), with a Cuk α radiation source (λ = 0.15406 nm), in the angular range from 4.0 to 90°. Fourier transform infrared spectroscopy (FTIR) was performed with a Tensor II (Bruker) spectrophotometer, from 400 to 4000 cm−1.
The sensor surface wettability evaluation was performed using an additive manufacturing lab-made device for contact angle measurements [17]. By the drop-casting technique, an aliquot of 150 µL of deionized water was added to the working region of the working electrode. After 10 s, the images were recorded using a smartphone, and the angle was calculated from the surface of the sensor substrate and the tangent of the liquid phase of the water droplet. The calculation was performed using the free version of the Laser Level smartphone application.
Electrochemical characterization was performed by cyclic voltammetry (CV), in the presence of 1.0 mmol L−1 ferrocene-methanol (FcMeOH), and 0.1 mol L−1 KCl. CV measurements were carried out at 50.0 mV s−1.
3. Results and Discussion
3.1. Characterization of the Electrodes
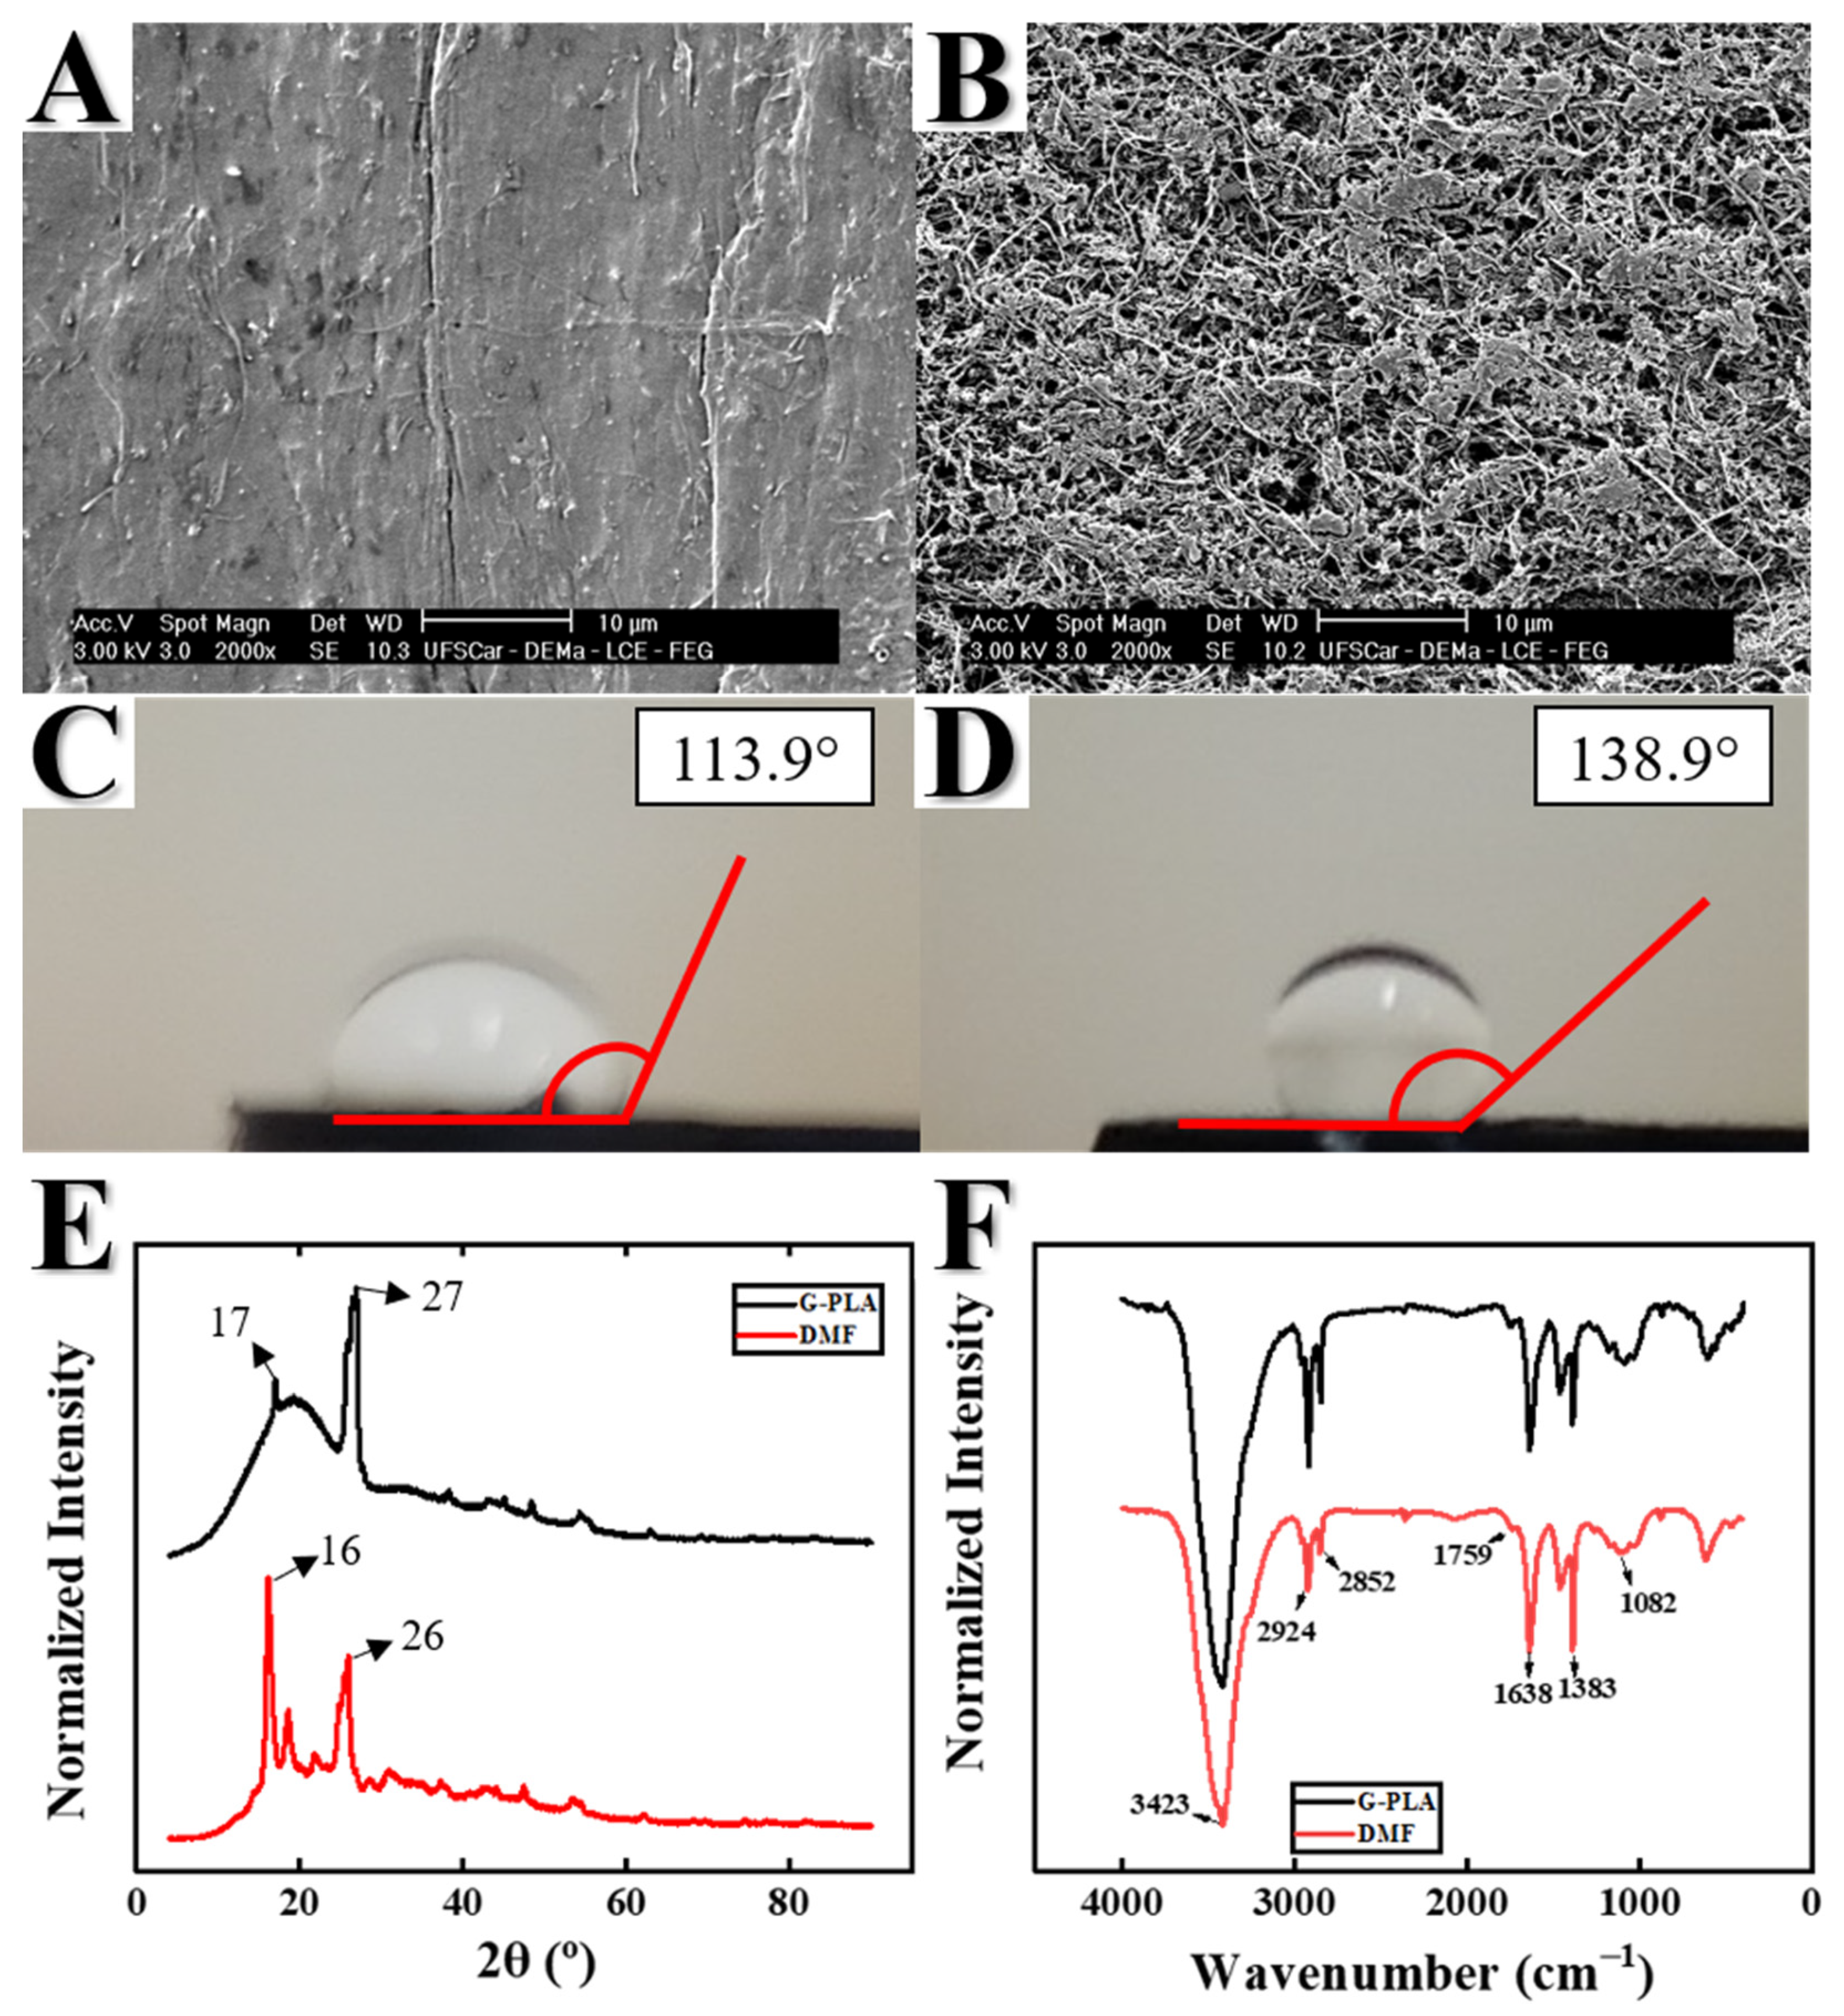
To investigate the changes that occurred on the surface of G-PLA after the treatment with DMF, morphological characterizations were performed. SEM images were obtained with 2000× magnification, showing a surface coating with PLA on the untreated G-PLA electrode (Figure 2A), with less exposure to graphene conducting sites. After the DMF treatment, it is possible to observe that a large part of the PLA from the surface was removed, exposing the graphene structures on the electrode surface (Figure 2B). Similar results for this filament were found in other works published in the literature [18,19,20]. Thus, it is possible to directly correlate the observed results with the improvement in the electrochemical performance noticed after the surface treatment of the G-PLA.
To investigate the hydrophobicity of the sensor before and after the surface treatment, contact angle measurements were performed (Figure 2C,D, respectively). After treatment, there was an increase in the hydrophobicity of the material surface (138.9°) compared to the untreated surface (113.9°). This may have occurred due to the partial removal of surface PLA on the electrode caused by DMF. In the literature, PLA is reported as a hydrophilic material, with a contact angle close to 67° [21]; meanwhile, graphene has hydrophobic characteristics, presented in the literature with a contact angle close to 100° [22] and reaching values up to 162° [23]. In this way, it is supposed that graphene exposure provides the material with a more hydrophobic characteristic [24].
To analyze the crystallinity of these materials, concerning their morphological properties, XRD measurements were performed for G-PLA electrodes before and after the treatment with DMF (Figure 2E). An increase in the intensity of the characteristic peaks of the material and the emergence of new peaks were observed after the treatment of the electrode. The visualized bands represent the crystalline regions of the material, which we believe to be the semi-crystalline conformation of PLA and graphene, while the curved regions represent amorphous regions of PLA. In Figure 2E, it is possible to observe that the G-PLA demonstrated a more amorphous profile. For the sensor treated with DMF, it is possible to observe a decrease in the amorphous regions and an increase in the intensity of crystalline bands. The diffractograms showed a broad peak approximately at 17.4° and 16.3° for the electrodes before and after activation, which is attributed to semicrystalline PLA [25]. The profile showed a characteristic peak at 26.3° on the graphitic plane (002) associated with the graphene structure [26]. The result corroborates what is observed through the contact angle, where it is believed that a large amount of surface PLA is removed, exposing the graphene on the electrode.
FTIR spectroscopy was used to identify functional groups on G-PLA electrodes, before and after treatment, as shown in Figure 2F. The spectra showed similar peaks due to their structural similarity. The spectrum showed characteristic bands associated with the PLA matrix at 2924 and 2852 cm−1, corresponding to the CH3 stretch vibrations [27]. C=O vibration at 1759 cm−1 [16,27,28,29], CH formations around 1383 cm−1 [27], and COC elongation at 1082 cm−1 [27,30,31] were also recorded. Furthermore, two peaks at approximately 1638 and 3423 cm−1 corresponding to the C=O [32,33,34] and OH [32], respectively, were observed. Considering the DMF surface treatments, we suggest that the decrease in the peaks’ intensity at 2924 and 2852 cm−1 (CH3) could be correlated to the removal of PLA from the material by the treatments.
3.2. Electrochemical Performance of Graphene/Polylactic Acid (G-PLA) Electrode
A previous electrochemical test was carried out to evaluate the performance of the sensor by CV using 1.0 mmol L−1 FcMeOH as a redox probe. It was first observed that the sensors had a lower current response before treatment. This occurred because the surface of the sensor was partially covered with PLA, an insulating material, impairing the electron transfer process, decreasing the electroactive surface area, and consequently resulting in a lower electrochemical performance when compared to the treated sensor, as can be seen in Figure 3A (black line). Therefore, the method developed by Manzanares et al. [15] using DMF and keeping the electrodes immersed for 15 min improved their performance. As can be seen in Figure 3A (red line), this activation contributed to a significant increase in the intensity of the response signal, from an Ipa of 10.9 to 35.8 µA, and an Ipc of −7.6 to −25.2 µA. There was also a contribution to the reversibility of the system, which occurred with a considerable decrease in the peak-to-peak separation (ΔEp), from 268.4 to 107.0 mV. The treatment was carried out in the three electrodes, and modification was also carried out on the surface of the reference electrode, which explains the abrupt displacement of the peak potential [35].
The electroactive area (Ae) of the proposed electrode was estimated by cyclic voltammetry (Figure 3B) based on the Randles-Sevcik equation (Equation (1)), which was carried out at a scan rate range from 50 to 250 mV s−1 using 1.0 mmol L−1 FcMeOH as a redox probe. According to the equation, Ip refers to the peak current, A corresponds to the electroactive area (cm2), C is the concentration of the probe used (1.0 mmol cm−3), D is the diffusion coefficient of the species in solution (FcMeOH, 7.6 × 10⁻⁶ cm2 s−1), n refers to the number of electrons transferred in the redox reaction (n = 1), and v is the scan rate.
An electroactive area (Ae) of 1.16 ± 0.0096 cm2 was obtained for the treated G-PLA sensor, which is a considerable increase when compared to its geometric area (Ag = 0.28 cm2). To compare it with other sensors made by additive manufacturing using graphene filament reported in the literature, we considered the real area of the sensor (Areal = Ae/Ag), which for the sensor proposed here was 4.14. In the literature, it is possible to find works that use sensors built with the same or similar filaments to the one used in this work, through additive manufacturing. Each work uses different treatment techniques or architectures in its devices, with real area values experiencing variations [16,24,36]. The proposed activated sensor showed a higher electroactive area compared to other reported 3D-printed sensors with different architectures. It can be concluded that even on a close scale, the sensor construction methodology reflects the electrochemical response obtained.
The heterogeneous electron transfer constant (k0) was also estimated by Nicholson’s method, calculated by cyclic voltammetry at different scan rates (Figure 3B). The kinetic parameter (Ψ) was calculated as proposed by Lavagnini et al. [37] (Equation (2)), establishing a link between Ψ and ΔEp for each scan rate [38], according to the following equation:
The values found for Ψ were applied to calculate k0 (Equation (3)):
where Ψ is the kinetic parameter, π is the mathematical constant (3.1415), D is the diffusion coefficient for FcMeOH (7.6 × 10⁻⁶ cm2 s−1), n is the number of electrons involved in the process, F is the Faraday constant (96,485 Cmol−1), R is the universal gas constant (8.314 J K−1 mol−1), and T is the temperature (298.15 K). The value obtained was estimated at 2.3 × 10⁻⁴ cm s−1, thus being a quasi-reversible system [35]. This result is compatible with that of similar systems previously estimated in the literature [19,24,39,40], corroborating the previous characterization data and the results presented in Figure 3.
3.3. Voltammetric Detection of Epinephrine
The activated G-PLA electrode was selected for the voltammetric detection of epinephrine as it demonstrated better electrochemical performance. Therefore, for convenience, when G-PLA is mentioned, it is understood that it is related to the DMF-treated additive manufacturing sensor.
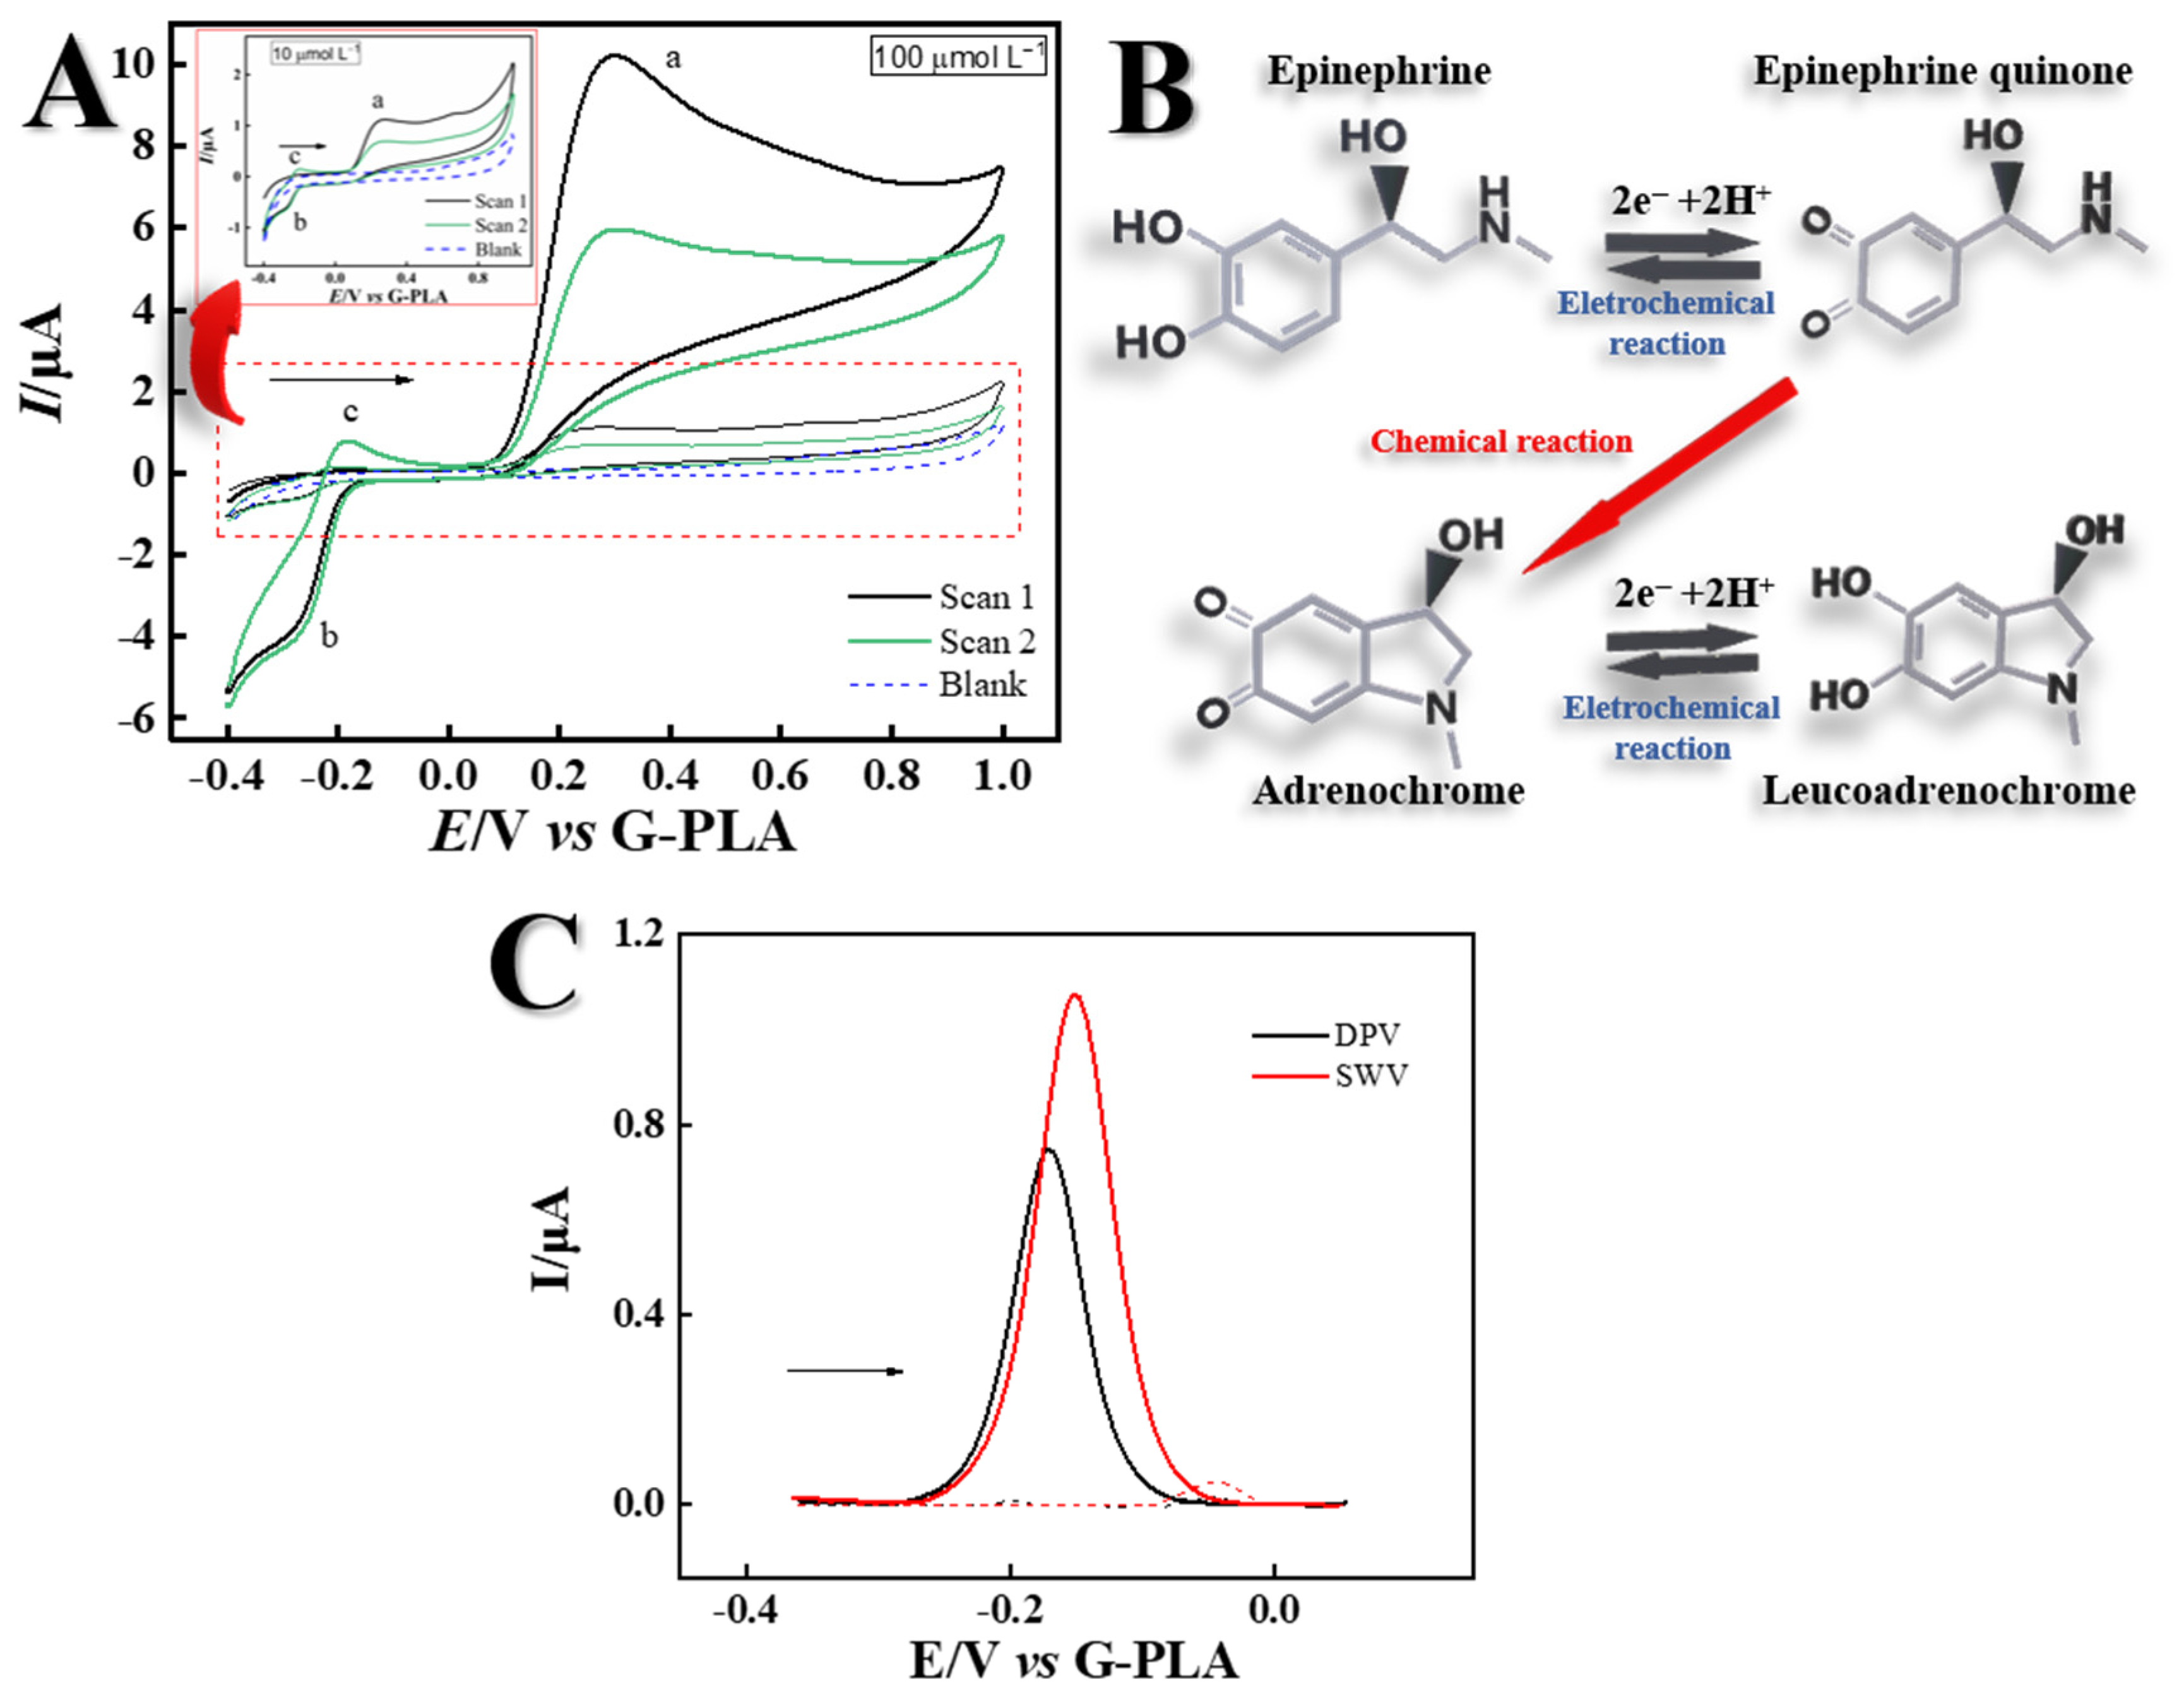
Figure 4A shows the behavior of epinephrine by cyclic voltammetry in 0.1 mol L−1 phosphate buffer (pH 7), for 30 mV s−1, in the potential range from −0.4 V to 1.0 V. It can be seen that in the anodic scan, there is a well-defined oxidation peak (Figure 4A—peak a) (Epa(a) = +0.29 V;) corresponding to the oxidation of epinephrine, producing open-chain epinephrine quinone as observed in the mechanism from Figure 4B. The open-chain quinone was then rapidly cyclized by a chemical reaction to adrenochrome, and the reduction of adrenochrome to leucoadrenochrome provided the cathodic peak (Figure 4A—peak b), observed in the region of negative potentials (Epc(b) = −0.26 V). Starting the second scan, the corresponding peak of “b” was observed (Figure 4A—peak c) (Epa(c) = −0.19 V), corresponding to the oxidation of leucoadrenochrome back to adrenochrome. The oxidation peak of epinephrine (Figure 4A—a) also appears in the second cycle, however, with considerably lower intensity. In addition, the occurrence of the cathodic peak (Figure 4A—peak b) is directly linked to the product of the oxidation reaction of epinephrine in ‘‘a’’, which can be confirmed by the absence of oxidation peak (c) at −0.19 V in the first scan. Furthermore, the reduction of the open-chain epinephrine quinone back to epinephrine was not observed in the cyclic voltammograms, since this process is favored at low pH values with a high presence of protons, and at pH 7 the lower concentration of protons hindered this process [41,42,43].
We considered the concept proposed in the work developed by Sainz et al. [44], which investigated the redox process corresponding to adrenochrome/leucoadrenochrome. For this, aiming to use a single technique to perform the analysis with no further steps, and considering the need to form the oxidation product of epinephrine for the analysis, all the voltammetric measurements (n = 4) were performed in a working window from −0.5 to +1.0 V, and the first scan was discarded. Thus, the presence of adrenochrome/leucoadrenochrome was guaranteed, allowing the indirect determination of epinephrine. Looking for the best electroanalytical performance for the detection of epinephrine, a comparison between electrochemical techniques (i.e., Differential Pulse Voltammetry—DPV and Square Wave Voltammetry—SWV) was performed (Figure 4C).
The SWV technique presented a voltammetric profile more sensitive to the analyte, where a current signal 0.32 µA higher was obtained when compared with the same signal obtained by the DPV technique. Therefore, this technique was selected for future measurements. To obtain the highest sensitivity for the proposed determination, the optimization of the parameters (operating conditions) used for each technique as well as the pH of the supporting electrolyte were evaluated.
Initially, studies were carried out to evaluate the pH of the supporting electrolyte (0.1 mol L−1 phosphate buffer) to determine the best analytical signal. A pH range between 5.0 and 8.0 was studied, and the best result was obtained at pH 7.0, as shown in Figure S2A; this value was selected for the next studies. SWV technique parameters (i.e., frequency, amplitude modulation, and step) were carefully studied between 6.0–60 Hz, 10–100 mV, and 1.0–10 mV, respectively, as shown in Figure S2B–D. The peaks obtained with higher definition, lower standard deviation, and higher peak current values were selected for further studies for epinephrine determination, corresponding to a frequency of 30 Hz, a modulation amplitude of 60 mV, and a step of 6.0 mV.
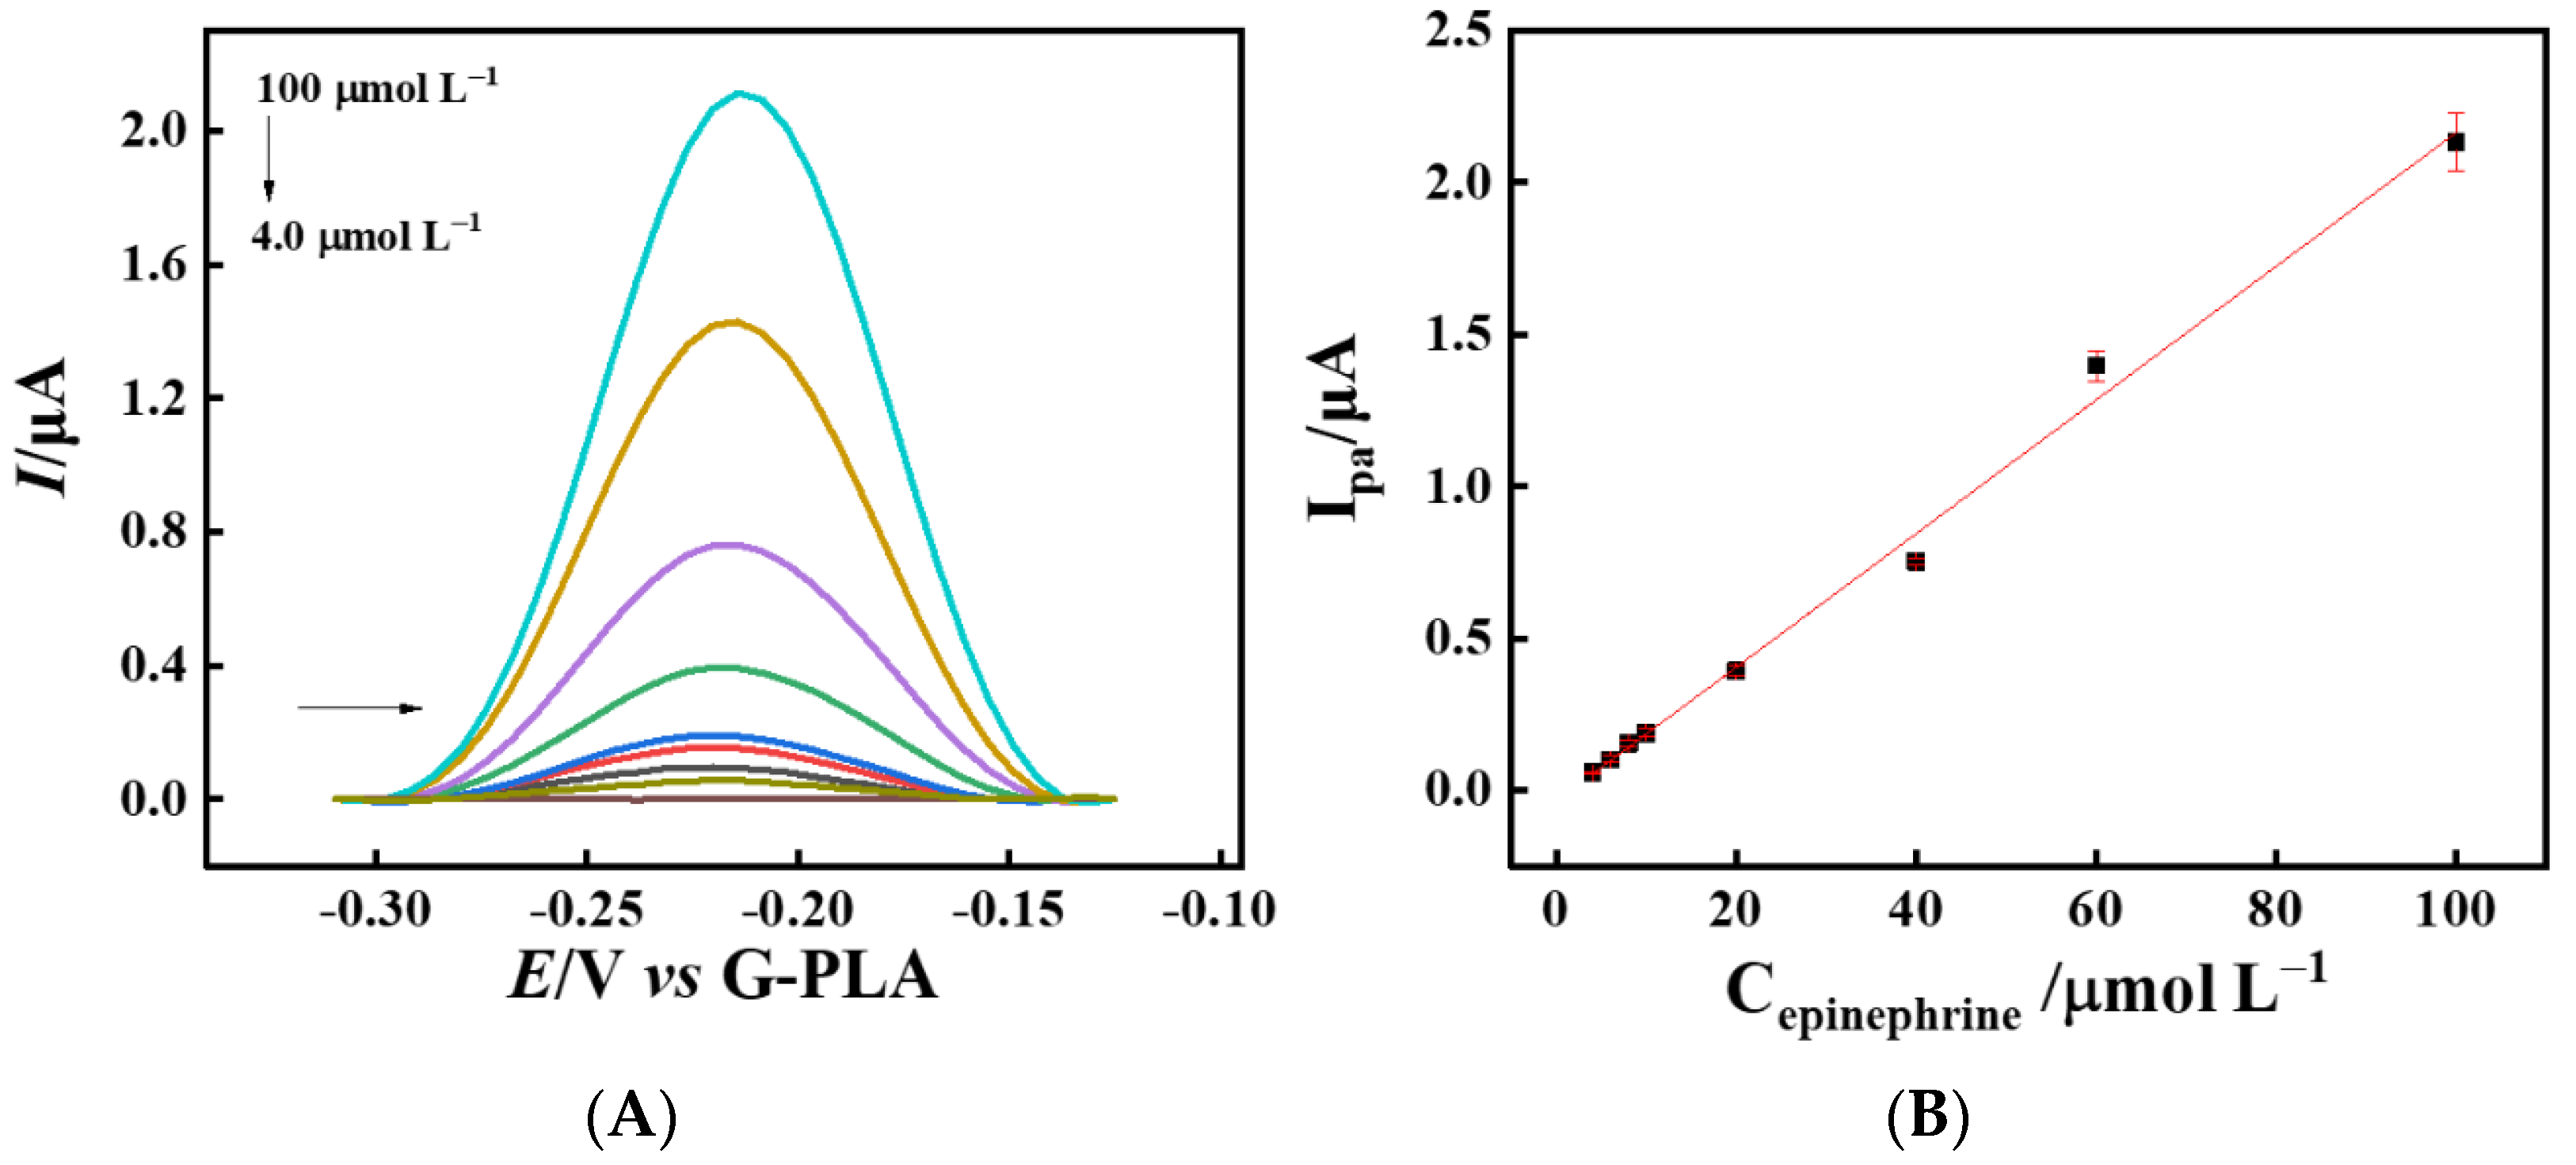
Using the optimized SWV parameters, voltammograms were obtained for increasing concentrations of epinephrine (Figure 5A). A linear behavior in the concentration range from 4.0 to 100 µmol L−1 of epinephrine was observed, with a satisfactory coefficient of determination (R2) of 0.994 (Figure 5B). The relationship between the anodic current peak (Ipa, µA) and the epinephrine concentration (Cepinephrine, µmol L−1) can be described by the equation Ipa = −3.43 × 10⁻⁸ (3.02 × 10⁻⁸) + 0.0220 (0.0007) Cepinephrine. The relative standard deviation (RSD) value was estimated at 0.3% for four consecutive measurements at 10.0 µmol L−1 epinephrine (RSD = (s/) × 100%, where s is the standard deviation and the mean of the currents) (Figure S3A). The accuracy in the production of different devices (% RSD) was calculated as 4.9% (n = 4, 10.0 µmol L−1 epinephrine), showing that different sensors can provide similar responses (Figure S3B). The stability in a single device (% RSD) was calculated as 9.03% (n = 35, 10.0 µmol L−1 epinephrine), showing that in the same sensor, several measurements can be performed with an acceptable deviation, below 10% (Figure S3C). The limits of detection (LOD) and quantification (LOQ) were calculated as 0.25 µmol L−1 and 0.84 µmol L−1, following the recommendations of the IUPAC (LOD = 3 × SD/S and LOQ = 10 × SD/S, where SD is the standard deviation of the baseline noise (n = 10) and S is the slope of the analytical curve). With the presented values, it was possible to conclude that the lab-made 3D-printed sensor demonstrated a good analytical performance, repeatability, and reproducibility for the determination of epinephrine.
In order to test the applicability of the sensor in the determination of epinephrine, the analysis of this analyte was performed in a human blood serum sample, which was fortified with known amounts of the biomarker (8.0, 10, 20, and 40 µmol L−1). SWV measurements were performed, resulting in a recovery variation between 96.9 and 102%, as shown in Table 1. From these results, it is possible to conclude that the developed sensor presented a good analytical performance for epinephrine detection. This range of recovery values is acceptable according to similar results found in the literature for electrochemical sensors for epinephrine [45,46].
A selectivity study of the proposed sensor for epinephrine was performed. The interference caused by other species commonly present in human blood serum was evaluated using the SWV technique for 0.1 mmol L−1 of epinephrine (Figure S4). As interfering species, uric acid was evaluated in two different ratios (1:1 and 1:10 (epinephrine:interfering)) and ascorbic acid in four different ratios (1:1, 1:10, 1:100, and 1:1000). In addition, the neurotransmitter dopamine was also evaluated in two different ratios (1:1 and 1:10). The compounds were chosen based on literature reports that performed analyses in human blood serum samples [43,47]. The influence of each interferent in the current response of epinephrine is summarized in Table S1. Positive values correspond to the increase in current obtained by the voltammetric epinephrine signal, while negative values correspond to its decay, both resulting from the presence of interfering species. As can be seen in the table, for ascorbic acid in the proportions 1:1 and 1:10, low interferences were observed (+4.25 and −6.19%, respectively), while in the proportions 1:100 and 1:1000, significant interferences (−34.5 and −43.6%, respectively) in the analytical signal occurred. In the presence of uric acid, significant interferences were observed (+48%), even in the equivalent proportion (1:1). For the presence of the neurotransmitter dopamine as an interfering agent, in the 1:1 proportion, a low interference (−7.44%) in the current response occurred, while for an increased proportion (1:10), there was a significant interference (+351%) in the analytical signal of epinephrine. In the literature, many works highlight high interference of the species studied here; however, it is possible to observe in the voltammograms (Figure S4) that for the proposed sensor there is no peak overlapping with epinephrine electrochemical response, being possible to identify if there is the presence of such interferents [47,48]. In this sense, a way to solve the problem of interference caused by species would be to apply the method of simultaneous detection of compounds using a modifier, as already shown in the literature [48]. Therefore, such strategies will be considered in future work.
A brief comparison between different electrochemical sensors for the determination of the stress biomarker is shown in Table 2. Diagnostic analyses for epinephrine in human blood serum are performed in the pmol L−1 to nmol L−1 range [49,50]. Despite this, the device has real application potential for pre- and post-operative situations, where patients present epinephrine concentrations at levels of µmol L−1, and in extreme cases, reaching mmol L−1 in samples of plasma and urine [51]. Another applicability would be for pharmaceutical purposes such as the quality control of drugs, where injectable drugs are sold at different concentrations, with some options in mmol L−1 and µmol L−1, in addition to other less concentrated options [44,52]. In conclusion, the proposed sensor applied as a proof of concept for the determination of epinephrine demonstrated a satisfactory analytical performance, presenting a linear range and LOD comparable to other electrochemical sensors based on different materials described in the literature.
4. Conclusions
We demonstrated the applicability of an additive manufacturing platform based on a PLA thermoplastic filament and graphene conductive filament for the determination of epinephrine. An additive manufacturing device (sensor and connectors) was manufactured by a simple and relatively low-cost process. The 3D printing technology is relatively fast and has a low production cost, together with the precision and ability to replicate the technique; thus, the proposed device supports large-scale production. The sensor showed an appreciable analytical performance by the SWV technique, including a low limit of detection, wide linear concentration range, as well as good reproducibility and recovery for the determination in human blood serum samples.
The proposed 3D-printed sensor proved to be suitable for the determination of epinephrine in biological samples, being an alternative to conventional approaches. In addition, the proposed device boasts simple handling and its own portable connector; thus, it can be easily applied as a point-of-care device.
Supplementary Materials
The following supporting information can be downloaded at: https://www.mdpi.com/article/10.3390/chemosensors11050306/s1. Figure S1: Assembling of the connector and support for the electrodes: (A–D) materials and the parts used for the connector fabrication; and (E–F) the ready-to-use connector; Figure S2: Evaluation of measurement and instrumental parameters for the determination of 0.1 mmol L−1 epinephrine by SWV technique: (A) pH effect (5.0–8.0), (B) frequency (5.0–60 Hz), (C) modulation amplitude (5.0–8.0), and (D) step potential (n = 3). SWV used parameters: (A) step = 5.0 mV, modulation amplitude = 20 mV, frequency = 6.0 Hz; (B) step = 5.0 mV, modulation amplitude = 20 mV; (C) step = 5.0 mV, Frequency 30 Hz; (D) Modulation amplitude = 60 mV, frequency = 30 Hz. (B–D) Supporting electrolyte: 0.1 mol L−1 phosphate buffer (pH 7.0); Figure S3. SWV voltammograms of (A) repeatability study (n = 4), (B) inter-device study (n = 4) (C) stability study (over 35 scans, displayed every 5 scans), in the presence of 10.0 µmol L−1 of epinephrine. Experimental conditions— step potential: 6 mV; modulation amplitude: 60 mV; frequency: 30 Hz. Supporting electrolyte: 0.1 mol L−1 phosphate buffer (pH 7.0); Figure S4. SWV voltammograms to selectivity study, in the presence of (A) 1.0 mmol L−1 of epinephrine, (B) 1.0 mmol L−1 of epinephrine and dopamine at two different ratios (1:1 and 1:10), (C) 1.0 mmol L−1 of epinephrine and uric acid at two different ratios (1:1 and 1:10), (D) 1.0 mmol L−1 of epinephrine and uric ascorbic at four different ratios (1:1, 1:10, 1:100, and 1:1000). Experimental conditions—step potential: 6 mV; modulation amplitude: 60 mV; frequency: 30 Hz. Supporting electrolyte: 0.1 mol L−1 phosphate buffer (pH 7.0); Table S1. Selectivity study on the SWV signal of 0.1 mmol L−1 epinephrine. Video summarizing the process is available on the journal’s website.
Author Contributions
V.A.O.P.d.S.: Conceptualization, methodology, software, validation, formal analysis, investigation, data curation, writing—original draft preparation, and writing—review and editing; J.S.S.: validation, investigation, writing—review and editing, and visualization; C.K.: validation, investigation, writing—review and editing, and visualization; J.A.B.: resources, writing—review and editing, and supervision; B.C.J.: conceptualization, validation, investigation, resources, writing—review and editing, visualization, supervision, project administration, and funding acquisition. All authors have read and agreed to the published version of the manuscript.
Funding
This work was financed in part by the Brazilian agencies Fundação de Amparo à Pesquisa do Estado de São Paulo (FAPESP, Grant Nos. 2021/03179-8, 2021/07989-4, 2019/00473-2, 2022/06145-0, and 2017/21097-3), Conselho Nacional de Desenvolvimento Científico e Tecnológico (CNPq) (301796/2022-0 and 308203/2021-6) and Coordenação de Aperfeiçoamento de Pessoal de Nível Superior (CAPES, 001, 88887.504861/2020-00).
Institutional Review Board Statement
Not applicable.
Informed Consent Statement
Not applicable.
Data Availability Statement
Not applicable.
Conflicts of Interest
The authors declare no conflict of interest.
References
- Cohen, S.; Kessler, R.C.; Gordon, L.U. Strategies for measuring stress in studies of psychiatric and physical disorders. Meas. Stress A Guide Health Soc. Sci. 1995, 28, 3–26. [Google Scholar]
- Cohen, S.; Janicki-Deverts, D.; Miller, G.E. Psychological stress and disease. Jama 2007, 298, 1685–1687. [Google Scholar] [CrossRef] [PubMed]
- Steckl, A.J.; Ray, P. Stress biomarkers in biological fluids and their point-of-use detection. ACS Sens. 2018, 3, 2025–2044. [Google Scholar] [CrossRef] [PubMed]
- Yi, H.; Zheng, D.; Hu, C.; Hu, S. Functionalized multiwalled carbon nanotubes through in situ electropolymerization of brilliant cresyl blue for determination of epinephrine. Electroanal. Int. J. Devoted Fundam. Pract. Asp. Electroanal. 2008, 20, 1143–1146. [Google Scholar] [CrossRef]
- Mekassa, B.; Tessema, M.; Chandravanshi, B.S.; Baker, P.G.; Muya, F.N. Sensitive electrochemical determination of epinephrine at poly (L-aspartic acid)/electro-chemically reduced graphene oxide modified electrode by square wave voltammetry in pharmaceutics. J. Electroanal. Chem. 2017, 807, 145–153. [Google Scholar] [CrossRef]
- VS, A.P.; Joseph, P.; SCG, K.D.; Lakshmanan, S.; Kinoshita, T.; Muthusamy, S. Colorimetric sensors for rapid detection of various analytes. Mater. Sci. Eng. C 2017, 78, 1231–1245. [Google Scholar]
- Au, A.K.; Lee, W.; Folch, A. Mail-order microfluidics: Evaluation of stereolithography for the production of microfluidic devices. Lab A Chip 2014, 14, 1294–1301. [Google Scholar] [CrossRef]
- Chan, H.N.; Shu, Y.; Xiong, B.; Chen, Y.; Chen, Y.; Tian, Q.; Michael, S.A.; Shen, B.; Wu, H. Simple, cost-effective 3D printed microfluidic components for disposable, point-of-care colorimetric analysis. Acs Sens. 2016, 1, 227–234. [Google Scholar] [CrossRef]
- Waldbaur, A.; Rapp, H.; Länge, K.; Rapp, B.E. Let there be chip—Towards rapid prototyping of microfluidic devices: One-step manufacturing processes. Anal. Methods 2011, 3, 2681–2716. [Google Scholar] [CrossRef]
- Flowers, P.F.; Reyes, C.; Ye, S.; Kim, M.J.; Wiley, B.J. 3D printing electronic components and circuits with conductive thermoplastic filament. Addit. Manuf. 2017, 18, 156–163. [Google Scholar] [CrossRef]
- Kwok, S.W.; Goh, K.H.H.; Tan, Z.D.; Tan, S.T.M.; Tjiu, W.W.; Soh, J.Y.; Ng, Z.J.G.; Chan, Y.Z.; Hui, H.K.; Goh, K.E.J. Electrically conductive filament for 3D-printed circuits and sensors. Appl. Mater. Today 2017, 9, 167–175. [Google Scholar] [CrossRef]
- Cardenas, J.A.; Tsang, H.; Tong, H.; Abuzaid, H.; Price, K.; Cruz, M.A.; Wiley, B.J.; Franklin, A.D.; Lazarus, N. Flash ablation metallization of conductive thermoplastics. Addit. Manuf. 2020, 36, 101409. [Google Scholar] [CrossRef]
- Foster, C.W.; Down, M.P.; Zhang, Y.; Ji, X.; Rowley-Neale, S.J.; Smith, G.C.; Kelly, P.J.; Banks, C.E. 3D printed graphene based energy storage devices. Sci. Rep. 2017, 7, 42233. [Google Scholar] [CrossRef]
- Foo, C.Y.; Lim, H.N.; Mahdi, M.A.; Wahid, M.H.; Huang, N.M. Three-dimensional printed electrode and its novel applications in electronic devices. Sci. Rep. 2018, 8, 7399. [Google Scholar] [CrossRef]
- Manzanares Palenzuela, C.L.; Novotný, F.; Krupička, P.; Sofer, Z.k.; Pumera, M. 3D-printed graphene/polylactic acid electrodes promise high sensitivity in electroanalysis. Anal. Chem. 2018, 90, 5753–5757. [Google Scholar] [CrossRef]
- dos Santos, P.L.; Katic, V.; Loureiro, H.C.; dos Santos, M.F.; dos Santos, D.P.; Formiga, A.L.B.; Bonacin, J.A. Enhanced performance of 3D printed graphene electrodes after electrochemical pre-treatment: Role of exposed graphene sheets. Sens. Actuators B Chem. 2019, 281, 837–848. [Google Scholar] [CrossRef]
- da Silva, V.A.; Tartare, V.A.; Kalinke, C.; Oliveira, P.R.D.; Souza, D.C.D.; Bonacin, J.A.; Janegitz, B.C. Lab-made 3D-printed contact angle measurement adjustable holder. Química Nova 2020, 43, 1312–1319. [Google Scholar]
- Silva, V.A.; Fernandes-Junior, W.S.; Rocha, D.P.; Stefano, J.S.; Munoz, R.A.; Bonacin, J.A.; Janegitz, B.C. 3D-printed reduced graphene oxide/polylactic acid electrodes: A new prototyped platform for sensing and biosensing applications. Biosens. Bioelectron. 2020, 170, 112684. [Google Scholar] [CrossRef]
- Kalinke, C.; Neumsteir, N.V.; Aparecido, G.O.; Ferraz, T.V.B.; Santos, P.L.; Janegitz, B.C.; Bonacin, J.A. Comparison of activation processes for 3D printed PLA-graphene electrodes: Electrochemical properties and application for sensing of dopamine. Analyst 2020, 145, 1207–1218. [Google Scholar] [CrossRef]
- Browne, M.; Novotný, F.; Sofer, Z.; Pumera, M. 3D Printed Graphene Electrodes’ Electrochemical Activation. ACS Appl. Mater. Interfaces 2018, 10, 40294–40301. [Google Scholar] [CrossRef]
- Alakrach, A.; Noriman, N.; Dahham, O.S.; Hamzah, R.; Alsaadi, M.A.; Shayfull, Z.; Idrus, S.S. Chemical and hydrophobic properties of PLA/HNTs-ZrO2 bionanocomposites. J. Phys. Conf. Ser. 2018, 1019, 012065. [Google Scholar] [CrossRef]
- Taherian, F.; Marcon, V.; van der Vegt, N.F.; Leroy, F. What is the contact angle of water on graphene? Langmuir 2013, 29, 1457–1465. [Google Scholar] [CrossRef] [PubMed]
- Sasidharan, A.; Panchakarla, L.S.; Chandran, P.; Menon, D.; Nair, S.; Raob, C.N.R.; Koyakutty, M. Differential nano-bio interactions and toxicity effects of pristine versusfunctionalized graphene. Nanoscale 2011, 3, 2461. [Google Scholar] [CrossRef] [PubMed]
- Kalinke, C.; de Oliveira, P.R.; Neumsteir, N.V.; Henriques, B.F.; de Oliveira Aparecido, G.; Loureiro, H.C.; Janegitz, B.C. Influence of filament aging and conductive additive in 3D printed sensors. Anal. Chim. Acta 2022, 1191, 339228. [Google Scholar] [CrossRef] [PubMed]
- Zhang, R.; Ma, P.X. Porous poly (l-lactic acid)/apatite composites created by biomimetic process. J. Biomed. Mater. Res. Off. J. Soc. Biomater. Jpn. Soc. Biomater. Aust. Soc. Biomater. 1999, 45, 285–293. [Google Scholar] [CrossRef]
- Neelgund, G.M.; Oki, A.; Luo, Z. In situ deposition of hydroxyapatite on graphene nanosheets. Mater. Res. Bull. 2013, 48, 175–179. [Google Scholar] [CrossRef]
- Cardoso, R.M.; Castro, S.V.; Silva, M.N.; Lima, A.P.; Santana, M.H.; Nossol, E.; Silva, R.A.; Richter, E.M.; Paixão, T.R.; Muñoz, R.A. 3D-printed flexible device combining sampling and detection of explosives. Sens. Actuators B Chem. 2019, 292, 308–313. [Google Scholar] [CrossRef]
- Paydayesh, A.; Arefazar, A.; Jalaliarani, A. A morphological study on the migration and selective localization of graphene in the PLA/PMMA blends. J. Appl. Polym. Sci. 2016, 133, 43799. [Google Scholar] [CrossRef]
- Ibrahim, N.; Wahab, M.K.A.; Ismail, H. Physical and degradation properties of polylactic acid and thermoplastic starch blends–Effect of citric acid treatment on starch structures. BioResources 2017, 12, 3076–3087. [Google Scholar] [CrossRef]
- Wang, N.; Yu, J.; Ma, X. Preparation and characterization of thermoplastic starch/PLA blends by one-step reactive extrusion. Polym. Int. 2007, 56, 1440–1447. [Google Scholar] [CrossRef]
- Chieng, B.W.; Ibrahim, N.A.; Yunus, W.M.Z.W.; Hussein, M.Z.; Then, Y.Y.; Loo, Y.Y. Effects of graphene nanoplatelets and reduced graphene oxide on poly (lactic acid) and plasticized poly (lactic acid): A comparative study. Polymers 2014, 6, 2232–2246. [Google Scholar] [CrossRef]
- Chakraborty, G.; Gupta, A.; Pugazhenthi, G.; Katiyar, V. Facile dispersion of exfoliated graphene/PLA nanocomposites via in situ polycondensation with a melt extrusion process and its rheological studies. J. Appl. Polym. Sci. 2018, 135, 46476. [Google Scholar] [CrossRef]
- Wu, H.; Wang, J.; Kang, X.; Wang, C.; Wang, D.; Liu, J.; Aksay, I.A.; Lin, Y. Glucose biosensor based on immobilization of glucose oxidase in platinum nanoparticles/graphene/chitosan nanocomposite film. Talanta 2009, 80, 403–406. [Google Scholar] [CrossRef]
- Rostami, A.; Nazockdast, H.; Karimi, M. Graphene induced microstructural changes of PLA/MWCNT biodegradable nanocomposites: Rheological, morphological, thermal and electrical properties. RSC Adv. 2016, 6, 49747–49759. [Google Scholar] [CrossRef]
- Bard, A.J.; Faulkner, L.R. Electrochemical Methods: Fundamentals and Applications, 2nd ed.; John Wiley & Sons: Hoboken, NJ, USA, 2000. [Google Scholar]
- Stefano, J.S.; Silva, L.R.G.E.; Janegitz, B.C. New carbon black-based conductive filaments for the additive manufacture of improved electrochemical sensors by fused deposition modeling. Microchim. Acta 2022, 189, 414. [Google Scholar] [CrossRef]
- Lavagnini, I.; Antiochia, R.; Magno, F. An extended method for the practical evaluation of the standard rate constant from cyclic voltammetric data. Electroanal. Int. J. Devoted Fundam. Pract. Asp. Electroanal. 2004, 16, 505–506. [Google Scholar] [CrossRef]
- Vieira Jodar, L.; Orzari, L.O.; Storti Ortolani, T.; Assumpção, M.H.; Vicentini, F.C.; Janegitz, B.C. Electrochemical sensor based on casein and carbon black for bisphenol A detection. Electroanalysis 2019, 31, 2162–2170. [Google Scholar] [CrossRef]
- Contreras-Naranjo, J.E.; Perez-Gonzalez, V.H.; Mata-Gómez, M.A.; Aguilar, O. 3D-printed hybrid-carbon-based electrodes for electroanalytical sensing applications. Electrochem. Commun. 2021, 130, 107098. [Google Scholar] [CrossRef]
- Katic, V.; Dos Santos, P.L.; Dos Santos, M.F.; Pires, B.M.; Loureiro, H.C.; Lima, A.P.; Queiroz, J.C.M.; Landers, R.; Muñoz, R.A.A.; Bonacin, J.A. 3D printed graphene electrodes modified with prussian blue: Emerging electrochemical sensing platform for peroxide detection. ACS Appl. Mater. Interfaces 2019, 11, 35068–35078. [Google Scholar] [CrossRef]
- Cristian, A.; Dobre, A.; Sandu, I.; Lungu, A.; Mihailciuc, C. Electrochemical study of epinephrine at platinum electrode. Rev Roum Chim 2010, 55, 249–253. [Google Scholar]
- Zeng, Y.; Yang, J.; Wu, K. Electrochemistry and determination of epinephrine using a mesoporous Al-incorporated SiO2 modified electrode. Electrochim. Acta 2008, 53, 4615–4620. [Google Scholar] [CrossRef]
- Shaikshavali, P.; Reddy, T.M.; Gopal, T.V.; Venkataprasad, G.; Kotakadi, V.S.; Palakollu, V.N.; Karpoormath, R. A simple sonochemical assisted synthesis of nanocomposite (ZnO/MWCNTs) for electrochemical sensing of Epinephrine in human serum and pharmaceutical formulation. Colloids Surf. A Physicochem. Eng. Asp. 2020, 584, 124038. [Google Scholar] [CrossRef]
- Sainz, R.; Del Pozo, M.; Vilas-Varela, M.; Castro-Esteban, J.; Pérez Corral, M.; Vázquez, L.; Blanco, E.; Peña, D.; Martín-Gago, J.A.; Ellis, G.J.; et al. Chemically synthesized chevron-like graphene nanoribbons for electrochemical sensors development: Determination of epinephrine. Sci. Rep. 2020, 10, 14614. [Google Scholar] [CrossRef] [PubMed]
- Li, H.-H.; Wang, H.-H.; Li, W.-T.; Fang, X.-X.; Guo, X.-C.; Zhou, W.-H.; Cao, X.; Kou, D.-X.; Zhou, Z.-J.; Wu, S.-X. A novel electrochemical sensor for epinephrine based on three dimensional molecularly imprinted polymer arrays. Sens. Actuators B Chem. 2016, 222, 1127–1133. [Google Scholar] [CrossRef]
- Silva-Neto, H.A.; Dias, A.A.; Coltro, W.K. 3D-printed electrochemical platform with multi-purpose carbon black sensing electrodes. Microchim. Acta 2022, 189, 235. [Google Scholar] [CrossRef]
- Kannan, A.; Sivanesan, A.; Kalaivani, G.; Manivel, A.; Sevvel, R. A highly selective and simultaneous determination of ascorbic acid, uric acid and nitrite based on a novel poly-N-acetyl-l-methionine (poly-NALM) thin film. RSC Adv. 2016, 6, 96898–96907. [Google Scholar] [CrossRef]
- Koçak, Ç.C.; Dursun, Z. Simultaneous determination of ascorbic acid, epinephrine and uric acid at over-oxidized poly (p-aminophenol) film modified electrode. J. Electroanal. Chem. 2013, 694, 94–103. [Google Scholar] [CrossRef]
- Zouhal, H.; Jacob, C.; Delamarche, P.; Gratas-Delamarche, A. Catecholamines and the effects of exercise, training and gender. Sport. Med. 2008, 38, 401–423. [Google Scholar] [CrossRef]
- van Gulik, L.; Ahlers, S.; van Dijk, M.; Bruins, P.; Meima, M.; de Rijke, Y.; Biemond-Moeniralam, H.S.; Tibboel, D.; Knibbe, C.A.J. Procedural pain does not raise plasma levels of cortisol or catecholamines in adult intensive care patients after cardiac surgery. Anaesth. Intensive Care 2016, 44, 52–56. [Google Scholar] [CrossRef]
- Plunkett, J.J.; Reeves, J.D.; Ngo, L.; Bellows, W.; Shafer, S.L.; Roach, G.; Howse, J.; Herskowitz, A.; Mangano, D.T. Urine and plasma catecholamine and cortisol concentrations after myocardial revascularization: Modulation by continuous sedation. J. Am. Soc. Anesthesiol. 1997, 86, 785–796. [Google Scholar] [CrossRef]
- Ding, M.; Zhou, Y.; Liang, X.; Zou, H.; Wang, Z.; Wang, M.; Ma, J. An electrochemical sensor based on graphene/poly (brilliant cresyl blue) nanocomposite for determination of epinephrine. J. Electroanal. Chem. 2016, 763, 25–31. [Google Scholar] [CrossRef]
- Cui, F.; Zhang, X. Electrochemical sensor for epinephrine based on a glassy carbon electrode modified with graphene/gold nanocomposites. J. Electroanal. Chem. 2012, 669, 35–41. [Google Scholar] [CrossRef]
- Elugoke, S.E.; Fayemi, O.E.; Adekunle, A.S.; Ganesh, P.-S.; Kim, S.-Y.; Ebenso, E.E. Sensitive and selective neurotransmitter epinephrine detection at a carbon quantum dots/copper oxide nanocomposite. J. Electroanal. Chem. 2023, 929, 117120. [Google Scholar] [CrossRef]
- Zhan, S.; Xu, C.; Chen, J.; Xiao, Q.; Zhou, Z.; Xing, Z.; Gu, C.; Yin, Z.; Liu, H. A novel epinephrine biosensor based on gold nanoparticles coordinated polydopamine-functionalized acupuncture needle microelectrode. Electrochim. Acta 2023, 437, 141468. [Google Scholar] [CrossRef]
Figure 1.
Scheme of the proposed connector assembly procedure. (A) 3D-printed parts; (B) electrical connection materials; (C) detailed assembly procedure for (I) female connector, (II) box, and (III) sensor connector; (D) final assembly of the connector; (E′,E″) photos of the connector. Scheme of the procedure for the (F) 3D-printing and (G) DMF chemical treatment performed on the working, counter, and reference electrodes based on PLA and graphene (G-PLA); (H) ready-to-use sensor; (I) coupled to the 3D-printed connector for the voltammetric determination of epinephrine; and (J) photos of the sensor.

Figure 2.
SEM images obtained for (A) untreated and (B) DMF-treated G-PLA electrode surface with 2000× magnification. Image of the contact angle measurements obtained for (C) untreated and (D) treated G-PLA electrodes. (E) XRD and (F) FTIR spectra obtained for untreated (black) and treated (red) G-PLA electrodes.

Figure 3.
(A) Cyclic voltammograms obtained in G-PLA before (black line) and after surface treatment with DMF (red line) for a 1.0 mmol L−1 FcMeOH solution, and respective blank solutions (0.1 mol L−1 phosphate buffer (pH 7)—dotted lines); and (B) cyclic voltammograms obtained in the presence of 1.0 mmol L−1 FcMeOH at different scan rates (50 to 250 mV s−1) for the additive manufacturing electrode treated with DMF. Inset: Correlation between the anodic peak currents and the square root of the scan rate (v 1/2).

Figure 4.
(A) Cyclic voltammograms in the absence (blue line) and presence (black line—scan 1; green line—scan 2) of 100.0 µmol L−1 of epinephrine by using the additive manufacture G-PLA electrode. Supporting electrolyte: 0.1 mol L−1 phosphate buffer (pH 7). Scan rate: 30 mV s−1; Inset: zoom, cyclic voltammograms of 10.0 µmol L−1 of epinephrine. (B) Proposed mechanism for epinephrine redox reaction. (C) Voltammograms obtained by DPV (black line) and SWV (red line) in the absence (dashed lines) and presence (solid lines) of 0.1 mmol L−1 epinephrine. DPV experimental conditions—modulation amplitude: 25 mV; modulation time: 0.05 s; scan rate: 30 mV s−1. SWV experimental conditions—modulation amplitude: 20 mV; step potential: 5 mV; frequency: 6 Hz. Supporting electrolyte: 0.1 mol L−1 phosphate buffer (pH 7).

Figure 5.
(A) SWV voltammograms for increasing epinephrine concentrations (4.0, 6.0, 8.0, 10, 20, 40, 60, and 100 µmol L−1) and (B) the respective analytical curve (n = 3). Experimental conditions— step potential: 6 mV; modulation amplitude: 60 mV; frequency: 30 Hz. Supporting electrolyte: 0.1 mol L−1 phosphate buffer (pH 7.0).


Table 1.
Determination of epinephrine in fortified human serum samples by using the chemically treated additive manufacturing G-PLA sensor.
Table 1.
Determination of epinephrine in fortified human serum samples by using the chemically treated additive manufacturing G-PLA sensor.
| Experiment | Fortified (µmol L−1) | Found (µmol L−1) | Recovery (%) |
|---|---|---|---|
| 1 | 8.00 | 8.18 ± 1.6 | 102 |
| 2 | 10.0 | 10.1 ± 1.6 | 101 |
| 3 | 20.0 | 19.5 ± 2.0 | 97.6 |
| 4 | 40.0 | 38.7 ± 1.9 | 96.9 |
Table 2.
Comparison of the analytical performance obtained for different electrochemical sensors for the determination of epinephrine.
Table 2.
Comparison of the analytical performance obtained for different electrochemical sensors for the determination of epinephrine.
| Sensor | Linear Range (μmol L−1) | LOD (μmol L−1) | Ref. |
|---|---|---|---|
| GR/Au/GCE | 0.0500 to 8.000 | 0.007 | [53] |
| GNRs | 6.40 to 100 | 2.1 | [44] |
| PBCB/graphene/GCE | 1.00 to 1000 | 0.24 | [52] |
| Carbon black | 5.00 to 40.0 | 0.61 | [46] |
| ZnO/MWCNTs/GCE | 0.200 to 2.50 | 0.016 | [43] |
| Ox-PAP/GCE | 0.0100 to 80.0 | 0.0065 | [48] |
| GCE/CQDs/CuO | 10 to 100 | 15.99 | [54] |
| AuNPs/PDA/AN | 1.00 to 1000 | 0.26 | [55] |
| G-PLA | 4.00 to 80.0 | 0.23 | This work |
GR/Au/GCE—Graphene/gold nanoparticle/glassy carbon electrode; GNRs—Graphene nanoribbons; PBCB/graphene/GCE—Poly (brilliant cresyl blue)/graphene/glassy carbon electrode; ZnO/MWCNTs/GCE—ZnO nanoparticle/multi-walled carbon nanotube/glassy carbon electrode; Ox-PAP/GCE—Over oxidized poly(p-aminophenol)/glassy carbon electrode; GCE/CQDs/CuO—Glassy carbon electrode/carbon Quantum dots/copper oxide; AuNPs/PDA/AN—Gold nanoparticle/polydopamine-modified/acupuncture needle.
Disclaimer/Publisher’s Note: The statements, opinions and data contained in all publications are solely those of the individual author(s) and contributor(s) and not of MDPI and/or the editor(s). MDPI and/or the editor(s) disclaim responsibility for any injury to people or property resulting from any ideas, methods, instructions or products referred to in the content. |
© 2023 by the authors. Licensee MDPI, Basel, Switzerland. This article is an open access article distributed under the terms and conditions of the Creative Commons Attribution (CC BY) license (https://creativecommons.org/licenses/by/4.0/).
Share and Cite
MDPI and ACS Style
da Silva, V.A.O.P.; Stefano, J.S.; Kalinke, C.; Bonacin, J.A.; Janegitz, B.C. Additive Manufacturing Sensor for Stress Biomarker Detection. Chemosensors 2023, 11, 306. https://doi.org/10.3390/chemosensors11050306
AMA Style
da Silva VAOP, Stefano JS, Kalinke C, Bonacin JA, Janegitz BC. Additive Manufacturing Sensor for Stress Biomarker Detection. Chemosensors. 2023; 11(5):306. https://doi.org/10.3390/chemosensors11050306
Chicago/Turabian Styleda Silva, Vinicius A. O. P., Jéssica S. Stefano, Cristiane Kalinke, Juliano A. Bonacin, and Bruno C. Janegitz. 2023. "Additive Manufacturing Sensor for Stress Biomarker Detection" Chemosensors 11, no. 5: 306. https://doi.org/10.3390/chemosensors11050306
Note that from the first issue of 2016, this journal uses article numbers instead of page numbers. See further details here.