
Printable and Flexible Iridium Oxide-Based pH Sensor by a Roll-to-Roll Process


Abstract
:1. Introduction
2. Materials and Methods
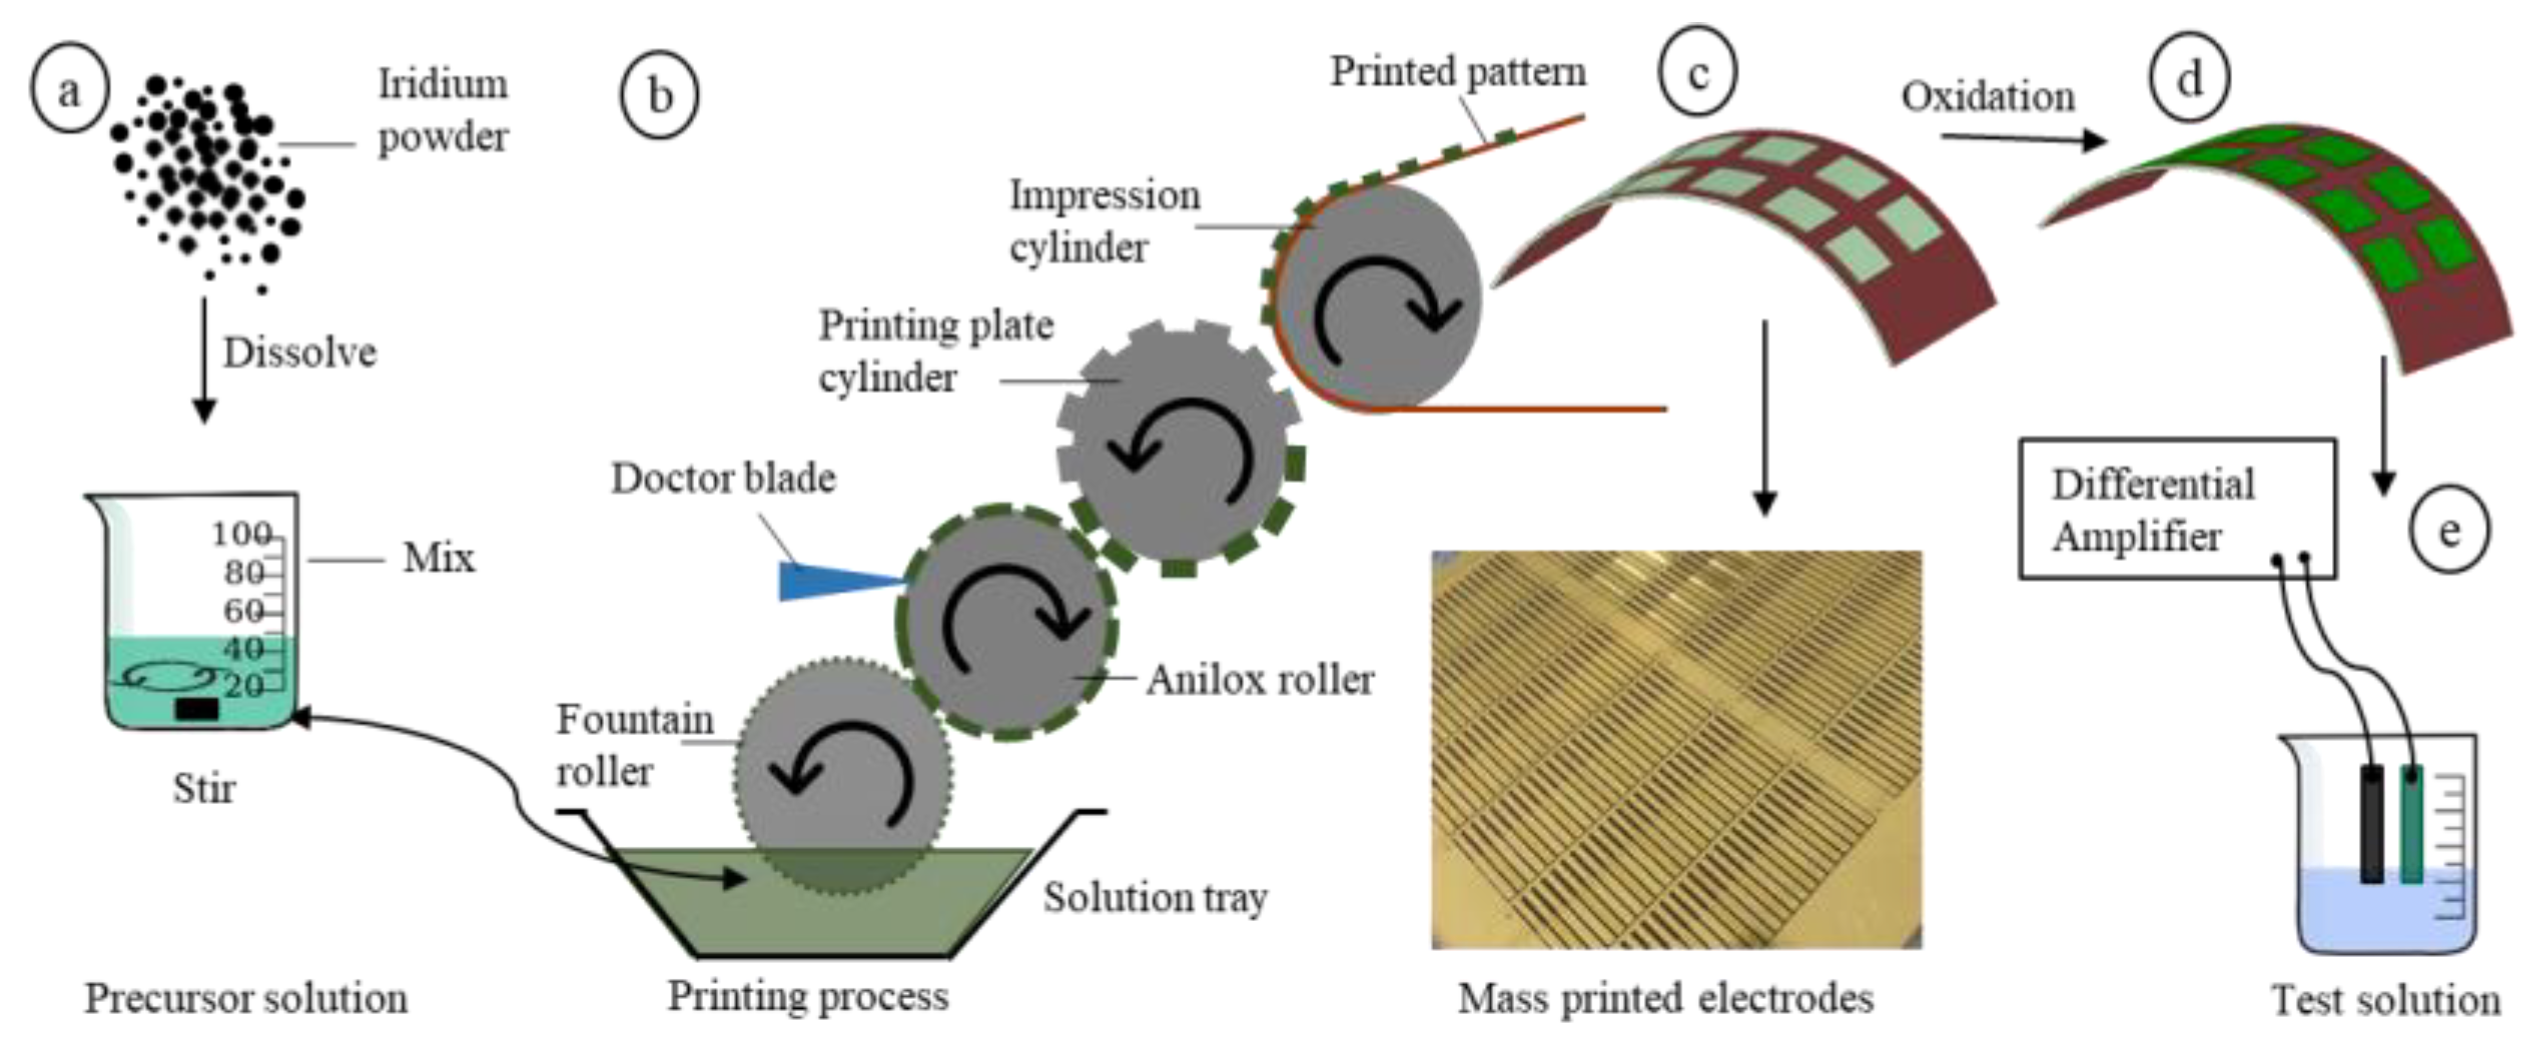
2.1. Roll-to-Roll Printing
2.2. Materials and Tools
3. Results and Discussion
3.1. Performance of the Polyimide-Based Working Electrode
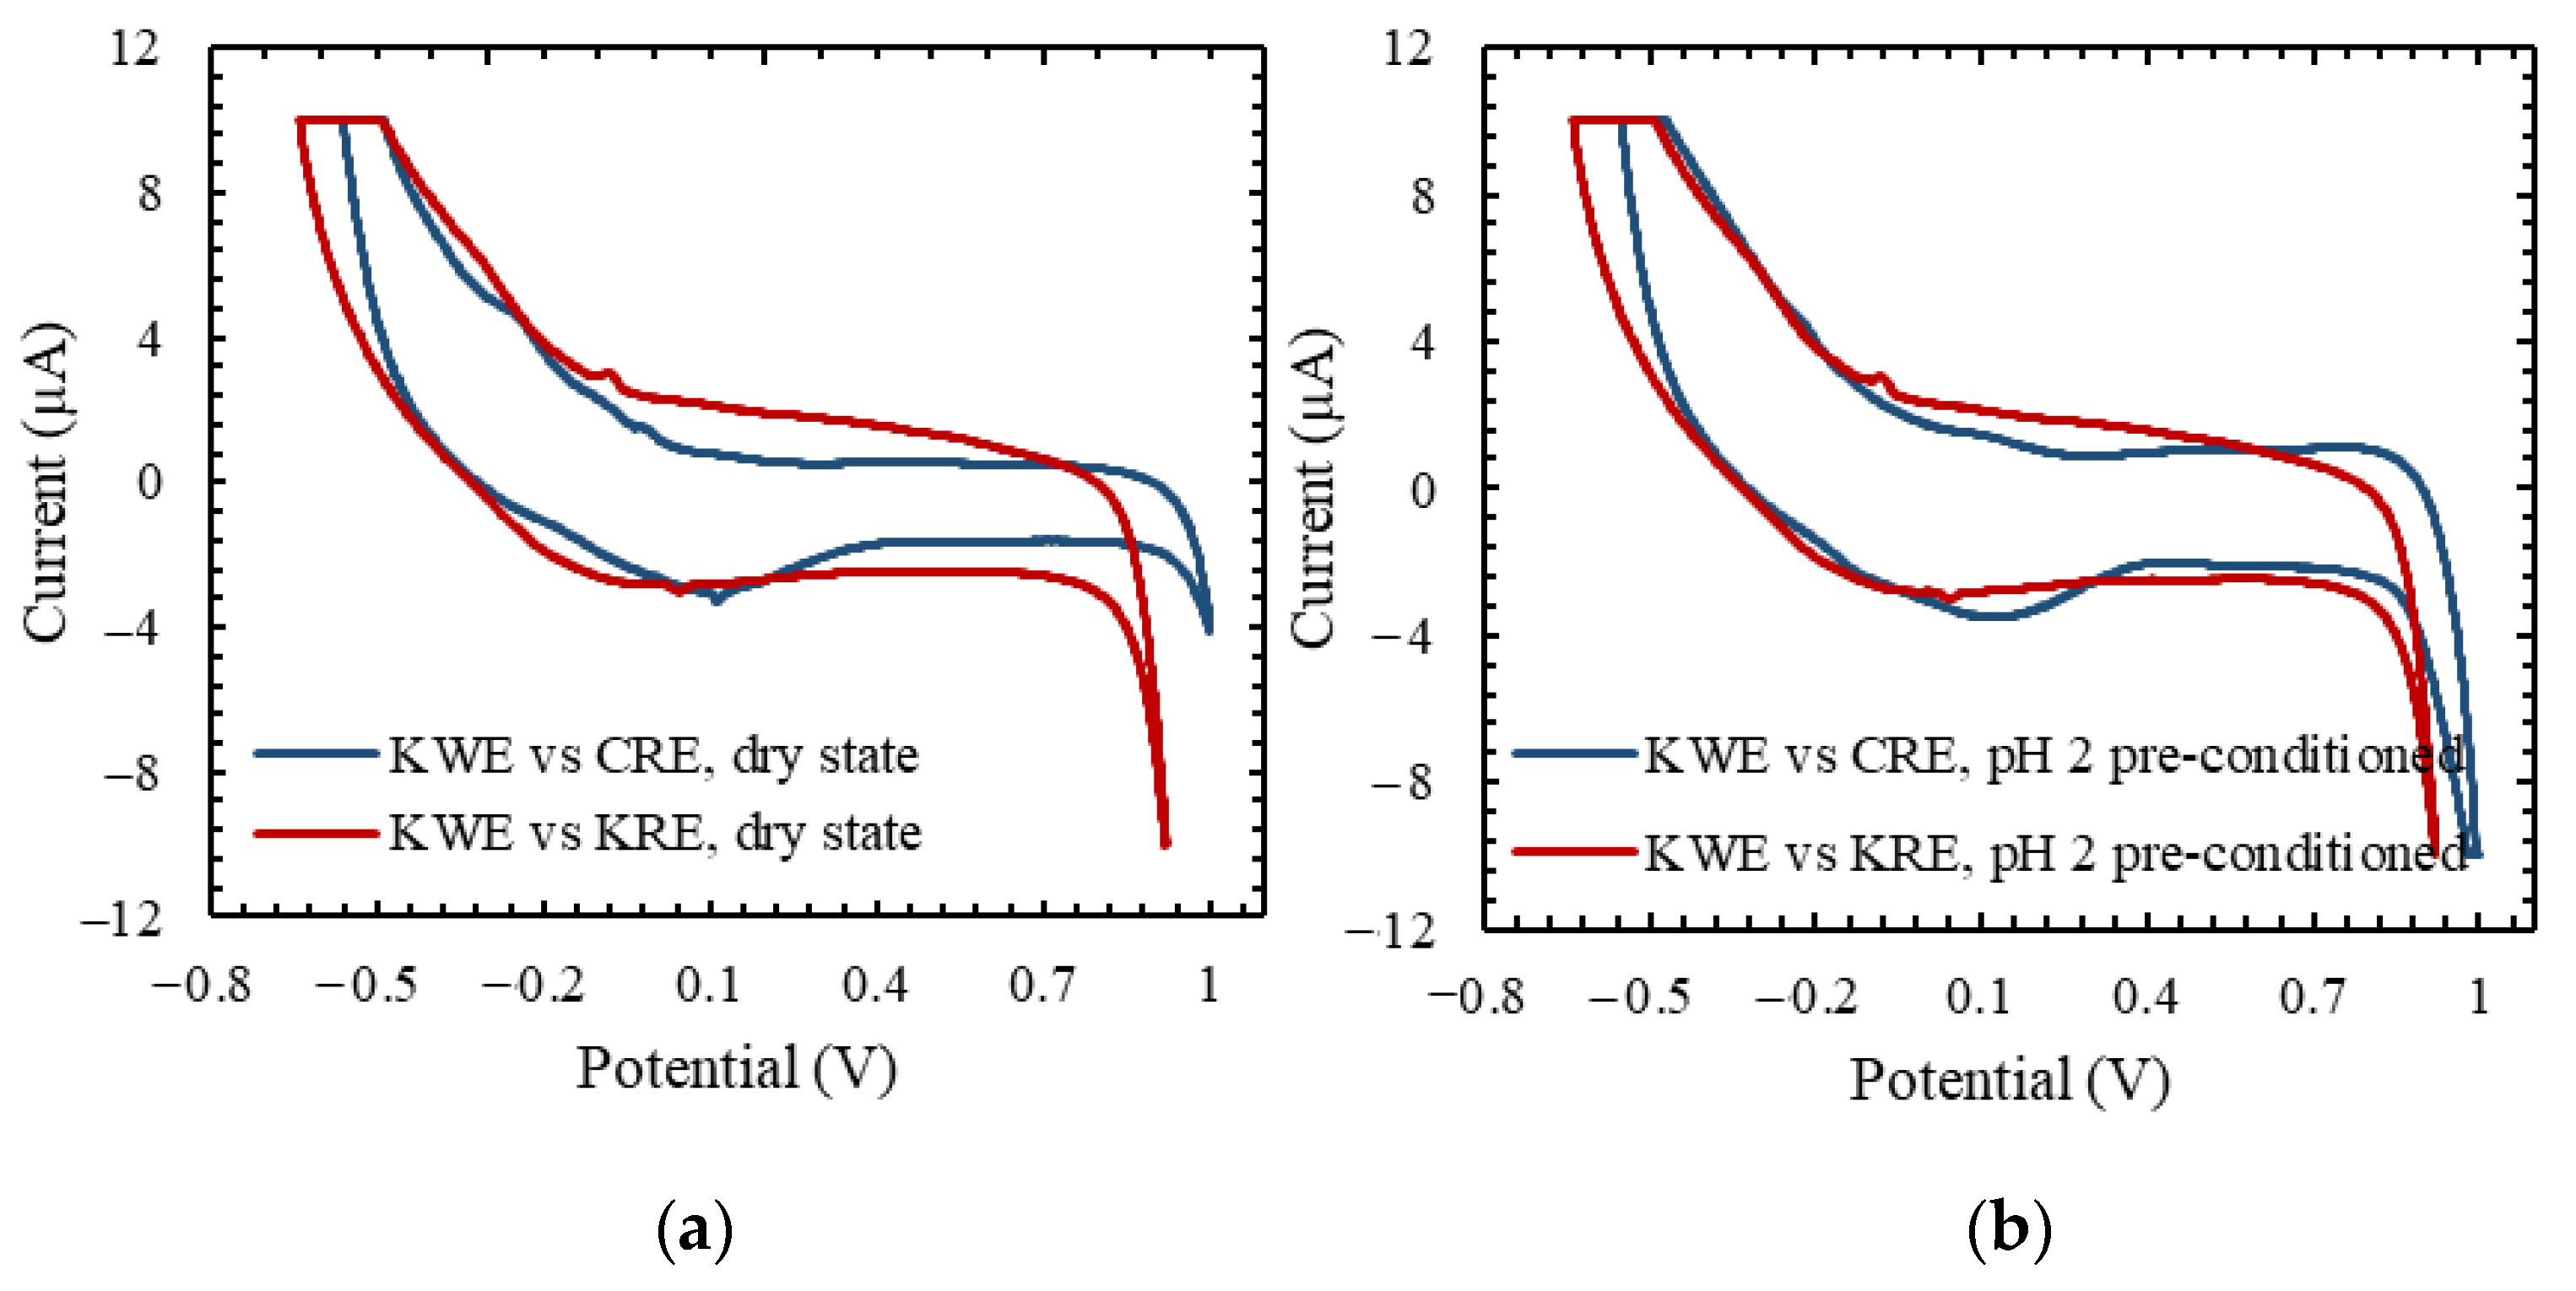
3.2. Cyclic Voltammetry Analysis
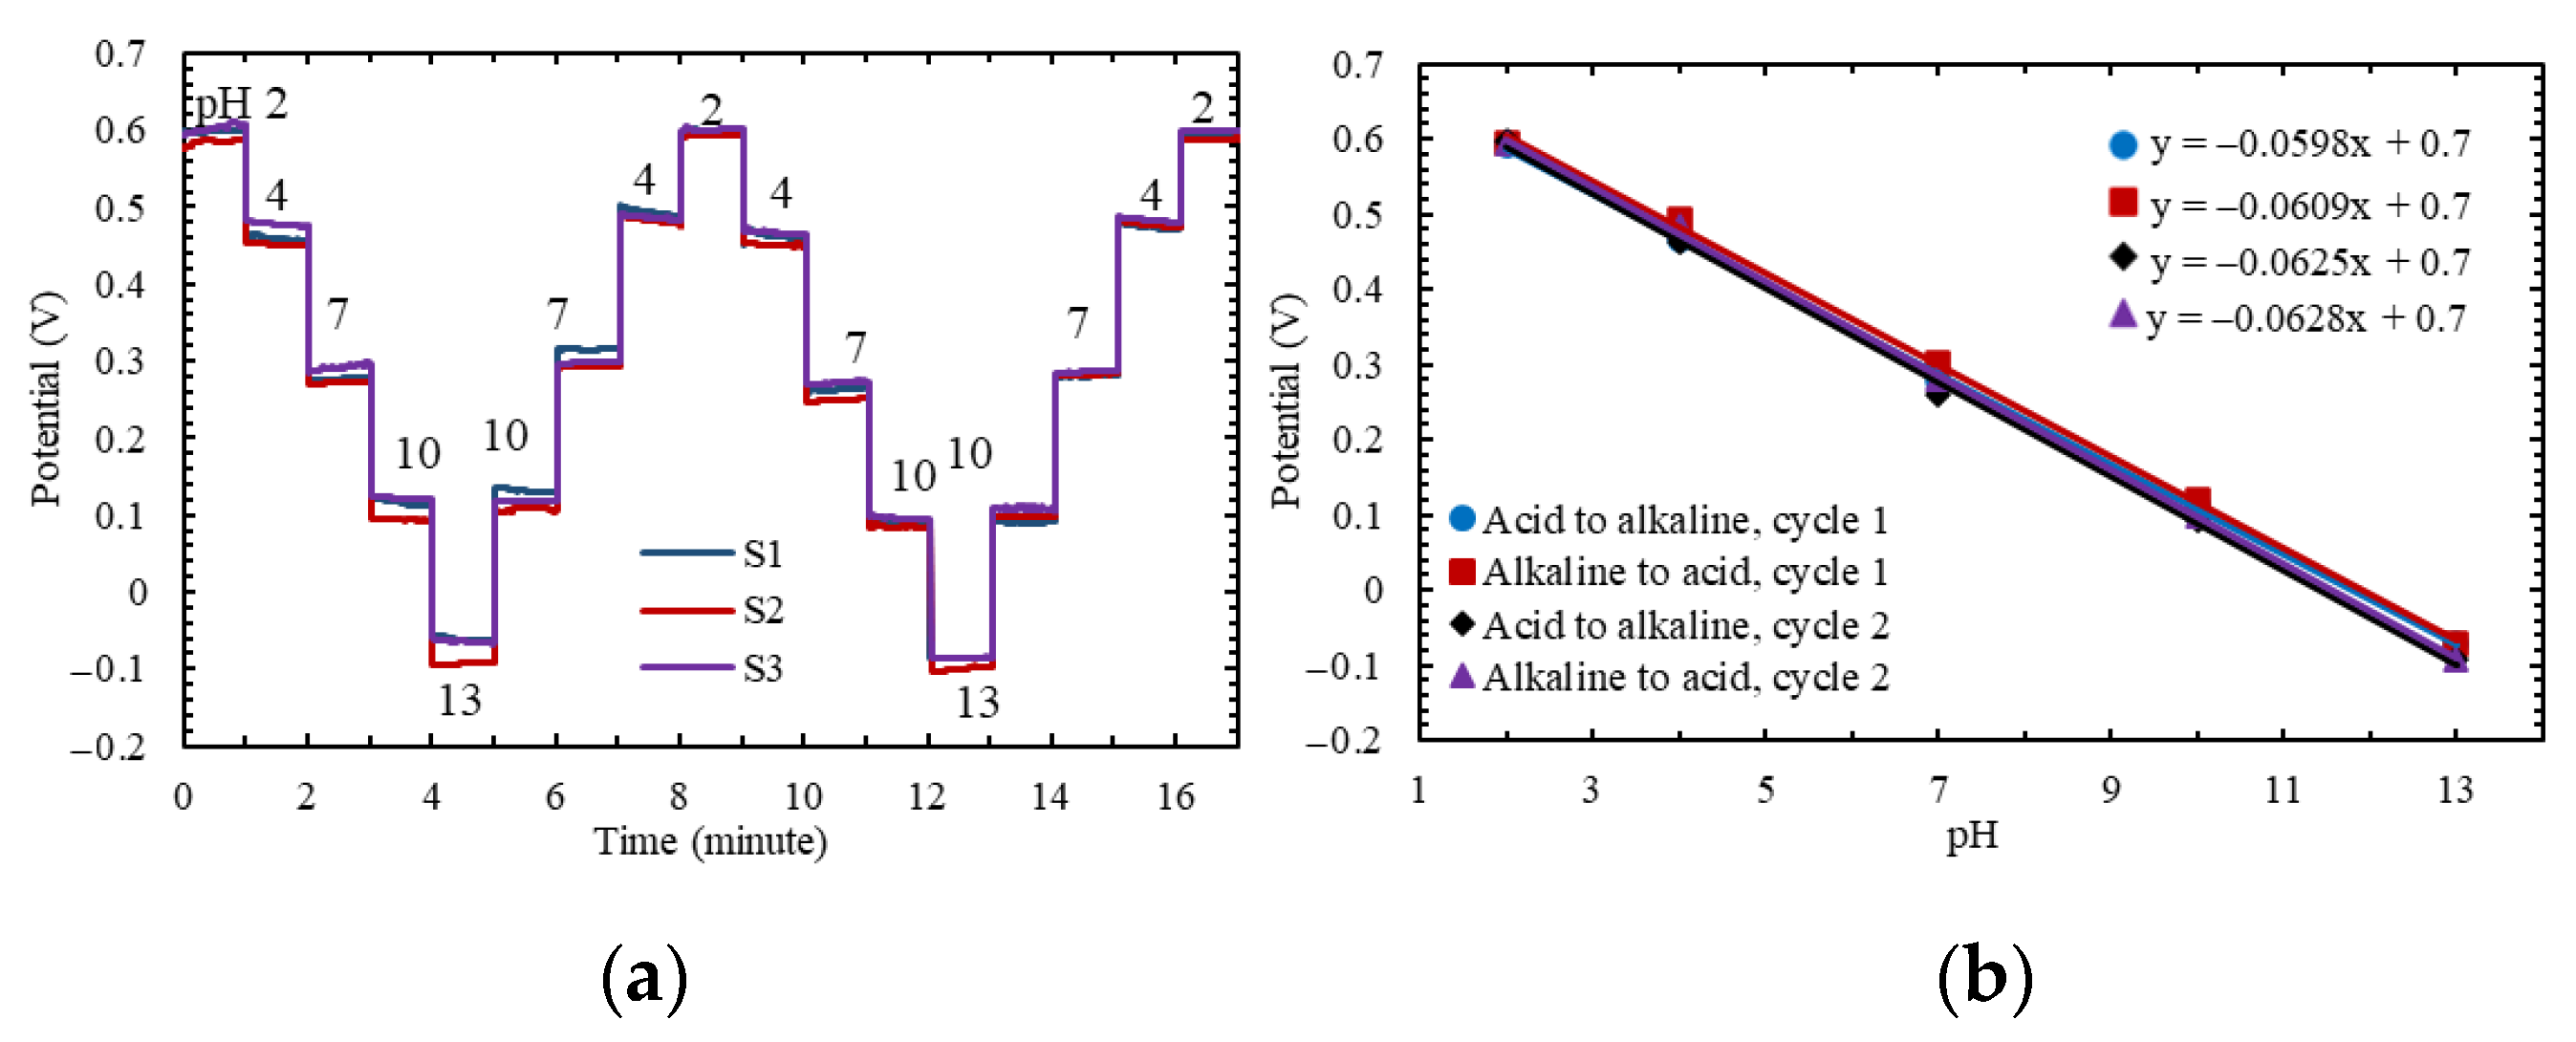
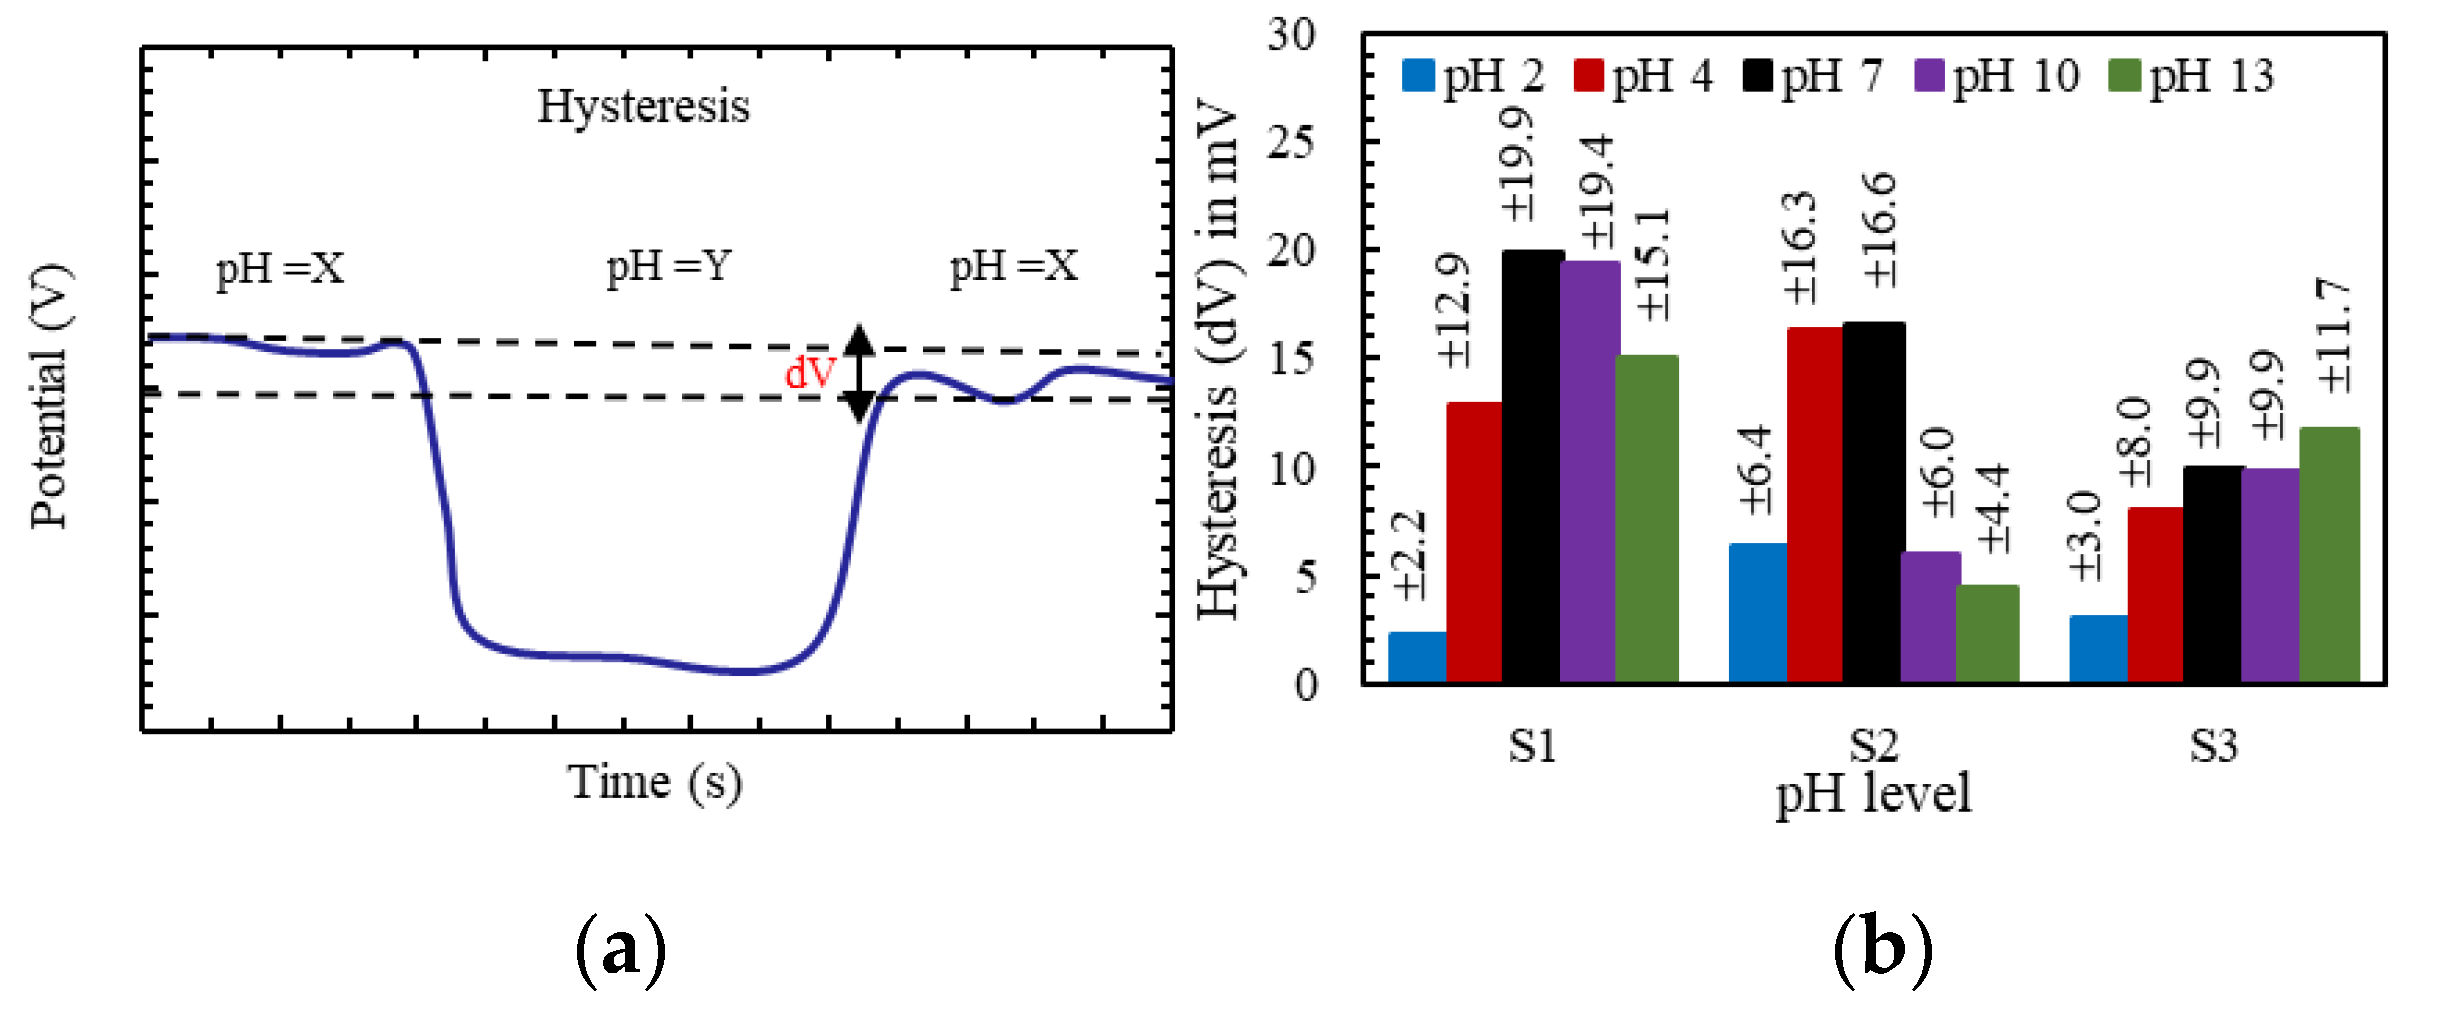
3.3. Analytical Characterization of KWE vs. KRE
3.4. Selectivity to Cationic Interference
3.5. Effect of Temperature
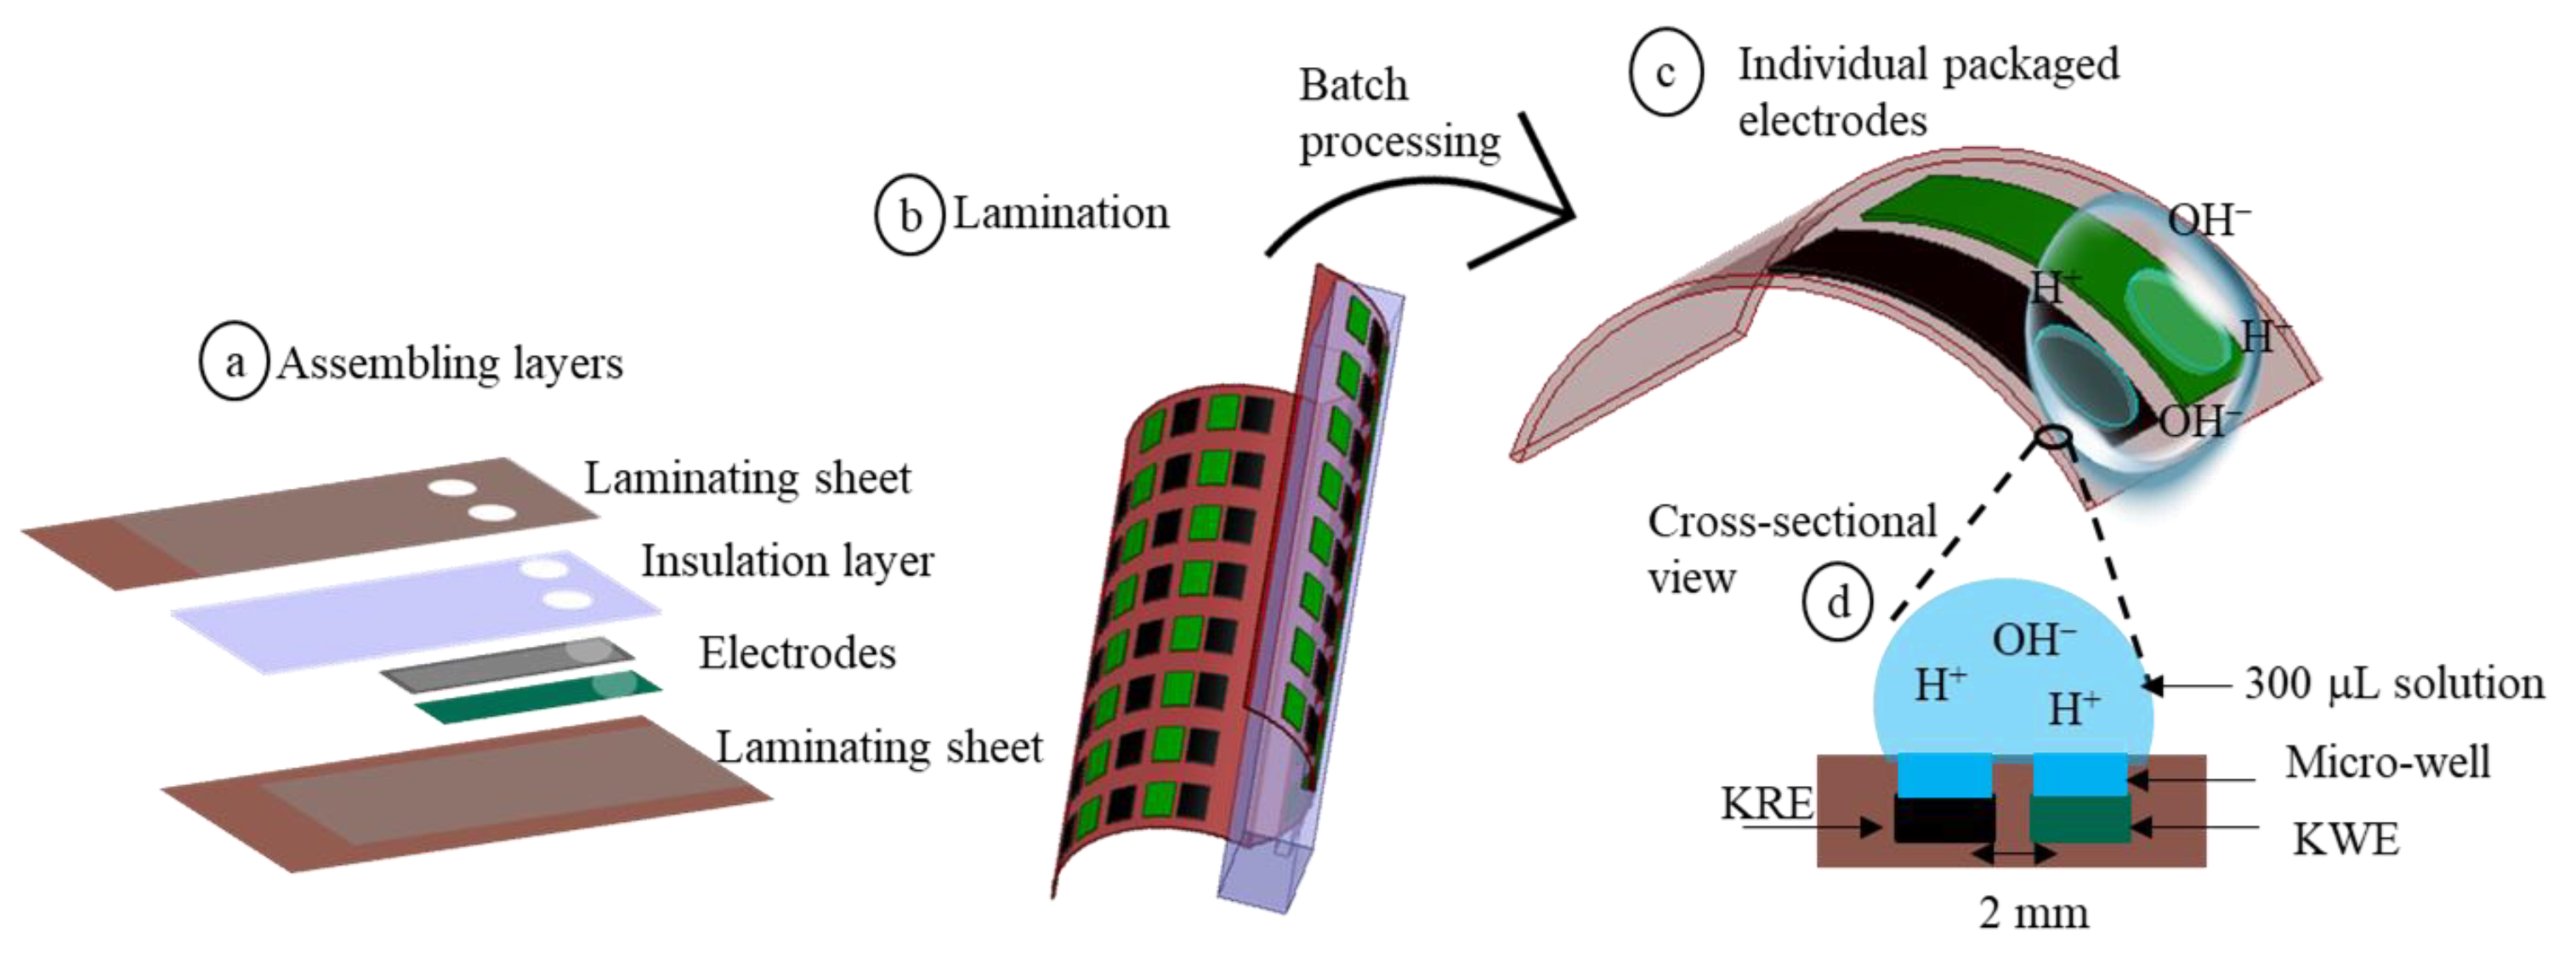
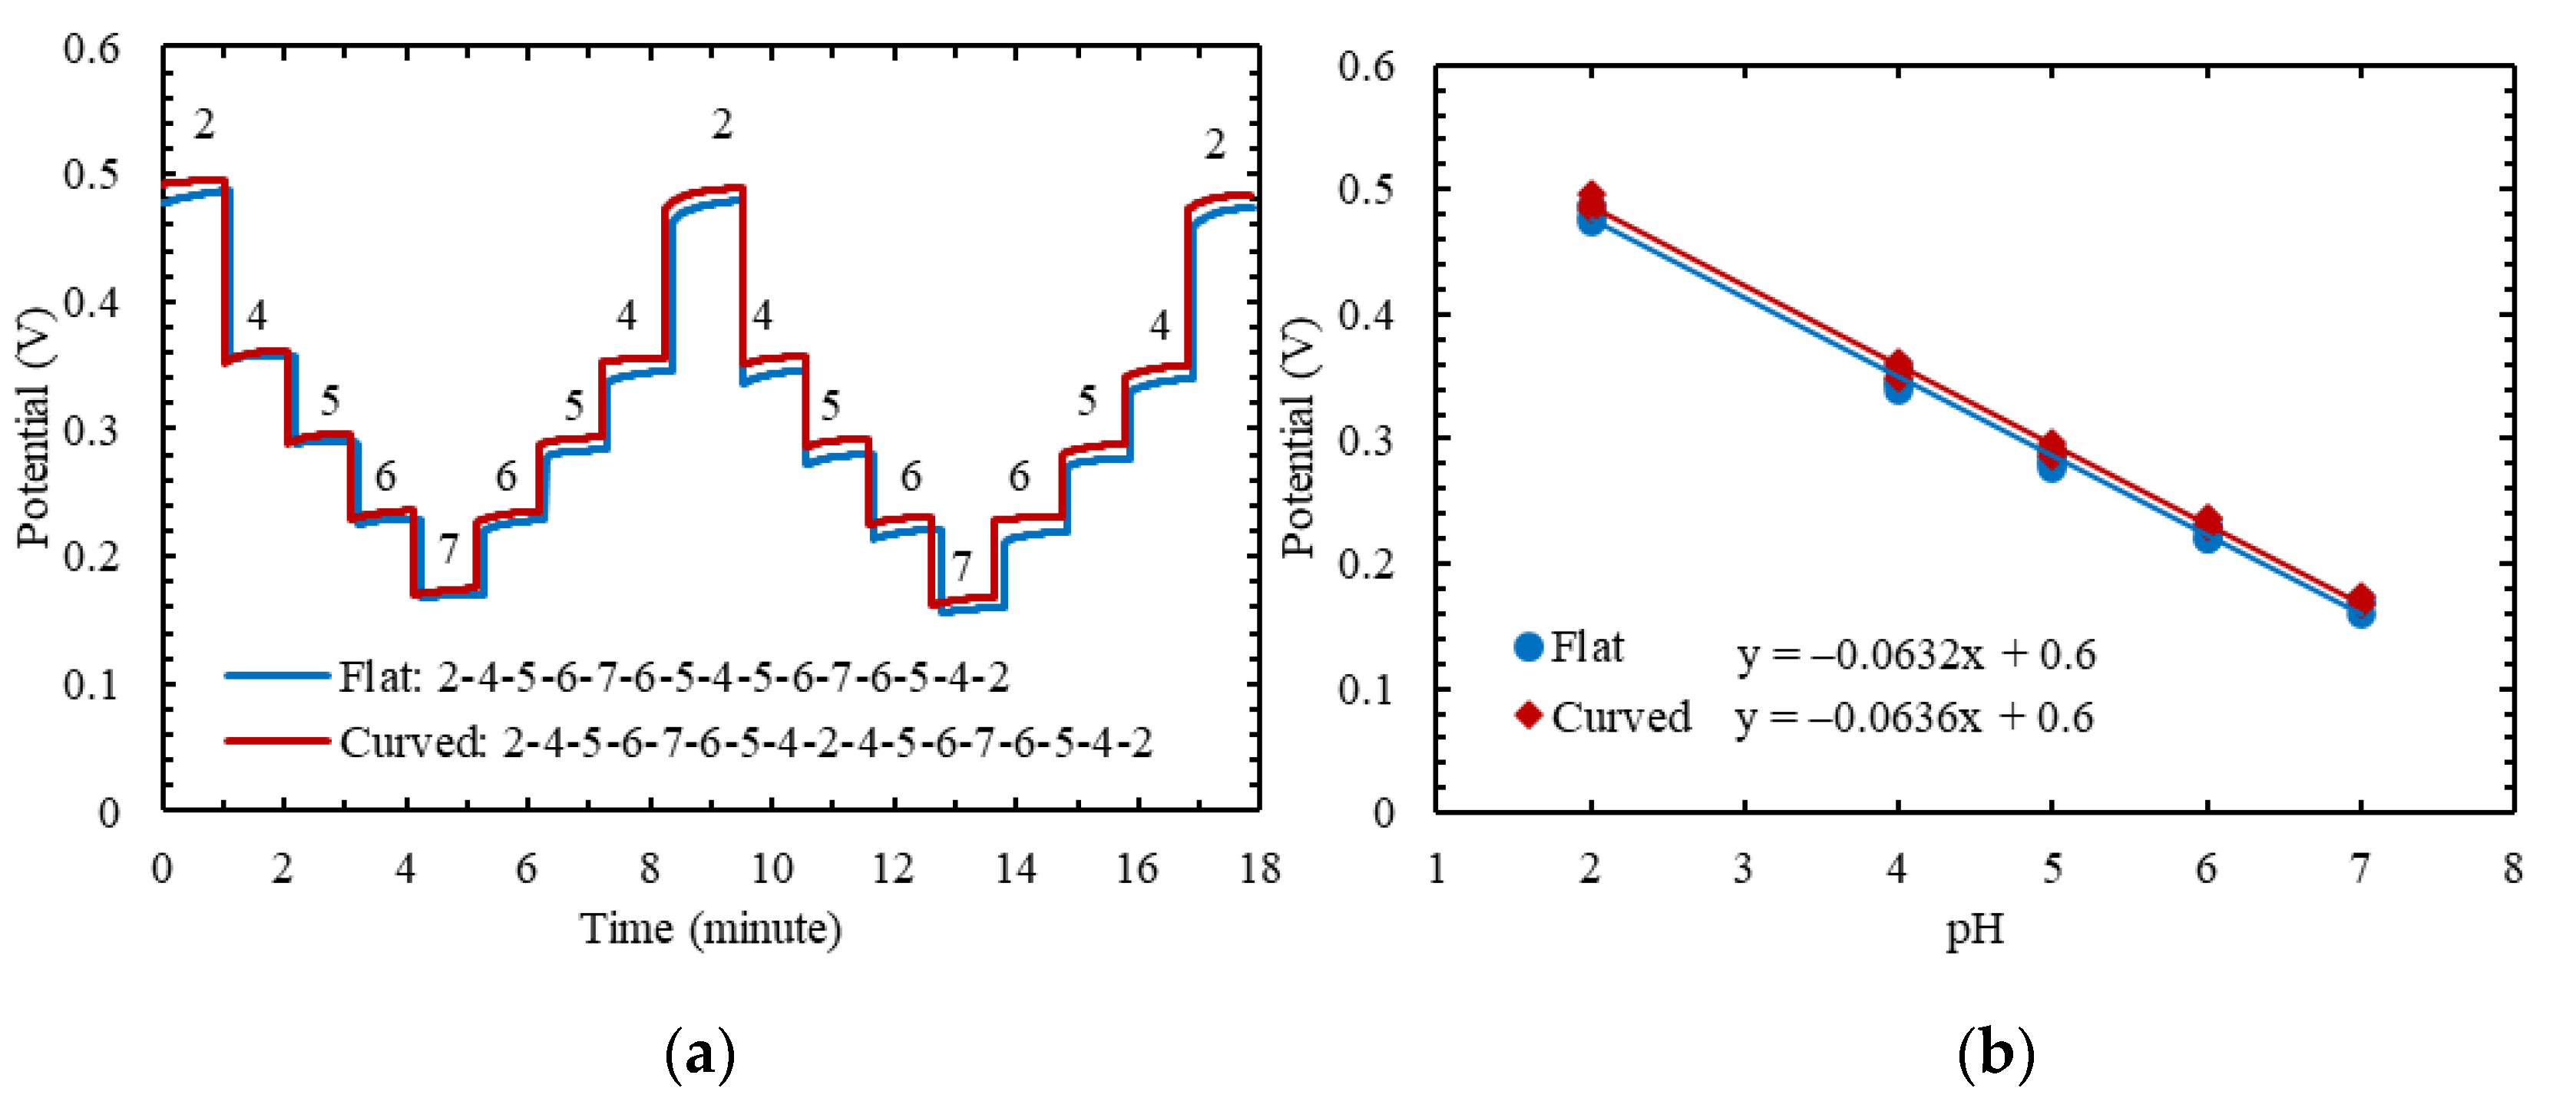
3.6. Laminated Electrodes
4. Conclusions
Author Contributions
Funding
Institutional Review Board Statement
Informed Consent Statement
Data Availability Statement
Acknowledgments
Conflicts of Interest
References
- Palavesam, N.; Marin, S.; Hemmetzberger, D.; Landesberger, C.; Bock, K.; Kutter, C. Roll-to-roll processing of film substrates for hybrid integrated flexible electronics. Flex. Print. Electron. 2018, 3, 014002. [Google Scholar] [CrossRef]
- Machui, F.; Hösel, M.; Li, N.; Spyropoulos, G.D.; Ameri, T.; Søndergaard, R.R.; Jørgensen, M.; Scheel, A.; Gaiser, D.; Kreul, K. Cost analysis of roll-to-roll fabricated ITO free single and tandem organic solar modules based on data from manufacture. Energy Environ. Sci. 2014, 7, 2792–2802. [Google Scholar] [CrossRef]
- Smolka, M.; Ruttloff, S.; Nees, D.; Prietl, C.; Satzinger, V.; Lamprecht, B.; Hütter, P.; Hesse, J.; Kokkinis, G.; Kriechhammer, G. High throughput roll-to-roll production of microfluidic chips. Proceedings 2018, 2, 1054. [Google Scholar]
- Søndergaard, R.R.; Hösel, M.; Krebs, F.C. Roll-to-Roll Fabrication of Large Area Functional Organic Materials. J. Polym. Sci. Part B Polym. Phys. 2013, 51, 16–34. [Google Scholar] [CrossRef]
- Cagnani, G.R.; Ibáñez-Redín, G.; Tirich, B.; Gonçalves, D.; Balogh, D.T.; Oliveira, O.N. Fully-Printed Electrochemical Sensors Made With Flexible Screen-Printed Electrodes Modified by Roll-To-Roll Slot-Die Coating. Biosens. Bioelectron. 2020, 165, 112428. [Google Scholar] [CrossRef]
- Bariya, M.; Shahpar, Z.; Park, H.; Sun, J.; Jung, Y.; Gao, W.; Nyein, H.Y.Y.; Liaw, T.S.; Tai, L.; Ngo, Q.P. Roll-to-roll gravure printed electrochemical sensors for wearable and medical devices. ACS Nano 2018, 12, 6978–6987. [Google Scholar] [CrossRef] [PubMed]
- Keränen, K.; Korhonen, P.; Happonen, T.; Paakkolanvaara, M.; Kangas, J.; Rönkä, K. High throughput R2R printing, testing and assembly processing of flexible RGB LED displays. In Proceedings of the 2018 7th Electronic System-Integration Technology Conference (ESTC), Dresden, Germany, 18–21 September 2018. [Google Scholar]
- Corletto, A.; Hosseinmardi, A.; Annamalai, P.K.; Martin, D.J.; Shapter, J.G. High-Resolution R2R-Compatible Printing of Carbon Nanotube Conductive Patterns Enabled by Cellulose Nanocrystals. ACS Appl. Nano Mater. 2022, 5, 1574–1587. [Google Scholar] [CrossRef]
- Kooy, N.; Mohamed, K.; Pin, L.T.; Guan, O.S. A Review of Roll-To-Roll Nanoimprint Lithography. Nanoscale Res. Lett. 2014, 9, 1–13. [Google Scholar] [CrossRef]
- Toren, P.; Rumpler, M.; Smolka, M.; Haase, A.; Ruttloff, S.; Nees, D.; Stadlober, B.; Katzmayr, I.; Hierschlager, B.; Kierstein, S. High-throughput Roll-to-roll Production of Bio-functionalized Polymer Components. Eur. J. Mater. Sci. Eng. 2020, 5, 11–16. [Google Scholar] [CrossRef]
- Vig, A.L.; Mäkelä, T.; Majander, P.; Lambertini, V.; Ahopelto, J.; Kristensen, A. Roll-to-roll fabricated lab-on-a-chip devices. J. Micromech. Microengineering 2011, 21, 035006. [Google Scholar] [CrossRef]
- Habermehl, A.; Strobel, N.; Eckstein, R.; Bolse, N.; Mertens, A.; Hernandez-Sosa, G.; Eschenbaum, C.; Lemmer, U. Lab-on-chip, surface-enhanced Raman analysis by aerosol jet printing and roll-to-roll hot embossing. Sensors 2017, 17, 2401. [Google Scholar] [CrossRef] [PubMed]
- Global SMT&Packaging Electronics Manufacturing Technologies. Available online: https://globalsmtasia.com/flexible-electronic-devices-with-roll-to-roll-overmolding-technology/ (accessed on 10 February 2023).
- Krebs, F.C.; Gevorgyan, S.A.; Alstrup, J. A Roll-to-roll Process to Flexible Polymer Solar Cells: Model Studies, Manufacture and Operational Stability Studies. J. Mater. Chem. 2009, 19, 5442–5451. [Google Scholar] [CrossRef]
- Steenberg, T.; Hjuler, H.A.; Terkelsen, C.; Sánchez, M.T.; Cleemann, L.N.; Krebs, F.C. Roll-to-roll coated PBI membranes for high temperature PEM fuel cells. Energy Environ. Sci. 2012, 5, 6076–6080. [Google Scholar] [CrossRef]
- Mauger, S.A.; Neyerlin, K.C.; Yang-Neyerlin, A.C.; More, K.L.; Ulsh, M. Gravure coating for roll-to-roll manufacturing of proton-exchange-membrane fuel cell catalyst layers. J. Electrochem. Soc. 2018, 165, F1012. [Google Scholar] [CrossRef]
- Søndergaard, R.; Hösel, M.; Angmo, D.; Larsen-Olsen, T.T.; Krebs, F.C. Roll-to-roll fabrication of polymer solar cells. Mater. Today 2012, 15, 36–49. [Google Scholar] [CrossRef]
- Subramanian, V.; Fréchet, J.M.; Chang, P.C.; Huang, D.C.; Lee, J.B.; Molesa, S.E.; Murphy, A.R.; Redinger, D.R.; Volkman, S.K. Progress toward development of all-printed RFID tags: Materials, processes, and devices. Proc. IEEE 2005, 93, 1330–1338. [Google Scholar] [CrossRef]
- Wang, Y.; Huang, Y.; Li, Y.; Cheng, P.; Cheng, S.; Liang, Q.; Xu, Z.; Chen, H.; Feng, Z. A facile process combined with roll-to-roll flexographic printing and electroless deposition to fabricate RFID tag antenna on paper substrates. Compos. Part B Eng. 2021, 224, 109194. [Google Scholar] [CrossRef]
- Dumond, J.J.; Yee Low, H. Recent developments and design challenges in continuous roller micro-and nanoimprinting. J. Vac. Sci. Technol. B Nanotechnol. Microelectron. Mater. Process. Meas. Phenom. 2012, 30, 010801. [Google Scholar] [CrossRef]
- Ahn, S.H.; Guo, L.J. Large-area roll-to-roll and roll-to-plate nanoimprint lithography: A step toward high-throughput application of continuous nanoimprinting. ACS Nano 2009, 3, 2304–2310. [Google Scholar] [CrossRef]
- Liedert, C.; Rannaste, L.; Kokkonen, A.; Huttunen, O.; Liedert, R.; Hiltunen, J.; Hakalahti, L. Roll-to-roll manufacturing of integrated immunodetection sensors. ACS Sens. 2020, 5, 2010–2017. [Google Scholar] [CrossRef]
- Fung, C.M.; Lloyd, J.S.; Samavat, S.; Deganello, D.; Teng, K.S. Facile fabrication of electrochemical ZnO nanowire glucose biosensor using roll to roll printing technique. Sens. Actuators B Chem. 2017, 247, 807–813. [Google Scholar] [CrossRef]
- Chekol, F.; Mehretie, S.; Hailu, F.A.; Tolcha, T.; Megersa, N.; Admassie, S. Roll-to-Roll printed PEDOT/PSS/GO Plastic Film for Electrochemical Determination of Carbofuran. Electroanalysis 2019, 31, 1104–1111. [Google Scholar] [CrossRef]
- Martín, A.; Kim, J.; Kurniawan, J.F.; Sempionatto, J.R.; Moreto, J.R.; Tang, G.; Campbell, A.S.; Shin, A.; Lee, M.Y.; Liu, X. Epidermal microfluidic electrochemical detection system: Enhanced sweat sampling and metabolite detection. ACS Sens. 2017, 2, 1860–1868. [Google Scholar] [CrossRef] [PubMed]
- Katseli, V.; Economou, A.; Kokkinos, C. Smartphone-addressable 3D-printed electrochemical ring for nonenzymatic self-monitoring of glucose in human sweat. Anal. Chem. 2021, 93, 3331–3336. [Google Scholar] [CrossRef] [PubMed]
- Simoska, O.; Duay, J.; Stevenson, K.J. Electrochemical detection of Multianalyte biomarkers in wound healing efficacy. ACS Sens. 2020, 5, 3547–3557. [Google Scholar] [CrossRef] [PubMed]
- Zheng, X.; Hu, Q.; Wang, Z.; Nie, W.; Wang, P.; Li, C. Roll-to-roll layer-by-layer assembly bark-shaped carbon nanotube/Ti3C2Tx MXene textiles for wearable electronics. J. Colloid Interface Sci. 2021, 602, 680–688. [Google Scholar] [CrossRef]
- Hempel, M.; Lu, A.; Hui, F.; Kpulun, T.; Lanza, M.; Harris, G.; Palacios, T.; Kong, J. Repeated roll-to-roll transfer of two-dimensional materials by electrochemical delamination. Nanoscale 2018, 10, 5522–5531. [Google Scholar] [CrossRef]
- Balliu, E.; Andersson, H.; Engholm, M.; Öhlund, T.; Nilsson, H.; Olin, H. Selective laser sintering of inkjet-printed silver nanoparticle inks on paper substrates to achieve highly conductive patterns. Sci. Rep. 2018, 8, 10408. [Google Scholar] [CrossRef]
- Wolf, F.M.; Perelaer, J.; Stumpf, S.; Bollen, D.; Kriebel, F.; Schubert, U.S. Rapid low-pressure plasma sintering of inkjet-printed silver nanoparticles for RFID antennas. J. Mater. Res. 2013, 28, 1254–1261. [Google Scholar] [CrossRef]
- Schroder, K.A.; Rawson, I.M.; Pope, D.S.; Farnsworth, S. Photonic curing explanation and application to printing copper traces on low temperature substrates. In International Symposium on Microelectronics; International Microelectronics Assembly and Packaging Society: San Diego, CA, USA, 2011. [Google Scholar]
- Das, S.; Cormier, D.; Williams, S. Potential for multi-functional additive manufacturing using pulsed photonic sintering. Procedia Manuf. 2015, 1, 366–377. [Google Scholar] [CrossRef]
- Chou, S.; Sun, B.; Fan, T.; Chiang, Y.; Chiao, J.-C.; Wu, P. Fabrication of biocompatible and conductive polypropylene micromembrane as a soft and porous electrode. J. Taiwan Inst. Chem. Eng. 2021, 129, 381–388. [Google Scholar] [CrossRef]
- Chou, S.; Sun, B.; Cheang, W.; Tso, K.; Fan, T.; Chiao, J.-C.; Wu, P. A flexible bioelectrode based on IrO2–coated metallized polypropylene micromembrane. Ceram. Int. 2021, 47, 32554–32561. [Google Scholar] [CrossRef]
- Chou, S.; Hsieh, Y.; Cheang, W.; Sun, B.; Chu, C.; Chen, S.; Chiao, J.-C.; Wu, P. A flexible IrO2 membrane for pH sensing. Sci. Rep. 2022, 12, 11712. [Google Scholar] [CrossRef] [PubMed]
- Dong, Q.; Sun, X.; He, S. Iridium Oxide Enabled Sensors Applications. Catalysts 2021, 11, 1164. [Google Scholar] [CrossRef]
- Kassanos, P.; Seichepine, F.; Wales, D.; Yang, G. Towards a flexible/stretchable multiparametric sensing device for surgical and wearable applications. In Proceedings of the IEEE Biomedical Circuits and Systems Conference (BioCAS), Nara, Japan, 17–19 October 2019. [Google Scholar]
- Teymourian, H.; Tehrani, F.; Mahato, K.; Wang, J. Lab under the skin: Microneedle based wearable devices. Adv. Healthc. Mater. 2021, 10, 2002255. [Google Scholar] [CrossRef] [PubMed]
- Huang, F.; Jin, Y.; Wen, L.; Mu, D.; Cui, M. Effects of thermal oxidation cycle numbers and hydration on IrOx pH sensor. J. Electrochem. Soc. 2013, 160, B184. [Google Scholar] [CrossRef]
- Bahrami, H.; Mirbozorgi, S.A.; Ameli, R.; Rusch, L.A.; Gosselin, B. Flexible, polarization-diverse UWB antennas for implantable neural recording systems. IEEE Trans. Biomed. Circuits Syst. 2015, 10, 38–48. [Google Scholar] [CrossRef]
- Shamma-Donoghue, S.A.; May, G.A.; Cotter, N.E.; White, R.L.; Simmons, F.B. Thin-film multielectrode arrays for a cochlear prosthesis. IEEE Trans. Electron Devices 1982, 29, 136–144. [Google Scholar] [CrossRef]
- Kreider, K. Iridium Oxide Thin-Film Stability in High-temperature Corrosive Solutions. Sens. Actuators B Chem. 1991, 5, 165–169. [Google Scholar] [CrossRef]
- Fox, G.R.; Sun, S.; Takamatsu, T. Properties of reactively sputtered IrOx for PZT electrode applications. Integr. Ferroelectr. 2000, 31, 47–56. [Google Scholar] [CrossRef]
- Wilson, A.A.; Graziano, M.B.; Leff, A.C.; Hanrahan, B.; Baker, D.R.; Rivas, M.; Sánchez, B.; Parker, T.; Sunal, P. Growth conditions and mechanisms for IrOx nano-platelet formation by reactive sputtering. J. Cryst. Growth 2022, 577, 126374. [Google Scholar] [CrossRef]
- Comstock, D.J.; Christensen, S.T.; Elam, J.W.; Pellin, M.J.; Hersam, M.C. Synthesis of nanoporous activated iridium oxide films by anodized aluminum oxide templated atomic layer deposition. Electrochem. Commun. 2010, 12, 1543–1546. [Google Scholar] [CrossRef]
- Choi, W.; Papautsky, I. Fabrication of a needle-type pH sensor by selective electrodeposition. J. Micro/Nanolithography MEMS MOEMS 2011, 10, 020501. [Google Scholar] [CrossRef]
- Rouhi, J.; Kakooei, S.; Ismail, M.C.; Karimzadeh, R.; Mahmood, M.R. Development of iridium oxide sensor for surface pH measurement of a corroding metal under deposit. Int. J. Electrochem. Sci 2017, 12, 9933–9943. [Google Scholar] [CrossRef]
- Marsh, P.; Manjakkal, L.; Yang, X.; Huerta, M.; Le, T.; Thiel, L.; Chiao, J.; Cao, H.; Dahiya, R. Flexible iridium oxide based pH sensor integrated with inductively coupled wireless transmission system for wearable applications. IEEE Sens. J. 2020, 20, 5130–5138. [Google Scholar] [CrossRef]
- Huang, W.; Wang, J.; Ativanichayaphong, T.; Chiao, M.; Chiao, J.-C. Development of an IrOx micro pH sensor array on flexible polymer substrate. In Nanosensors and Microsensors for Bio-Systems; SPIE: Vancouver, BC, Canada, 2008. [Google Scholar]
- Yang, X.; Chiao, J.-C. In Integrated pH and Sodium Sensor Array Based on Iridium Oxide Film. In Proceedings of the IEEE Sensors Conference, New Delhi, India, 28–31 October 2018. [Google Scholar]
- Zea, M.; Moya, A.; Fritsch, M.; Ramon, E.; Villa, R.; Gabriel, G. Enhanced performance stability of iridium oxide-based pH sensors fabricated on rough inkjet-printed platinum. ACS Appl. Mater. Interfaces 2019, 11, 15160–15169. [Google Scholar] [CrossRef]
- Mariani, F.; Serafini, M.; Gualandi, I.; Arcangeli, D.; Decataldo, F.; Possanzini, L.; Tessarolo, M.; Tonelli, D.; Fraboni, B.; Scavetta, E. Advanced wound dressing for real-time pH monitoring. ACS Sens. 2021, 6, 2366–2377. [Google Scholar] [CrossRef]
- Mahltig, B.; Textor, T. Silver containing sol-gel coatings on polyamide fabrics as antimicrobial finish-description of a technical application process for wash permanent antimicrobial effect. Fibers Polym. 2010, 11, 1152–1158. [Google Scholar] [CrossRef]
- Vihodceva, S.; Kukle, S.; Muter, O. Antimicrobial properties of the modified cotton textiles by the sol-gel technology. In Advanced Materials Research; Trans Tech Publications Ltd.: Stafa-Zurich, Switzerland, 2015; Volume 1117, pp. 213–216. [Google Scholar]
- Trovato, V.; Teblum, E.; Kostikov, Y.; Pedrana, A.; Re, V.; Nessim, G.D.; Rosace, G. Sol-gel approach to incorporate millimeter-long carbon nanotubes into fabrics for the development of electrical-conductive textiles. Mater. Chem. Phys. 2020, 240, 122218. [Google Scholar] [CrossRef]
- Nguyen, C.M.; Huang, W.-D.; Rao, S.; Hung, C.; Tata, U.; Chiao, M.; Chiao, J.-C. Sol-Gel Iridium Oxide-Based pH Sensor Array on Flexible Polyimide Substrate. IEEE Sens. J. 2013, 13, 3857–3864. [Google Scholar] [CrossRef]
- Huang, W.; Hsu, L.; Wang, J.; Ativanichayaphong, T.; Deb, S.; Chiao, M.; Chiao, J.-C. Investigation of repeatability of sol-gel iridium oxide pH sensor on flexible substrate. In Micro-and Nanotechnology: Materials, Processes, Packaging, and Systems IV; SPIE: Vancouver, BC, Canada, 2008. [Google Scholar]
- Christianson, A.M.; Waters, C.A. Silver chloride waste recycling as a guided-inquiry experiment for the instrumental analysis laboratory. J. Chem. Educ. 2021, 99, 1014–1020. [Google Scholar] [CrossRef]
- Kay, R.; Desmulliez, M. A review of stencil printing for microelectronic packaging. Solder. Surf. Mt. Technol. 2012, 24, 38–50. [Google Scholar] [CrossRef]
- Phair, J.; Newton, L.; McCormac, C.; Cardosi, M.F.; Leslie, R.; Davis, J. A disposable sensor for point of care wound pH monitoring. Analyst 2011, 136, 4692–4695. [Google Scholar] [CrossRef] [PubMed]
- Zuliani, C.; Matzeu, G.; Diamond, D. A potentiometric disposable sensor strip for measuring pH in saliva. Electrochim. Acta 2014, 132, 292–296. [Google Scholar] [CrossRef]
- Liu, Y.; Pharr, M.; Salvatore, G.A. Lab-on-skin: A review of flexible and stretchable electronics for wearable health monitoring. ACS Nano 2017, 11, 9614–9635. [Google Scholar] [CrossRef] [PubMed]
- Chawang, K.; Chou, S.; Bing, S.; Wu, P.; Chiao, J.-C. Porous Polypropylene Membrane Based pH Sensing for Skin Monitoring. IEEE Access 2022, 10, 111675–111687. [Google Scholar] [CrossRef]
- Yang, X.; Chawang, K.; Chiao, J.-C. Wearable Iridium Oxide pH Sensors for Sweat pH Measurements. In Proceedings of the IEEE Sensors Conference, Montreal, QC, Canada, 28–30 October 2019. [Google Scholar]
- Yang, X.; De Angeli, M.; Fu, J.; Dubey, S.; Chiao, J.-C. Miniature pH sensors on ultra-flexible substrates. In Proceedings of the IEEE Sensors Conference, Glasglow, UK, 29 October–1 November 2017. [Google Scholar]
- Cao, H.; Peng, Y.; Chiao, J.-C. An integrated flexible implantable L-glutamate sensor. In Proceedings of the IEEE Sensors Conference, Waikoloa, HI, USA, 1–10 November 2010. [Google Scholar]
- Nguyen, C.M.; Rao, S.; Yang, X.; Dubey, S.; Mays, J.; Cao, H.; Chiao, J. Sol-gel Deposition of Iridium Oxide for Biomedical Micro-devices. Sensors 2015, 15, 4212–4228. [Google Scholar] [CrossRef]
- Jones, E.M.; Cochrane, C.A.; Percival, S.L. The effect of pH on the extracellular matrix and biofilms. Adv. Wound Care 2015, 4, 431–439. [Google Scholar] [CrossRef]
- Shi, L.; Ramsay, S.; Ermis, R.; Carson, D. pH in the bacteria-contaminated wound and its impact on clostridium histolyticum collagenase activity: Implications for the use of collagenase wound debridement agents. J. Wound Ostomy Cont. Nurs. 2011, 38, 514–521. [Google Scholar] [CrossRef]
- Ullah, A.; Jang, M.; Khan, H.; Choi, H.J.; An, S.; Kim, D.; Kim, Y.; Kim, U.; Kim, G.M. Microneedle array with a pH-responsive polymer coating and its application in smart drug delivery for wound healing. Sens. Actuators B Chem. 2021, 345, 130441. [Google Scholar] [CrossRef]
- Momen-Heravi, F.; Balaj, L.; Alian, S.; Trachtenberg, A.J.; Hochberg, F.H.; Skog, J.; Kuo, W.P. Impact of biofluid viscosity on size and sedimentation efficiency of the isolated microvesicles. Front. Physiol. 2012, 3, 162. [Google Scholar] [CrossRef] [PubMed]
- Kucukal, E.; Man, Y.; Hill, A.; Liu, S.; Bode, A.; An, R.; Kadambi, J.; Little, J.A.; Gurkan, U.A. Whole blood viscosity and red blood cell adhesion: Potential biomarkers for targeted and curative therapies in sickle cell disease. Am. J. Hematol. 2020, 95, 1246–1256. [Google Scholar] [CrossRef] [PubMed]
- Nader, E.; Skinner, S.; Romana, M.; Fort, R.; Lemonne, N.; Guillot, N.; Gauthier, A.; Antoine-Jonville, S.; Renoux, C.; Hardy-Dessources, M. Blood rheology: Key parameters, impact on blood flow, role in sickle cell disease and effects of exercise. Front. Physiol. 2019, 10, 1329. [Google Scholar] [CrossRef]
- Cosnahan, T.; Watt, A.A.; Assender, H.E. Flexography printing for organic thin film transistors. Mater. Today Proc. 2018, 5, 16051–16057. [Google Scholar] [CrossRef]
- Mogg, B.T.; Claypole, T.; Deganello, D.; Phillips, C. Flexographic printing of ultra-thin semiconductor polymer layers. Transl. Mater. Res. 2016, 3, 015001. [Google Scholar] [CrossRef]
- Huang, W.; Cao, H.; Deb, S.; Chiao, M.; Chiao, J.C. A Flexible pH Sensor Based on the Iridium Oxide Sensing Film. Sens. Actuators A Phys. 2011, 169, 1–11. [Google Scholar] [CrossRef]
- Madeira, G.D.M.; NP Dias Mello, H.J.; Faleiros, M.C.; Mulato, M. Model improvement for super-Nernstian pH sensors: The effect of surface hydration. J. Mater. Sci. 2021, 56, 2738–2747. [Google Scholar] [CrossRef]
- Osaka, A.; Takatsuna, T.; Miura, Y. Iridium oxide films via sol-gel processing. J. Non Cryst. Solids 1994, 178, 313–319. [Google Scholar] [CrossRef]
- Nishio, K.; Tsuchiya, T. Electrochromic thin films prepared by sol–gel process. Sol. Energy Mater. Sol. Cells 2001, 68, 279–293. [Google Scholar] [CrossRef]
- Chou, J.; Weng, C. Sensitivity and hysteresis effect in Al2O3 gate pH-ISFET. Mater. Chem. Phys. 2001, 71, 120–124. [Google Scholar] [CrossRef]
- Uppuluri, K.; Lazouskaya, M.; Szwagierczak, D.; Zaraska, K.; Tamm, M. Fabrication, potentiometric characterization, and application of screen-printed RuO2 pH electrodes for water quality testing. Sensors 2021, 21, 5399. [Google Scholar] [CrossRef] [PubMed]
- Xu, B.; Zhang, W. Modification of vertically aligned carbon nanotubes with RuO2 for a solid-state pH sensor. Electrochim. Acta 2010, 55, 2859–2864. [Google Scholar] [CrossRef]
- Liao, Y.; Chou, J. Preparation and characterization of the titanium dioxide thin films used for pH electrode and procaine drug sensor by sol–gel method. Mater. Chem. Phys. 2009, 114, 542–548. [Google Scholar] [CrossRef]
- Manjakkal, L.; Cvejin, K.; Kulawik, J.; Zaraska, K.; Szwagierczak, D.; Stojanovic, G. Sensing mechanism of RuO2–SnO2 thick film pH sensors studied by potentiometric method and electrochemical impedance spectroscopy. J. Electroanal. Chem. 2015, 759, 82–90. [Google Scholar] [CrossRef]
- Olthuis, W.; Robben, M.; Bergveld, P.; Bos, M.; Van der Linden, W.E. pH Sensor Properties of Electrochemically Grown Iridium Oxide. Sens. Actuators B Chem. 1990, 2, 247–256. [Google Scholar] [CrossRef]
- Parmar, J.S.; Shafi, N.; Sahu, C. Electrical Characterization and Study of Current Drift Phenomena and Hysteresis Mechanism in Junctionless Ion-Sensitive Field-Effect Transistor. Silicon 2022, 14, 6829–6836. [Google Scholar] [CrossRef]
- Chawang, K.; Chou, S.; Bing, S.; Wu, P.; Chiao, J.-C. Characterization of pH Sensors Based on Iridium Oxide and Gold Encapsulated Polypropylene Membranes. In Proceedings of the IEEE Sensors Conference, Sydney, Australia, 31 October–3 November 2021. [Google Scholar]
- Yao, S.; Wang, M.; Madou, M. A pH electrode based on melt-oxidized iridium oxide. J. Electrochem. Soc. 2001, 148, H29. [Google Scholar] [CrossRef]
- Hendrikse, J.; Olthuis, W.; Bergveld, P. A method of reducing oxygen induced drift in iridium oxide pH sensors. Sens. Actuators B Chem. 1998, 53, 97–103. [Google Scholar] [CrossRef]
- Burke, L.D.; Lyons, M.E.; O’Sullivan, E.; Whelan, D.P. Influence of hydrolysis on the redox behaviour of hydrous oxide films. J. Electroanal. Chem. Interfacial Electrochem. 1981, 122, 403–407. [Google Scholar] [CrossRef]
- Papeschi, G.; Bordi, S.; Beni, C.; Ventura, L. Use of an iridium electrode for direct measurement of pI of proteins after isoelectric focusing in polyacrylamide gel. Biochim. Biophys. Acta Protein Struct. 1976, 453, 192–199. [Google Scholar] [CrossRef]
- Karagounis, V.A.; Liu, C.C.; Neuman, M.R.; Romankiw, L.T.; Leary, P.A.; Cuomo, J.J. A Pd-PdO Film Potentiometnc pH Sensor. IEEE Trans. Biomed. Eng. 1986, 33, 113–116. [Google Scholar] [CrossRef] [PubMed]
- Turner, M.J.; Avolio, A.P. Does replacing sodium excreted in sweat attenuate the health benefits of physical activity? Int. J. Sport Nutr. Exerc. Metab. 2016, 26, 377–389. [Google Scholar] [CrossRef] [PubMed]
- Chawang, K.; Bing, S.; Chiao, J.-C. Effects of Viscosity and Salt Interference for Planar Iridium Oxide and Silver Chloride pH Sensing Electrodes on Flexible Substrate. Chemosensors 2022, 10, 371. [Google Scholar] [CrossRef]
- Chawang, K.; Bing, S.; Chiao, J.-C. Investigation of pH Sensing in Viscous Salt-added Solution by Iridium Oxide Film. In Proceedings of the IEEE Sensors Conference, Dallas, TX, USA, 30 October–2 November 2022. [Google Scholar]
- Lindner, E.; Guzinski, M.; Khan, T.A.; Pendley, B.D. Reference electrodes with ionic liquid salt bridge: When will these innovative novel reference electrodes gain broad acceptance? ACS Sens. 2019, 4, 549–561. [Google Scholar] [CrossRef]
- Dormandy, J.A. Clinical significance of blood viscosity. Ann. R. Coll. Surg. Engl. 1970, 47, 211–228. [Google Scholar]
- Pohl, H.R.; Wheeler, J.S.; Murray, H.E. Sodium and potassium in health and disease. Interrelat. Between Essent. Met. Ions Hum. Dis. 2013, 13, 29–47. [Google Scholar]
- Hernandez-Jaimes, C.; Lobato-Calleros, C.; Sosa, E.; Bello-Pérez, L.A.; Vernon-Carter, E.J.; Alvarez-Ramirez, J. Electrochemical Characterization of Gelatinized Starch Dispersions: Voltammetry and Electrochemical Impedance Spectroscopy on Platinum Surface. Carbohydr. Polym. 2015, 124, 8–16. [Google Scholar] [CrossRef]
- Li, Y.; Mao, Y.; Xiao, C.; Xu, X.; Li, X. Flexible pH sensor based on a conductive PANI membrane for pH monitoring. RSC Adv. 2020, 10, 21–28. [Google Scholar] [CrossRef]
- Yoon, J.H.; Hong, S.B.; Yun, S.; Lee, S.J.; Lee, T.J.; Lee, K.G.; Choi, B.G. High performance flexible pH sensor based on polyaniline nanopillar array electrode. J. Colloid Interface Sci. 2017, 490, 53–58. [Google Scholar] [CrossRef]
- Possanzini, L.; Decataldo, F.; Mariani, F.; Gualandi, I.; Tessarolo, M.; Scavetta, E.; Fraboni, B. Textile sensors platform for the selective and simultaneous detection of chloride ion and pH in sweat. Sci. Rep. 2020, 10, 17180. [Google Scholar] [CrossRef]
- Rahimi, R.; Ochoa, M.; Parupudi, T.; Zhao, X.; Yazdi, I.K.; Dokmeci, M.R.; Tamayol, A.; Khademhosseini, A.; Ziaie, B. A low-cost flexible pH sensor array for wound assessment. Sens. Actuators B Chem. 2016, 229, 609–617. [Google Scholar] [CrossRef]
- Choi, S.; Savagatrup, S.; Kim, Y.; Lang, J.H.; Swager, T.M. Precision pH sensor based on WO3 nanofiber-polymer composites and differential amplification. ACS Sens. 2019, 4, 2593–2598. [Google Scholar] [CrossRef] [PubMed]
- Lonsdale, W.; Wajrak, M.; Alameh, K. Manufacture and application of RuO2 solid-state metal-oxide pH sensor to common beverages. Talanta 2018, 180, 277–281. [Google Scholar] [CrossRef] [PubMed]


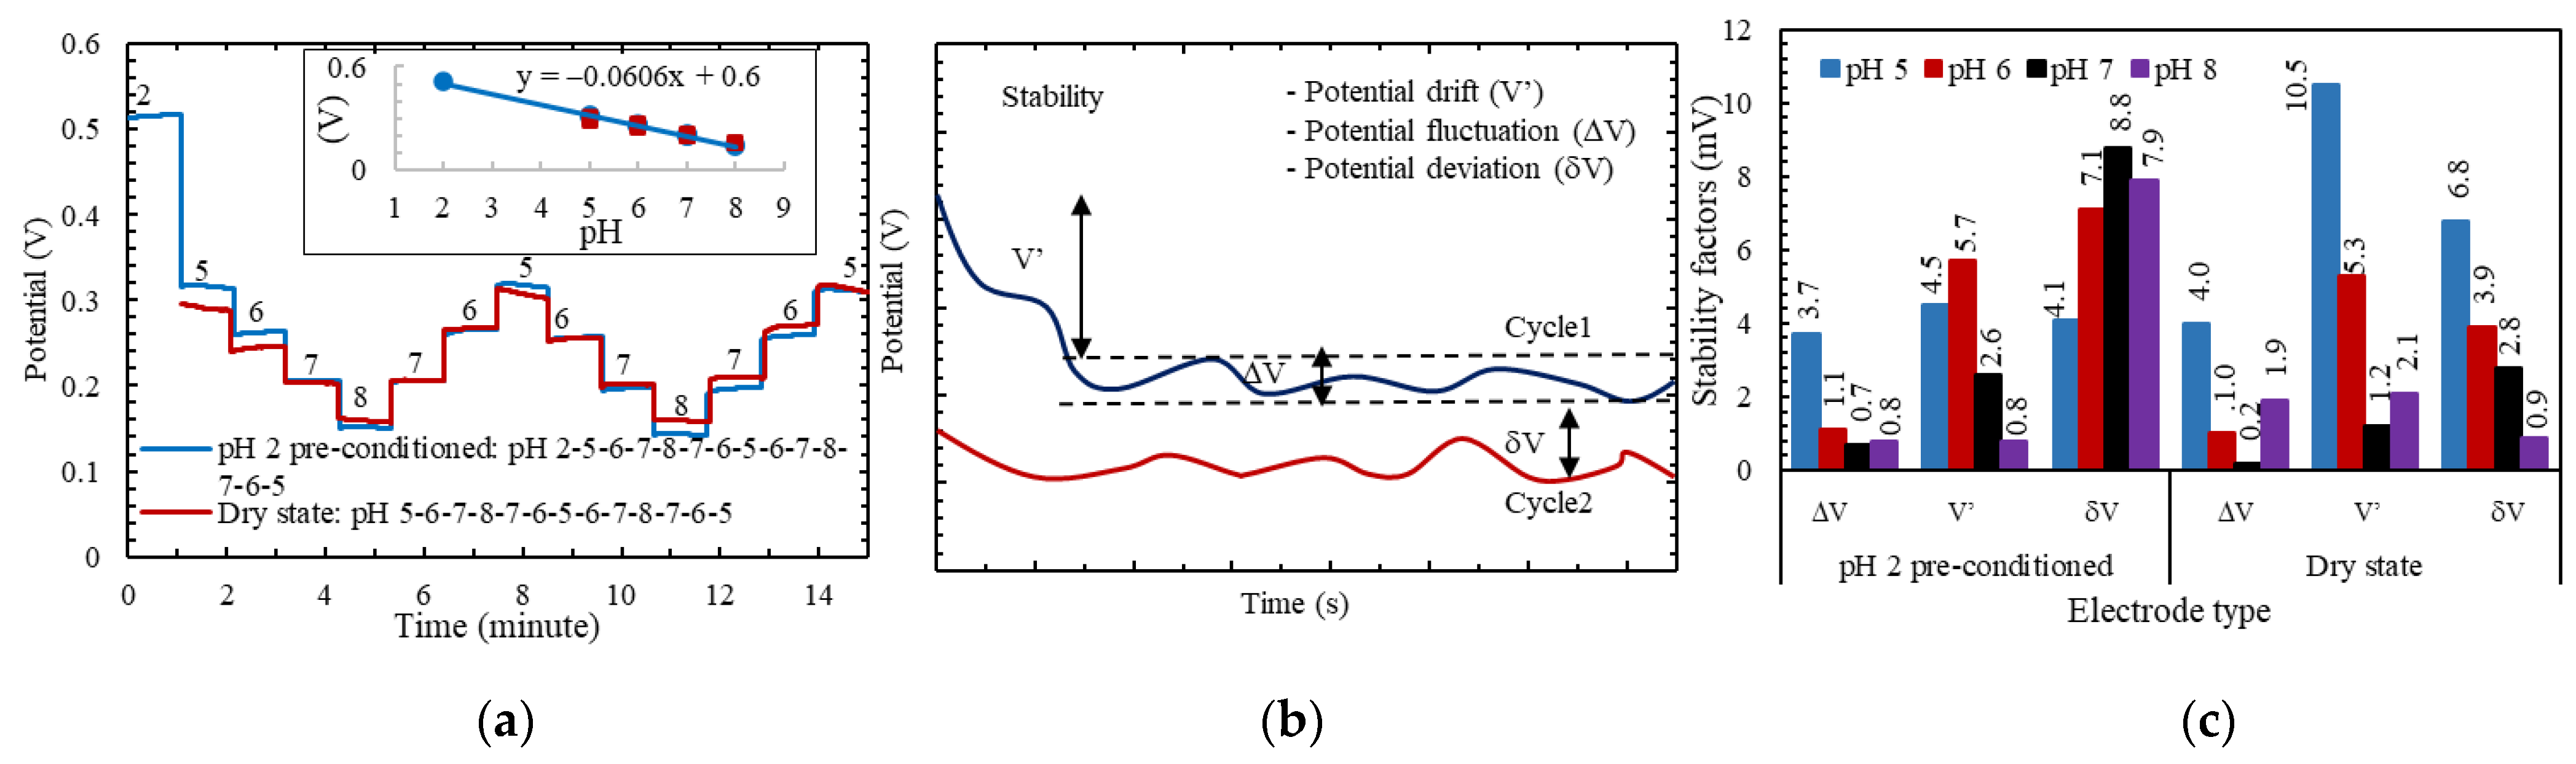
| pH | Cycle 1 | Cycle 2 | Stability in mV | ||||
|---|---|---|---|---|---|---|---|
| dV (mV) | dpH | dV (mV) | dpH | ΔV | V′ | δV | |
| 2 | ±5.7 | 0.09 | ±5.5 | 0.09 | 0.3 | 6.3 | 4.3 |
| 4 | ±6.0 | 0.09 | ±6.5 | 0.1 | 0.2 | 3.1 | 6.9 |
| 5 | ±4.9 | 0.08 | ±6.0 | 0.1 | 0.3 | 2.3 | 4.0 |
| 6 | ±3.4 | 0.05 | ±5.5 | 0.09 | 2.0 | 2.8 | 0.3 |
| 7 | ±5.3 | 0.08 | ±5.3 | 0.08 | 0.6 | 2.6 | 6.0 |
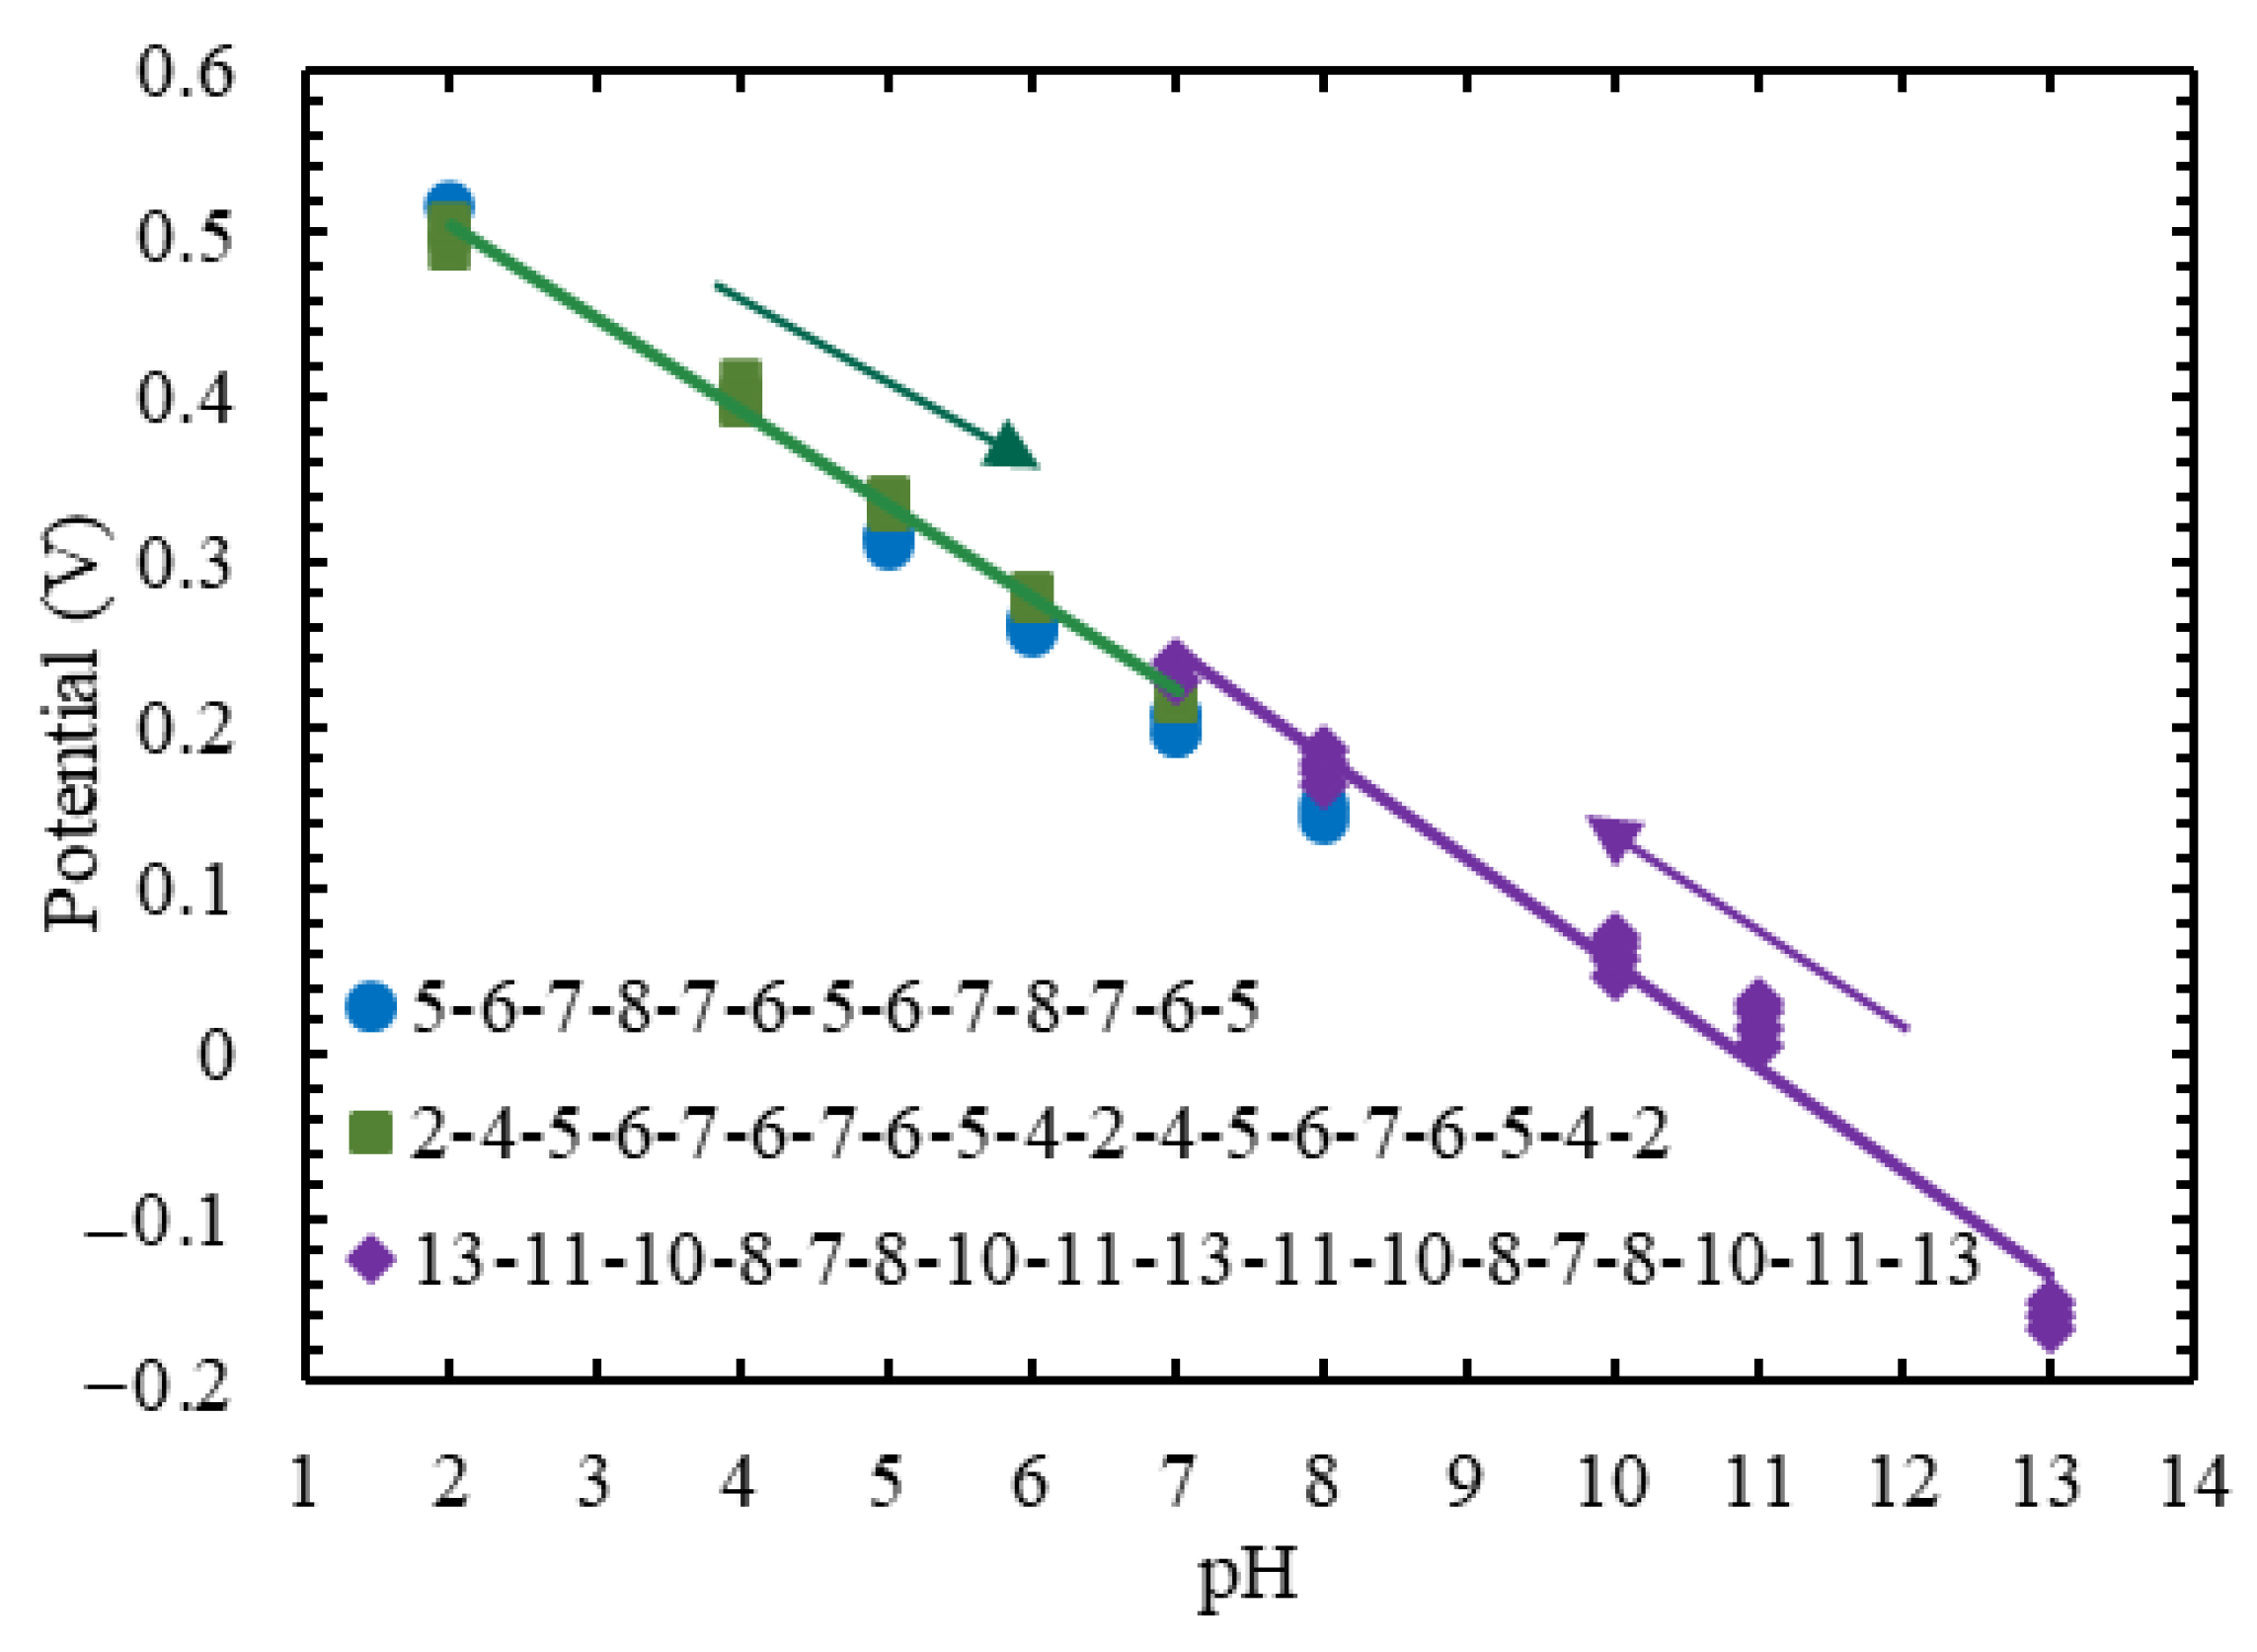
| Material | Sensitivity (mV/pH) | Linear pH Range | Sample * | Reference |
|---|---|---|---|---|
| IrOx 1 | −60.6 | 2–7 and 13–7 | A.S. 6 V.S. 7 | This work |
| IrOx 1 | −(51.1–51.7) | 1.5–12.1 | [77] | |
| PANI 2 | −58.7 | 5.45–8.62 | [101] | |
| PANI 2 | −60.3 | 2.1–12 | Orange | [102] |
| PEDOT:BTB 3 | −(62–67) | 4–7 | A.S. 6 | [103] |
| PANI 2 | −50 | 4–10 | Keratinocyte cells | [104] |
| WO3 4 | −377.5 | 6.9–8.94 | A.SW. 8 | [105] |
| RuO2/Al2O3 5 | −55.3 | 2–6 | Beverages 9 | [106] |
Disclaimer/Publisher’s Note: The statements, opinions and data contained in all publications are solely those of the individual author(s) and contributor(s) and not of MDPI and/or the editor(s). MDPI and/or the editor(s) disclaim responsibility for any injury to people or property resulting from any ideas, methods, instructions or products referred to in the content. |
© 2023 by the authors. Licensee MDPI, Basel, Switzerland. This article is an open access article distributed under the terms and conditions of the Creative Commons Attribution (CC BY) license (https://creativecommons.org/licenses/by/4.0/).
Share and Cite
Chawang, K.; Bing, S.; Chiao, J.-C. Printable and Flexible Iridium Oxide-Based pH Sensor by a Roll-to-Roll Process. Chemosensors 2023, 11, 267. https://doi.org/10.3390/chemosensors11050267
Chawang K, Bing S, Chiao J-C. Printable and Flexible Iridium Oxide-Based pH Sensor by a Roll-to-Roll Process. Chemosensors. 2023; 11(5):267. https://doi.org/10.3390/chemosensors11050267
Chicago/Turabian StyleChawang, Khengdauliu, Sen Bing, and Jung-Chih Chiao. 2023. "Printable and Flexible Iridium Oxide-Based pH Sensor by a Roll-to-Roll Process" Chemosensors 11, no. 5: 267. https://doi.org/10.3390/chemosensors11050267