Article

Simulating the Detection of Dioxin-like Pollutants with 2D Surface-Enhanced Raman Spectroscopy Using h-BNC Substrates

Department of Physical Chemistry, University of Vigo, Lagoas-Marcosende s/n, 36310 Vigo, Spain
*
Authors to whom correspondence should be addressed.
Chemosensors 2023, 11(5), 266; https://doi.org/10.3390/chemosensors11050266
Submission received: 31 March 2023 / Revised: 25 April 2023 / Accepted: 27 April 2023 / Published: 29 April 2023
(This article belongs to the Section Optical Chemical Sensors)

Abstract

:
The ability of 2D hybrid structures formed by boron, nitrogen and carbon atoms (h-BNCs) to act as potential substrates for the surface-enhanced Raman spectroscopy (SERS) detection of dioxin-like pollutants is theoretically analyzed. The strong confinement and high tunability of the electromagnetic response of the carbon nanostructures embedded within the h-BNC sheets point out that these hybrid structures could be promising for applications in optical spectroscopies, such as SERS. In this work, two model dioxin-like pollutants, TCDD and TCDF, and a model h-BNC surface composed of a carbon nanodisk of ninety-six atoms surrounded by a string of borazine rings, BNC96, are used to simulate the adsorption complexes and the static and pre-resonance Raman spectra of the adsorbed molecules. A high affinity of BNC96 for these pollutants is reflected by the large interaction energies obtained for the most stable stacking complexes, with dispersion being the most important contribution to their stability. The strong vibrational coupling of some active modes of TCDF and, specially, of TCDD causes the static Raman spectra to show a ”pure” chemical enhancement of one order of magnitude. On the other hand, due to the strong electromagnetic response of BNC96, confined within the carbon nanodisk, the pre-resonance Raman spectra obtained for TCDD and TCDF display large enhancement factors of 108 and 107, respectively. Promisingly, laser excitation wavelengths commonly used in SERS experiments also induce significant Raman enhancements of around 104 for the TCDD and TCDF signals. Both the strong confinement of the electromagnetic response within the carbon domains and the high modulation of the resonance wavelengths in the visible and/or UV region in h-BNCs should lead to a higher sensitivity than that of graphene and white graphene parent structures, thus overcoming one of the main disadvantages of using 2D substrates for SERS applications.

1. Introduction

Dioxins and dibenzofurans are persistent organic pollutants (POPs); the more toxic forms correspond to their tetrachlorinated derivatives, 2,3,7,8-tetrachloro-p-dibenzodioxin (TCDD) and 2,3,7,8-tetrachlorodibenzofuran (TCDF) [1,2]. These chemicals are sources of carcinogenic and mutagenic effects, causing serious damage to organs and tissues [3,4,5,6,7]. The risk these substances pose to humans is twofold. On the one hand, they may be inhaled, as they are emitted in a gaseous form during combustion processes [8], both industrial and natural, or by reacting with anthracene when burning waste or producing iron and steel [9]. On the other hand, they may enter the organism by the intake of animals or plants, where they may be present in low concentrations due to bioaccumulation [10,11,12]. Other examples of dioxins and dibenzofurans sources are the chlorine bleaching processes in the pulp and paper industry [13,14], sewage sludge and garden pesticides. Thus, many different processes can lead to the formation of dioxins, which are found throughout the world and pose a serious threat to health and the environment.
The detection of dioxins and dibenzofurans is therefore a priority for preventing environmental contamination and to protect living organisms from their damages. The classical methods for the detection of dioxin-like compounds are mainly classified as biological or chemical techniques [15]. Biological methods are based on in vivo or in vitro bioassays and protein binding assays [16,17,18,19,20], whereas chemical methods are based on gas chromatography and mass spectrometry [21,22,23,24,25]. More recently, different kinds of chemical sensors [26,27,28] and biosensors [29,30,31,32] have been successfully developed to detect dioxin-like pollutants. Sensor detection offers a series of advantages over biological assays and chemical analysis, such as the possibility of on-site application and a lower cost. Among all the sensors developed and tested for the detection of dioxin-like pollutants, those based on surface-enhanced Raman scattering (SERS) deserve special attention [28,33,34,35,36,37,38,39,40,41,42,43,44]. SERS is a highly sensitive spectroscopic technique based on the Raman scattering enhancement of molecules adsorbed on surfaces, which act as enhancing platforms through two different resonant mechanisms, electromagnetic and chemical [45].
Among the many applications of SERS-based detection, those related to disease diagnosis [46,47,48,49] and environmental analysis [37,44,50,51,52,53,54] are of particular interest. For the latter, very important advances have been made in the last decade. Therefore, the SERS technique has been pointed out as one of the most promising alternatives for POPs detection [28,33,34,35,36,37,38,39,40,41,42,43,44], mainly due to the very low detection limits obtained [45], which are unachievable with traditional detection methods based on bioassays or chromatography techniques. Another advantage of spectroscopic techniques in general and SERS in particular is the lower cost compared to that of bioassays and gas chromatography [15]; this is a cost that has been gradually reduced by improving the fabrication techniques of SERS substrates or replacing the traditional gold and silver nanoparticles with less expensive nanostructured materials [55,56,57,58,59].
Particularly interesting for SERS applications are the 2D materials [59,60,61,62,63,64]. They may offer some advantages over metal-based 3D materials, such as: higher inertness, due to the non-covalent nature generally exhibited by their interactions with the analyte; lower production costs, due to the reduction in the amount of material employed; and a reduced signal-to-noise ratio, due to their smoother surfaces. Graphene and white graphene (h-BN) are good examples of 2D SERS substrates that may work both independently and incorporated with hybrid structures [60,62,65,66,67,68,69,70,71,72]. In the case of hybrid structures, they exert a twofold effect: on the one hand, they protect metal nanoparticles from oxidation and other degradation processes by wrapping them with few-layer graphene or h-BN; on the other hand, they increase the Raman enhancement factors with respect to the metal nanoparticles alone, which is associated with a higher sensitivity. Raman enhancements of adsorbed molecules on pristine graphene and h-BN have also been reported. In the particular case of graphene, this has given rise to a specific branch of SERS, known as graphene-enhanced Raman scattering (GERS) [67]. However, the problem is that the magnitude of the enhancements reached is significantly lower than those obtained with metallic plasmonic materials. Thus, the potential advantages of using graphene or h-BN as an SERS platform are overcome by the extremely high sensitivity displayed by noble metal nanoparticles, which allows for reaching detection limits down to the single-molecule level [73].
The relatively small Raman enhancement factors obtained with graphene compared to metal nanoparticles or hybrid substrates stem from the lack of plasmonic activity in the visible and UV regions. It is well known that plasmon emission in graphene occurs at terahertz frequencies. Thus, the mechanism responsible for the Raman enhancement in GERS has been associated with charge transfer excitations between the surface and the adsorbed molecule [67], in combination with vibrational coupling between the molecule and the surface atoms, as suggested by theoretical simulations [74,75,76]. A strong optical response of the 2D substrate in the visible or UV region, where the laser sources in SERS experiments operate, would be desirable for increasing the Raman enhancement factors of the adsorbed molecules. This is the case of other finite carbon structures related to graphene, such as graphene nanoribbons, nanodisks or capped nanotubes. Theoretical simulations have shown that, at near resonance conditions, electronic excitation modes of a graphene nanodisk can greatly enhance the Raman activity of molecules adsorbed on its surface [75]. In order to exploit the visible or UV optical activity of these graphene-related structures for SERS detection, they must be immobilized in another substrate, either by adsorption or by integration into another 2D material. An example of the latter is the synthesis of hybrid h-BN/graphene structures (h-BNCs), where carbon domains of different sizes and morphologies are embedded within an h-BN sheet [77]. Recent experimental and theoretical works on h-BNCs have focused, respectively, on the development of reliable techniques for a controllable synthesis and the study of their optical response properties [78,79,80]. Thus, previous studies have shown the high tunability of the band gap in h-BNC structures, which is directly related to the localization/isolation of π-electron systems within the carbon domains. This localization gives rise to a strong confinement of their optical response, which, for a given carbon domain, requires only two surrounding BN strings [81]. Therefore, the optical response can be widely modulated by changing the size and shape of these carbon domains [82,83,84,85]. From a practical point of view, it means that h-BNC structures can be tuned to have an optical response close to a given laser source or that an optimal laser source can be selected for a given h-BNC structure.
In this work, the suitability of h-BNCs for the SERS detection of dioxin-like pollutants has been investigated using quantum chemical simulations. A high affinity of these molecules by graphene and h-BN sheets, a prerequisite for SERS substrates, was previously found both in the gas phase and water solution [86]. Their affinity by a hybrid h-BNC surface, formed by a graphene nanodisk of ninety-six carbon atoms embedded in an h-BN sheet, has also been investigated in this work. Subsequently, the Raman spectra of TCDD and TCDF attached to this h-BNC model have been simulated. The whole system has been subjected to electromagnetic radiations of wavelengths coincident with laser sources commonly employed in SERS experiments. Herein, it is shown that suitable laser sources approaching the resonance wavelength of the optically active electronic excitation modes of the carbon domains in h-BNCs induce Raman enhancement factors much larger than those previously reported for graphene and h-BN sheets.

2. Materials and Methods

2.1. Interaction Energy Decomposition Analysis

The total interaction energy between the molecule (M) and the model surface (S) can be obtained using the supermolecule approach:
E I n t = E S M E S + E M
where E S M represents the energy of the adsorption complex and E S and E M are the energies of the surface and molecule, respectively, both calculated with the geometry and basis set of the complex. The latter condition mitigates, to a large extent, the effect of the basis set superposition error (BSSE) resulting from the use of small- and medium-sized basis sets, which is mandatory in this work due to the large size of the complexes studied.
The interaction energy of Equation (1) can be further partitioned into components with different physical origins, as shown in Equation (2):
E I n t = E E l e c + E P a u + E I n d + E D i s p
where E E l e c , E P a u , E I n d and E D i s p are electrostatic, Pauli repulsion, induction and dispersion energies, respectively. In the interaction energy decomposition analysis applied in this work, the different terms of Equation (2) are obtained by breaking down the complex one-electron and exchange-correlation densities into the unperturbed surface and molecule densities and deformation densities associated with each term. The full mathematical framework behind this Energy Decomposition Analysis (EDA) scheme has been explained in detail elsewhere, both using a pure quantum mechanics treatment [87,88] and a hybrid quantum mechanics/molecular mechanics scheme [89,90].
It must be noticed that the dispersion energy of Equation (2) includes, at the Kohn–Sham Density Functional Theory (KS-DFT) level, the part implicitly accounted for by the DFT functional, obtained from the interaction energy decomposition scheme, plus the empirical dispersion correction (see the next section for details on the functional employed in this work).

2.2. Simulation of Raman Spectra

The differential Raman scattering cross-section can be used to represent the Raman intensity. In the harmonic approximation, the differential Raman scattering for a given vibrational mode k is expressed as
d σ d Ω k = 2 π 2 45 υ - 0 υ - k h c υ k 1 e h c υ - k k B T 1 R k
where h , c and k B are the Planck constant, the speed of light in vacuum and the Boltzmann constant, respectively. T is the temperature in Kelvin, and υ - 0 and υ - k are the frequencies of the incident light and the vibrational mode, respectively. The Raman activity for k , i.e., R k , is the key magnitude in Equation (3) and can also be used to represent the relative intensities of the signals in a simulated Raman spectrum. This magnitude is given by [91]:
R k = 45 α - k + 7 γ - k
where α - k and γ - k are isotropic and anisotropic invariants of the Raman tensor, R ^ k . The Raman tensor indicates how the electric polarizability of a molecular system, α , oscillates with a given vibrational mode. It is obtained from the derivative of the electric polarizability tensor, α ^ , with respect to the vibrational mode coordinate. Since vibrational modes are constructed by combining atomic displacements, the Raman tensor can be calculated using Equation (5) [91]:
R ^ k = 1 μ k I = 1 N σ = 1 3 φ k I σ α ^ ξ I σ
where φ k I σ represents the normalized atomic displacement in the Cartesian coordinate σ for the atom I , ξ I σ is the corresponding unnormalized atomic displacement and μ k is the reduced mass for the vibrational mode k . The sum in Equation (5) runs over the total number of atoms, which is represented by N .
The form of Equation (5) allows for the splitting of the Raman tensor into the molecule and surface contributions in SERS simulations [74,75]. Thus, the first summation of Equation (5) can be divided into two summations: one over the atoms belonging to the molecule and another over those of the surface.
R ^ k = R ^ k M + R ^ k S = 1 μ k I M σ = 1 3 φ k I σ α ^ ξ I σ + 1 μ k I S σ = 1 3 φ k I σ α ^ ξ I σ
Using this separation of the Raman tensor, the Raman activity of k also gets partitioned into a sum of molecule (M), surface (S) and intermolecular (MS) contributions, the latter arising from the crossed products of the components R ^ k M and R ^ k S in Equation (6).
R k = R k M + R k S + R k M S = [ 45 ( α - k M ) 2 + 7 ( γ - k M ) 2 ] + [ 45 ( α - k S ) 2 + 7 ( γ k S ) 2 ] + [ 45 ( α - k M S ) 2 + 7 ( γ - k M S ) 2 ]
The reader is invited to look elsewhere for more details on how to derive Equation (7) [75].
Equation (7) provides a way to analyze the effect of molecule–surface vibrational coupling on the Raman scattering enhancement of adsorbed molecules. This effect has been overlooked in the SERS literature, but it has been shown to play a very important role in carbon-based substrates such as graphene [74,75,76], even though it is residual in metals such as silver [92]. Thereby, the Raman activity for a given molecular mode in the molecule–surface complex can be decomposed into the ”pure” molecular contribution and the surface terms using Equation (7). This allows for the representation of hypothetical spectra for the molecule and the surface separately using their respective contributions to the Raman activities. The superposition of these hypothetical spectra gives rise to the Raman spectrum.

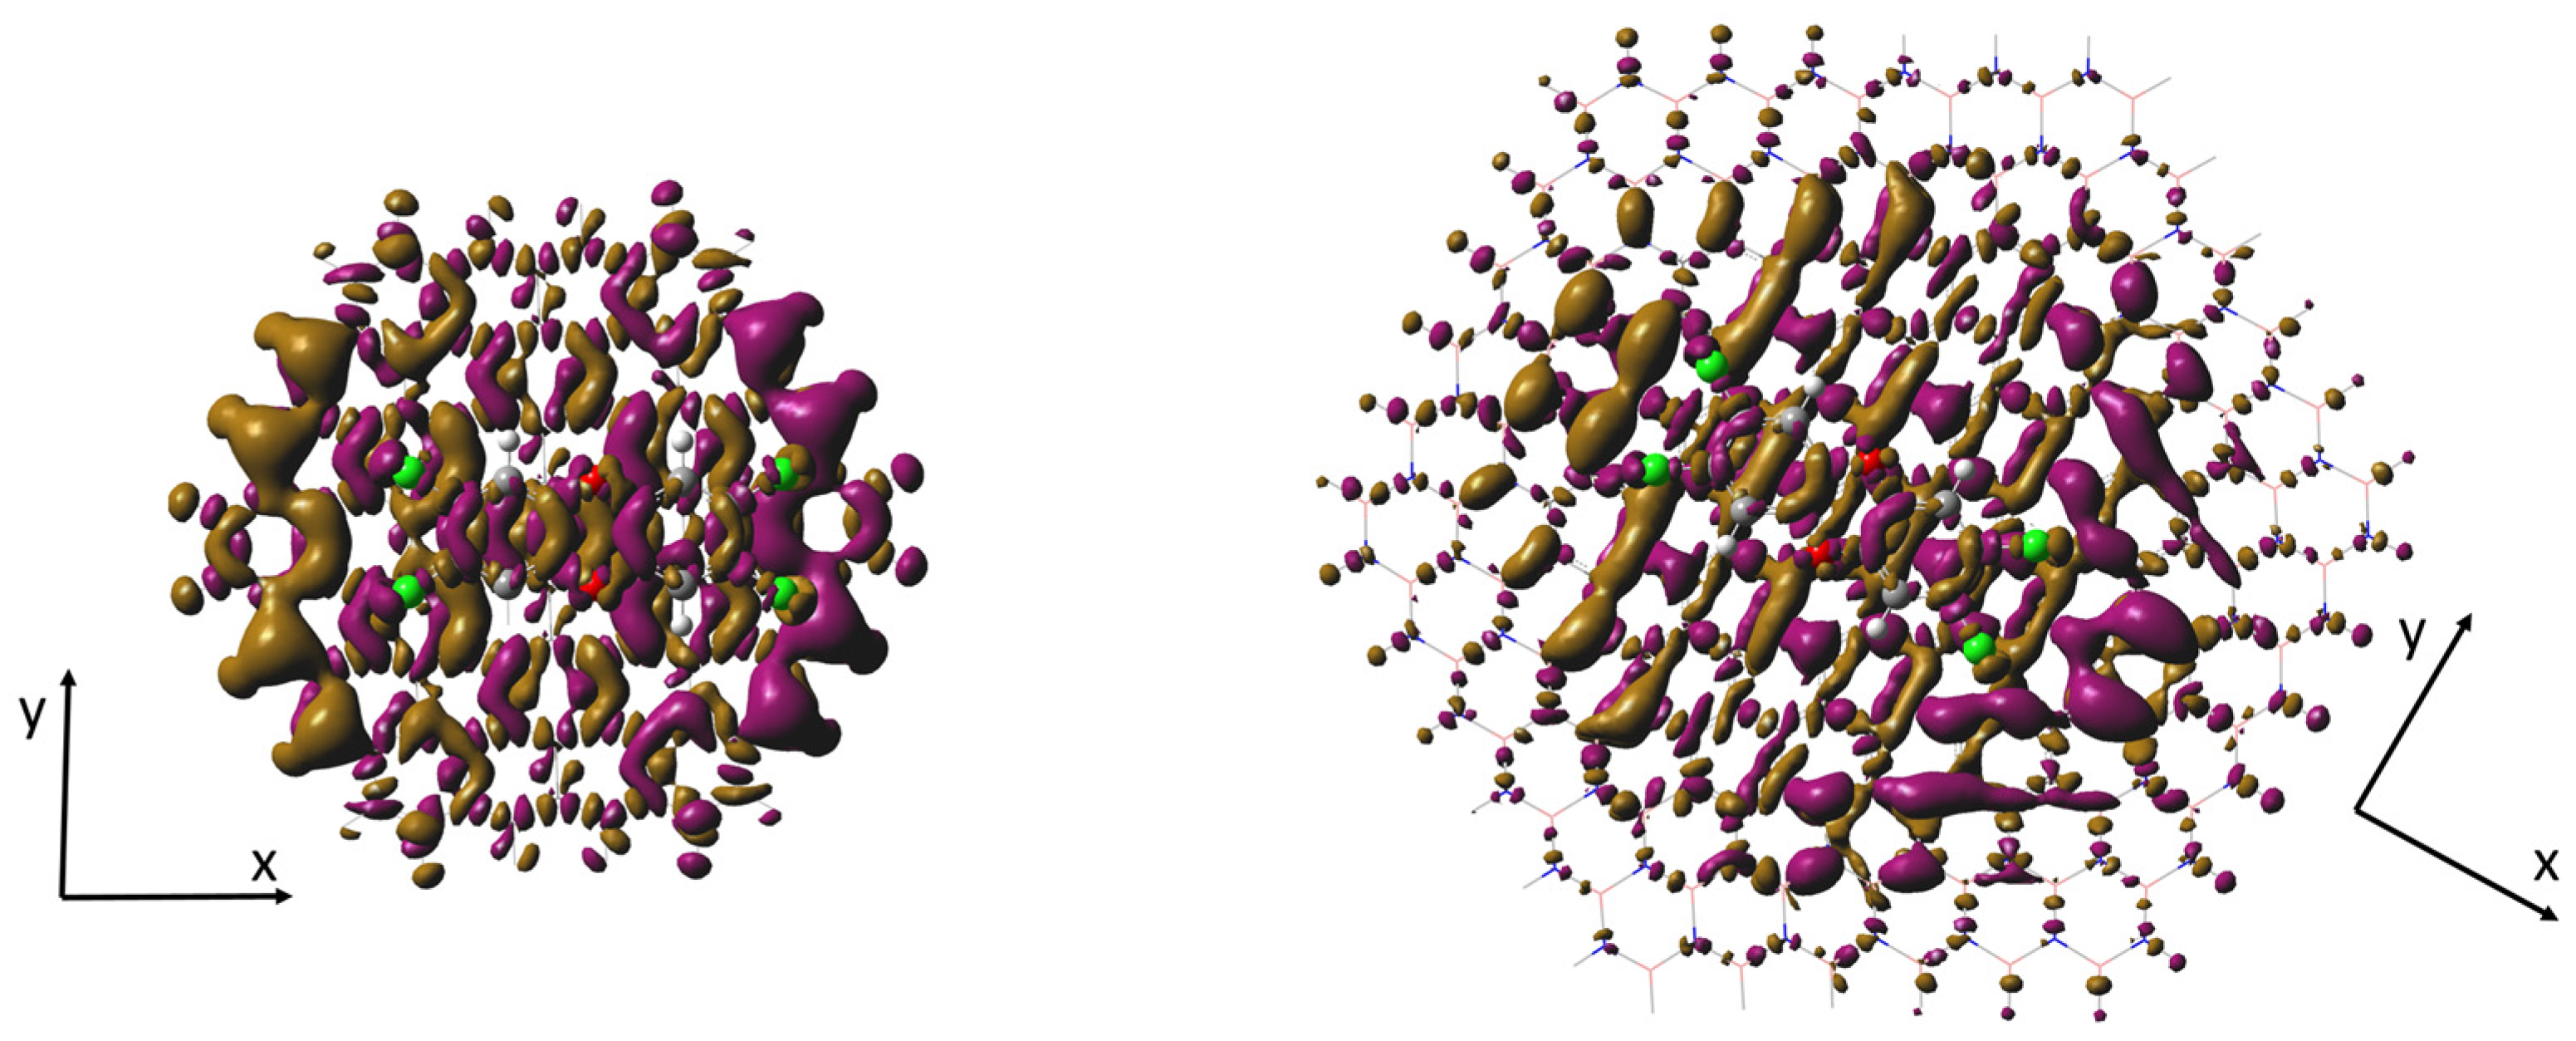
2.3. Real Space Representation of Electric Polarizabilities

The real-space visualization of the linear optical response of the surfaces allows for the characterization of the regions where this response is larger. The localization of a strong optical response within the carbon nanoislands of h-BNCs is well known and has recently been exploited to simulate the Raman enhancement of a single water molecule adsorbed on a pyrene nanoisland embedded in an h-BN sheet [81]. However, the magnitude of the Raman enhancement depends on a physical property—in particular, the frequency-dependent polarizability, α ω , which is expected to increase dramatically when the system is subjected to an electromagnetic perturbation that coincides with (resonance) or is close to (pre-resonance) an electronic excitation. In this case, the excitation may involve the electrons of the molecule, those of the surface or a charge-transfer process between the two. Therefore, the real-space representation of α ω would be a valuable tool here, providing information about the atoms or bonding regions where the Raman enhancement is expected to be greater.
In this work, intrinsic polarizabilities, first introduced by Van Alsenoy et al. [93], were used for the real-space representation of α ω and to understand the Raman enhancement in the different complexes and at different excitation wavelengths. Intrinsic polarizabilities avoid a well-known problem of the origin dependence of distributed polarizabilities, which makes it difficult to understand any partitioning of total polarizabilities into atomic polarizabilities or their real-space representation. For this reason, Otero et al. implemented a widely applicable scheme to obtain maps of intrinsic polarizability density distributions α σ σ i n t r r by summing over a set of atoms [94]:
α σ σ i n t r r = A w A r r σ R A σ ρ r ε σ
where r σ and R A σ represent the respective direction σ (x, y or z) of r or the atom A . ρ , i.e., the electron density, is differentiated with respect to a static uniform electric field in the σ direction, indicated as ε σ in Equation (8). w A r is the weight of the atom A at r , defined by the atomic partitioning scheme employed. Specifically, Otero et al. used a Fractional Occupation Hirsfeld-I (FOHI) scheme [95] to compute these weights, since the distributions obtained expose a more continuous behavior compared to the widely known Quantum Theory of Atoms in Molecules (QTAIM) approach. If none of the directions is preferred, the isotropic polarizability ( α x x i n t r r + α y y i n t r r + α z z i n t r r / 3 ) at each point of the molecular space is more convenient, as was considered in this study.
In order to compare the changes induced by two interacting systems (the model surface and the molecules considered in this work), one can define an interacting intrinsic polarizability ( α i n t r r ) by simply replacing the electron density, ρ , with a BSSE-corrected deformation density [76],
ρ = ρ S M ρ S ρ M
obtaining an equivalent expression to Equation (8).

2.4. Computational Details

Geometry optimization and vibrational analysis of the molecule–surface complexes were carried out using Gaussian16 [96]. Optimized geometries and ground state energies and electron densities for the EDA were obtained at the DFT level with the M06-2X functional in combination with the 6-311G(d,p) basis set. This is an appropriate functional for the study of aromatic systems such as those considered in this work. The EDA analysis was performed with the EDA-NCI program [97].
Time-dependent density functional theory (TDDFT), as implemented in Gaussian16, was used to characterize the electronic transitions with larger oscillator strengths in the complexes. Afterwards, using a custom Fortran utility, the transition density (TD) and the ground-to-excited-state density difference (DD) were generated for each optically active mode from the excitation and deexcitation coefficients obtained after the solution of the Casida’s equation. Plots of the TDs and DDs were drawn using Gaussview 6.0 [98]. The excitation wavelengths of these transitions were then selected to calculate the frequency-dependent polarizabilities at pre-resonance conditions using the coupled perturbed Kohn–Sham theory (CPDFT) and the corresponding Raman tensors for the vibrational modes of the adsorbed molecules. This information was transferred to another Fortran utility designed to compute the total Raman activities and the molecule and surface components according to Equations (6) and (7). Besides simulations at pre-resonance conditions, excitation wavelengths of laser sources commonly used in SERS experiments and close to the electronic transition wavelengths (488 and 532 nm) of the h-BNC model chosen (see next section) were also considered. Other laser sources, with wavelengths far from these transition wavelengths, were not included since they are expected to lead to small or even negligible Raman enhancements due to the lack of resonance mechanisms. Due to the high computational cost of CPDFT calculations, the basis set employed in this case was reduced to a hybrid basis including 6-31G(d,p) for the molecule and the internal C96 structure and 3-21G for the external boron, nitrogen and hydrogen atoms in the h-BNC surface model. The geometries of the complexes were reoptimized with the new basis set in order to perform vibrational analysis at energy minima. To verify that the reduction in the basis set does not significantly affect the electronic spectra of the complexes and, therefore, the rest of the analysis, the TDDFT excitation energies and oscillator strengths were compared with those obtained with the 6-311G(d,p) basis set.
The Raman spectra were plotted using the Gabedit software [99] with Lorentzian line shapes with a half-height width of 5 cm−1. To simplify the analysis, the Raman spectra presented in this work for the complexes include only the signals corresponding to vibrations within the TCDD and TCDF molecules. In order to identify these vibrations, the atomic weights for the different vibrations were calculated, and only those vibrations where the weight of the molecule was greater than 50% were considered. Afterwards, the vibrational modes that give rise to the most intense peaks in the Raman spectra of the complexes were matched to those of the isolated molecules by comparing their symmetry features and atomic displacements.
Intrinsic polarizabilities were calculated using CPDFT and the POLACUBE program [94]. The real-space representations of these polarizabilities were performed using the Chemcraft visualization software [100]. Fragment polarizabilities were also calculated to compare the polarizability of the isolated molecules with that of the adsorbed molecules. To avoid the coordinates’ origin and basis set dependences of the fragment polarizabilities, the calculations were performed with the geometry, the coordinates’ origin and the basis set of the complex, even for the isolated molecules, the latter with the help of the counterpoise method [101] (more details about the calculation of fragment polarizabilities are available elsewhere [74]).

3. Results

3.1. Energetic Stability of the Complexes

As mentioned in the Section 1, TCDD is the most toxic form of polychlorinated dibenzodioxins. In fact, it is the POP with the highest toxicity index reported and the most exhaustively studied both experimentally and theoretically. This is the reason why it has been selected for this study. The reason for also including TCDF is that it belongs to another family of POPs, polychlorinated dibenzofurans, which are structurally similar to polychlorinated dibenzodioxins, but with less toxicity. TCDF also represents the most toxic form of this family of POPs.
The complexes analyzed are depicted in Figure 1. They correspond to the stable conformations of TCDD and TCDF molecules adsorbed on a confined graphene nanodisk of ninety-six carbon atoms (C96) surrounded by a string of borazine rings. This model of h-BNC is referred to as BNC96 and presents a lower symmetry (D3h) than the C96 carbon nanodisk (D6h). In previous studies comparing the interaction energies of aromatic molecules with carbon nanodisks of increasing size [88,102], the C96 carbon structure was shown to provide interaction energies close to those found between an infinite graphene sheet and molecules of a similar size to TCDD and TCDF. It must also be noted that the BNC96 structure was fully relaxed during the calculations of the adsorption complexes, resulting in a significant bending of its structure. Selected parameters reflecting the relative disposition of TCDD and TCDF on the BNC96 can be found in the Supplementary Material (Figure S8). The geometrical parameters of the molecules, namely, bond distances, bond angles and dihedral angles, slightly change upon adsorption on the surface. A full list of these parameters for the isolated molecules and for the molecules adsorbed on BNC96 can be found in the Supplementary Material (Table S2).
The interaction energy and its different components are collected in Table 1 for the complexes shown in Figure 1. For the sake of comparison, the same data previously obtained for complexes formed by TCDD and TCDF adsorbed on a “pure” C96 carbon nanodisk are included in Table 1 [86]. As can be observed from these data, the external borazine rings have little influence on the interaction of the pollutants with the internal carbon nanodisk. Thus, neither the total interaction energy nor its components display significant differences between C96 and BNC96. By far, the most important contribution to the formation of these complexes is the dispersion energy. Accordingly, the pollutants and the surfaces adopt stacking conformations with a molecule–surface distance inversely proportional to the magnitude of the interaction (3.2 and 3.3 Å for TCDD and TCDF, respectively). Moreover, the slightly lower interaction energy of the complexes formed with BNC96 with respect to C96 might be related to the bent structure adopted by the former, providing a more favorable balance between the first-order energies (electrostatic and Pauli), since the polarization energy (induction + dispersion) is practically the same on both surfaces.

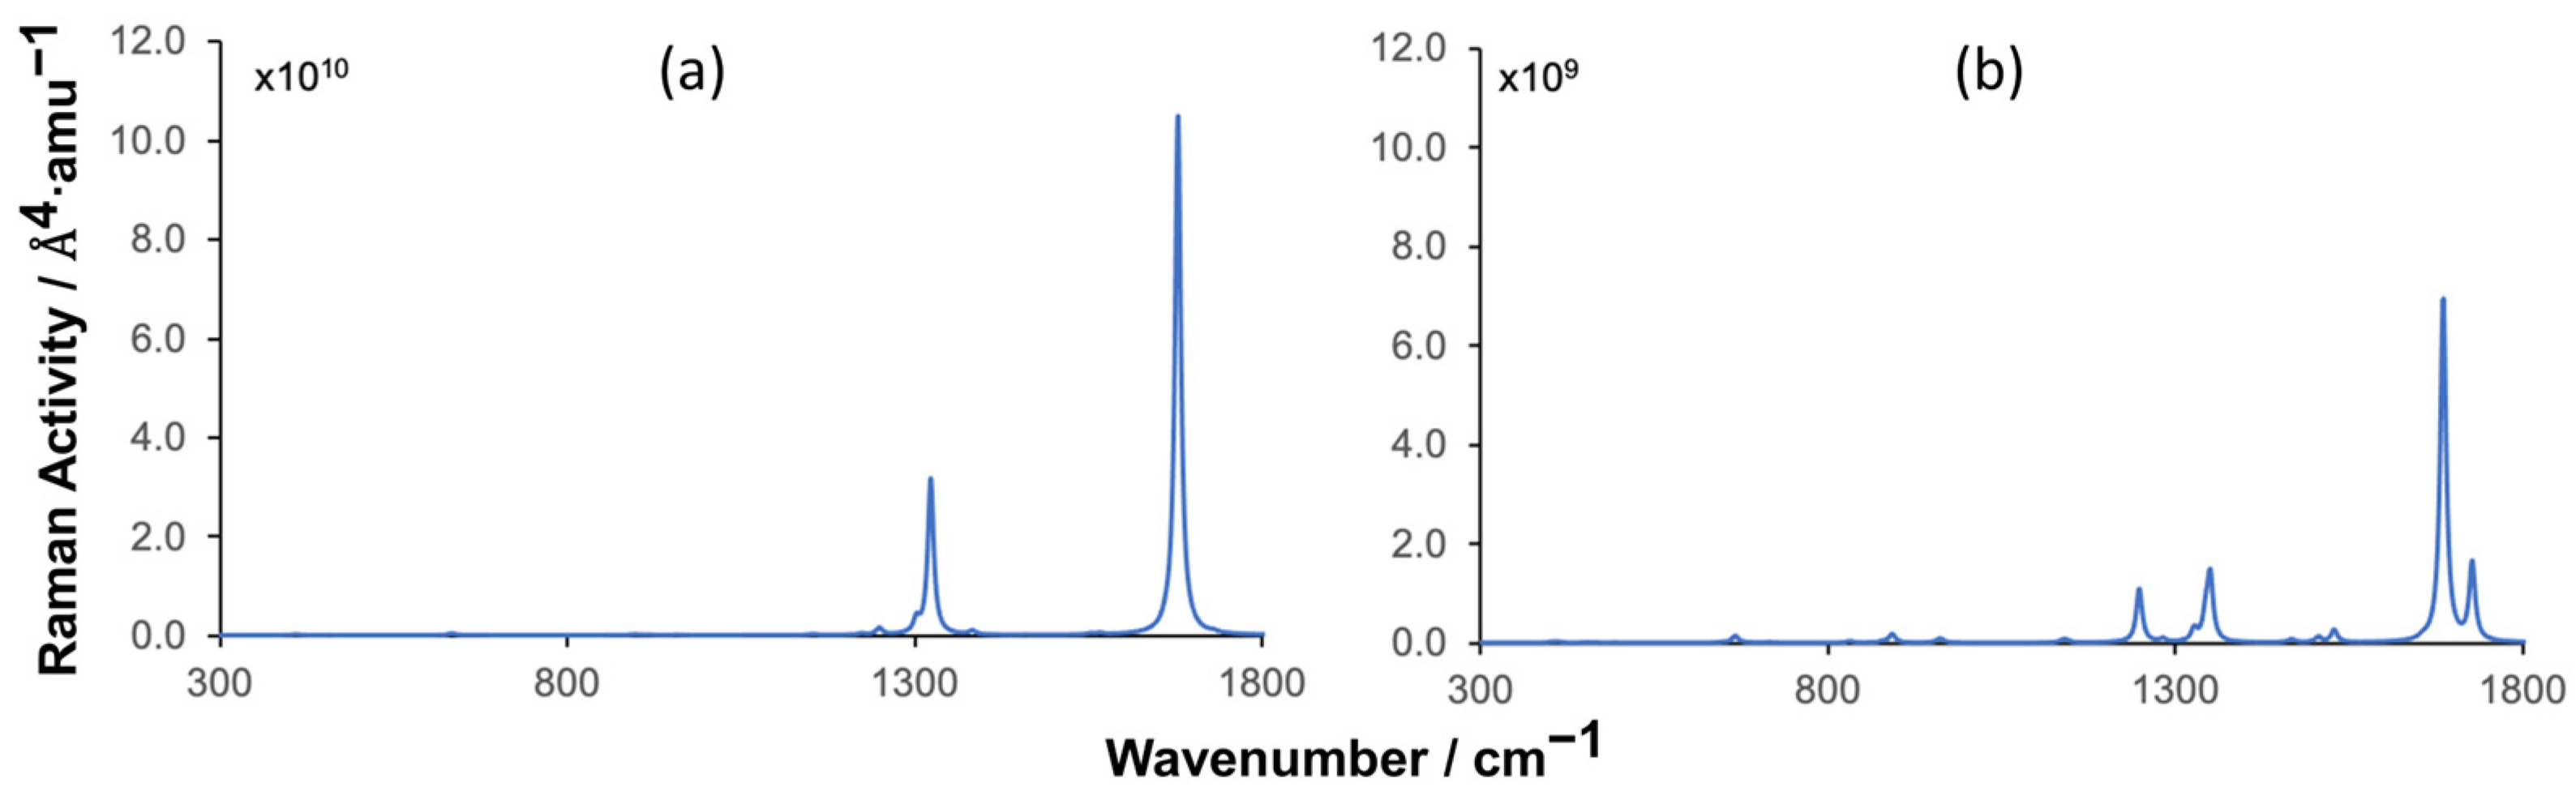
3.2. Static Raman Spectra

Raman spectra obtained under static conditions for the isolated molecules and for the molecules adsorbed on BNC96 are shown in Figure 2. The spectrum of isolated TCDD is dominated by five peaks at 1299, 1341, 1566, 1675 and 1691 cm1. Vibrations associated with these peaks correspond to ring vibrations parallel to the molecular plane. It can be observed that these frequencies are shifted in the BNC96-TCDD complex by 4, −17, −12, 4 and 4 cm1, respectively. A deeper analysis of these vibrational modes in the complex reveals an important contribution of the surface atoms, with weights of 57% and 34% for the most intense peaks at 1302 and 1679 cm1, respectively. Due to this strong vibrational coupling with the surface, the Raman activity of these modes is enhanced in the complex, reaching an enhancement factor of 10 for the signal at 1679 cm1, even when the resonance mechanisms (electromagnetic and charge transfer) are omitted. Moreover, a new peak arises in the spectrum of the complex with a significant intensity at 1662 cm−1, which corresponds to a Raman inactive mode in the isolated molecule at 1658 cm−1. A full list of frequencies and Raman activities for the vibrational modes whose Raman activities are greater than 10 Å4·amu−1 in the isolated molecules or in the molecules adsorbed on the BNC96 model is included as Supplementary Material (Table S1).
The spectrum of the isolated TCDF is dominated by four peaks at 1326, 1349, 1531 and 1727 cm1, which correspond to ring vibrations similar to those observed in TCDD. It can be observed that these frequencies are slightly shifted in the BNC96-TCDF complex by 1, 1, −3 and 0 cm−1, respectively. Due to the partial loss of symmetry in TCDF (C2v) with respect to the centrosymmetric TCDD (D2h), the Raman activities of the active modes in the isolated molecule are larger than those in TCDD, and consequently, the Raman intensities in the spectrum grow. Interestingly, the Raman activities of all active modes except for one (1685 cm1) lessen when TCDF is adsorbed on BNC96. It can be observed in Figure 2 that the peak at 1685 cm1, which shows a low intensity in the spectrum for the isolated molecule, is largely enhanced in the spectrum of the complex. It can also be deduced from these spectra that the intense peak in the complex corresponds to the superposition of two vibrational modes with scarce activity in the isolated molecule. The reason for the significant Raman enhancement of these modes in the complex is, as in the case of TCDD, the large vibrational coupling with the surface, with contributions of 62% and 42% of the surface atoms, respectively. As mentioned above, the Raman activity of the remaining modes decreases in the complex with respect to the isolated molecule; in these cases, the vibrational coupling is much lower, with contributions from the surface atoms that never exceed 5%.
In previous works, the static Raman spectra of aromatic molecules were found to be consistent with the electric polarizability changes experienced upon stacking interaction with a carbon surface [74,75]. Therefore, excluding the two modes with strong vibrational coupling with the surface, the decrease in the Raman activity in TCDF should stem from a decrease in the polarizability of the molecule in the complex. In order to confirm that, the polarizability tensor and the isotropic polarizability of the molecules isolated and adsorbed on BNC96 have been calculated and compared in Table 2.
The results in Table 2 confirm that the significant decrease in the Raman activity of TCDF upon adsorption on BNC96 is mainly associated with a decrease in its polarizability along the in-plane directions ( α x x and α y y ). These are the relevant components of the polarizability due to the in-plane character of the modes (ring vibrations) observed in the spectrum. In addition, it can be seen that despite the increase in the polarizability along the perpendicular direction ( α z z ), the isotropic polarizability is still significantly smaller in the complex. A nice pictorial view of this result is provided by Figure 3, which shows the Hirshfeld-based total and interacting intrinsic polarizabilities of TCDD and TCDF. Looking first at the isolated molecules (Figure 3a,c), it is obvious that the most polarizable regions, represented by orange lobes, are systematically centered on chlorine atoms due to several factors: they occupy peripheral positions and are singly bonded to an atom uniquely, unlike the carbon atoms; their electron density, presumably coming from lone electron pairs, can be more expanded and accessible to the effect of an electric field; and finally, they are larger than the rest of the atoms according to the atomic radius scale. The second-most polarizable regions are centered on oxygen atoms, since they also accumulate an important fraction of the electron density on lone pairs, as do chlorine atoms, but are considerably smaller. Less polarizable regions are centered on carbon atoms, due to the absence of lone pairs, their smaller atomic size and the fact that they are normally positively charged, in contrast to more electronegative atoms such as oxygen and chlorine. The plots also reflect polarizability density uniformly distributed along the rings, characteristic of multicenter electron delocalization in aromatic systems. Regarding the molecules interacting with BNC96 (Figure 3b,d), the most polarizable regions previously commented on (corresponding to lone pairs of chlorine and oxygen atoms) are systematically the regions with a greater reduction in polarizability (in grey), in contrast with bonded regions such as C−Cl, C−O or C−C. Curiously, this effect is highly localized, since multicenter electron delocalization seems to be negatively affected, in view of the grey lobes found inside the rings. Therefore, the interaction with the surface can locally boost the aforementioned bonds to the detriment of reducing lone pairs and the multicenter electron delocalization of the molecule.
In summary, the results obtained here for TCDD and TCDF reflect that the molecule–surface vibrational coupling is a key factor for the interpretation of the static Raman spectra, inducing a significant Raman enhancement in those vibrational modes with a large contribution of the surface atoms. In contrast, the strong stacking interaction with the surface leads to a general decrease in the polarizability of the adsorbed molecules, which is reflected by a reduction in the Raman activity as long as the molecule–surface vibrational coupling is small, as already observed in previous works for different carbon allotropes [74,75].

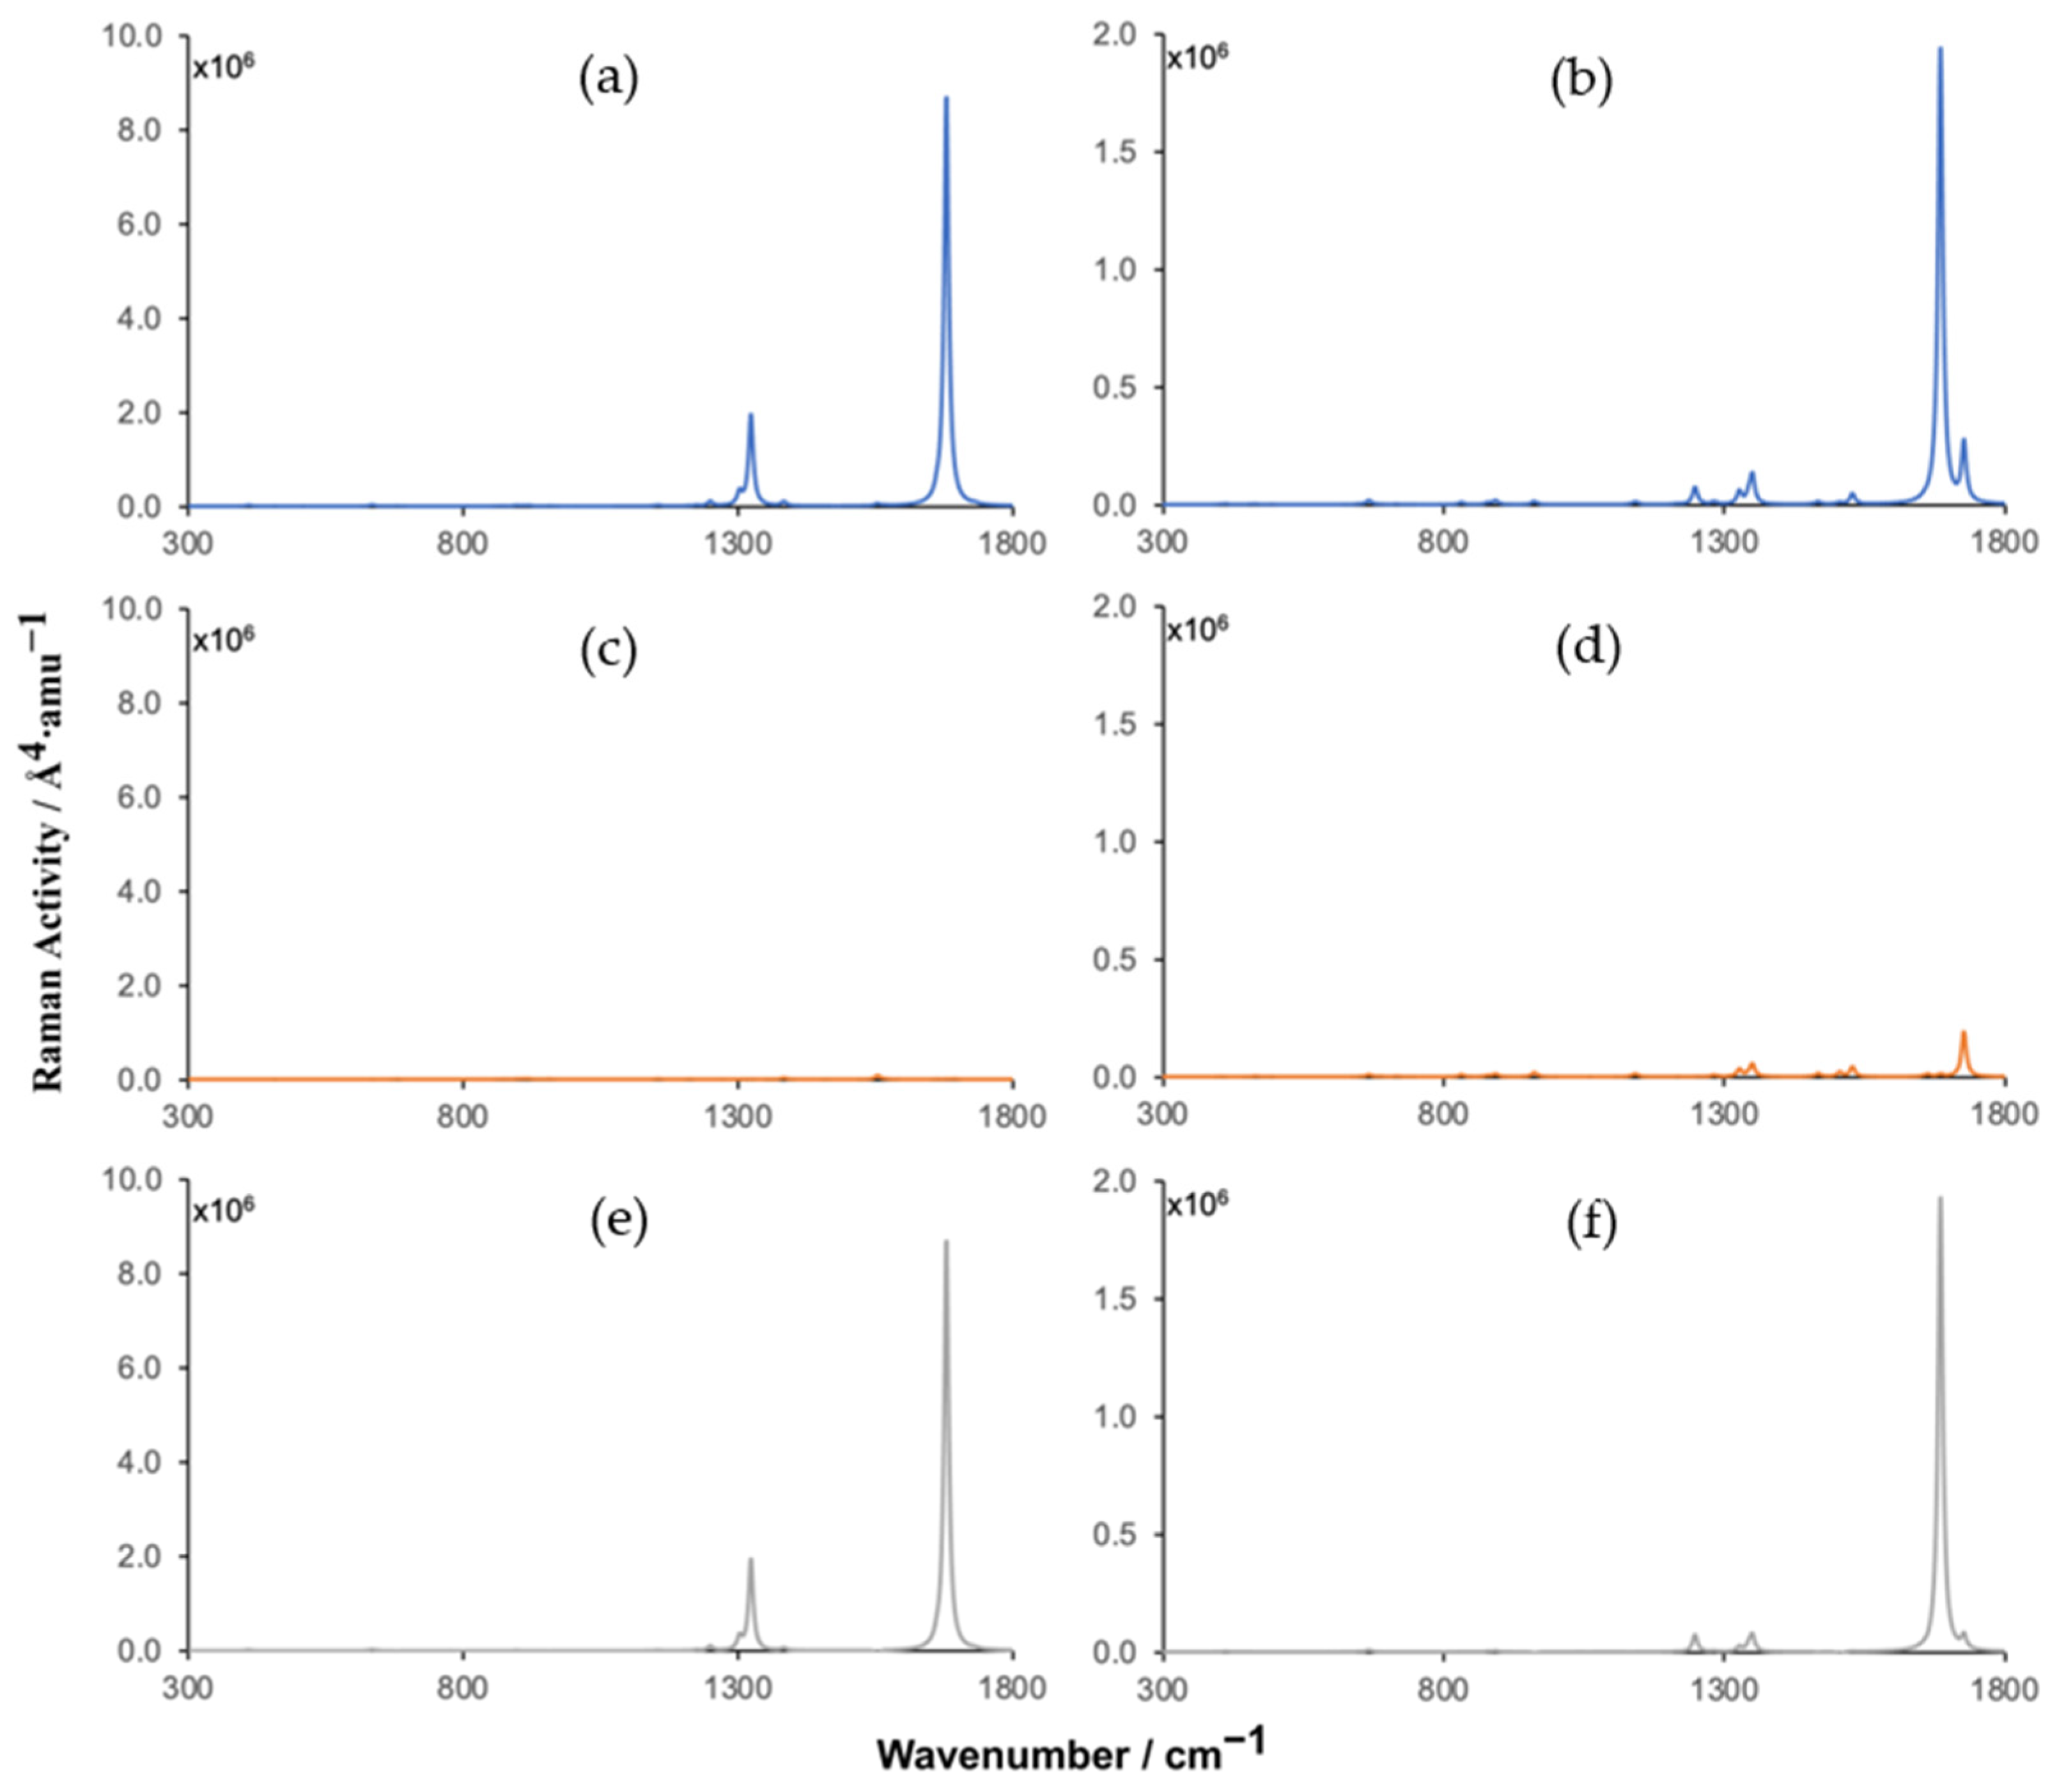
3.3. Raman Spectra under Pre-Resonance Conditions and Laser Wavelengths

The characterization of the electronic transitions from the ground state to the different excited states in the adsorption complexes is the first step in the simulation of pre-resonance Raman spectra. Subsequently, excitation wavelengths near those corresponding to the most intense transitions are included in the calculation of frequency-dependent polarizabilities and the corresponding Raman activities. In this case, the electronic absorption spectra for the isolated BNC96 structure and for the complexes of Figure 1 were simulated using the results obtained from TDDFT calculations (see Figure S1 in the Supplementary Material). The spectrum of BNC96 shows a very intense band around 513.6 nm, corresponding to two degenerate electronic transitions, x-polarized and y-polarized, respectively, with oscillator strengths of 2.560. These transitions are significantly stronger than those found for C96, where the oscillator strength was found to be 1.864 [74,75]. In addition, the absorption band in BNC96 is red-shifted with respect to C96 (457 nm) [74,75], bringing this band closer to the most commonly used laser source in SERS experiments (532 nm). In the complexes, this band is even more red-shifted to 518.8 nm and 518.0 nm for BNC96-TCDD and BCN96-TCDF, respectively, and corresponds, due to the loss of symmetry with respect to the isolated surface, to two quasi-degenerate electronic transitions with oscillator strengths of 2.368 and 2.313 for BNC96-TCDD and 2.364 and 2.286 for BNC96-TCDF.
The analysis of the DDs for the electronic transitions involved in these bands allows for discarding a significant charge transfer between the surface and the molecule, confirming that the excitations mainly implicate electrons of the surface. The DDs obtained for the x-polarized electronic excitation in C96-TCDD and BNC96-TCDD complexes are represented in Figure 4. Differences between the DD distribution in C96 and BNC96 are related to the different symmetries of the surface models, D6h and D3h, respectively. As can be observed, the optical response is mainly located on the carbon nanodisk with a residual contribution from the borazine rings. This confinement of the optical response within the carbon structures in h-BNCs has been previously observed and investigated at a theoretical level [81,84]. Thus, the number of BN strings required to confine the optical response in a phenyl ring embedded in an h-BNC nanodisk with D3h symmetry was found to be only two (a single string of borazine rings) [81], so enlarging our surface model BNC96 with more strings of borazine rings is not expected to significantly modify its optical response. The y-polarized excitation in BNC96-TCDD and excitations in the BNC96-TCDF complex provide identical information and can be seen in Figure S2 of the Supplementary Material.
On the other hand, the TDs for the same electronic excitations represented in Figure 4 are shown in Figure 5. Note that the distribution of the TD reflects the polarization of the electronic mode (see the differences between x-polarized and y-polarized excitations in Figure S3 of the Supplementary Material). The plots in Figure 5 denote a highly polarized electronic mode that is strongly localized within the carbon structure. This high polarization is a characteristic feature of collective electronic excitations such as those involved in molecular plasmons, where a large transition dipole moment spans the entire system. Conversely, a weak local polarization can also be observed within each individual ring at the molecule–surface interaction region. This local polarization opposes the global polarization of the mode. Furthermore, TD plots in the BNC96 complexes also reflect the low participation of the borazine rings and the molecule in the optical response, confirming its local confinement within the carbon nanodisk.
As mentioned above, the dominant ground-to-excited-state electronic transitions in the BNC96-TCDD and BNC96-TCDF complexes are centered at 518.8 nm and 518.0 nm, respectively, involving electrons localized on the carbon nanodisk. These wavelengths might be used as a reference to simulate the Raman spectra under pre-resonance conditions. However, the computational cost of these calculations forces the use of a lower basis set, as mentioned in the Section 2.4. TDDFT calculations show that the dominant ground-to-excited-state electronic transitions are slightly blue-shifted, with the lower basis set to 514.0 nm and 514.2 nm for the BNC96-TCDD and BNC96-TCDF complexes, respectively. The oscillator strengths for these excitations are very similar to those obtained with the larger basis set. In order to avoid numerical problems in solving the CPDFT equations at resonance conditions, a detuning of ~2 nm in the excitation wavelength with respect to the resonance wavelength was applied to simulate pre-resonance Raman spectra [103]. In addition, Raman spectra were also simulated using, as electromagnetic perturbations, typical laser wavelengths (488 nm and 532 nm) employed in SERS experiments. These are the most interesting spectra, as they give us a more realistic prediction of the expected Raman enhancement under experimental conditions.
The spectra obtained under incident wavelengths blue-shifted by 2 nm with respect to resonance are shown in Figure 6. These spectra are represented with the same scale for the Raman activity as in the static spectra, only changing the multiplicative factors indicated next to the axis. Comparing the factors of the pre-resonance spectra with those of the static spectra, it can be observed that the Raman enhancement in the TCDD and TCDF complexes reaches 108 and 107, respectively. Practically the same enhancements are observed under incident wavelengths red-shifted 2 nm with respect to resonance (see Figure S6).
Since the electromagnetic response is mainly located on the surface, those vibrational modes of the molecules with the largest vibrational couplings to the surface atoms are expected to display the largest Raman enhancements. It can be observed that the largest Raman enhancements are indeed found for signals that were already enhanced in the static spectra: for TCDD at 1302 and 1679 cm1 and for TCDF at 1685 cm1, which are precisely those vibrational modes with the highest vibrational coupling to the surface. On the other hand, noticeable enhancements are also found at 1248 cm1 and 1350 cm1 for BNC96-TCDF, which correspond to signals associated with vibrational modes with a small vibrational coupling to the surface, with a weight of the surface atoms of 1.4% and 0.4%, respectively).
Raman spectra obtained under an excitation wavelength of 532 nm are shown in Figure 7. The spectra obtained under an excitation wavelength of 488 nm are shown in Figure S7 of the Supplementary Material. Both lead to the same conclusions, so only the results obtained with 532 nm will be discussed here. In this case, the hypothetical spectra obtained by neglecting the contribution to the Raman activity of the surface atoms or the contribution of the molecule are also shown. They provide a pictorial view of the effect of the molecule–surface vibrational coupling on the Raman spectra of the pollutants.
There are clear similarities between the pre-resonance Raman spectra discussed above and those shown in Figure 7. Thus, the shape of the spectra is quite similar, with the same enhanced peaks. Since the laser wavelength is significantly red-shifted with respect to resonance (about 18 nm) the Raman enhancement decreases with respect to the pre-resonance spectra, although it is still large, with enhancements around 104 for both molecules, being slightly larger for TCDD. As can be inferred from the molecule–surface decomposition of the Raman spectrum of BNC96-TCDD, the largest enhancement comes from the surface contribution. The enhancement associated with the molecule lies in a lower scale, so no signals can be observed in Figure 7c. On the contrary, in the spectrum of BNC96-TCDF (Figure 7b), both the molecule and the surface contributions lie in the same scale, and depending on the vibrational mode, the enhancement is mainly due to one or the other (see Figure 7d,f). For instance, the contribution of the molecule is clearly dominant at 1727 cm1. This is due to the fact that, in this complex, the molecule–surface vibrational coupling of some modes is significantly lower than that in the TCDD complex. Anyway, the enhancement of the most intense peak of the spectrum, located at 1685 cm1, is mainly due to the contribution of the surface atoms (Figure 7f). As mentioned in the previous section, this signal is already enhanced in the static spectrum due to the strong vibrational coupling with the surface atoms of the modes associated with it.
Finally, it is interesting to comment on the effect of using laser sources polarized in parallel or perpendicular directions to the h-BNC surface. Given that the two electronic modes responsible for the Raman enhancement factors discussed above are x-polarized and y-polarized, respectively, and that these directions correspond to the plane of BNC96, a perpendicularly polarized laser source is expected to lead to minimum Raman enhancement factors. Conversely, laser excitations polarized in a parallel direction to the h-BNC surface will lead to maximum Raman enhancement factors.

4. Conclusions

In this work, the ability of 2D hybrid h-BNC structures to act as substrates for the Raman-enhancement of dioxins and dibenzofurans has been theoretically investigated. First, the interaction energies obtained for the stacking complexes formed between two model compounds, TCDD and TCDF, and a model h-BNC surface, BNC96, show the large affinity of the substrates for these families of persistent organic pollutants. The most important contribution to the energetic stabilization of these complexes is the dispersion interaction, as previously found for pure carbon 2D structures.
Under static conditions, the Raman activity in the BNC96-TCDF complex shows a general decrease as a consequence of the decrease in the polarizability of the molecule upon the adsorption by the surface. The only exception is the peak located at 1685 cm−1, which is associated with vibrational modes of the molecule with a strong vibrational coupling with the surface atoms. On the other hand, the Raman activity in the BNC96-TCDD complex is dominated by the large vibrational coupling between the molecule and the surface atoms observed for the most active modes of TCDD, which overpass the general decrease in its polarizability, leading to a general enhancement of the Raman spectrum.
The transition electron densities and ground-to-excited-state density differences obtained for the most active electronic modes of the complexes reflect that these modes correspond to collective electronic excitations characteristic of molecular plasmons, strongly confined within the carbon nanodisk of the BNC96 structure. Under excitation wavelengths close to resonance with these active electronic modes, large Raman enhancement factors of 108 and 107 are obtained for some vibrational modes of TCDD and TCDF, respectively. Under laser excitation wavelengths commonly used in SERS experiments, significant Raman enhancement factors around 104 are also obtained, being slightly larger for TCDD. Due to the large vibrational coupling with the surface atoms in TCDD, its Raman spectrum displays a general enhancement mainly due to the surface contribution. In TCDF, some active vibrational modes display a small vibrational coupling with the surface, so the signals associated with these modes also show an important contribution of the molecule to the Raman enhancement.
One of the main disadvantages of using 2D materials as SERS substrates is the lack of strong resonance mechanisms, namely, electromagnetic and charge transfer excitations, which entails a reduced sensitivity with respect to 3D metal-based substrates. The large Raman enhancements reported in this theoretical work demonstrate that the strong confinement of the electromagnetic response and its high modulation within the visible range in the carbon domains of h-BNCs can lead to a significant increase in sensitivity with respect to other 2D substrates such as graphene.

Supplementary Materials

The following supporting information can be downloaded at: https://www.mdpi.com/article/10.3390/chemosensors11050266/s1, Figure S1: Main electronic adsorption band obtained for BCN96-TCDD and BCN96-TCDF complexes (solid lines) compared to that obtained for BCN96 (dashed lines). The excitation wavelengths employed as a reference for the calculation of pre-resonance Raman spectra are indicated by vertical lines in red; Figure S2: Ground-to-excited-state density differences (DDs) in the BNC96-TCDD and BNC96-TCDF (right) and C96-TCDD and C96-TCDF (left) complexes. Isosurface value is 4 × 10⁻⁴; Figure S3: Transition densities (TDs) in the BNC96-TCDD and BNC96-TCDF (right) and C96-TCDD and C96-TCDF (left) complexes. Isosurface value is 1 × 10⁻⁴; Figure S4: Simulated static Raman spectra of TCDD (left) and TCDF (right) adsorbed on BNC96 (first row) and hypothetical spectra obtained from the contributions to the Raman activity of the molecule (second row); Figure S5: Simulated pre-resonance Raman spectra of TCDD (left) and TCDF (right) adsorbed on BNC96 obtained, respectively, with excitation wavelengths of 512.0 and 512.2 nm (first row) and hypothetical spectra obtained from the contributions to the Raman activity of the molecule (second row); Figure S6: Simulated pre-resonance Raman spectra of TCDD (left) and TCDF (right) adsorbed on BNC96 obtained, respectively, with excitation wavelengths of 516.0 and 516.2 nm (first row) and hypothetical spectra obtained from the contributions to the Raman activity of the molecule (second row); Figure S7: Simulated Raman spectra of TCDD (left) and TCDF (right) adsorbed on BNC96 obtained with an excitation wavelength of 488 nm (first row) and hypothetical spectra obtained from the contributions to the Raman activity of the molecule (second row) and the surface (third row); Figure S8: Some selected parameters reflecting the relative disposition of TCDD and TCDF on BNC96. Distances in Å and torsional angles in degrees. The distances above represent: the distance between the geometrical centers of the molecule and surface (r), the projection of r on the surface plane (t) and the projection of r on a perpendicular axis to the molecule and the surface (s). The torsional angle below (θ) represents the angle formed by the C2 symmetry axis of the molecule and the surface; Table S1: Vibrational frequencies (in cm−1) and Raman activities (Å4·amu−1) for the isolated molecules and the molecules adsorbed on BNC96. The values corresponding to the adsorbed molecules are given in parentheses with respect to those of the isolated molecules; Table S2: Geometrical parameters of TCDD and TCDF adsorbed on BNC96 and isolated. Distances in Å; bond angles and dihedral angles in degrees.

Author Contributions

Conceptualization, M.M. and N.R.-B.; methodology, M.M., N.R.-B. and N.O.; software, M.M. and N.O.; validation, R.A., M.M. and N.R.-B.; formal analysis, R.A., N.O., M.M. and N.R.-B.; investigation, R.A., M.M. and N.R.-B.; data curation, R.A.; writing—original draft preparation, R.A., N.O., M.M. and N.R.-B.; writing—review and editing, R.A., N.O., M.M. and N.R.-B.; supervision, M.M. and N.R.-B. All authors have read and agreed to the published version of the manuscript.

Funding

This research was funded by Xunta de Galicia, grant number GRC2019/24.

Institutional Review Board Statement

Not applicable.

Informed Consent Statement

Not applicable.

Data Availability Statement

The data presented in this study are available on request from the corresponding author. The data are not publicly available due to privacy constraints.

Acknowledgments

N.R-B. thanks Xunta de Galicia for the postdoctoral grant. N.O. thanks the University of Vigo for the postdoctoral grant within the “Retención de Talento Investigador da Universidade de Vigo 2020” program.

Conflicts of Interest

The authors declare no conflict of interest.

References

  1. Van Den Berg, M.; Birnbaum, L.; Bosveld, A.T.C.; Brunström, B.; Cook, P.; Feeley, M.; Giesy, J.P.; Hanberg, A.; Hasegawa, R.; Kennedy, S.W.; et al. Toxic equivalency factors (TEFs) for PCBs, PCDDs, PCDFs for humans and wildlife. Environ. Health Perspect. 1998, 106, 775. [Google Scholar] [CrossRef]
  2. Van den Berg, M.; Birnbaum, L.; Denison, M.; De Vito, M.; Farland, W.; Feeley, M.; Fiedler, H.; Hakansson, H.; Hanberg, A.; Haws, L.; et al. The 2005 World Health Organization reevaluation of human and Mammalian toxic equivalency factors for dioxins and dioxin-like compounds. Toxicol. Sci. 2006, 93, 223. [Google Scholar] [CrossRef] [Green Version]
  3. World Health Organization. Polychlorinated dibenzo-para-dioxins and dibenzofurans. Environ. Health Criteria. 1989, 88, 1. [Google Scholar]
  4. Polychlorinated Dibenzo-para-dioxins and Polychlorinated Dibenzofurans. IARC Monogr. Eval. Carcinog. Risks Hum. Suppl. 1997, 69, 1.
  5. Schecter, A. (Ed.) Dioxin and Health; Plenum Press: New York, NY, USA; Springer: New York, NY, USA, 1994. [Google Scholar]
  6. Steenland, K.; Bertazzi, P.; Baccarelli, A.; Kogevinas, M. Dioxin revisited: Developments since the 1997 IARC classification of dioxin as a human carcinogen. Environ. Health Perspect. 2004, 112, 1265. [Google Scholar] [CrossRef] [Green Version]
  7. Biswas, G.; Srinivasan, S.; Anandatheerthavarada, H.K.; Avadhani, N.G. Dioxin-mediated tumor progression through activation of mitochondria-to-nucleus stress signaling. Proc. Natl. Acad. Sci. USA 2008, 105, 186. [Google Scholar] [CrossRef] [Green Version]
  8. Wielgosiński, G. The Reduction of Dioxin Emissions from the Processes of Heat and Power Generation. J. Air Waste Manag. Assoc. 2011, 61, 511. [Google Scholar] [CrossRef] [PubMed]
  9. Rappe, C. Dioxins, patterns and source identification. Fresenius J. Anal. Chem. 1994, 348, 63. [Google Scholar]
  10. Merrill, M.L.; Emond, C.; Kimi, M.J.; Antignaci, J.-P.; Bizeci, B.L.; Birnbaum, K.C.L.S.; Barouki, R. Toxicological function of adipose tissue: Focus on persistent organic pollutants. Environ. Health Perspect. 2013, 121, 162. [Google Scholar] [CrossRef] [PubMed] [Green Version]
  11. Regnier, S.M.; Sargis, R.M. Adipocytes under assault: Environmental disruption of adipose physiology. Biochim. Biophys. Acta Mol. Basis Dis. 2014, 1842, 520. [Google Scholar] [CrossRef] [Green Version]
  12. Schrenk, D.; Chopra, M. Dioxins and Polychlorinated Biphenyls in Foods. In Chemical Contaminants and Residues in Food, Woodhead Publishing Series in Food Science, Technology and Nutrition; Schrenk, D., Cartus, A., Eds.; Elsevier: Cambridge, MA, USA, 2017. [Google Scholar]
  13. Beck, H.; Droß, A.; Eckart, K.; Mathar, W.; Wittkowski, R. PCDDs, PCDFs and related compounds in paper products. Chemosphere 1989, 19, 655. [Google Scholar] [CrossRef]
  14. Wiberg, K.; Lundström, K.; Glas, B.; Rappe, C. PCDDs and PCDFs in consumers’ paper products. Chemosphere 1989, 19, 735. [Google Scholar] [CrossRef]
  15. Sany, S.B.T.; Narimani, L.; Soltanian, F.K.; Hashim, R.; Rezayi, M.; Karlend, D.J.; Mahmud, H.N.M.E. An overview of detection techniques for monitoring dioxin-like compounds: Latest technique trends and their applications. RSC Adv. 2016, 6, 55415. [Google Scholar] [CrossRef]
  16. Schecter, A.; Birnbaum, L.; Ryan, J.J.; Constable, J.D. Dioxins: An overview. Environ. Res. 2006, 101, 419. [Google Scholar] [CrossRef]
  17. Behnisch, P.A.; Hosoe, K.; Sakai, S.-I. Bioanalytical screening methods for dioxins and dioxin-like compounds—A review of bioassay/biomarker technology. Environ. Int. 2001, 27, 413. [Google Scholar] [CrossRef]
  18. Torres, M.A.; Barros, M.P.; Campos, S.C.G.; Pinto, E.; Rajamani, S.; Sayre, R.T.; Colepicolo, P. Biochemical biomarkers in algae and marine pollution: A review. Ecotoxicol. Environ. Saf. 2008, 71, 1. [Google Scholar] [CrossRef]
  19. Eichbaum, K.; Brinkmann, M.; Buchinger, S.; Reifferscheid, G.; Hecker, M.; Giesy, J.P.; Engwall, M.; van Bavel, B.; Hollert, H. In vitro bioassays for detecting dioxin-like activity-Application potentials and limits of detection, a review. Sci. Total Environ. 2014, 487, 37. [Google Scholar] [CrossRef]
  20. Beníšek, M.; Kukučka, P.; Giulio Mariani, G.; Suurkuusk, G.; Gawlik, B.M.; Locoro, G.; Giesy, J.P.; Bláha, L. Dioxins and dioxin-like compounds in composts and digestates from European countries as determined by the in vitro bioassay and chemical analysis. Chemosphere 2015, 122, 168. [Google Scholar] [CrossRef]
  21. Du, B.; Liu, A.; Huang, Y. Uncertainty evaluation of the determination of toxic equivalent quantity of polychlorinated dibenzo-p-dioxins and dibenzofurans in soil by isotope dilution high resolution gas chromatography and high resolution mass spectrometry. Chin. J. Chromatogr. 2014, 32, 967. [Google Scholar] [CrossRef]
  22. L’Homme, B.; Scholl, G.; Eppe, G.; Focant, J.F. Validation of a gas chromatography-triple quadrupole mass spectrometry method for confirmatory analysis of dioxins and dioxin-like polychlorobiphenyls in feed following new EU Regulation 709/2014. J. Chromatogr. A 2015, 1376, 149. [Google Scholar] [CrossRef]
  23. Baughman, R.; Meselson, M. An analytical method for detecting TCDD (dioxin): Levels of TCDD in samples from Vietnam. Environ. Health Perspect. 1973, 5, 27. [Google Scholar] [CrossRef] [PubMed]
  24. Schecter, A.; Tiernan, T. Occupational exposure to polychlorinated dioxins, polychlorinated furans, polychlorinated biphenyls, and biphenylenes after an electrical panel and transformer accident in an office building in Binghamton. Environ. Health Perspect. 1985, 60, 305. [Google Scholar] [CrossRef]
  25. Schecter, A.; Ryan, J.J.; Päpke, O.; Ball, M.; Lis, A. Elevated dioxin levels in the blood of male and female Russian workers with and without chloracne 25 years after phenoxyherbicide exposure: The UFA “Khimprom” incident. Chemosphere 1993, 27, 253. [Google Scholar] [CrossRef]
  26. Wei, Y.; Kong, L.-T.; Yang, R.; Wang, L.; Liu, J.-H.; Huang, X.-J. Electrochemical impedance determination of polychlorinated biphenyl using a pyrenecyclodextrin-decorated single-walled carbon nanotube hybrid. Chem. Commun. 2011, 47, 5340. [Google Scholar] [CrossRef] [PubMed]
  27. Wang, M.; Meng, G.; Huang, Q.; Li, M.; Lia, Z.; Tang, C. Fluorescence detection of trace PCB101 based on PITC immobilized on porous AAO membrane. Analyst 2011, 136, 278. [Google Scholar] [CrossRef]
  28. Zhu, C.; Meng, G.; Huang, Q. Vertically aligned Ag nanoplate-assembled film as a sensitive and reproducible SERS substrate for the detection of PCB-77. J. Hazard. Mater. 2012, 211, 389. [Google Scholar] [CrossRef]
  29. Silva, E.; Mascini, M.; Centi, S.; Turner, A.P.F. Detection of polychlorinated biphenyls (PCBs) in milk using a disposable immunomagnetic electrochemical sensor. Anal. Lett. 2007, 40, 1371. [Google Scholar] [CrossRef]
  30. Kurosawa, S.; Aizawa, H.; Park, J.-W. Quartz crystal microbalance immunosensor for highly sensitive 2,3,7,8-tetrachlorodibenzo-p-dioxin detection in fly ash from municipal solid waste incinerators. Analyst 2005, 130, 1495. [Google Scholar] [CrossRef] [PubMed]
  31. Chobtang, J.; De Boer, I.J.M.; Hoogenboom, R.L.A.P.; Haasnoot, W.; Kijlstra, A.; Meerburg, B.G. The need and potential of biosensors to detect dioxins and dioxin-like polychlorinated biphenyls along the milk, eggs and meat food chain. Sensors 2011, 11, 11692. [Google Scholar] [CrossRef] [PubMed] [Green Version]
  32. Centi, S.; Silva, E.; Laschi, S.; Palchetti, I.; Mascini, M. Polychlorinated biphenyls (PCBs) detection in milk samples by an electrochemical magnetoimmunosensor (EMI) coupled to solid-phase extraction (SPE) and disposable low-density arrays. Anal. Chim. Acta 2007, 594, 9. [Google Scholar] [CrossRef]
  33. Wang, S.; Sun, B.; Feng, J.; An, F.; Li, N.; Wang, H.; Tian, M. Development of affinity between target analytes and substrates in surface enhanced Raman spectroscopy for environmental pollutant detection. Anal. Methods 2020, 12, 5657. [Google Scholar] [CrossRef]
  34. Fang, X.; Song, Y.; Huang, Y.; Yang, G.; Han, C.; Li, H.; Qu, L. Two-dimensional MXene modified AgNRs as a surface-enhanced Raman scattering substrate for sensitive determination of polychlorinated biphenyls. Analyst 2020, 145, 7421. [Google Scholar] [CrossRef]
  35. Patrizi, B.; De Cumis, M.S.; Viciani, S.; D’Amato, F. Dioxin and related compound detection: Perspectives for optical monitoring. Int. J. Mol. Sci. 2019, 20, 2671. [Google Scholar] [CrossRef] [Green Version]
  36. Rindzevicius, T.; Barten, J.; Vorobiev, M.; Schmidt, M.S.; Castillo, J.J.; Boisen, A. Detection of surface-linked polychlorinated biphenyls using surface-enhanced Raman scattering spectroscopy. Vib. Spectrosc. 2017, 90, 1. [Google Scholar] [CrossRef] [Green Version]
  37. Potara, M.; Farcau, C.; Botiz, I.; Astilean, S. Detection of Environmental Pollutants by Surface-Enhanced Raman Spectroscopy. In RSC Detection Science; Reddy, S., Arrigan, D., Eds.; Royal Society of Chemistry: Abingdon, UK, 2017. [Google Scholar]
  38. Hou, M.; Huang, Y.; Ma, L.; Zhang, Z. Sensitivity and Reusability of SiO2 NRs@ Au NPs SERS Substrate in Trace Monochlorobiphenyl Detection. Nanoscale Res. Lett. 2015, 10, 444. [Google Scholar] [CrossRef] [PubMed] [Green Version]
  39. Chen, S.N.; Li, X.; Han, S.; Liu, J.H.; Zhao, Y.Y. Synthesis of surface-imprinted Ag nanoplates for detecting organic pollutants in water environments based on surface enhanced Raman scattering. RSC Adv. 2015, 5, 99914. [Google Scholar] [CrossRef]
  40. Jing, L.; Shi, Y.-E.; Cui, J.; Zhang, X.; Zhan, J. Hydrophobic gold nanostructures via electrochemical deposition for sensitive SERS detection of persistent toxic substances. RSC Adv. 2015, 5, 13443. [Google Scholar] [CrossRef]
  41. Lu, Y.; Yao, G.; Sun, K.; Huang, Q. β-Cyclodextrin coated SiO2@Au@Ag core-shell nanoparticles for SERS detection of PCBs. Phys. Chem. Chem. Phys. 2014, 17, 21149. [Google Scholar] [CrossRef]
  42. Bao, Z.Y.; Liu, X.; Chen, Y.; Wu, Y.; Chan, H.L.W.; Dai, J.; Lei, D.Y. Quantitative SERS detection of low-concentration aromatic polychlorinated biphenyl-77 and 2,4,6-trinitrotoluene. J. Hazard. Mater. 2014, 280, 706. [Google Scholar] [CrossRef]
  43. Chen, B.; Meng, G.; Zhou, F.; Huang, Q.; Zhu, C.; Hu, X.; Kong, M. Ordered arrays of Au-nanobowls loaded with Ag-nanoparticles as effective SERS substrates for rapid detection of PCBs. Nanotechnology 2014, 25, 145605. [Google Scholar] [CrossRef]
  44. Li, D.-W.; Zhai, W.-L.; Li, Y.-T.; Long, Y.-T. Recent progress in surface enhanced Raman spectroscopy for the detection of environmental pollutants. Microchim. Acta 2014, 181, 23. [Google Scholar] [CrossRef]
  45. Xia Han, X.; Rodriguez, R.S.; Haynes, C.L.; Ozaki, Y.; Zhao, B. Surface-enhanced Raman spectroscopy. Nat. Rev. Methods Primers 2021, 1, 87. [Google Scholar] [CrossRef]
  46. Tripp, R.A.; Dluhy, R.A.; Zhao, Y. Novel nanostructures for SERS biosensing. Nano Today 2008, 3, 31. [Google Scholar] [CrossRef]
  47. Hudson, S.D.; Chumanov, G. Bioanalytical applications of SERS (surface-enhanced Raman spectroscopy). Anal. Bioanal. Chem. 2009, 394, 679. [Google Scholar] [CrossRef]
  48. El-Ansary, A.; Faddah, L.M. Nanoparticles as biochemical sensors. Nanotechnol. Sci. Appl. 2010, 3, 65. [Google Scholar] [CrossRef] [Green Version]
  49. Sharma, B.; Frontiera, R.R.; Henry, A.-I.; Ringe, E.; Van Duyne, R.P. SERS: Materials, applications, and the future. Mater. Today 2012, 15, 16. [Google Scholar] [CrossRef]
  50. Halvorson, R.A.; Vikesland, P.J. Surface-Enhanced Raman Spectroscopy (SERS) for Environmental Analyses. Environ. Sci. Technol. 2010, 44, 7749. [Google Scholar] [CrossRef]
  51. Ong, T.T.X.; Blanch, E.W.; Jones, O.A.H. Surface Enhanced Raman Spectroscopy in environmental analysis, monitoring and assessment. Sci. Total Environ. 2020, 720, 137601. [Google Scholar] [CrossRef]
  52. Terry, L.R.; Sanders, S.; Potoff, R.H.; Kruel, J.W.; Jain, M.; Guo, H. Applications of surface-enhanced Raman spectroscopy in environmental detection. Anal. Sci. Adv. 2022, 3, 113. [Google Scholar] [CrossRef]
  53. Bodelón, G.; Pastoriza-Santos, I. Recent Progress in Surface-Enhanced Raman Scattering for the Detection of Chemical Contaminants in Water. Front. Chem. 2020, 8, 478. [Google Scholar] [CrossRef]
  54. Guo, H.; He, L.; Xing, B. Applications of surface-enhanced Raman spectroscopy in the analysis of nanoparticles in the environment. Environ. Sci. Nano 2017, 4, 2093. [Google Scholar] [CrossRef]
  55. Liu, X.; Guo, J.; Li, Y.; Wang, B.; Yang, S.; Chen, W.; Wu, X.; Guo, J.; Ma, X. SERS substrate fabrication for biochemical sensing: Towards point-of-care diagnostics. J. Mat. Chem. B 2021, 9, 8378. [Google Scholar] [CrossRef]
  56. Xie, X.; Pu, H.; Sun, D.-W. Recent advances in nanofabrication techniques for SERS substrates and their applications in food safety analysis. Crit. Rev. Food Sci. Nutr. 2018, 58, 2800. [Google Scholar] [CrossRef] [PubMed]
  57. Ouyang, L.; Ren, W.; Zhu, L.; Irudayaraj, J. Prosperity to challenges: Recent approaches in SERS substrate fabrication. Rev. Anal. Chem. 2016, 36, 20160027. [Google Scholar] [CrossRef]
  58. Ge, K.; Hu, Y.; Li, G. Recent Progress on Solid Substrates for Surface-Enhanced Raman Spectroscopy Analysis. Biosensors 2022, 12, 941. [Google Scholar] [CrossRef]
  59. Guselnikova, O.; Lim, H.; Kim, H.-J.; Kim, S.H.; Gorbunova, A.; Eguchi, M.; Postnikov, P.; Nakanishi, T.; Asahi, T.; Na, J.; et al. New Trends in Nanoarchitectured SERS Substrates: Nanospaces, 2D Materials, and Organic Heterostructures. Small 2022, 18, 2107182. [Google Scholar] [CrossRef]
  60. Chen, M.; Liu, D.; Du, X.; Lo, K.H.; Wang, S.; Zhou, B.; Pan, H. 2D materials: Excellent substrates for surface-enhanced Raman scattering (SERS) in chemical sensing and biosensing. Trends Anal. Chem. 2020, 130, 115983. [Google Scholar] [CrossRef]
  61. Jebakumari, K.A.E.; Murugasenapathi, N.K.; Palanisamy, T. Engineered Two-Dimensional Nanostructures as SERS Substrates for Biomolecule Sensing: A Review. Biosensors 2023, 13, 102. [Google Scholar] [CrossRef] [PubMed]
  62. Liu, Y.; Qin, Z.; Deng, J.; Zhou, J.; Jia, X.; Wang, G.; Luo, F. The Advanced Applications of 2D Materials in SERS. Chemosensors 2022, 10, 455. [Google Scholar] [CrossRef]
  63. Luo, W.; Xiong, W.; Han, Y.; Yan, X.; Mai, L. Application of two-dimensional layered materials in surface-enhanced Raman spectroscopy (SERS). Phys. Chem. Chem. Phys. 2022, 24, 26398. [Google Scholar] [CrossRef] [PubMed]
  64. Kannan, P.K.; Shankar, P.; Blackman, C.; Chung, C.-H. Recent Advances in 2D Inorganic Nanomaterials for SERS Sensing. Adv. Mater. 2019, 31, 1803432. [Google Scholar] [CrossRef] [Green Version]
  65. Zhang, N.; Tong, L.; Zahng, J. Graphene-Based Enhanced Raman Scattering toward Analytical Applications. Chem. Mater. 2016, 28, 6426. [Google Scholar] [CrossRef]
  66. Silver, A.; Kitadai, H.; Liu, H.; Granzier-Nakajima, T.; Terrones, M.; Ling, X.; Huang, S. Chemical and Bio Sensing Using Graphene-Enhanced Raman Spectroscopy. Nanomaterials 2019, 9, 516. [Google Scholar] [CrossRef] [Green Version]
  67. Xu, W.; Mao, N.; Zhang, J. Graphene: A platform for surface-enhanced Raman spectroscopy. Small 2013, 9, 1206. [Google Scholar] [CrossRef]
  68. Cai, Q.; Mateti, S.; Watanabe, K.; Taniguchi, T.; Huang, S.; Chen, Y.; Li, L.H. Boron Nitride Nanosheet-Veiled Gold Nanoparticles for Surface-Enhanced Raman Scattering. ACS Appl. Mater. Interfaces 2016, 8, 15630. [Google Scholar] [CrossRef] [Green Version]
  69. Kim, G.; Kim, M.; Hyun, C.; Hong, S.; Ma, K.Y.; Shin, H.S.; Lim, H. Hexagonal Boron Nitride/Au Substrate for Manipulating Surface Plasmon and Enhancing Capability of Surface-Enhanced Raman Spectroscopy. ACS Nano 2016, 10, 11156. [Google Scholar] [CrossRef]
  70. Kim, N.-Y.; Leem, Y.-C.; Hong, S.-H.; Park, J.-H.; Yim, S.-Y. Ultrasensitive and Stable Plasmonic Surface-Enhanced Raman Scattering Substrates Covered with Atomically Thin Monolayers: Effect of the Insulating Property. ACS Appl. Mater. Interfaces 2019, 11, 6363. [Google Scholar] [CrossRef]
  71. Chugh, D.; Jagadish, C.; Tan, H. Large-Area Hexagonal Boron Nitride for Surface Enhanced Raman Spectroscopy. Adv. Mater. Technol. 2019, 4, 1900220. [Google Scholar] [CrossRef]
  72. Basu, N.; Satya Bharathi, M.S.; Sharma, M.; Yadav, K.; Parmar, A.S.; Soma, V.R.; Lahiri, J. Large Area Few-Layer Hexagonal Boron Nitride as a Raman Enhancement Material. Nanomaterials 2021, 11, 622. [Google Scholar] [CrossRef]
  73. Nie, S.M.; Emory, S.R. Probing Single Molecules and Single Nanoparticles by Surface-Enhanced Raman Scattering. Science 1997, 275, 1102. [Google Scholar] [CrossRef]
  74. Ramos-Berdullas, N.; López-Carballeira, D.; Pérez-Juste, I.; Mandado, M. On the mechanism responsible of Raman enhancement on carbon allotropes surfaces: The role of molecule-surface vibrational coupling in SERS. J. Raman Spectrosc. 2015, 46, 1205. [Google Scholar] [CrossRef]
  75. López-Carballeira, D.; Ramos-Berdullas, N.; Pérez-Juste, I.; Mandado, M. Can single graphene nanodisks be used as Raman enhancement platforms? RSC Adv. 2016, 6, 71397. [Google Scholar] [CrossRef]
  76. Ramos-Berdullas, N.; Otero, N.; Mandado, M. Graphene Molecules as Platforms for SERS Detection: A Future Perspective. In Handbook of Graphene: Biosensors and Advanced Sensors; Palys, B., Ed.; John Wiley & Sons Inc.: Hoboken, NJ, USA, 2019; Volume 6, p. 431. [Google Scholar]
  77. Ci, L.; Song, L.; Jin, C.; Jariwala, D.; Wu, D.; Li, Y.; Srivastava, A.; Wang, Z.F.; Storr, K.; Balicas, L.; et al. Atomic layers of hybridized boron nitride and graphene domains. Nat. Mater. 2010, 10, 430. [Google Scholar] [CrossRef] [PubMed]
  78. Gong, Y.; Shi, G.; Zhang, Z.; Zhou, W.; Jung, J.; Gao, W.; Ma, L.; Yang, Y.; Yang, S.; You, G.; et al. Direct chemical conversion of graphene to boron- and nitrogen- and carbon-containing atomic layers. Nat. Commun. 2014, 5, 3193. [Google Scholar] [CrossRef] [Green Version]
  79. Lorenzo-García, M.M.; Bonifazi, D. Renaissance of an Old Topic: From Borazines to BN-doped Nanographenes. Chimia 2017, 71, 550. [Google Scholar] [CrossRef] [Green Version]
  80. Herrera-Reinoza, N.; dos Santos, A.C.; de Lima, L.H.; Landers, R.; de Siervo, A. Atomically Precise Bottom-Up Synthesis of h-BNC: Graphene Doped with h-BN Nanoclusters. Chem. Mat. 2021, 33, 2871. [Google Scholar] [CrossRef]
  81. Mandado, M.; Ramos-Berdullas, N. Confinement on the Optical Response in h-BNCs: Towards Highly Efficient SERS-active 2D Substrates. Spectrochim. Acta A Mol. Biomol. Spectrosc. 2022, 266, 120451. [Google Scholar] [CrossRef]
  82. Karamanis, P.; Otero, N.; Pouchan, C. Unleashing the quadratic nonlinear optical responses of graphene by confining white-graphene (h-BN) sections in its framework. J. Am. Chem. Soc. 2014, 113, 7464. [Google Scholar] [CrossRef]
  83. Karamanis, P.; Otero, N.; Pouchan, C. Electric property variations in nanosized hexagonal boron nitride/graphene hybrids. J. Phys. Chem. C 2015, 119, 11872. [Google Scholar] [CrossRef]
  84. Otero, N.; El-Kelany, K.E.; Pouchan, C.; Rérat, M.; Karamanis, P. Establishing the pivotal role of local aromaticity in the electronic properties of boron-nitride graphene lateral hybrids. Phys. Chem. Chem. Phys. 2016, 18, 25315. [Google Scholar] [CrossRef]
  85. Bevilacqua, A.C.; Köhler, M.H.; Azevedo, S.; Baierle, R.J. Stability, and optical and electronic properties of ultrathin h-BNC. Phys. Chem. Chem. Phys. 2017, 19, 5629. [Google Scholar] [CrossRef] [PubMed]
  86. Alvarado, R.; Ramos-Berdullas, N.; Mandado, M. On the adsorption affinity of graphene and white graphene sheets by dioxin-like pollutants. Int. J. Quantum Chem. 2021, 121, e26591. [Google Scholar] [CrossRef]
  87. Mandado, M.; Hermida-Ramón, J.M. Electron Density Based Partitioning Scheme of Interaction Energies. J. Chem. Theo. Comput. 2011, 7, 633. [Google Scholar] [CrossRef] [PubMed]
  88. Ramos-Berdullas, N.; Pérez-Juste, I.C.; Van Alsenoy, C.; Mandado, M. Theoretical study of the adsorption of aromatic units on carbon allotropes including explicit (empirical) DFT dispersion corrections and implicitly dispersion-corrected functionals: The pyridine case. Phys. Chem. Chem. Phys. 2015, 17, 575. [Google Scholar] [CrossRef]
  89. Cárdenas, G.; Pérez-Barcia, A.; Mandado, M.; Nogueira, J.J. Characterization of cisplatin/membrane interactions by QM/MM energy decomposition analysis. Phys. Chem. Chem. Phys. 2021, 23, 20533. [Google Scholar] [CrossRef]
  90. Pérez-Barcia, A.; Cárdenas, G.; Nogueira, J.J.; Mandado, M. Effect of the QM Size, Basis Set, and Polarization on QM/MM Interaction Energy Decomposition Analysis. J. Chem. Inf. Model. 2023, 63, 882. [Google Scholar] [CrossRef]
  91. Le Ru, E.; Etchegoin, P. Principles of Surface Enhanced Raman Spectroscopy and Related Plasmonic Effects; Elsevier: Amsterdam, The Netherlands, 2009; pp. 14–20. [Google Scholar]
  92. Ramos-Berdullas, N.; López-Carballeira, D.; Mandado, M.; Pérez-Juste, I. Revisiting the mechanism and the influence of the excitation wavelength on the surface-enhanced Raman scattering of the pyridine–Ag20 system. Theo. Chem. Acc. 2015, 134, 60. [Google Scholar] [CrossRef]
  93. Krishtal, A.; Senet, P.; Yang, M.; Van Alsenoy, C. A Hirshfeld partitioning of polarizabilities of water clusters. J. Chem. Phys. 2006, 125, 034312. [Google Scholar] [CrossRef]
  94. Otero, N.; Van Alsenoy, C.; Pouchan, C.; Karamanis, P. Hirshfeld-based intrinsic polarizability density representations as a tool to analyze molecular polarizability. J. Comput. Chem. 2015, 36, 1831. [Google Scholar] [CrossRef]
  95. Geldof, D.; Krishtal, A.; Blockhuys, F.; Van Alsenoy, C. An Extension of the Hirshfeld Method to Open Shell Systems Using Fractional Occupations. J. Chem. Theo. Comput. 2011, 7, 1328. [Google Scholar] [CrossRef] [PubMed]
  96. Frisch, M.J.; Trucks, G.W.; Schlegel, H.B.; Scuseria, G.E.; Robb, M.A.; Cheeseman, J.R.; Scalmani, G.; Barone, V.; Petersson, G.A.; Nakatsuji, H.; et al. Gaussian 16, Revision C.01; Gaussian, Inc.: Wallingford, CT, USA, 2016. [Google Scholar]
  97. Mandado, M.; Van Alsenoy, C. EDA-NCI: A Program to Perform Energy Decomposition Analysis of Non-Covalent Interactions. Available online: https://github.com/marcos-mandado/EDA-NCI (accessed on 26 April 2023).
  98. Keith, T.A.; Millam, J.M. GaussView, Version 6, Dennington, Roy; Semichem Inc.: Shawnee Mission, KS, USA, 2016. [Google Scholar]
  99. Allouche, R.A. Gabedit-A graphical user interface for computational chemistry softwares. J. Comput. Chem. 2011, 32, 174. [Google Scholar] [CrossRef] [PubMed]
  100. Chemcraft-Graphical Software for Visualization of Quantum Chemistry Computations. Available online: https://www.chemcraftprog.com (accessed on 26 April 2023).
  101. Boys, S.F.; Bernardi, F. The calculation of small molecular interactions by the differences of separate total energies. Some procedures with reduced errors. Mol. Phys. 1970, 19, 553. [Google Scholar] [CrossRef]
  102. López-Carballeira, D.; Ramos-Berdullas, N.; Pérez-Juste, I.; Cagide-Fajín, J.L.; Cordeiro, M.N.D.S.; Mandado, M. A computational study of the interaction of graphene structures with biomolecular units. Phys. Chem. Chem. Phys. 2016, 18, 15312. [Google Scholar] [CrossRef] [PubMed]
  103. Norman, P.; Bishop, D.M.; Jensen, H.J.A.; Oddershede, J. Near-resonant absorption in the time-dependent self-consistent field and multiconfigurational self-consistent field approximations. J. Chem. Phys. 2001, 115, 10323. [Google Scholar] [CrossRef]
Figure 1. Optimized structures of the adsorption complexes BNC96-TCDD (left) and BNC96-TCDF (right). The blue, pink, grey, white, green and red spheres stand for nitrogen, boron, carbon, hydrogen, chlorine and oxygen atoms, respectively.
Chemosensors 11 00266 g001
Figure 2. Simulated static Raman spectra of TCDD (a) and TCDF (b) adsorbed on BNC96 (blue) confronted with the spectra of the corresponding isolated molecules (orange).
Chemosensors 11 00266 g002
Figure 3. Front views of isotropic polarizability density distribution maps of TCDD and TCDF molecules isolated, (a,c), and adsorbed on BNC96, (b,d). For the isolated molecules the map represents the total intrinsic polarizability (Equation (8)) whereas for the adsorbed molecules, the map represents the interacting intrinsic polarizability (Equation (9)), i.e., the polarizability difference between the whole system and the non-interacting BSSE-corrected molecule and surface. The isosurface values for total and interacting intrinsic polarizabilities are ±0.03 and ±0.01, respectively. Orange and blue regions correspond to positive values of the isosurface, while purple and gray represent the negative ones. We have removed the polarizability density distributions from the host surface to simplify the visualization.
Chemosensors 11 00266 g003
Figure 4. Ground-to-excited-state density differences (DDs) in BNC96-TCDD (right) and C96-TCDD (left) complexes. Isosurface value is 4 × 10⁴. Mauve and blue regions correspond to positive and negative regions, respectively.
Chemosensors 11 00266 g004
Figure 5. Transition densities (TDs) in BNC96-TCDD (right) and C96-TCDD (left) complexes. Isosurface value is 1 × 10⁻⁴. Purple and brown regions correspond to positive and negative regions, respectively.
Chemosensors 11 00266 g005
Figure 6. Simulated Raman spectra of TCDD (a) and TCDF (b) adsorbed on BNC96 obtained with an excitation wavelength of 512.0 nm and 512.2 nm, respectively.
Chemosensors 11 00266 g006
Figure 7. Simulated Raman spectra of TCDD (a,c,e) and TCDF (b,d,f) adsorbed on BNC96 (a,b) and hypothetical spectra obtained from the contributions of the molecule (c,d) and surface (e,f) obtained with an excitation wavelength of 532 nm.
Chemosensors 11 00266 g007
Table 1. Interaction energy and its components for the complexes formed by the surface finite models of C96 and BNC96 with TCDD and TCDF. All data are given in kcal mol−1.
TCDDTCDF
C96BNC96C96BNC96
E E l e c −21.3−21.1−19.6−19.0
E P a u 52.551.248.746.9
E I n d −5.0−5.1−4.2−4.3
E D i s p −59.5−59.7−56.2−55.9
E I n t −33.4−34.7−31.4−32.3
Table 2. Diagonal components of the polarizability tensor and isotropic polarizability (in au) for the isolated molecules adsorbed on BNC96.
TCDDTCDF
IsolatedBNC96IsolatedBNC96
α x x 302.20182.42310.05172.82
α y y 174.3887.55171.8975.30
α z z 82.91129.7380.23139.99
α i s o 186.50133.23187.39129.37
Disclaimer/Publisher’s Note: The statements, opinions and data contained in all publications are solely those of the individual author(s) and contributor(s) and not of MDPI and/or the editor(s). MDPI and/or the editor(s) disclaim responsibility for any injury to people or property resulting from any ideas, methods, instructions or products referred to in the content.

