Article

Porous Copper Oxide Thin Film Electrodes for Non-Enzymatic Glucose Detection

by
Soledad Carinelli
1,
Pedro A. Salazar-Carballo
1,*,
Julio Ernesto De la Rosa Melián
2 and
Francisco García-García
2
1
Laboratory of Sensors, Biosensors and Advanced Materials, Faculty of Health, Sciences, University of La Laguna, Campus de Ofra s/n, 38071 La Laguna, 38200 Tenerife, Spain
2
Department of Engineering and Science of Materials and Transport, Higher Polytechnic School, University of Sevilla, Virgen de África 7, 41011 Seville, Spain
*
Author to whom correspondence should be addressed.
Chemosensors 2023, 11(5), 260; https://doi.org/10.3390/chemosensors11050260
Submission received: 15 March 2023 / Revised: 19 April 2023 / Accepted: 20 April 2023 / Published: 25 April 2023
(This article belongs to the Collection Sustainable Metal Oxide Materials for Sensing Applications)

Abstract

:
The present work describes novel copper oxide thin film-modified indium tin oxide electrodes prepared by magnetron sputtering and their application for glucose sensing. Copper oxide-modified sensors were characterized by electrochemical techniques, X-ray photoelectron spectroscopy (XPS), and scanning electron microscopy (SEM). The deposited thin film (of about 400 nm of thickness) consisted of Cu2O/CuO nanocolumns of ca. 80 nm in diameter. After optimizing the main experimental parameters, the electrodes showed noteworthy electrocatalytic properties for glucose detection (sensitivity ca. 2.89 A M−1 cm−2 and limit of detection ca. 0.29 μM (S/N = 3)). The sensor showed negligible response against common electroactive species and other sugars. Finally, recovery experiments in commercial soda drinks and the determination of glucose content in different commercial drinks, such as soda, tea, fruit juices, and sports drinks, are described.

1. Introduction

Metal oxide materials (MOxMs) have recently been introduced for sensing [1,2] and biosensing [3,4,5,6] applications. MOxMs offer high surface area-to-volume ratios, excellent catalytic activity, and good thermal stability, making them ideal for use in sensing and biosensing applications. In addition, MOxMs can be easily synthesized using low-cost and scalable processes, allowing for large-scale production and commercialization. Furthermore, MOxMs can be tailored to specific sensing applications by adjusting their chemical composition and morphology, thereby enhancing their sensitivity and selectivity. Overall, the introduction of MOxMs has greatly expanded the range of materials available for sensing and biosensing applications, providing researchers with a powerful tool for the development of novel and high-performance sensors and biosensors. In addition, MOxMs have been applied in other areas of science.
For example, MOxMs have been employed in the study and prevention of corrosion, due to their ability to form protective coatings on metal surfaces. Moreover, MOxMs have been utilized as photocatalysts for various chemical reactions [7], including water splitting and CO2 reduction, and as drug delivery agents [2,8], due to their biocompatibility and controlled release properties. Additionally, MOxMs have shown great potential in the development of energy storage devices, such as batteries and supercapacitors, and in fuel [9] and solar cell [10] applications, due to their high electron mobility and optical absorption properties. The versatility and unique physicochemical properties of MOxMs have made them a valuable material for research in a wide range of scientific disciplines, and their potential applications continue to expand with ongoing research and development.
Among other materials, non-precious metals (Cu, Ni, Fe, Co, Ti, Sn, etc.) offer important advantages over conventional materials (Pt, Pd, Au, and Ag) due to their low cost, stability, abundance, and high electrocatalytic properties, which act against different molecules and biomolecules [11,12,13,14]. Their application in gas sensors for CO2, NH3, O2, CO, H2S, and CH4 has been reported in previous works [15]. In this sense, MOxMs gas sensors exhibit fast response and recovery times, as well as low power consumption, making them ideal for use in portable and wearable devices. Overall, MOxMs gas sensors have the potential to revolutionize the field of gas sensing, providing more accurate and reliable monitoring of gases in various industrial, environmental, and medical settings. Moreover, the application of non-enzymatic sensors for glucose, ethanol, fructose, sucrose, H2O2, etc. [16,17,18,19,20], is an excellent alternative for enzymatic biosensor devices, where notable problems (high cost, biofouling, interferences, pH, temporal and thermal instabilities, etc.) are found due to the nature of the catalytic biomolecules. They also offer the added benefits of increased stability and reliability, as they do not rely on the use of catalytic biomolecules, which can be affected by various environmental factors. Therefore, non-enzymatic sensors are becoming increasingly popular in various fields, including medical diagnostics, the food industry, and environmental monitoring, among others, due to their versatility and superior performance.
Currently, nanostructured sensors or nanomaterial-modified electrodes are highly promising transducers because of their outstanding properties (catalytic and analytical properties). In this regard, the development of nanostructured MOxMs components, such as nanoparticles (NPs), nanopillars, nanorods, nanofibers, etc. [21], is an important step forward compared to the use of bulk materials, where interesting new properties appear due to the nanoscale dimensions of the materials [6,10,22]. In the field of nanotechnology, there are various synthesis methods for producing nanoparticles and nanostructured surfaces. The top-down approach (including milling, lithography, and etching) involves the reduction of bulk materials to produce smaller particles or structures, whereas the bottom-up approach (including sol-gel synthesis, chemical vapor deposition, and precipitation) involves building up materials atom by atom or molecule by molecule to form larger structures. Depending on the methods used and the experimental conditions, the MOxMs can be tuned, affecting their surface stoichiometry, phase composition, morphology, and crystallographic structure, and ultimately, their functionalities and catalytic properties [21,23]. Therefore, highly efficient and sensitive nanostructured non-enzymatic electrochemical sensors have been described in the literature for their outstanding catalytic activity, biocompatibility properties, and their large specific surface area [12,24].
Nanostructured sensors can be developed various techniques, for example, the in situ growth/deposition of NPs on the sensor surface by means of electrodeposition techniques and other chemical methods. In contrast, thin films can be generated on the surface of the working electrode by means of chemical/physical vapor deposition or magnetron sputtering (MS). Among these methods, MS is a physical manufacturing method compatible with soft substrates and is easily scalable, where MOxMs thin films present high binding forces and fewer defects, improving the stability and sensitivity of the sensors [25]. In addition, thin films deposited under the oblique angle deposition approach (OAD) show columnar and highly porous microstructures with mesopores, and hence, with larger active surfaces and better electroactivity properties [16]. For details, see Figure 1.
Among the different biomolecules and analytes of interest, glucose remains an interesting target (for both the agro-food and pharmaceutical industries) because the growing prevalence of obesity and diabetes mellitus has led to an increase in mortality and a reduction in life expectancy in developed countries [12]. Diabetes increases the probability of suffering cardio-vascular events, strokes, chronic kidney and liver disorders, cancer, and infections [26]. Moreover, obesity increases (up to 80%) the risk of developing type 2 diabetes, and it is associated with a range of comorbidities, including osteoarthritis, obstructive sleep apnea, cardiovascular diseases, stroke, and some types of cancer [27]. The International Diabetes Federation (IDF), in its most recent study (IDF Atlas 10th edition), estimated that 537 million people have diabetes and predicted that this number could reach 700 million by 2045 [28]. Therefore, the pharmaceutical industry and the scientific community have invested significant resources to obtain low cost and accurate glucose sensors as an alternative to conventional enzymatic biosensors.
The use of nanostructured materials in this work provided several advantages, such as a larger active surface area for improved sensitivity, better electrocatalytic properties, and low response against potential interferences. These advantages are particularly important for the detection of glucose in commercial beverages, where the ability to differentiate glucose from other interfering substances is crucial. The low limit of detection (LOD = 0.23 μM; S/N = 3), as well as the reproducibility (7%) and repeatability (3.5%) of the copper oxide-modified electrodes, demonstrate the reliability and accuracy of this approach.
Overall, this work highlights the potential of nanostructured materials in electrochemical sensing applications, particularly for the development of highly sensitive and selective sensors. The use of reactive MS and the oblique angle deposition configuration allowed for the creation of a highly reactive and porous structure, resulting in improved electrocatalytic properties of thin films for sensing applications.

2. Materials and Methods

2.1. Reagent and Materials

Copper target (ф = 55 mm, 99.999% purity) and indium tin oxide (ITO) substrates (1 × 2 cm) were obtained from Visiontek Systems (Chester, UK) and Goodfellow (Huntingdon, UK), respectively. Glucose, interferences and NaOH were acquired from Sigma-Aldrich (Madrid, Spain). All solutions were prepared in doubly distilled water.

2.2. Deposition of Copper Oxide Thin Films

Nanocolumnar porous copper thin films were prepared by reactive pulsed DC MS. The magnetron’s fixed parameters were 200 W of power and 550–600 V of pulsed voltage, with an oscillation frequency of 80 kHz. The plasma gas was an Ar/O2 mixture with a mass flow fraction of 15. The residual vacuum was ca. 10−6 mbar; meanwhile, the pressure system during the deposition reached a pressure of about of 10−3 mbar. ITO electrodes were placed at a distance ca. 5 cm from the vapor source and at angle of about 80°. Moreover, a quartz crystal microbalance was used to regulate the film thickness while it was being deposited. For details, see Figure 1.

2.3. Thin Film Characterization

SEM images of copper thin films grown on doped silicon (100) wafers were obtained, using a Hitachi S4800 field emission microscope, to elucidate the microstructure properties of the film. The chemical composition of the thin film was studied by X-ray photoelectron spectra (XPS). To this end, a PHOIBOS-100 spectrometer was used. The C spurious carbon (C 1 s peak, centered at 284.5 eV) found in the sample was used as a reference for the binding energy (BE) scale. Raman spectra were obtained using a micro-Raman Renishaw InVia microscope equipped with a green laser (λ = 532  nm, P = 5 mW).

2.4. Electrochemical Characterization

Electrochemical tests were performed using a DRP-STAT-i-400 potentiostat (Metrohm Dropsens, Oviedo, Spain). After their assembly, copper-modified ITO electrodes exhibited an electroactive area of 1.5 cm2. Electrochemical characterizations and calibration curves were obtained using different electrochemical methods, such as constant potential amperometry (CPA) and cyclic voltammetry (CV), where copper-modified electrodes were used as the working electrode, and a Pt wire and a commercial Ag/AgCl (3 M) electrode were used as counter and reference electrodes, respectively.

3. Results and Discussion

3.1. Chemical and Microstructure Characterization

The microstructure of the copper thin film prepared on a silicon substrate was characterized by FE-SEM. Figure 2 shows the plan-view (Figure 2a) and cross-section (Figure 2b) images of the film. They show that the film is made of a series of nanopillars with diameters of ca. 80 nm and a length of ca. 400 nm. In addition, SEM images confirmed the presence of connected channels that increased the active surface and the diffusion of the analytes and hence, the electrocatalytic properties of the thin film for sensing applications.
The chemical composition and oxidation state of the copper thin film on the ITO electrode’s surface were determined using XPS analysis. The shape profile (Figure 3a) showed the two main peaks of different copper oxidation states. These peaks were assigned to Cu 2p3/2 and Cu 2p1/2 lines centered at ca. 934 and 954 eV, respectively [18,19]. Additionally, two satellite peaks of Cu 2p3/2 and Cu 2p1/2, which are characteristic of the CuO species, were also observed at ca. 944 and 963 eV, respectively. Figure 3b shows the Cu 2p3/2 XPS profile and the proposed fitting results. The present analysis reveals the presence of Cu/Cu2O and CuO species at 932.6 and 934.7 eV, respectively (peaks for both Cu2O and Cu species appear at 932.6 eV, which are indistinguishable) [29].
Raman spectroscopy has been employed to gain a deeper understanding of the composition of a copper sensor, revealing important details about the molecular structure of the material. The spectroscopic analysis (Figure 4a) has shown two distinct bands at 513 and 1044 cm−1, which have been assigned to the presence of Cu2O. In addition, the study has identified two more bands at 410 and 630 cm−1, which have been assigned to CuO [30,31].

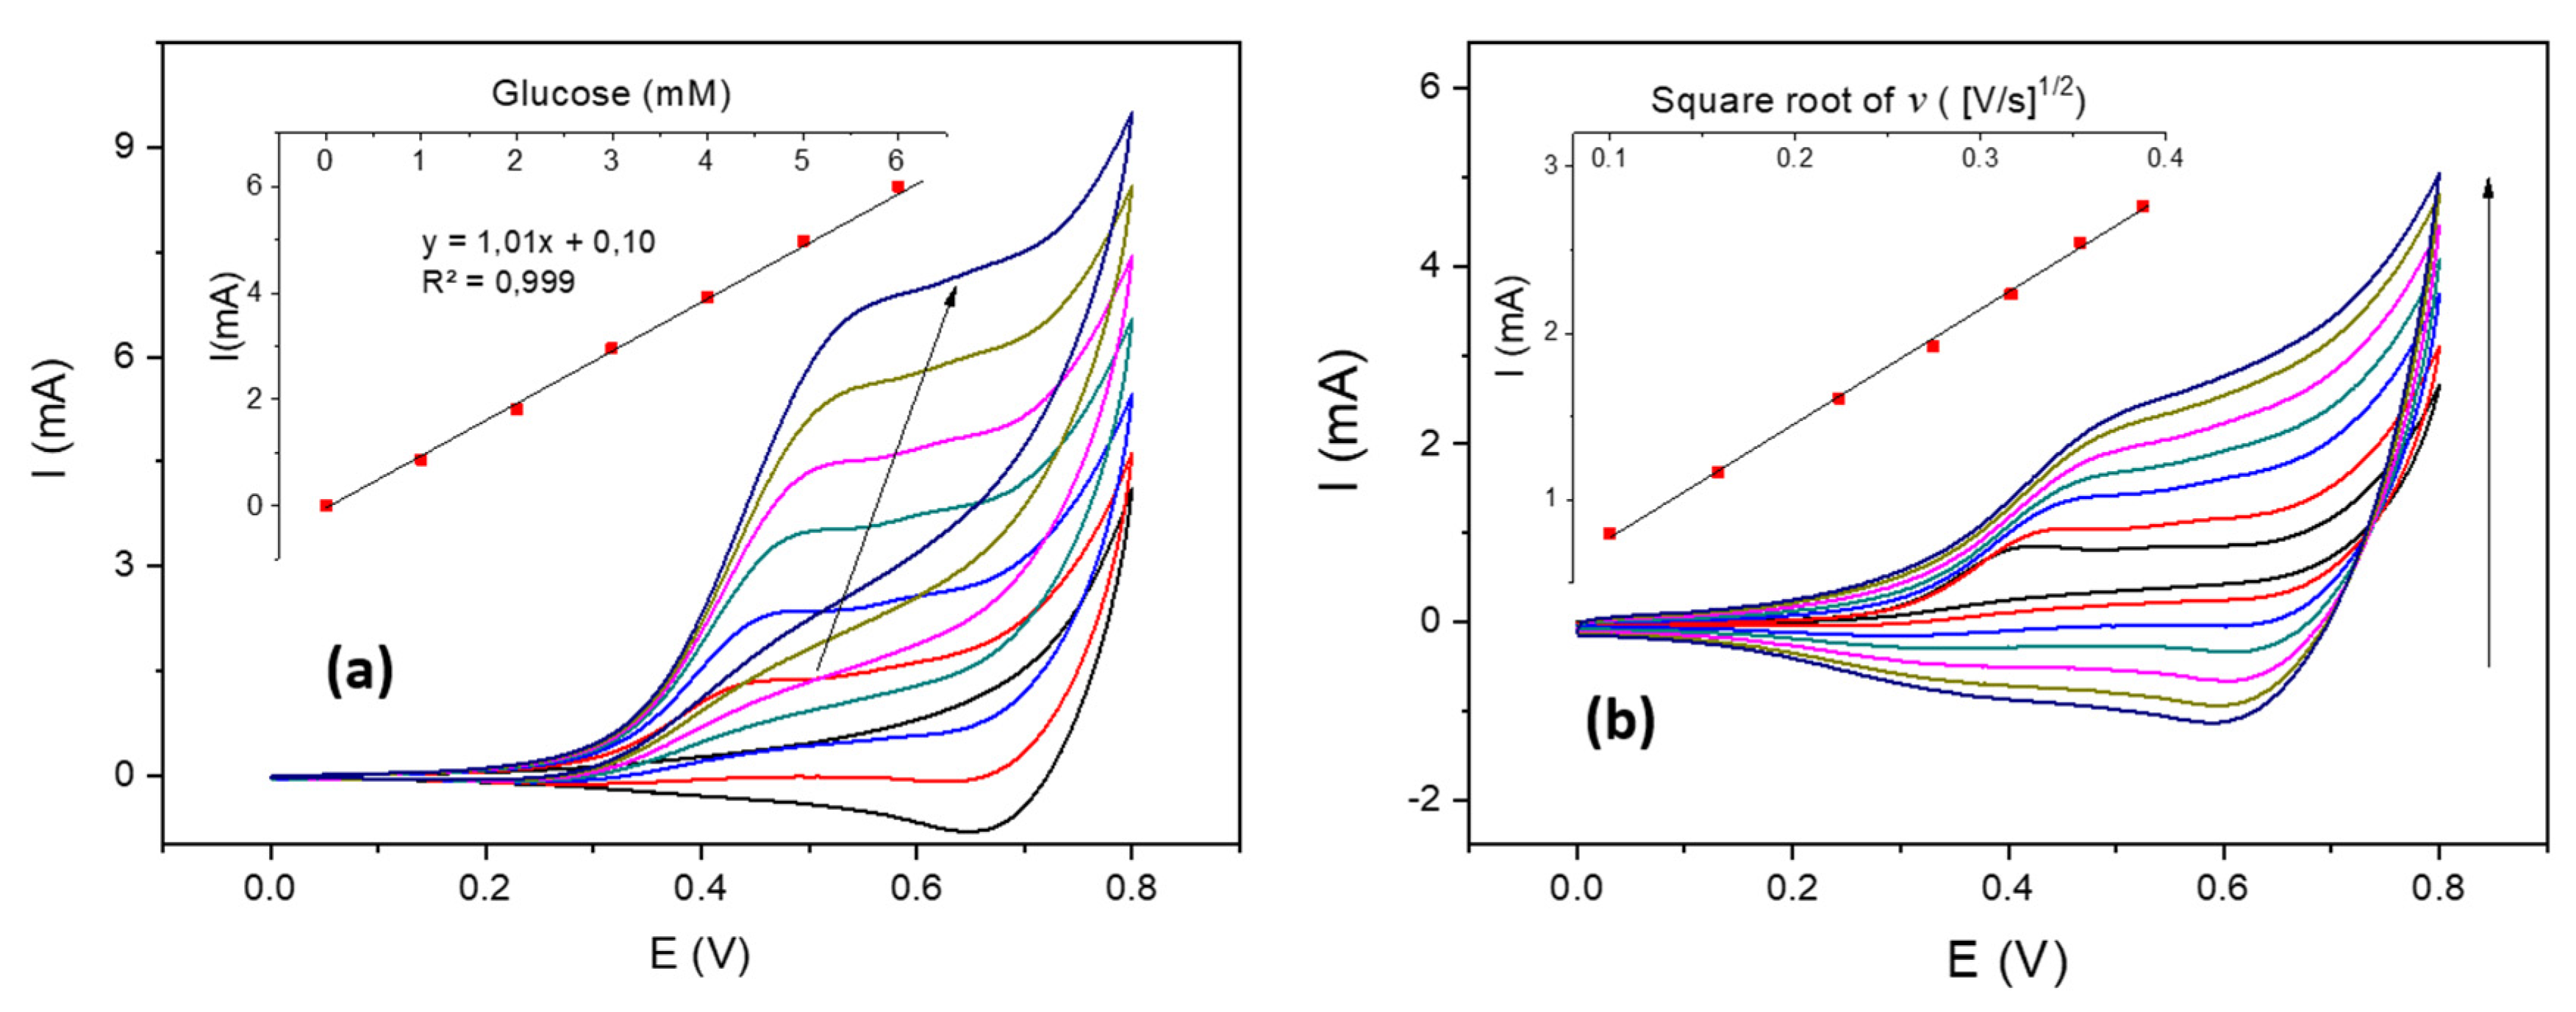
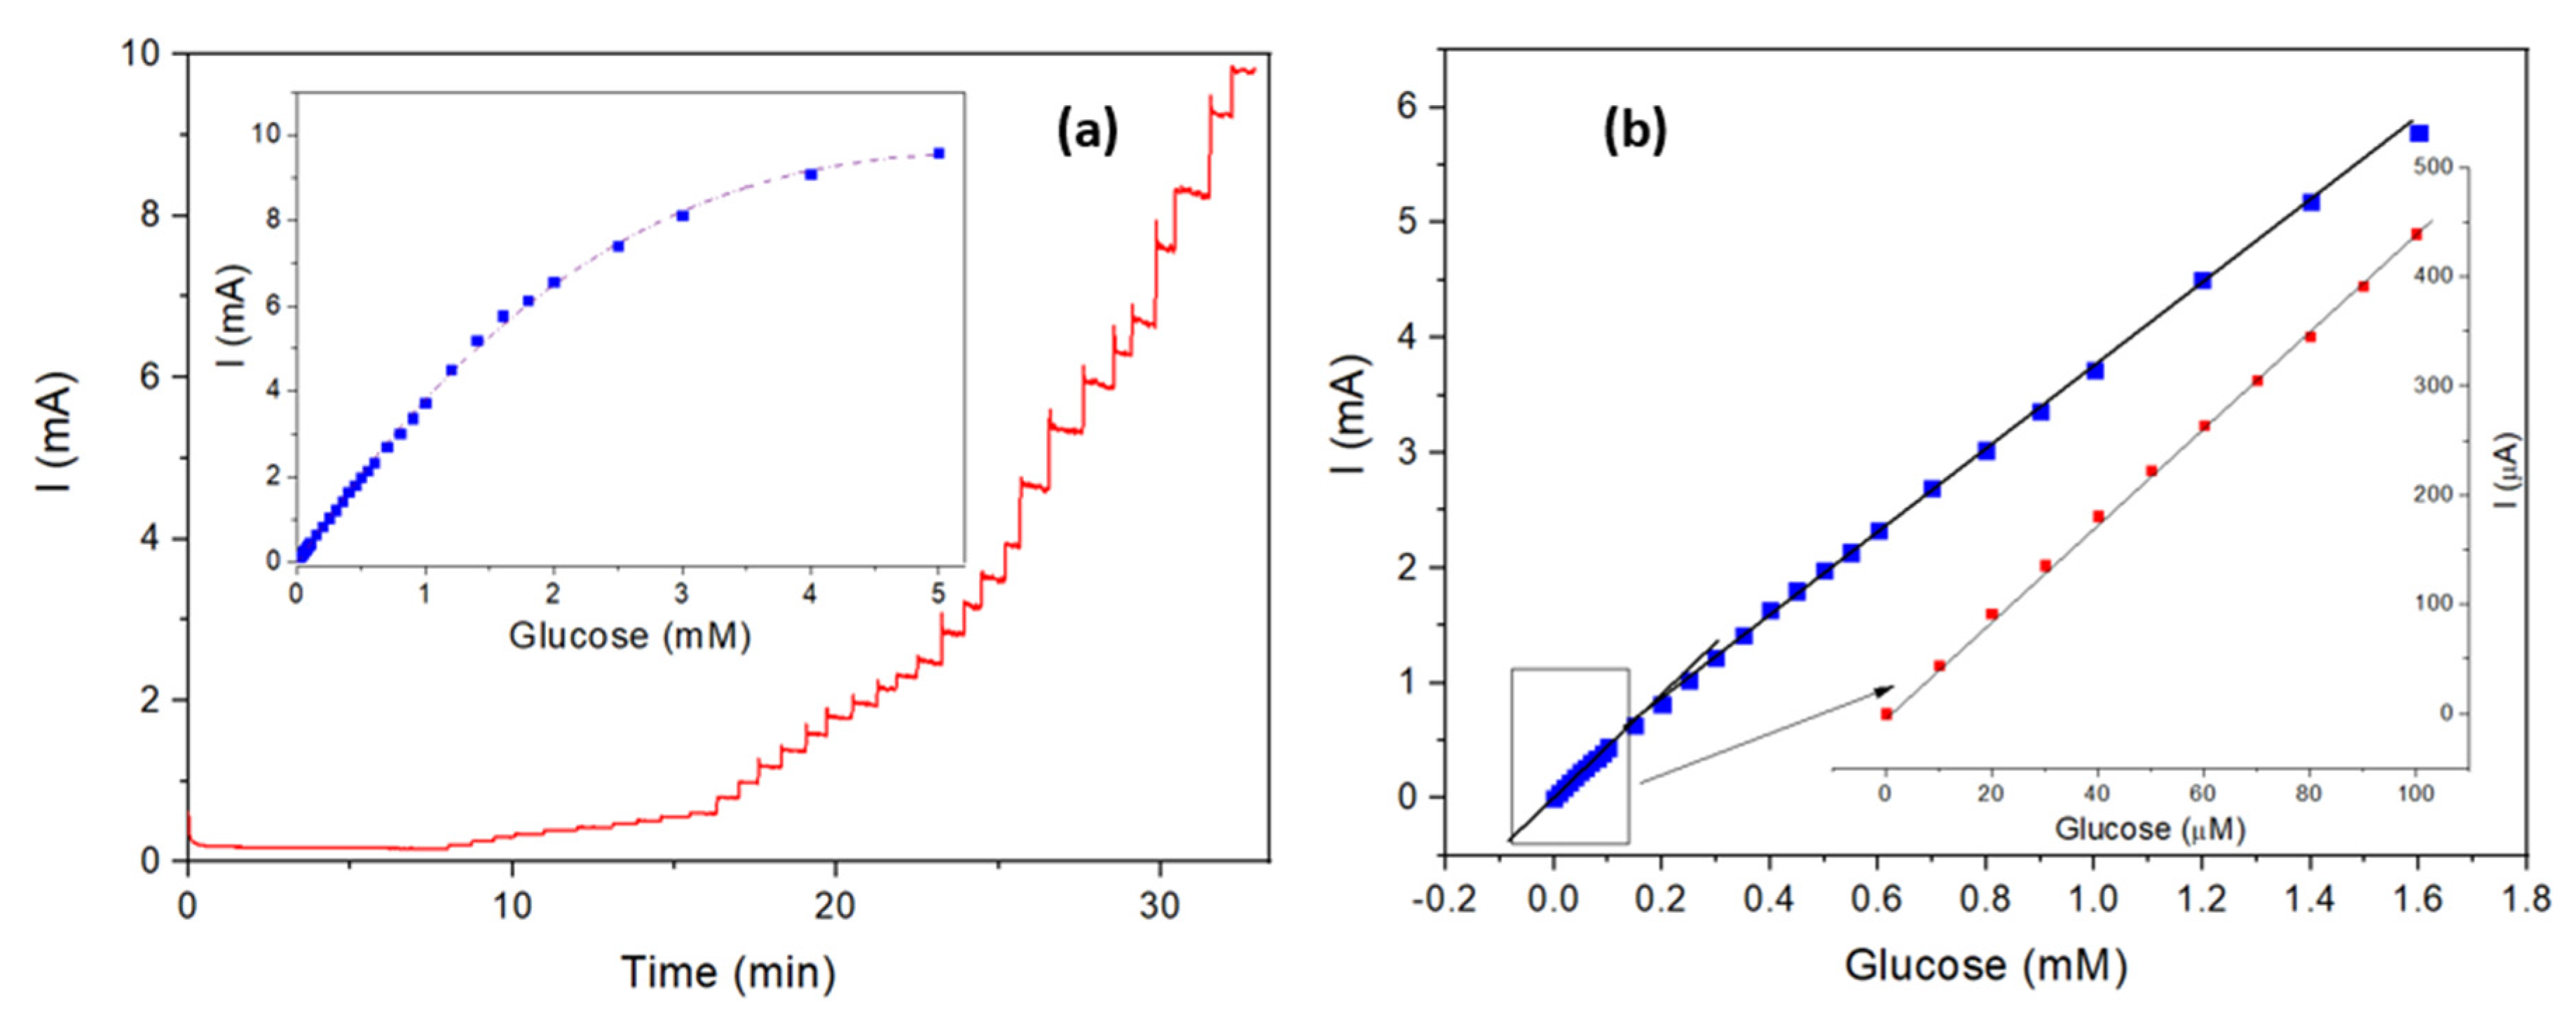
3.2. Electrochemical Characterization and Sensor Response

The pH value has a great influence on the electrocatalytic oxidation/detection of glucose by copper and other MoxMs-based sensors. To better understand the mechanism reaction, and the copper species involved, the first step was studying the electrochemical behavior of the copper sensor under alkaline conditions. Figure 4b shows the cyclic voltammogram of the copper-modified ITO sensor at a scan rate of 0.1 V s−1 in 0.1 M NaOH as a supporting electrolyte. A bare ITO electrode was also used as a reference material (see Figure 4b). The copper-modified ITO electrode displayed two clear oxidation peaks centered at ca. +0.05 and +0.2 V and a reduction peak at −0.3 V. The first small oxidation peak observed (small shoulder at −0.3 V) during the forward scan corresponded to the conversion of Cu (0) to Cu (I) species: Cu → Cu2O [29]. The other two oxidation peaks, situated at +0.05 and +0.3 V, were assigned to the oxidation of Cu (I) to Cu (II) species: Cu2O → CuO and/or Cu(OH)2. Finally, the reduction peak (during the back scan) centered at ca. −0.2 V corresponded to the Cu(II)/Cu(I) inter-conversion [19]. The reduced scan range used in the current study may help to explain the lack of a second peak, caused by Cu(I)/Cu(0) inter-conversion [18]. The ITO electrode, used as a support material, did not show any relevant peaks under similar conditions (see Figure 4b), confirming that the copper thin film is responsible for the electrochemical response of the modified ITO electrode.
Cu (III) species (CuOOH) produced at high applied potentials on the surface of the electrode are responsible for the catalytic activity of copper-modified sensors in alkaline media (see Equation (1)). Therefore, CuOOH is able to catalyze the conversion of glucose into gluconolactone (see Equation (2)). Secondary to the latter reaction, gluconolactone undergoes a hydrolyzation process that spontaneously transforms it into gluconic acid (see Equation (3)) [32].
C u O ( I I ) + O H   C u O O H   ( I I I ) + e
C u O O H   ( I I I ) + e + C 6 H 12 O 6   ( g l u c o s e ) C 6 H 10 O 6   ( g l u c o l a c t o n e ) + C u O ( I I )
C 6 H 10 O 6   ( g l u c o l a c t o n e ) + H 2 O   C 6 H 12 O 7   ( g l u c o n i c   a c i d )
The cyclic voltammetry test, under alkaline conditions, was used to evaluate the catalytic properties for glucose sensing of the copper-modified electrode. The CV response, in the range from 0 to 6 mM glucose, is shown in Figure 5a. CVs showed a clear current increase in the anodic current, and confirmed that Cu (III) acts as an electron transfer mediator. Interestingly, a linear peak current response was observed against glucose concentration, with a sensitivity of 1.01 A M−1 (R2 = 0.999). In addition, the increase in the anodic current was followed by a slight shift to higher potentials. At low glucose concentrations, the anodic peak was centered at about 0.45 V; meanwhile, at higher concentrations, it shifted to ca. 0.55 V. This observation can be attributed to diffusion impediments of the reactants and intermediates of the reaction in the diffusion layer close to the electrode surface because of the absorption of byproducts and/or glucose (see Equation (2)). Under these limiting conditions, the reaction and hence, its kinetics, are both reduced, producing a positive shift of the anodic signal. Furthermore, Figure 5a shows a slight decrease (on the reverse scan) in the cathodic peak reduction after each glucose addition, disappearing at higher glucose concentrations. Such behavior confirmed the non-reversible catalytic reaction of glucose on the sensor surface. This peak was attributed to the conversion of Cu (III) to Cu (II) species (see Equation (2)) and confirmed the consumption of Cu (III) due to glucose oxidation.
The evolution of the cathodic peak against the scan rate was studied between 0.01 and 0.15 V s−1 to investigate the mechanism reaction (adsorption or diffusion controlled process). Figure 5b shows the copper-modified electrode response against 0.5 mM glucose concentration under alkaline conditions (0.1 M NaOH). The present study confirmed that the anodic peak signal had a linear relationship with the square root of the scan rate (inset), suggesting that a diffusion-limited reaction controlled the overall reaction rate. Finally, this increase was accompanied by an anodic peak shift to higher potentials, and was in good agreement with quasi-reversible reactions limited by charge transfer processes [33].
The sensor response against glucose was optimized. To this end, the sensor sensitivity was evaluated at different working potentials and in electrolyte solutions (NaOH range of concentrations from 0.001 to 0.5 M). CPA studies were conducted under stirring conditions (ca. 900 rpm). These variables were selected because both are involved in the generation of Cu (III) species on the electrode surface (see Equations (1) and (2)), affecting the response of sensor to glucose. Firstly, the optimization of the applied potential was performed in 0.1 M NaOH electrolyte solution. Figure 6 shows that at very low potentials (+0.2 V), the amperometric sensitivity is very low, increasing with the polarization of the electrode. The optimal response was found at +0.7 V, which agrees with the CV data reported in Figure 5. The latter potential is enough to produce active CuOOH species on the sensor surface to catalyze the conversion of glucose to gluconolactone (see Equation (2)). At higher potentials (ca. +0.8 V) the sensor response decreased, probably due to the water splitting reaction (oxygen evolution). The sensor response under different alkaline conditions showed negligible response at 0.001 M NaOH. On the contrary, in 0.1 M NaOH solution, the amperometric sensitivity increased to 90%, and no significant enhancement was found at higher concentrations (0.5 M NaOH). Such behavior may be justified due to the formation of CuOOH species on the surface of the electrode at high pH (see Equation (1)). Finally, 0.1 M NaOH and +0.7 V were used for further analysis.
Figure 7a shows the raw amperometric signal of the copper-modified electrode against glucose additions and its calibration curve after optimization (inset). The copper-modified ITO electrode presented a fast response, reaching ca. 90% of the total current after a few seconds (t90% ~3 s). These results confirmed the fast response of the copper-modified electrode, with high desorption rates of the intermediate products and electron transfer during the electrooxidation of glucose. At high glucose concentrations, the amperometric current decreased significantly. The loss of the sensor linearity was ascribed to the saturation of the active sites (Cu(III) species) and a lower kinetics, well-described by means of Langmuir isothermal kinetics [19], where adsorption/reaction/desorption processes occur consecutively. Under this approach, the current of the working electrode can be expressed as [19]:
I = K   [ G l u c ] 1 + K A   [ G l u c ]
where K is the sensitivity constant, [Gluc] is the concentration of glucose in the bulk solution, and KA is the adsorption equilibrium constant. By inverting and reordering Equation (4), we obtain the linearized version of the Langmuir isotherm:
1 I = 1 + K A   [ G l u c ]   K   [ G l u c ] = 1 K   [ G l u c ] + K A K
where the K and KA constants are obtained by plotting 1/I against 1/[Gluc]. The obtained K and KA values were 2.97 A M cm−2 and 1.2 10−4 A M−1 cm−2, respectively. Consequently, Equation (4) can be expressed as follows:
I = 2.97   [ G l u c ] 1 + 1.2 · 10 4   [ G l u c ]   2.97   [ G l u c ]  
When the glucose concentration is low, Equation (6) can be approximated as I = 2.97 [Gluc], and a sensitivity of 2.97 A M−1 cm−2 is obtained.
Figure 7b shows the sensor response in the linear region, below 1.6 mM glucose. Two different calibration linear ranges were observed. At very low glucose concentrations (up to 100 μM), the sensor exhibited a sensitivity of about 2.89 A M−1 cm−2 with a coefficient of determination (R2) of 0.999. The latter value agrees with the value obtained in Equation (6). The limit of detention (LOD; S/N = 3) and the limit of quantification (LOQ; S/N = 10) were 0.29 and 0.93 μM, respectively. The second linear range from 0.15 to 1.6 mM presented a sensitivity of 2.41 A M−1 cm−2, with a coefficient of determination (R2) of 0.999.
The reproducibility and repeatability were obtained to evaluate the feasibility of a copper-modified electrode for analytical applications. Therefore, the sensitivities of three different copper-modified electrodes (identically made electrodes) were used to estimate the reproducibility of the fabrication method, which was about 7%. On the other hand, the repeatability (using the same electrode) was obtained by determining the analytical signal of the sensor for five individual additions of 10 μM glucose. The latter parameter showed an excellent coefficient of variation of about 3.2%. Such results confirm both the excellent analytical properties of the copper-modified electrodes and the reliability of the fabrication method. The sensor stability (in normal storage conditions) was satisfactory after twelve weeks. The sensor response against glucose was evaluated during this period. The sensor response showed a very small response loss, lower than 5% after this period, confirming the excellent stability of the copper thin film deposited on the ITO electrode and its potential for further implementations in industrial and analytical applications. These results demonstrate the good electrocatalytic properties of the sensor with a low limit of detection and excellent sensitivity, better than previous values reported in the literature [19,22,32,34,35,36,37,38,39,40,41,42,43,44,45] (see Table 1).
The effect of other similar sugars (sucrose, lactose, and fructose) and common reducing agents (uric acid and ascorbic acid) found in biological and analytical matrixes were assessed. Such effects were evaluated, comparing the sensor response under similar concentrations for both the glucose and interferences. Figure 8 confirms that all tested sugars and electroactive compounds produced negligible interferences (<5%), even at the same concentrations. All these results demonstrate the good anti-interference properties and the high sensitivity/selectivity of the copper-based electrode for glucose determination in the pharmaceutical, medical, and agro-food sectors.
Reliability tests (for agro-food applications) were conducted to study their applicability for quantitative glucose detection in real samples. To this end, different commercial beverages were acquired from local stores. Prior to glucose determination, all soda beverages were degassed under ultrasound for fifteen minutes. Then, all samples were conveniently diluted in 0.1 M NaOH (1:10). Finally, three replicates (10 μL) of the previous solution were added to 0.1 M NaOH (10 mL) to determine the glucose concentration (previous sensor calibration). Table 2 shows the obtained results. First, the matrix effect in the real samples was studied. In order to do this, a sugar-free soda (Coke Zero soda) was used, and different glucose concentrations were added. Before adding the glucose, the sample (Cola Zero soda) did not show glucose over the limit of detection of the method (p < 0.05). Different amounts of glucose were later added (1.25, 2.5, 3.75 g/100 mL) to a sugar-free sample, and the glucose content was determined with the copper-modified sensor. The recoveries obtained (98–101%) showed the absence of a matrix effect and the correct determination of the spiked samples.
Finally, the glucose content in different juices, sodas, and sports drinks were studied. The results (Table 2) showed that ca. 50–60% of the labeled sugar concentration was glucose, whereas the rest may be attributable to other additives (sucrose, fructose, etc.) commonly used in manufactured beverages. Such results are in good agreement with the authors’ previous results [17] and others found in the literature [46,47].

4. Conclusions

In summary, the present study developed and characterized a copper oxide sensor for electrochemical glucose quantification. The study demonstrated that magnetron sputtering using an oblique angle deposition configuration is an effective technique for creating highly porous and columnar microstructures with a more substantial active surface area than non-structured transducers, resulting in improved analytical performance. The sensitivity observed in this study was superior to that of previous copper-modified electrodes described in the literature. The copper thin film’s microstructure was characterized by field-emission scanning electron microscopy (FE-SEM), which revealed interconnected channels that increased the active surface area and facilitated analyte diffusion. Additionally, X-ray photoelectron spectroscopy (XPS) was utilized to analyze the chemical composition and oxidation state of the copper thin film on the indium tin oxide (ITO) electrode’s surface. The obtained results confirmed the presence of Cu/Cu2O and CuO species, which render the thin film highly suitable for electrochemical glucose sensing. The electrode showed excellent reproducibility and anti-interference properties. The recoveries (98–101%) obtained in spiked soft drinks validated the practical applicability of such an electrode in real agro-food matrices. Finally, the glucose content in twelve commercial beverages (tea, fruit juice, soda, and sports drinks) showed that nearly 60% of the total sugar content reported on the label was glucose. Overall, this study provides valuable insights for the development of improved glucose sensors for clinical and agro-food applications.

Author Contributions

Conceptualization, P.A.S.-C. and F.G.-G.; methodology, S.C., P.A.S.-C., J.E.D.l.R.M. and F.G.-G.; validation, P.A.S.-C., F.G.-G., formal analysis, P.A.S.-C.; investigation, S.C., P.A.S.-C., J.E.D.l.R.M. and F.G.-G.; data curation, S.C., P.A.S.-C., J.E.D.l.R.M. and F.G.-G.; writing—original draft preparation, P.A.S.-C. and S.C.; writing—review and editing, S.C., P.A.S.-C., J.E.D.l.R.M. and F.G.-G.; visualization, P.A.S.-C. and S.C.; supervision, P.A.S.-C.; funding acquisition, P.A.S.-C. and S.C. All authors have read and agreed to the published version of the manuscript.

Funding

This research was funded by Interreg MAC 2014–2020 program (project: MacBioidi 2).

Institutional Review Board Statement

Not applicable.

Informed Consent Statement

Not applicable.

Data Availability Statement

Not applicable.

Conflicts of Interest

The authors declare no conflict of interest.

References

  1. Fernández, I.; Carinelli, S.; González-Mora, J.L.; Villalonga, R.; Salazar-Carballo, P.A. Nickel oxide Nanoparticles/Carbon Nanotubes Nanocomposite for Non-enzymatic Determination of Hydrogen Peroxide. Electroanalysis 2022, 35, e202200192. [Google Scholar] [CrossRef]
  2. Nikolova, M.P.; Chavali, M.S. Metal Oxide Nanoparticles as Biomedical Materials. Biomimetics 2020, 5, 27. [Google Scholar] [CrossRef] [PubMed]
  3. Carinelli, S.; Fernández, I.; Luis González-Mora, J.; Salazar-Carballo, P.A. Hemoglobin-modified nanoparticles for electrochemical determination of haptoglobin: Application in bovine mastitis diagnosis. Microchem. J. 2022, 179, 107528. [Google Scholar] [CrossRef]
  4. Keshavarz, M.; Kassanos, P.; Tan, B.; Venkatakrishnan, K. Metal-oxide surface-enhanced Raman biosensor template towards point-of-care EGFR detection and cancer diagnostics. Nanoscale Horiz. 2020, 5, 294–307. [Google Scholar] [CrossRef]
  5. Şerban, I.; Enesca, A. Metal Oxides-Based Semiconductors for Biosensors Applications. Front. Chem. 2020, 8, 354. [Google Scholar] [CrossRef]
  6. Tripathy, N.; Kim, D.-H. Metal oxide modified ZnO nanomaterials for biosensor applications. Nano Converg. 2018, 5, 27. [Google Scholar] [CrossRef]
  7. Ikram, M.; Rashid, M.; Haider, A.; Naz, S.; Haider, J.; Raza, A.; Ansar, M.T.; Uddin, M.K.; Ali, N.M.; Ahmed, S.S.; et al. A review of photocatalytic characterization, and environmental cleaning, of metal oxide nanostructured materials. Sustain. Mater. Technol. 2021, 30, e00343. [Google Scholar] [CrossRef]
  8. Shen, L.; Li, B.; Qiao, Y. Fe₃O₄ Nanoparticles in Targeted Drug/Gene Delivery Systems. Materials 2018, 11, 324. [Google Scholar] [CrossRef]
  9. Zhang, Z.; Liu, J.; Gu, J.; Su, L.; Cheng, L. An overview of metal oxide materials as electrocatalysts and supports for polymer electrolyte fuel cells. Energy Environ. Sci. 2014, 7, 2535–2558. [Google Scholar] [CrossRef]
  10. Nguyen, T.T.; Patel, M.; Kim, J. All-inorganic metal oxide transparent solar cells. Sol. Energy Mater. Sol. Cells 2020, 217, 110708. [Google Scholar] [CrossRef]
  11. Hernández-Ramírez, D.; Mendoza-Huizar, L.H.; Galán-Vidal, C.A.; Aguilar-Lira, G.Y.; Álvarez-Romero, G.A. Review—Trends on the Development of Non-Enzymatic Electrochemical Sensors Modified with Metal-Oxide Nanostructures for the Quantification of Uric Acid. J. Electrochem. Soc. 2021, 168, 057522. [Google Scholar] [CrossRef]
  12. Naikoo, G.A.; Salim, H.; Hassan, I.U.; Awan, T.; Arshad, F.; Pedram, M.Z.; Ahmed, W.; Qurashi, A. Recent Advances in Non-Enzymatic Glucose Sensors Based on Metal and Metal Oxide Nanostructures for Diabetes Management—A Review. Front. Chem. 2021, 9, 748957. [Google Scholar] [CrossRef] [PubMed]
  13. Chitare, Y.M.; Jadhav, S.B.; Pawaskar, P.N.; Magdum, V.V.; Gunjakar, J.L.; Lokhande, C.D. Metal Oxide-Based Composites in Nonenzymatic Electrochemical Glucose Sensors. Ind. Eng. Chem. Res. 2021, 60, 18195–18217. [Google Scholar] [CrossRef]
  14. Fan, H.; Le Boeuf, W.; Maheshwari, V. Au–Pt–Ni nanochains as dopamine catalysts: Role of elements and their spatial distribution. Nanoscale Adv. 2023, 5, 2244–2250. [Google Scholar] [CrossRef]
  15. Gautam, Y.K.; Sharma, K.; Tyagi, S.; Ambedkar, A.K.; Chaudhary, M.; Pal Singh, B. Nanostructured metal oxide semiconductor-based sensors for greenhouse gas detection: Progress and challenges. R. Soc. Open Sci. 2021, 8, 201324. [Google Scholar] [CrossRef]
  16. Garcia-Garcia, F.J.; Salazar, P.; Yubero, F.; González-Elipe, A.R. Non-enzymatic Glucose electrochemical sensor made of porous NiO thin films prepared by reactive magnetron sputtering at oblique angles. Electrochim. Acta 2016, 201, 38–44. [Google Scholar] [CrossRef]
  17. Salazar, P.; Rico, V.; González-Elipe, A.R. Non-Enzymatic Glucose Sensors Based on Nickel Nanoporous Thin Films Prepared by Physical Vapor Deposition at Oblique Angles for Beverage Industry Applications. J. Electrochem. Soc. 2016, 163, B704. [Google Scholar] [CrossRef]
  18. Salazar, P.; Rico, V.; González-Elipe, A.R. Nickel–copper bilayer nanoporous electrode prepared by physical vapor deposition at oblique angles for the non-enzymatic determination of glucose. Sens. Actuators B Chem. 2016, 226, 436–443. [Google Scholar] [CrossRef]
  19. Salazar, P.; Rico, V.; Rodríguez-Amaro, R.; Espinós, J.P.; González-Elipe, A.R. New Copper wide range nanosensor electrode prepared by physical vapor deposition at oblique angles for the non-enzimatic determination of glucose. Electrochim. Acta 2015, 169, 195–201. [Google Scholar] [CrossRef]
  20. Vyas, A.N.; Saratale, G.D.; Sartale, S.D. Recent developments in nickel based electrocatalysts for ethanol electrooxidation. Int. J. Hydrogen Energy 2020, 45, 5928–5947. [Google Scholar] [CrossRef]
  21. Saha, S.; Bansal, S.; Khanuja, M. Chapter 2—Classification of nanomaterials and their physical and chemical nature. In Nano-enabled Agrochemicals in Agriculture; Ghorbanpour, M., Shahid, M.A., Eds.; Academic Press: Cambridge, MA, USA, 2022; pp. 7–34. [Google Scholar] [CrossRef]
  22. Yang, H.; Bao, J.; Qi, Y.; Zhao, J.; Hu, Y.; Wu, W.; Wu, X.; Zhong, D.; Huo, D.; Hou, C. A disposable and sensitive non-enzymatic glucose sensor based on 3D graphene/Cu2O modified carbon paper electrode. Anal. Chim. Acta 2020, 1135, 12–19. [Google Scholar] [CrossRef] [PubMed]
  23. Abid, N.; Khan, A.M.; Shujait, S.; Chaudhary, K.; Ikram, M.; Imran, M.; Haider, J.; Khan, M.; Khan, Q.; Maqbool, M. Synthesis of nanomaterials using various top-down and bottom-up approaches, influencing factors, advantages, and disadvantages: A review. Adv. Colloid Interface Sci. 2022, 300, 102597. [Google Scholar] [CrossRef] [PubMed]
  24. Hwang, D.-W.; Lee, S.; Seo, M.; Chung, T.D. Recent advances in electrochemical non-enzymatic glucose sensors—A review. Anal. Chim. Acta 2018, 1033, 1–34. [Google Scholar] [CrossRef] [PubMed]
  25. Zhu, C.; Lv, T.; Yang, H.; Li, X.; Wang, X.; Guo, X.; Xie, C.; Zeng, D. Influence of magnetron sputtering process on the stability of WO3 thin film gas sensor. Mater. Today Commun. 2023, 34, 105116. [Google Scholar] [CrossRef]
  26. Lin, X.; Xu, Y.; Pan, X.; Xu, J.; Ding, Y.; Sun, X.; Song, X.; Ren, Y.; Shan, P.-F. Global, regional, and national burden and trend of diabetes in 195 countries and territories: An analysis from 1990 to 2025. Sci. Rep. 2020, 10, 14790. [Google Scholar] [CrossRef]
  27. Fruh, S.M. Obesity: Risk factors, complications, and strategies for sustainable long-term weight management. J. Am. Assoc. Nurse Pract. 2017, 29, S3–S14. [Google Scholar] [CrossRef]
  28. Diabetes Atlas, 10th ed.; International Diabetes Federation (IDF): Brussels, Belgium, 2021.
  29. Giri, S.D.; Sarkar, A. Electrochemical Study of Bulk and Monolayer Copper in Alkaline Solution. J. Electrochem. Soc. 2016, 163, H252. [Google Scholar] [CrossRef]
  30. Fang, J.; Xuan, Y. Investigation of optical absorption and photothermal conversion characteristics of binary CuO/ZnO nanofluids. RSC Adv. 2017, 7, 56023–56033. [Google Scholar] [CrossRef]
  31. Shaban, M.; Abdelkarem, K.; El Sayed, A.M. Structural, optical and gas sensing properties of Cu2O/CuO mixed phase: Effect of the number of coated layers and (Cr + S) co-Doping. Phase Transit. 2019, 92, 347–359. [Google Scholar] [CrossRef]
  32. CHEN, F.; SHAO, B.; ZHAI, W.; MA, X. Highly sensitive glucose sensor based on hierarchical CuO. Sci. China Technol. Sci. 2021, 64, 65–70. [Google Scholar] [CrossRef]
  33. Laviron, E. General expression of the linear potential sweep voltammogram in the case of diffusionless electrochemical systems. J. Electroanal. Chem. Interfacial Electrochem. 1979, 101, 19–28. [Google Scholar] [CrossRef]
  34. Pourbeyram, S.; Mehdizadeh, K. Nonenzymatic glucose sensor based on disposable pencil graphite electrode modified by copper nanoparticles. J. Food Drug Anal. 2016, 24, 894–902. [Google Scholar] [CrossRef] [PubMed]
  35. Zhang, Y.; Liu, Y.; Su, L.; Zhang, Z.; Huo, D.; Hou, C.; Lei, Y. CuO nanowires based sensitive and selective non-enzymatic glucose detection. Sens. Actuators B Chem. 2014, 191, 86–93. [Google Scholar] [CrossRef]
  36. Luo, L.; Zhu, L.; Wang, Z. Nonenzymatic amperometric determination of glucose by CuO nanocubes-graphene nanocomposite modified electrode. Bioelectrochemistry 2012, 88, 156–163. [Google Scholar] [CrossRef]
  37. Zhang, Y.; Su, L.; Manuzzi, D.; de los Monteros, H.V.E.; Jia, W.; Huo, D.; Hou, C.; Lei, Y. Ultrasensitive and selective non-enzymatic glucose detection using copper nanowires. Biosens. Bioelectron. 2012, 31, 426–432. [Google Scholar] [CrossRef] [PubMed]
  38. Hsu, Y.-W.; Hsu, T.-K.; Sun, C.-L.; Nien, Y.-T.; Pu, N.-W.; Ger, M.-D. Synthesis of CuO/graphene nanocomposites for nonenzymatic electrochemical glucose biosensor applications. Electrochim. Acta 2012, 82, 152–157. [Google Scholar] [CrossRef]
  39. Wu, H.-X.; Cao, W.-M.; Li, Y.; Liu, G.; Wen, Y.; Yang, H.-F.; Yang, S.-P. In situ growth of copper nanoparticles on multiwalled carbon nanotubes and their application as non-enzymatic glucose sensor materials. Electrochim. Acta 2010, 55, 3734–3740. [Google Scholar] [CrossRef]
  40. Ashok, A.; Kumar, A.; Tarlochan, F. Highly efficient nonenzymatic glucose sensors based on CuO nanoparticles. Appl. Surf. Sci. 2019, 481, 712–722. [Google Scholar] [CrossRef]
  41. Yang, S.; Li, G.; Wang, D.; Qiao, Z.; Qu, L. Synthesis of nanoneedle-like copper oxide on N-doped reduced graphene oxide: A three-dimensional hybrid for nonenzymatic glucose sensor. Sens. Actuators B Chem. 2017, 238, 588–595. [Google Scholar] [CrossRef]
  42. Chen, H.; Fan, G.; Zhao, J.; Qiu, M.; Sun, P.; Fu, Y.; Han, D.; Cui, G. A portable micro glucose sensor based on copper-based nanocomposite structure. New J. Chem. 2019, 43, 7806–7813. [Google Scholar] [CrossRef]
  43. Vinoth, V.; Shergilin, T.D.; Asiri, A.M.; Wu, J.J.; Anandan, S. Facile synthesis of copper oxide microflowers for nonenzymatic glucose sensor applications. Mater. Sci. Semicond. Process. 2018, 82, 31–38. [Google Scholar] [CrossRef]
  44. Wang, A.; Yang, Y.; Zhao, Q.; Ji, X. Facile hydrothermal synthesis CuO microflowers for non-enzymatic glucose sensors. Micro Nano Lett. 2022, 17, 107–113. [Google Scholar] [CrossRef]
  45. State Rosoiu, S.; Enache, L.B.; Potorac, P.; Prodana, M.; Enachescu, M. Synthesis of Copper Nanostructures for Non-Enzymatic Glucose Sensors via Direct-Current Magnetron Sputtering. Nanomaterials 2022, 12, 4144. [Google Scholar] [CrossRef] [PubMed]
  46. Walker, R.W.; Dumke, K.A.; Goran, M.I. Fructose content in popular beverages made with and without high-fructose corn syrup. Nutrition 2014, 30, 928–935. [Google Scholar] [CrossRef] [PubMed]
  47. Ventura, E.E.; Davis, J.N.; Goran, M.I. Sugar Content of Popular Sweetened Beverages Based on Objective Laboratory Analysis: Focus on Fructose Content. Obesity 2011, 19, 868–874. [Google Scholar] [CrossRef] [PubMed]
Figure 1. Scheme and mechanism of the deposition of nanoporous copper thin films by magnetron sputtering under the oblique angle deposition approach (MS-OAD).
Chemosensors 11 00260 g001
Figure 2. SEM image of a nanoporous copper thin film deposited on a silicon wafer: plan-view (a) and cross-section micrograph (b).
Chemosensors 11 00260 g002
Figure 3. (a) High-resolution XPS spectrum of Cu 2p 3/2 and Cu 2p1/2 core-level lines; (b) XPS profile and fitting results for the Cu 2p3/2 line.
Chemosensors 11 00260 g003
Figure 4. (a) Raman spectra for CuO/Cu2O thin film; (b) cyclic voltammogram (scan rate of 0.1 V s−1) of ITO/CuO/Cu2Oelectrode in 0.1 M NaOH solution as a supporting electrolyte.
Chemosensors 11 00260 g004
Figure 5. (a) Cyclic voltammograms (CVs) of the copper sensor in 0.1 M NaOH solution with different glucose concentrations at 0.1 V s−1 against an Ag/AgCl (3 M) reference electrode (inset: linear dependence of the anodic peak against glucose concentration). (b) CVs of the copper sensor in 0.1 M NaOH solution at different scan rates (inset: linear relationship between the square root of the scan rate and the cathodic peaks).
Chemosensors 11 00260 g005
Figure 6. Normalized current response under stirring conditions (900 rpm) against glucose concentration of the copper sensor in the range of 0.001–0.5 M NaOH (blue line) and at working potentials from +0.2 to +0.8 V (red line).
Chemosensors 11 00260 g006
Figure 7. (a) Amperometric response of the copper-modified electrode under optimized working conditions (inset: calibration curve in the range 0–5 mM glucose); (b) linear calibration from 0 to 1.6 mM glucose (inset: linear calibration in the range 0–100 μM).
Chemosensors 11 00260 g007
Figure 8. Amperometric current of the copper-modified electrode for 50 μM glucose and different potential interferences (at the same concentration level). Interferences: sucrose (suc), fructose (fruc), lactose (lac), ascorbic acid (AA), and uric acid (UA).
Chemosensors 11 00260 g008
Table 1. Comparison of the main analytical characteristics of the copper-modified ITO electrode and various copper-based non-enzymatic glucose sensors.
SensorSensitivity
(μA mM−1 cm−2)
Detection Limit
(μM)
Linear Range
(mM)
Reference
Cu(NP)-PGE14670.44up to 1 [34]
CuO-NWs6422-[35]
CuO-G13600.70.002–4[36]
ITO/Cu/CuO14060.36up to 1[19]
CuO-NWs4200.035up to 3[37]
CuO-G-GCE10651up to 8[38]
MWCNT/PEI/Cu7150.50.01–0.3[39]
CuO20620.250.001–0.85[40]
N-rGO/CuO14200.010.001–2.5[41]
CuO16210.20.0005–5[42]
Cu/CuO10665.1-[43]
CuO-mFlw98.41.3up to 11 [44]
H-nanoCuO11800.4up to 5.5[32]
CFP/GWs/Cu2O-0.21up to 5[22]
GCE/CuNCs20985.2up to 2[45]
ITO/CuO/Cu2O28910.290.00093–0.1This work
ITO/CuO/Cu2O2413-0.1–1.6This work
NP: nanoparticles; PGE: pencil graphite electrode; NWs: nanowires; G: graphene; ITO: indium tin oxide; GCE: glassy carbon electrode; MWCNT: multiwalled carbon nanotube; PEI: polyethylenimine; N-rGO: N-doped reduced graphene oxide; CuO-mFlw: CuO microflowers; H-nanoCuO: hierarchical nanostructured CuO; CFP/GWs/Cu2O: carbon fiber paper-graphene wall/Cu2O; CuNCs: copper nanocolumns.
Table 2. Comparison of the glucose content in commercial beverages, along with the recovery experiments.
SampleTotal Sugar *Glucose *Recovery (%)C.V. (%) #
Coke Zero soda0N.D.--
Coke Zero soda1.25 †1.251002.3
Coke Zero soda2.5 † 2.45983.8
Coke Zero soda3.75 †3.78100.84.8
Apple juice9.54.25--
Apple juice1.25 †5.4198.44.6
Apple juice2.5 † 6.83101.23.8
Apple juice3.75 †7.6795.94.3
Orange soda9.35.559.13.4
Coke soda10.66.662.33.2
Passion Fruit Zero soda0N.D.--
Tropical fruit milk4.93.163.35.0
Isotonic drink4.42.761.42.9
Non-sugar tea beverage0N.D.--
Mango juice3.01.653.34.0
Peach juice5.03.263.94.3
Tea beverage8.43.642.94.9
Pineapple juice5.73.357.92.4
Lemon-Lime soda4.62.452.22.1
* = g/100 mL; N.D. = non detected (p = 0.05); † = added glucose; C.V. = coefficient of variance; # n = 3.
Disclaimer/Publisher’s Note: The statements, opinions and data contained in all publications are solely those of the individual author(s) and contributor(s) and not of MDPI and/or the editor(s). MDPI and/or the editor(s) disclaim responsibility for any injury to people or property resulting from any ideas, methods, instructions or products referred to in the content.

