Article

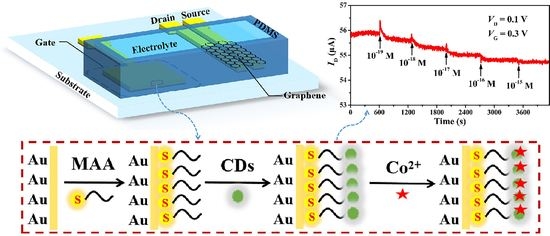
Carbon Dot-Functionalized Solution-Gated Graphene Transistors for Highly Sensitive Detection of Cobalt(II) Ions

1
Key Laboratory for the Green Preparation and Application of Functional Materials, Hubei Key Laboratory of Polymer Materials, Collaborative Innovation Center for Advanced Organic Chemical Materials Co-Constructed by the Province and Ministry, School of Materials Science and Engineering, Hubei University, Ministry of Education, Wuhan 430062, China
2
Key Laboratory of Organosilicon Chemistry and Material Technology of Ministry of Education, Hangzhou Normal University, Hangzhou 311121, China
*
Authors to whom correspondence should be addressed.
Chemosensors 2023, 11(3), 192; https://doi.org/10.3390/chemosensors11030192
Submission received: 12 February 2023 / Revised: 10 March 2023 / Accepted: 13 March 2023 / Published: 15 March 2023

Abstract

:
A carbon dot-functionalized solution-gated graphene transistor (CD-SGGT) was designed and prepared via the modification of CDs on the gate of SGGT. The above CDs were hydrothermally synthesized using DL-thioctic acid and triethylenetramine as C, N and S sources. The average size of CDs was ~6.2 nm, and there were many amino and carboxyl groups on the CDs’ surfaces. The CDs was then used as a probe for preparation of CD-SGGT sensor for the cobalt(II) (Co2+) ions detection. The CD-SGGT sensor showed excellent sensitivity and high selectivity. Remarkably, the limit of detection (LOD) reached 10−19 M. The linear detection range was obtained from 10−19 to 10−15 M. Additionally, the CD-SGGT also showed fast response and good stability.

Graphical Abstract

1. Introduction

Cobalt is a rare element in some minerals of the earth’s crust. It is not only used in various industrial productions, it is also important in various physiological and pathological processes [1]. The concentration of cobalt ions in the human body should especially be controlled within an appropriate range to maintain a complex and long-lasting life system [2,3]. An excessive Co2+ ions intake can lead to some serious health problems, such as emesis, paralysis, diarrhea, and hypotension. Additionally, Co2+ ions deficiency can also lead to harmful anemia, anorexia, and chronic swelling [4,5,6]. Given the importance of Co2+ ions in human life [7,8,9], several methods were reported to detect Co2+ ions. The conventional detection methods such as surface enhanced Raman scattering spectroscopy (SERS) [10], inductively coupled plasma mass spectrometry (ICP-MS) [11,12], electrochemical methods [13], and colorimetric [14] were reported for Co2+ detection. However, these detection methods suffer from some drawbacks, including expensive equipment and complex processing procedures, as well as long time consumption.
To solve the above issues, the fluorescent nanoparticles, e.g., carbon dots (CDs), were widely used as the fluorescent probes for the detections of various metal ions over the last decade owing to their advantages, such as good water solubility, suitable size, low cost, good biocompatibility, and unique surface structure [15,16]. For example, as for detection of Co2+ ions, Du et al. [17] prepared the multifunctional N-doped carbon nanodots (N-CNDs) as fluorescent probes to achieve dual detection of Co2+ ions and vitamin B12. The limit of detection (LOD) for Co2+ ions was 230.5 mM and the linear detection range was 2.5–25 mM. Additionally, Wissuta Boonta et al. [6] prepared a N, S-GQD fluorescent sensor and the LOD reached 1.25 mM. Although the CDs-based fluorescent detection method had their advantages, such as low-cost and good selectivity, the other performances such as sensitivity, LOD, and detection time still require improvement in the practical applications.
The solution-gated graphene transistor (SGGT) was widely used as a sensor for detecting ions [18], glucose [19], pH [20], dopamine [21], protein [22], DNA [23], cells [24], viruses [25,26], etc., over the last decade. The SGGT sensor can solve the above issues owing to its advantages, such as high sensitivity, ultralow LOD, rapid detection, wide detection range, and good stability, etc. [27,28,29,30]. Based on this, a new type of carbon dot-functionalized solution-gated graphene transistor (CD-SGGT) was designed and prepared by our group, which was further used as a sensor for the detection of metal ions [31,32]. First, a flexible CQD-SGGT Cu2+ ion sensor was produced by using functionalization of carbon quantum dots (CQDs) from hydrothermal treatment of sodium alginate and ethylenediamine. The sensor had a good linear relationship in the range of 10−14–10−4 M, and the LOD for detecting Cu2+ ions was low to 10−14 M. Furthermore, a highly sensitive Fe3+ sensor based on the CQD-SGGT was prepared by using CQDs as functional probes from the hydrothermal method of sodium lignosulfonate and p-phenylenediamine. The LOD for Fe3+ ions could be reduced to 10−16 M and good linear range of 10−16–10−4 M could be obtained.
Based on our previous work [31,32], to further explore the detection capability of CDs-based SGGT, we designed a new CD-SGGT sensor for fast and highly sensitive detection of Co2+ ions. The CDs was hydrothermally synthesized using DL-thioctic acid and triethylenetramine as S, N, C sources. The surfaces of CDs had many carboxyl and amino groups. The CD-SGGT sensor exhibited the ultralow LOD of 10−19 M and a good linear range from 10−19 to 10−15 M. The sensor also showed a good selectivity to Co2+ ions. Finally, the detection mechanism of CD-SGGT is discussed.

2. Materials and Methods

2.1. Materials

Soda-lime glass substrates were purchased from Luoyang Guluo Glass Co., Ltd. (Luoyang). The single-layer graphene on copper foil was purchased from 6Carbon Technology (Shenzhen) (China). Triethylene tetramine (TETA), thioctic acid (T-acid), phosphate-buffered saline (PBS) acetone, isopropanol, ethanol, lithium chloride (LiCl), magnesium chloride (MgCl2), manganese chloride (MnCl2), nickel chloride (NiCl2), lead chloride (PbCl2), zinc chloride (ZnCl2), barium chloride (BaCl2), silver chloride (AgCl), aluminum chloride (AlCl3), cupric chloride (CuCl2), ferric chloride (FeCl3), cobalt chloride (CoCl2), poly dimethylsiloxane (PDMS), mercaptoacetic acid (MAA), cysteamine, 1-(3-dimethy-laminopropyl)-3-ethyl carbodiimide hydrochloride (EDC), N-hydroxysuccinimide (NHS), and poly methyl methacrylate (PMMA) were purchased from Shanghai Aladdin Biochemical Technology Co., Ltd. (Shanghai). All the chemical reagents were of analytical grade and used without further purification. Ultrapure deionized (DI) water was obtained from Chengdu Infiltration Technology Co., Ltd. (Chengdu) and used throughout the experiment.

2.2. Preparation of CDs

The synthesis of CDs followed the previous report [33]; briefly, thioctic acid (0.2064 g) and triethylenetramine (1 mL) was dissolved in 9 mL of water, and stirred for 5 min at room temperature. Then, the above solution was transferred to a polytetrafluoroethylene (Teflon)-lined autoclave (50 mL) and heated at 200 °C for 2 h and was then allowed to cool to room temperature. The products were centrifuged for 10 min at 12,000 rpm. The prepared suspensions containing CDs were filtered through 0.22 μm filter membranes and were then subjected to dialysis (1000 Da molecular weight cutoff) for about 48 h. The resulting dialysate was concentrated to 10 mL and stored at 5 °C.

2.3. Device Fabrication

Patterned Au (~120 nm)/Cr (~12 nm) gate, source, and drain electrodes were deposited on substrate (electronic grade glass) by evaporation-coating instrument. CVD-grown single-layer graphene on copper foils was transferred to the confined channel area between source and drain (0.2 × 6 mm2) by PMMA wet transfer method and was then heated at approximately 65 °C for 10 min and 105 °C for 30 min. Graphene/PMMA films were dipped in acetone to remove the PMMA layer. Then, the device was soaked in deionized water twice (5 min each) and dried naturally.

2.4. Gate Electrode Modification with CDs

The 10 μL MAA (50 mM) was modified on the gate electrode overnight. Then, 10 μL EDC/NHS solution (0.2 mM/0.5 mM, PBS solution, pH = 5.5) was dropped on the electrode surface to activate carboxyl group and kept for 3 h. The gold grid electrode was rinsed three times with PBS buffer. An aqueous solution of 10 μL CDs was dropped dropwise to the electrode surface and kept for 3 h. Finally, the electrode was washed three times with PBS buffer to remove the unfixed CDs.

2.5. Device Test

The SGGT was tested at a fixed VD = 0.1 V with a scan rate of 0.02 V s−1, and the PBS was used as electrolyte for all measurements. The device performances, including transfer curves (ID vs. VG) and time-dependent channel currents (ID vs. Time), were characterized using two probe Keithley 2400 source meters controlled by a computer with a LabVIEW program. The detection limit of each device was defined by the channel current response at the condition of signal/noise > 3.

3. Results and Discussion

3.1. Synthesis and Characterization of CDs

Figure 1a shows the transmission electron microscopy (TEM) image of CDs. The results show that the prepared CDs were spherical nanoparticles with good dispersion. In the inset of Figure 1a, high- resolution TEM (HRTEM) image of the CDs showed that the CDs exhibited the obvious lattice stripes and a lattice spacing was ~0.26 nm, which fit well with the (100) plane of graphite [34]. It indicated that the CDs had the good crystallization. As shown in Figure S1, the average size of the CD was ~6.2 nm. Figure 1b showed the absorption spectrum of CDs and the fluorescence spectrum of CDs under excitation of 320 nm UV light. The main emission peak was at 420 nm. The absorption peak was attributed to the π-π* transition of aromatic sp2 hybridization.
Figure 1c shows the Fourier transform infrared (FTIR) spectrum of CDs. The peak at 3420 cm−1 represents the stretching vibration signal of O-H. The peak at 2945 cm−1 and 2860 cm−1 were corresponding to the vibration of the C-H bond. The peak at 1635 cm−1 was attributed to the vibration of the group C=O [35,36]. Both 1484 cm−1 and 1316 cm−1 were characteristic peaks of C-N. The peaks of 1105 cm−1 and 1040 cm−1 can be assigned to C-O and C-S. The evidence suggested that N and S were well doped into the CDs and the surfaces of CDs containing a lot of amino and carboxyl groups [37,38]. In order to determine the chemical composition of CDs, the X-ray photoelectron spectrum (XPS) of CDs was performed. Figure 1d shows the full scan XPS spectrum of CDs. The peaks at ~531 eV, ~400 eV, ~285 eV, ~227 eV, and ~163 eV were assigned as O1s, N1s, C1s, S2s, and S2p, respectively. Figure 2a shows the high-resolution spectra of the C1s.The peaks at 286.8 eV, 285.9 eV, and 284.8 eV were corresponding to C-O-C, C-N, and C-C/C=C groups, respectively. In Figure 2b, the typical O1s spectrum displayed three distinct peaks at 532.7 eV, 531.8 eV, and 530.7 eV, corresponding to the C-OH, C=O, and C=O/C-O-C/C-OH, respectively. The high-resolution N1s spectrum in Figure 2c indicated the presence of C-N-C, N-(C)3, and N-H groups at 401.2 eV, 400.2 eV, and 399.1 eV, respectively. The sulfur peaks of the CDs can be fitted into four peaks, as shown in Figure 2d. The peaks at 168.6 eV and 167.2 eV can be corresponding to C-S-O and S=O, respectively. The peaks at 164.4 eV and 163.3 eV corresponded to the S2p3/2 and S2p1/2, respectively. These results again proved that the CDs were doped with N and S, and had many carboxyl and amino groups on their surfaces. These functional groups not only allowed the amino groups of the CDs to bind with the carboxyl groups of MAA to immobilize CDs, but also allowed the remaining groups on the surface of CDs as the probes to recognize and screen Co2+ ions.

3.2. Detection of Co2+ Ions Using CD-SGGT

Figure 3 shows the diagram of the device structure and detection process of the CD-SGGT, as well as the specific process of CDs modification on the gate surface. MAA was firstly used to modify the gate electrode and form the Au-S bond by self-assembly method [31,32]. Next, the carboxyl group of MAA was activated by EDC/NHS. Additionally, CDs were then immobilized on the electrode surface by condensation of amino and carboxyl groups. The CDs modified on the gate surface of SGGT can be used as probes for metal ions detection. The whole test process was carried out in PBS solution (pH = 7.2) in PDMS well. A voltage (VG) was applied to the gate, and a constant channel voltage (VD) of 0.1 V was applied crossing the source to the drain. By adding the different concentration of Co2+ ions to the PDMS well, the transfer curve shift (ΔVDirac) and channel current change (ΔID) was measured accordingly to evaluate the Co2+ ions sensor.
Figure 4a and Figure S2 show the selectivity of the CD-SGGT sensor to Co2+ ions. A total of 13 metal ions, including Mg2+, Zn2+, Mn2+, Hg2+, Li+, Ba2+, Ni2+, Pb2+, Al3+, Cu2+, Fe3+, Ag+, and Co2+ ions were selected for the comparison of the response level. The |ΔID| of Co2+ ions was as least 2.3 times higher compared to other 12 metal ions. This suggested that the CD-SGGT sensor had a good selectivity to Co2+ ions compared to other ions. As shown in Figure S3, the results showed that the CD-SGGT sensor did not respond to the PBS addition, indicating that the PBS in the PDMS well in the test environment had no effect on the CD-SGGT sensor. The addition of 12 mixed ions solutions (without Co2+ ions) resulted in little ID response of the CD-SGGT sensor. However, 13 mixed ions solutions (including Co2+ ions) were added. The response ID of the sensor increased. This indicates that the CD-SGGT sensor alone had the strongest signal response to the Co2+ ions. Then, a Co2+ ions solution (10−5 M) was added to the PDMS well, and the ID also increased. This again proved that the prepared CD-SGGT sensor had good selectivity for Co2+ ions. Since the CDs were used as probes on the surface of the gate electrode, the selectivity probably came from the specific interaction between surface groups and Co2+ ions. Furthermore, the LOD and linear detection range for Co2+ ions were explored. Figure 4b shows that the transfer curves of the sensor were measured at the different concentration of Co2+ ions. The transfer curves show the bipolar transfer property. Figure S4 shows the Raman spectrum of a single layer graphene on a silicon substrate. The D (~1350 cm−1), G (~1583 cm−1), and 2D (~2680 cm−1) peaks were attributed to the three characteristic peaks of graphene. This means that wet-chemically transferred CVD-grown graphene could act as a conductive channel without destroying its monolayer structure [39,40]. With the increase in Co2+ ions concentration from 10−19 M to 10−15 M in the PDMS well, the Dirac point (VDirac) of the transfer curve shifted towards the negative gate voltage direction from 0.56 V to 0.5 V. This means that ID will decrease with the concentration increase in Co2+ ions when the applied VG is taken at the left of the Dirac point. Figure S5a is the SEM image of the gate electrode surface of the CD-SGGT sensor after the test. The corresponding elemental mapping images of S, Co, and S/Co are shown in Figure S5b–d. As shown in Figure S6, the impedance of the gate electrode with the CDs functionalization increased compared to that of gate electrode without the unmodified CDs. This result illustrates that the CDs was successfully modified on the gate surface. The impedance of the gate electrode also increased after testing. This result indicates that the CDs probe successfully captured the Co2+ ions. Therefore, the CD-SGGT sensor we prepared allowed for the detection of Co2+ ions. It indicates that the Co2+ ions were well captured by the probes to the surface the gate electrode. Figure 4c shows the channel current-time response of the sensor with the different concentration of Co2+ ions from 10−19 M to 10−15 M. The inset of Figure 4c shows transfer curve of this device without the addition of Co2+ ions. It can be observed that the ID will decrease with the concentration increase in Co2+ ions, which is consistent with transfer curve shift. In addition, the response time was ~ 165 s. Figure 4d shows that the ΔID had a good linear relationship with the logarithm of Co2+ ions concentrations in range of 10−19–10−15 M. The LOD of the sensor can reach 10−19 M that was 16 orders of magnitude lower than those of the Co2+ ions fluorescence sensor [18]. It indicates the CD-SGGT sensor had high sensitivity and ultralow LOD (see Table S1), which was attributed to the unique binding ability between CDs and Co2+ ions and the inherent amplification function of SGGT. In addition, the stability test of the CD-SGGT sensor was carried out, as shown in Figure S7. It can be seen that the transfer curves of CD-SGGT showed few shifts for 11 consecutive scans of the transfer curve, indicating that the sensor had good stability and could be used for the detection of Co2+ ions.

3.3. Fluorescence Detection of Co2+ Ions Using CDs

To further compare the performances between photoluminescence spectroscopy (PL) detection and SGGT sensor, the CDs were directly used as fluorescent probes for Co2+ ions detection. The selectivity for Co2+ ions were first demonstrated, as shown in Figure 5a,b. The CDs would happen to quench at various metal ions solutions, including Mg2+, Zn2+, Mn2+, Hg2+, Li+, Ba2+, Ni2+, Pb2+, Al3+, Cu2+, Fe3+ Ag+, and Co2+ ions. Evidently, Co2+ ions lead to the highest quench of CDs PL and the fluorescence quench was as high as 95%. This indicates that the CDs also had the good selectivity for Co2+ ions. The selectivity of the sensor to Co2+ ions may be attributed to the internal filtering effect of CDs [41]. Figure 5c shows that PL intensity of CDs at the different concentration of Co2+ ions. The fluorescence intensity of CDs solutions decreased with the increase in Co2+ ions concentration from 10 μM to 100 μM. This was consistent with the results of the SGGT sensors. Figure 5d shows that the concentration of Co2+ ion had a good linear relationship with the percentage of CDs fluorescence intensity reduction. The results showed that the CDs had excellent ion selectivity for Co2+ ions under PL test, and the LOD was 10−5 M [42,43,44]. Compared with the SGGT sensor, the PL detection had the same selectivity of ion, but the detection range was narrower and the LOD was higher.

3.4. The Sensing Mechanism of CD−SGGT for Co2+ Ions Detection

To demonstrate the detection mechanism, cysteamine was used instead of MAA to modify the gate electrode. The CDs were immobilized on the gate by combining the amino groups of cysteamine with the carboxyl groups on the surfaces of CDs. In this case, the carboxyl group number of CDs surface of CD-SGGT sensor based on cysteamine modification would be lower than that of CD-SGGT sensor based on MAA modification. Figure 6a shows the transfer curves of the device modified by the cysteamine at the different concentrations of Co2+ ions. Figure S8 shows the transfer curve of this device without the addition of Co2+ ions. Similarly, the Dirac point also shifted to the left, as observed, with the increase in Co2+ concentrations of ions. The rule of Dirac point is similar to that of the device modified with MAA. Figure 6b shows that when the concentration of Co2+ ion increased from 10−19 M to 10−9 M, the ID intensity also gradually decreased at the voltage of VD = 0.1 V, VG = 0.1 V. However, the response time of CD-SGGT modified with cysteamine was ~805 s, which was far longer than that of CD-SGGT modified with MAA. It indicates the carboxyl groups on the surface of CDs in the CD-SGGT modified with MAA was the dominant sensing mechanism. Therefore, the carboxyl groups on the surface of CDs played a dominant role in the detection of Co2+ ions.
Based on this, the sensing mechanism is given in Figure 6c,d. At the applied gate voltage, two electric double layers (EDL) were formed at the channel/electrolyte interface and the gate/electrolyte interface, respectively. When the Co2+ ions solution was dropped into the PDMS well, the functional groups on the surfaces of CDs will screen the Co2+ ions in the solution due to diffusion effect. Because of the strong complexation reaction between Co2+ ions and the carboxyl group, Co2+ ions will form the coordination bond, resulting in the chemical absorption of Co2+ ions on the surfaces of CDs. As shown in Figure 6c, when the two carboxyl groups coordinate with one Co2+ ion, the distance between the gate electrode and the negatively charged ions (the thickness of EDL) decreased due to the bending of the carboxyl branches, i.e., the thickness of EDL near the gate electrode will decrease. The capacitance of the device can be expressed as the following equation.
C 1 d
1 C = 1 C G E + 1 C E C
where C is the capacitance and d is the thickness of the EDL. CG−E and CE−C are the capacitances of the two EDLs at the gate/electrolyte and electrolyte/graphene interfaces, respectively. According to Equations (1) and (2), the thickness decrease in the EDL near the gate electrode will lead to the increase in the CG−E. Thus, the total capacitance (C) of the whole transistor will increase. Figure 6d shows the potential drops crossing the two EDLs before/after the Co2+ ions are captured. When the Co2+ ions are captured by the CDs on the gate electrode, the potential will redistribute due the change of the capacitance of the EDL near the gate electrode. Furthermore, the channel current ID varies with VG and can be expressed as
I D W L μ C i V G V Dirac V DS V G V Dirac > > V DS
where VDS and VG are the voltages applied to the drain and gate electrodes, respectively; W and L are the width and length of the channel, respectively; μ is the mobility of graphene carriers (electrons or holes); Ci is the gate capacitance; VDirac is the voltage at the charge neutral point. If the ID of the device remains constant, according to Equation (2), a lower VG is required when the Ci increases. Therefore, with the increase in Co2+ ions concentration, the transfer curve of the device will shift towards the negative gate voltage direction.

4. Conclusions

In conclusion, a new type of CD-SGGT was prepared by using CDs to modify the gate surface of SGGT. The CD-SGGT showed a good current response for Co2+ ions, which realized the detection of Co2+ ions. The CD-SGGT sensors not only showed high selectivity, but also good sensitivity. The LOD of the sensor reached 10−19 M and there was a good linear detection range of 10−19–10−15 M. The CD-SGGT sensor exhibited a rapid response for Co2+ ions when using MAA as a modifier and had good stability. Furthermore, through the demonstration of detection mechanism, it was deduced that the carboxyl groups on the surface of CDs played a key role in the detection of Co2+ ions. The development of highly sensitive and selective solution-gate transistor sensors with CDs functionalized gates opens up a new path for Co2+ ions detection.

Supplementary Materials

The following supporting information can be downloaded at: https://www.mdpi.com/article/10.3390/chemosensors11030192/s1. Figure S1: the size distribution of the CDs; Figure S2: (a) Selectivity measurements of the CD-SGGT sensor. Comparison of the sensor in response to the target Co2+ ions or other metal ions, i.e., Ag+, Al3+, Ba2+, Cu2+, Fe3+, Hg2+, Li+, Mg2+, Mn2+, Ni2+, Pb2+, Zn2+ ions (the concentration of all the ions was 1.0 × 10⁻¹⁵ M) (b) The transfer curves of the SGGT under the corresponding condition; Figure S3: Test of the selectivity of the CD-SGGT sensor, i.e., PBS, (Mg2+, Zn2+, Mn2+, Hg2+, Li+, Ba2+, Ni2+, Pb2+, Al3+, Cu2+, Fe3+ and Ag+) ions mixed solution (1.0 × 10⁻¹⁵ M), (Mg2+, Zn2+, Mn2+, Hg2+, Li+, Ba2+, Ni2+, Pb2+, Al3+, Cu2+, Fe3+, Ag+ and Co2+) ions mixed solution (1.0 × 10⁻¹⁵ M), Co2+ ions (1.0 × 10⁻¹⁵ M); Figure S4: Raman spectrum of a single-layer graphene on Si substrate; Figure S5: Characterization of the gate surface after detection. (a) SEM image of the gate electrodes after detecting Co2+ ions. (b), (c), (d) Element mapping result of the gate electrodes after detecting Co2+ ions; Figure S6: Impedance test on gate surface (bare gold, functionalized CDs, and after test); Figure S7: The transfer curve of CD-SGGT was tested 11 times consecutively; Figure S8: The transfer curves of the SGGT under the corresponding condition (Figure 6b); Table S1: Comparison of recently reported various methods for detection of Co2+ ions.

Author Contributions

Z.R. performed the device fabrication, device characterization, electrical characterization, data analysis and manuscript writing; C.X. synthesized the CDs; M.D. performed XPS characterization; Z.L. and H.Z. performed fluorescent microscope characterization and data analysis; C.C. participated in device fabrication; B.X. participated in data analysis and result discussions; J.L., J.W. and X.W. supervised the project, participated in experimental design, discussions, and manuscript preparation. All authors have read and agreed to the published version of the manuscript.

Funding

This work was financially supported by the Hubei Provincial Department of Science & Technology (2020BIB020), the National Natural Science Foundation of China (51673060), the Opening Project of Key Laboratory of Optoelectronic Chemical Materials and Devices of Ministry of Education, Jianghan University (JDGD-202205), the Opening Project of Key Laboratory of Organosilicon Chemistry and Material Technology of Ministry of Education, Hangzhou Normal University (KFJJ2022008), and the Overseas Expertise Introduction Center for Discipline Innovation (D18025).

Institutional Review Board Statement

Not applicable.

Informed Consent Statement

Not applicable.

Data Availability Statement

The data presented in this study are available on request from the corresponding author.

Conflicts of Interest

The authors declare no conflict of interest.

References

  1. Vashisht, D.; Kaur, K.; Jukaria, R.; Vashisht, A.; Sharma, S.; Mehta, S.K. Colorimetric chemosensor based on coumarin skeleton for selective naked eye detection of cobalt (II) ion in near aqueous medium. Sens. Actuators B Chem. 2019, 280, 219–226. [Google Scholar] [CrossRef]
  2. Russell, M.J. Cobalt: A must-have element for life and livelihood. Proc. Natl. Acad. Sci. USA 2022, 119, 2121307119. [Google Scholar] [CrossRef] [PubMed]
  3. Awual, M.R.; Ismael, M.; Yaita, T. Efficient detection and extraction of cobalt(II) from lithium ion batteries and wastewater by novel composite adsorbent. Sens. Actuators B Chem. 2014, 191, 9–18. [Google Scholar] [CrossRef]
  4. Hu, G.; Ge, L.; Li, Y.; Mukhtar, M.; Shen, B.; Yang, D.; Li, J. Carbon dots derived from flax straw for highly sensitive and selective detections of cobalt, chromium, and ascorbic acid. J. Colloid Interface Sci. 2020, 579, 96–108. [Google Scholar] [CrossRef]
  5. Leyssens, L.; Vinck, B.; Van Der Straeten, C.; Wuyts, F.; Maes, L. Cobalt toxicity in humans-A review of the potential sources and systemic health effects. Toxicology 2017, 387, 43–56. [Google Scholar] [CrossRef]
  6. Boonta, W.; Talodthaisong, C.; Sattayaporn, S.; Chaicham, C.; Chaicham, A.; Sahasithiwat, S.; Kangkaew, L.; Kulchat, S. The synthesis of nitrogen and sulfur co-doped graphene quantum dots for fluorescence detection of cobalt(ii) ions in water. Mater. Chem. Front. 2020, 4, 507–516. [Google Scholar] [CrossRef]
  7. Du, F.; Cheng, Z.; Kremer, M.; Liu, Y.; Wang, X.; Shuang, S.; Dong, C. A label-free multifunctional nanosensor based on N-doped carbon nanodots for vitamin B12 and Co2+ detection, and bioimaging in living cells and zebrafish. J. Mater. Chem. B 2020, 8, 5089–5095. [Google Scholar] [CrossRef]
  8. He, Z.; Zhu, J.; Li, X.; Weng, G.J.; Li, J.J.; Zhao, J.W. Surface etching-dependent geometry tailoring and multi-spectral information of Au@AuAg yolk-shell nanostructure with asymmetrical pyramidal core: The application in Co2+ determination. J. Colloid Interface Sci. 2022, 625, 340–353. [Google Scholar] [CrossRef]
  9. Mahajan, P.G.; Dige, N.C.; Desai, N.K.; Patil, S.R.; Kondalkar, V.V.; Hong, S.K.; Lee, K.H. Selective detection of Co2+ by fluorescent nano probe: Diagnostic approach for analysis of environmental samples and biological activities. Spectrochim. Acta A Mol. Biomol. Spectrosc. 2018, 198, 136–144. [Google Scholar] [CrossRef]
  10. Tsoutsi, D.; Guerrini, L.; Hermida-Ramon, J.M.; Giannini, V.; Liz-Marzan, L.M.; Wei, A.; Alvarez-Puebla, R.A. Simultaneous SERS detection of copper and cobalt at ultratrace levels. Nanoscale 2013, 5, 5841–5846. [Google Scholar] [CrossRef]
  11. Shi, J.; Lu, C.; Yan, D.; Ma, L. High selectivity sensing of cobalt in HepG2 cells based on necklace model microenvironment-modulated carbon dot-improved chemiluminescence in Fenton-like system. Biosens. Bioelectron. 2013, 45, 58–64. [Google Scholar] [CrossRef] [PubMed]
  12. Zheng, F.; Hu, B. Thermo-responsive polymer coated fiber-in-tube capillary microextraction and its application to on-line determination of Co, Ni and Cd by inductively coupled plasma mass spectrometry (ICP-MS). Talanta 2011, 85, 1166–1173. [Google Scholar] [CrossRef] [PubMed]
  13. Hussain, M.M.; Asiri, A.M.; Arshad, M.N.; Rahman, M.M. Development of selective Co2+ ionic sensor based on various derivatives of benzenesulfonohydrazide (BSH) compound: An electrochemical approach. Chem. Eng. J. 2018, 339, 133–143. [Google Scholar] [CrossRef]
  14. Lee, H.; Sung, H.K.; Park, C.; Kim, Y. Bimetallic Au/Ag nanoframes as spectator for Co2+ ion. J. Ind. Eng. Chem. 2017, 48, 235–241. [Google Scholar] [CrossRef]
  15. Mehta, V.N.; Desai, M.L.; Basu, H.; Kumar Singhal, R.; Kailasa, S.K. Recent developments on fluorescent hybrid nanomaterials for metal ions sensing and bioimaging applications: A review. J. Mol. Liq. 2021, 333, 115950. [Google Scholar] [CrossRef]
  16. Liu, Z.; Pickens Iii, D.; He, T.; Zhang, X.; Liu, Y.; Nishino, T.; Jane Wang, Q. A Thermal Elastohydrodynamic Lubrication Model for Crowned Rollers and Its Application on Apex Seal–Housing Interfaces. J. Tribol. 2019, 141, 041501. [Google Scholar] [CrossRef]
  17. Shi, X.; Wei, W.; Fu, Z.; Gao, W.; Zhang, C.; Zhao, Q.; Deng, F.; Lu, X. Review on carbon dots in food safety applications. Talanta 2019, 194, 809–821. [Google Scholar] [CrossRef]
  18. Tan, F.; Cong, L.; Saucedo, N.M.; Gao, J.; Li, X.; Mulchandani, A. An electrochemically reduced graphene oxide chemiresistive sensor for sensitive detection of Hg2+ ion in water samples. J. Hazard. Mater. 2016, 320, 226–233. [Google Scholar] [CrossRef] [Green Version]
  19. Xiong, C.; Zhang, T.; Kong, W.; Zhang, Z.; Qu, H.; Chen, W.; Wang, Y.; Luo, L.; Zheng, L. ZIF-67 derived porous Co3O4 hollow nanopolyhedron functionalized solution-gated graphene transistors for simultaneous detection of glucose and uric acid in tears. Biosens. Bioelectron. 2018, 101, 21–28. [Google Scholar] [CrossRef]
  20. Kwon, S.S.; Yi, J.; Lee, W.W.; Shin, J.H.; Kim, S.H.; Cho, S.H.; Nam, S.; Park, W.I. Reversible and Irreversible Responses of Defect-Engineered Graphene-Based Electrolyte-Gated pH Sensors. ACS Appl. Mater. 2016, 8, 834–839. [Google Scholar] [CrossRef]
  21. Zou, H.L.; Li, B.L.; Luo, H.Q.; Li, N.B. A novel electrochemical biosensor based on hemin functionalized graphene oxide sheets for simultaneous determination of ascorbic acid, dopamine and uric acid. Sen. Actuators B Chem. 2015, 207, 535–541. [Google Scholar] [CrossRef]
  22. Fu, Y.; Wang, N.; Yang, A.; Law, H.K.; Li, L.; Yan, F. Highly Sensitive Detection of Protein Biomarkers with Organic Electrochemical Transistors. Adv. Mater. 2017, 29, 1703787. [Google Scholar] [CrossRef] [PubMed]
  23. Lin, C.-T.; Loan, P.T.K.; Chen, T.-Y.; Liu, K.-K.; Chen, C.-H.; Wei, K.-H.; Li, L.-J. Label-Free Electrical Detection of DNA Hybridization on Graphene using Hall Effect Measurements: Revisiting the Sensing Mechanism. Adv. Funct. 2013, 23, 2301–2307. [Google Scholar] [CrossRef]
  24. Hess, L.H.; Jansen, M.; Maybeck, V.; Hauf, M.V.; Seifert, M.; Stutzmann, M.; Sharp, I.D.; Offenhausser, A.; Garrido, J.A. Graphene transistor arrays for recording action potentials from electrogenic cells. Adv. Mater. 2011, 23, 5045–5049. [Google Scholar] [CrossRef]
  25. Park, S.; Choi, J.; Jeun, M.; Kim, Y.; Yuk, S.S.; Kim, S.K.; Song, C.S.; Lee, S.; Lee, K.H. Detection of Avian Influenza Virus from Cloacal Swabs Using a Disposable Well Gate FET Sensor. Adv. Healthc. Mater. 2017, 6, 1700371. [Google Scholar] [CrossRef]
  26. Huang, Y.; Dong, X.; Shi, Y.; Li, C.M.; Li, L.J.; Chen, P. Nanoelectronic biosensors based on CVD grown graphene. Nanoscale 2010, 2, 1485–1488. [Google Scholar] [CrossRef]
  27. Liu, Y.; Dong, X.; Chen, P. Biological and chemical sensors based on graphene materials. Chem. Soc. Rev. 2012, 41, 2283–2307. [Google Scholar] [CrossRef]
  28. Stine, R.; Mulvaney, S.P.; Robinson, J.T.; Tamanaha, C.R.; Sheehan, P.E. Fabrication, optimization, and use of graphene field effect sensors. Anal. Chem. 2013, 85, 509–521. [Google Scholar] [CrossRef] [PubMed]
  29. Fan, Q.; Wang, L.; Xu, D.; Duo, Y.; Gao, J.; Zhang, L.; Wang, X.; Chen, X.; Li, J.; Zhang, H. Solution-gated transistors of two-dimensional materials for chemical and biological sensors: Status and challenges. Nanoscale 2020, 12, 11364–11394. [Google Scholar] [CrossRef]
  30. Yan, F.; Zhang, M.; Li, J. Solution-gated graphene transistors for chemical and biological sensors. Adv. Healthc. Mater. 2014, 3, 313–331. [Google Scholar] [CrossRef]
  31. Fan, Q.; Li, J.; Wang, J.; Yang, Z.; Shen, T.; Guo, Y.; Wang, L.; Irshad, M.S.; Mei, T.; Wang, X. Ultrasensitive Fe3+ ion detection based on carbon quantum dot-functionalized solution-gated graphene transistors. J. Mater. Chem. C 2020, 8, 4685–4689. [Google Scholar] [CrossRef]
  32. Fan, Q.; Li, J.; Zhu, Y.; Yang, Z.; Shen, T.; Guo, Y.; Wang, L.; Mei, T.; Wang, J.; Wang, X. Functional Carbon Quantum Dots for Highly Sensitive Graphene Transistors for Cu2+ Ion Detection. ACS Appl. Mater. 2020, 12, 4797–4803. [Google Scholar] [CrossRef] [PubMed]
  33. Tang, M.; Zhu, B.; Wang, Y.; Wu, H.; Chai, F.; Qu, F.; Su, Z. Nitrogen- and sulfur-doped carbon dots as peroxidase mimetics: Colorimetric determination of hydrogen peroxide and glutathione, and fluorimetric determination of lead(II). Mikrochim. Acta 2019, 186, 604. [Google Scholar] [CrossRef] [PubMed]
  34. Feng, Y.; Yang, X.; Zhang, Z.; Kang, D.; Zhang, J.; Liu, K.; Li, X.; Shen, J.; Liu, F.; Wang, T.; et al. Epitaxy of Single-Crystalline GaN Film on CMOS-Compatible Si(100) Substrate Buffered by Graphene. Adv. Funct. 2019, 29, 1905056. [Google Scholar] [CrossRef]
  35. Qin, L.; Li, Y.Z.; Liang, F.; Li, L.; Lan, Y.; Li, Z.; Lu, X.Y.; Yang, M.; Ma, D. A microporous 2D cobalt-based MOF with pyridyl sites and open metal sites for selective adsorption of CO2. Micropor. Mesopor. Mat. 2022, 341, 112098. [Google Scholar] [CrossRef]
  36. Qin, L.; Liang, F.; Li, Y.; Wu, J.; Guan, S.; Wu, M.; Xie, S.; Luo, M.; Ma, D. A 2D Porous Zinc-Organic Framework Platform for Loading of 5-Fluorouracil. Inorganics 2022, 10, 202. [Google Scholar] [CrossRef]
  37. Chen, J.; Liu, J.; Li, J.; Xu, L.; Qiao, Y. One-pot synthesis of nitrogen and sulfur co-doped carbon dots and its application for sensor and multicolor cellular imaging. J. Colloid Interface Sci. 2017, 485, 167–174. [Google Scholar] [CrossRef]
  38. Guo, Y.; Cao, F.; Li, Y. Solid phase synthesis of nitrogen and phosphor co-doped carbon quantum dots for sensing Fe3+ and the enhanced photocatalytic degradation of dyes. Sens. Actuators B Chem. 2018, 255, 1105–1111. [Google Scholar] [CrossRef]
  39. Wang, B.; Huang, M.; Kim, N.Y.; Cunning, B.V.; Huang, Y.; Qu, D.; Chen, X.; Jin, S.; Biswal, M.; Zhang, X.; et al. Controlled Folding of Single Crystal Graphene. Nano Lett. 2017, 17, 1467–1473. [Google Scholar] [CrossRef]
  40. Song, Y.; Zou, W.; Lu, Q.; Lin, L.; Liu, Z. Graphene Transfer: Paving the Road for Applications of Chemical Vapor Deposition Graphene. Small 2021, 17, 2007600. [Google Scholar] [CrossRef]
  41. Gao, Y.; Jiao, Y.; Lu, W.; Liu, Y.; Han, H.; Gong, X.; Xian, M.; Shuang, S.; Dong, C. Carbon dots with red emission as a fluorescent and colorimeteric dual-readout probe for the detection of chromium(vi) and cysteine and its logic gate operation. J. Mater. Chem. B 2018, 6, 6099–6107. [Google Scholar] [CrossRef] [PubMed]
  42. Li, L.; Zou, J.; Han, Y.; Liao, Z.; Lu, P.; Nezamzadeh-Ejhieh, A.; Liu, J.; Peng, Y. Recent advances in Al(iii)/In(iii)-based MOFs for the detection of pollutants. New J. Chem. 2022, 46, 19577–19592. [Google Scholar] [CrossRef]
  43. Dutta, A.; Pan, Y.; Liu, J.-Q.; Kumar Singh, A. Multicomponent isoreticular metal-organic frameworks: Principles, current status and challenges. Coord. Chem. Rev. 2021, 445, 214074. [Google Scholar] [CrossRef]
  44. Liu, J.-Q.; Luo, Z.-D.; Pan, Y.; Kumar Singh, A.; Trivedi, M.; Kumar, A. Recent developments in luminescent coordination polymers: Designing strategies, sensing application and theoretical evidences. Coord. Chem. Rev. 2020, 406, 213145. [Google Scholar] [CrossRef]
Figure 1. (a) TEM image and HRTEM images of CDs; (b) the absorption spectrum and the fluorescence spectrum of CDs; (c) FTIR spectrum of CDs; (d) full-range XPS survey spectrum of CDs.
Chemosensors 11 00192 g001
Figure 2. (a) High−resolution C1s XPS spectrum of CDs; (b) high-resolution O1s XPS spectrum of CDs; (c) high−resolution N1s XPS spectrum of CDs; (d) high-resolution S2p XPS spectrum of CDs.
Chemosensors 11 00192 g002
Figure 3. The scheme of the CD-SGGT sensor for detection of Co2+ ions.
Chemosensors 11 00192 g003
Figure 4. (a) Selectivity evaluation of the CD-SGGT sensor. Comparison of Co2+ ions or other metal ions, i.e., Mg2+, Zn2+, Mn2+, Hg2+, Li+, Ba2+, Ni2+, Pb2+, Al3+, Cu2+, Fe3+, and Ag+ (1.0 × 10⁻¹⁵ M); (b) the transfer curves at the different concentration of Co2+; (c) channel current−time responses of the sensor at the different concentration of Co2+ (VD = 0.1 V, VG = 0.3 V). Inset: the corresponding transfer curves of the SGGT without the Co2+ addition; (d) the ΔID versus the logarithmic value of Co2+ ions concentration.
Chemosensors 11 00192 g004
Figure 5. (a) The fluorescence intensity of CDs was weakened by different metal ions, i.e., Ag+, Al3+, Ba2+, Cu2+, Fe3+, Hg2+, Li+, Mg2+, Mn2+, Ni2+, Pb2+, Zn2+, and water at 320 nm excitation wavelength; (b) histogram of fluorescence decay of different metal ions for CDs; (c) the effect of different concentrations of 10 μL Co2+ ions on the fluorescence intensity of 3 mL CDs solution; (d) the linear relation of (c).
Chemosensors 11 00192 g005
Figure 6. (a) The transfer curves of the sensor at the different concentration of Co2+ ions (replacing MAA with cysteamine); (b) channel current-time responses of the sensor at the different concentration of Co2+ ions; (c) schematic diagram of EDL near gate electrode before and after the addition of Co2+ ions; (d) potential drops across the two EDLs before and after the addition of Co2+ ions.
Chemosensors 11 00192 g006
Disclaimer/Publisher’s Note: The statements, opinions and data contained in all publications are solely those of the individual author(s) and contributor(s) and not of MDPI and/or the editor(s). MDPI and/or the editor(s) disclaim responsibility for any injury to people or property resulting from any ideas, methods, instructions or products referred to in the content.

