
The Effect of Endurance and Endurance-Strength Training on Bone Mineral Density and Content in Abdominally Obese Postmenopausal Women: A Randomized Trial

 ,
,  , , ,
, , ,
Abstract
:1. Introduction
2. Materials and Methods
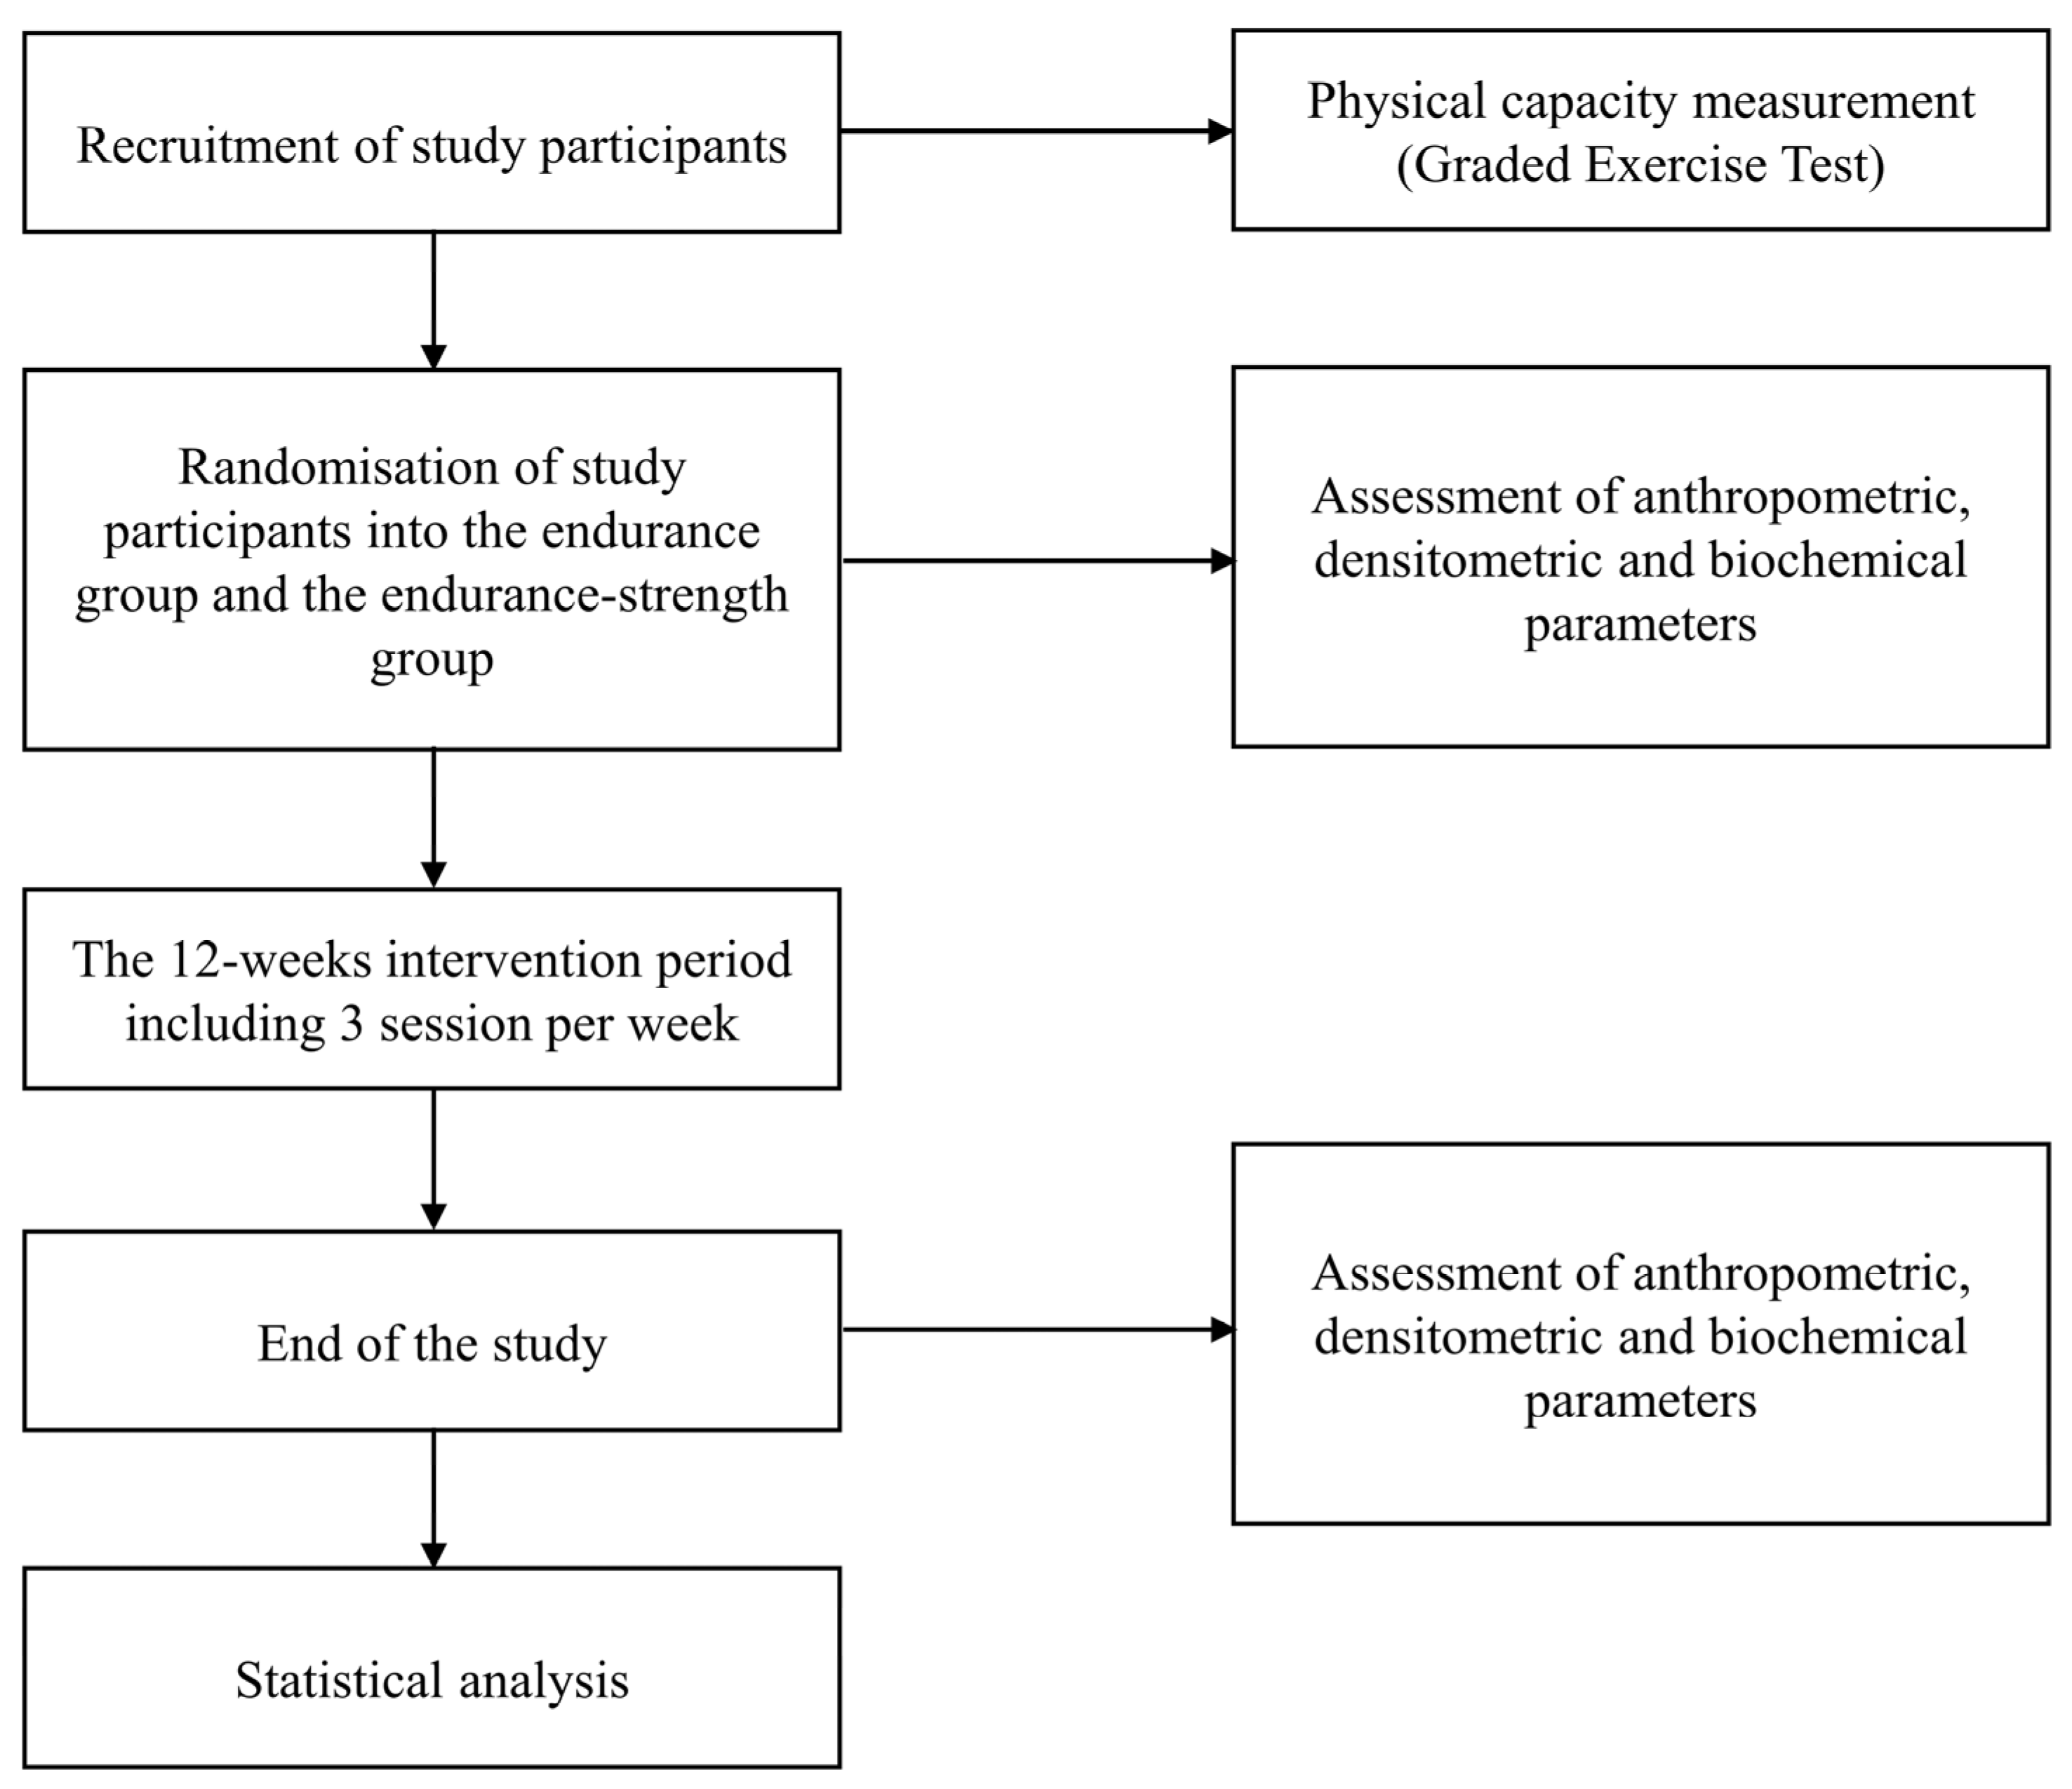
2.1. Study Overview
2.2. Participants
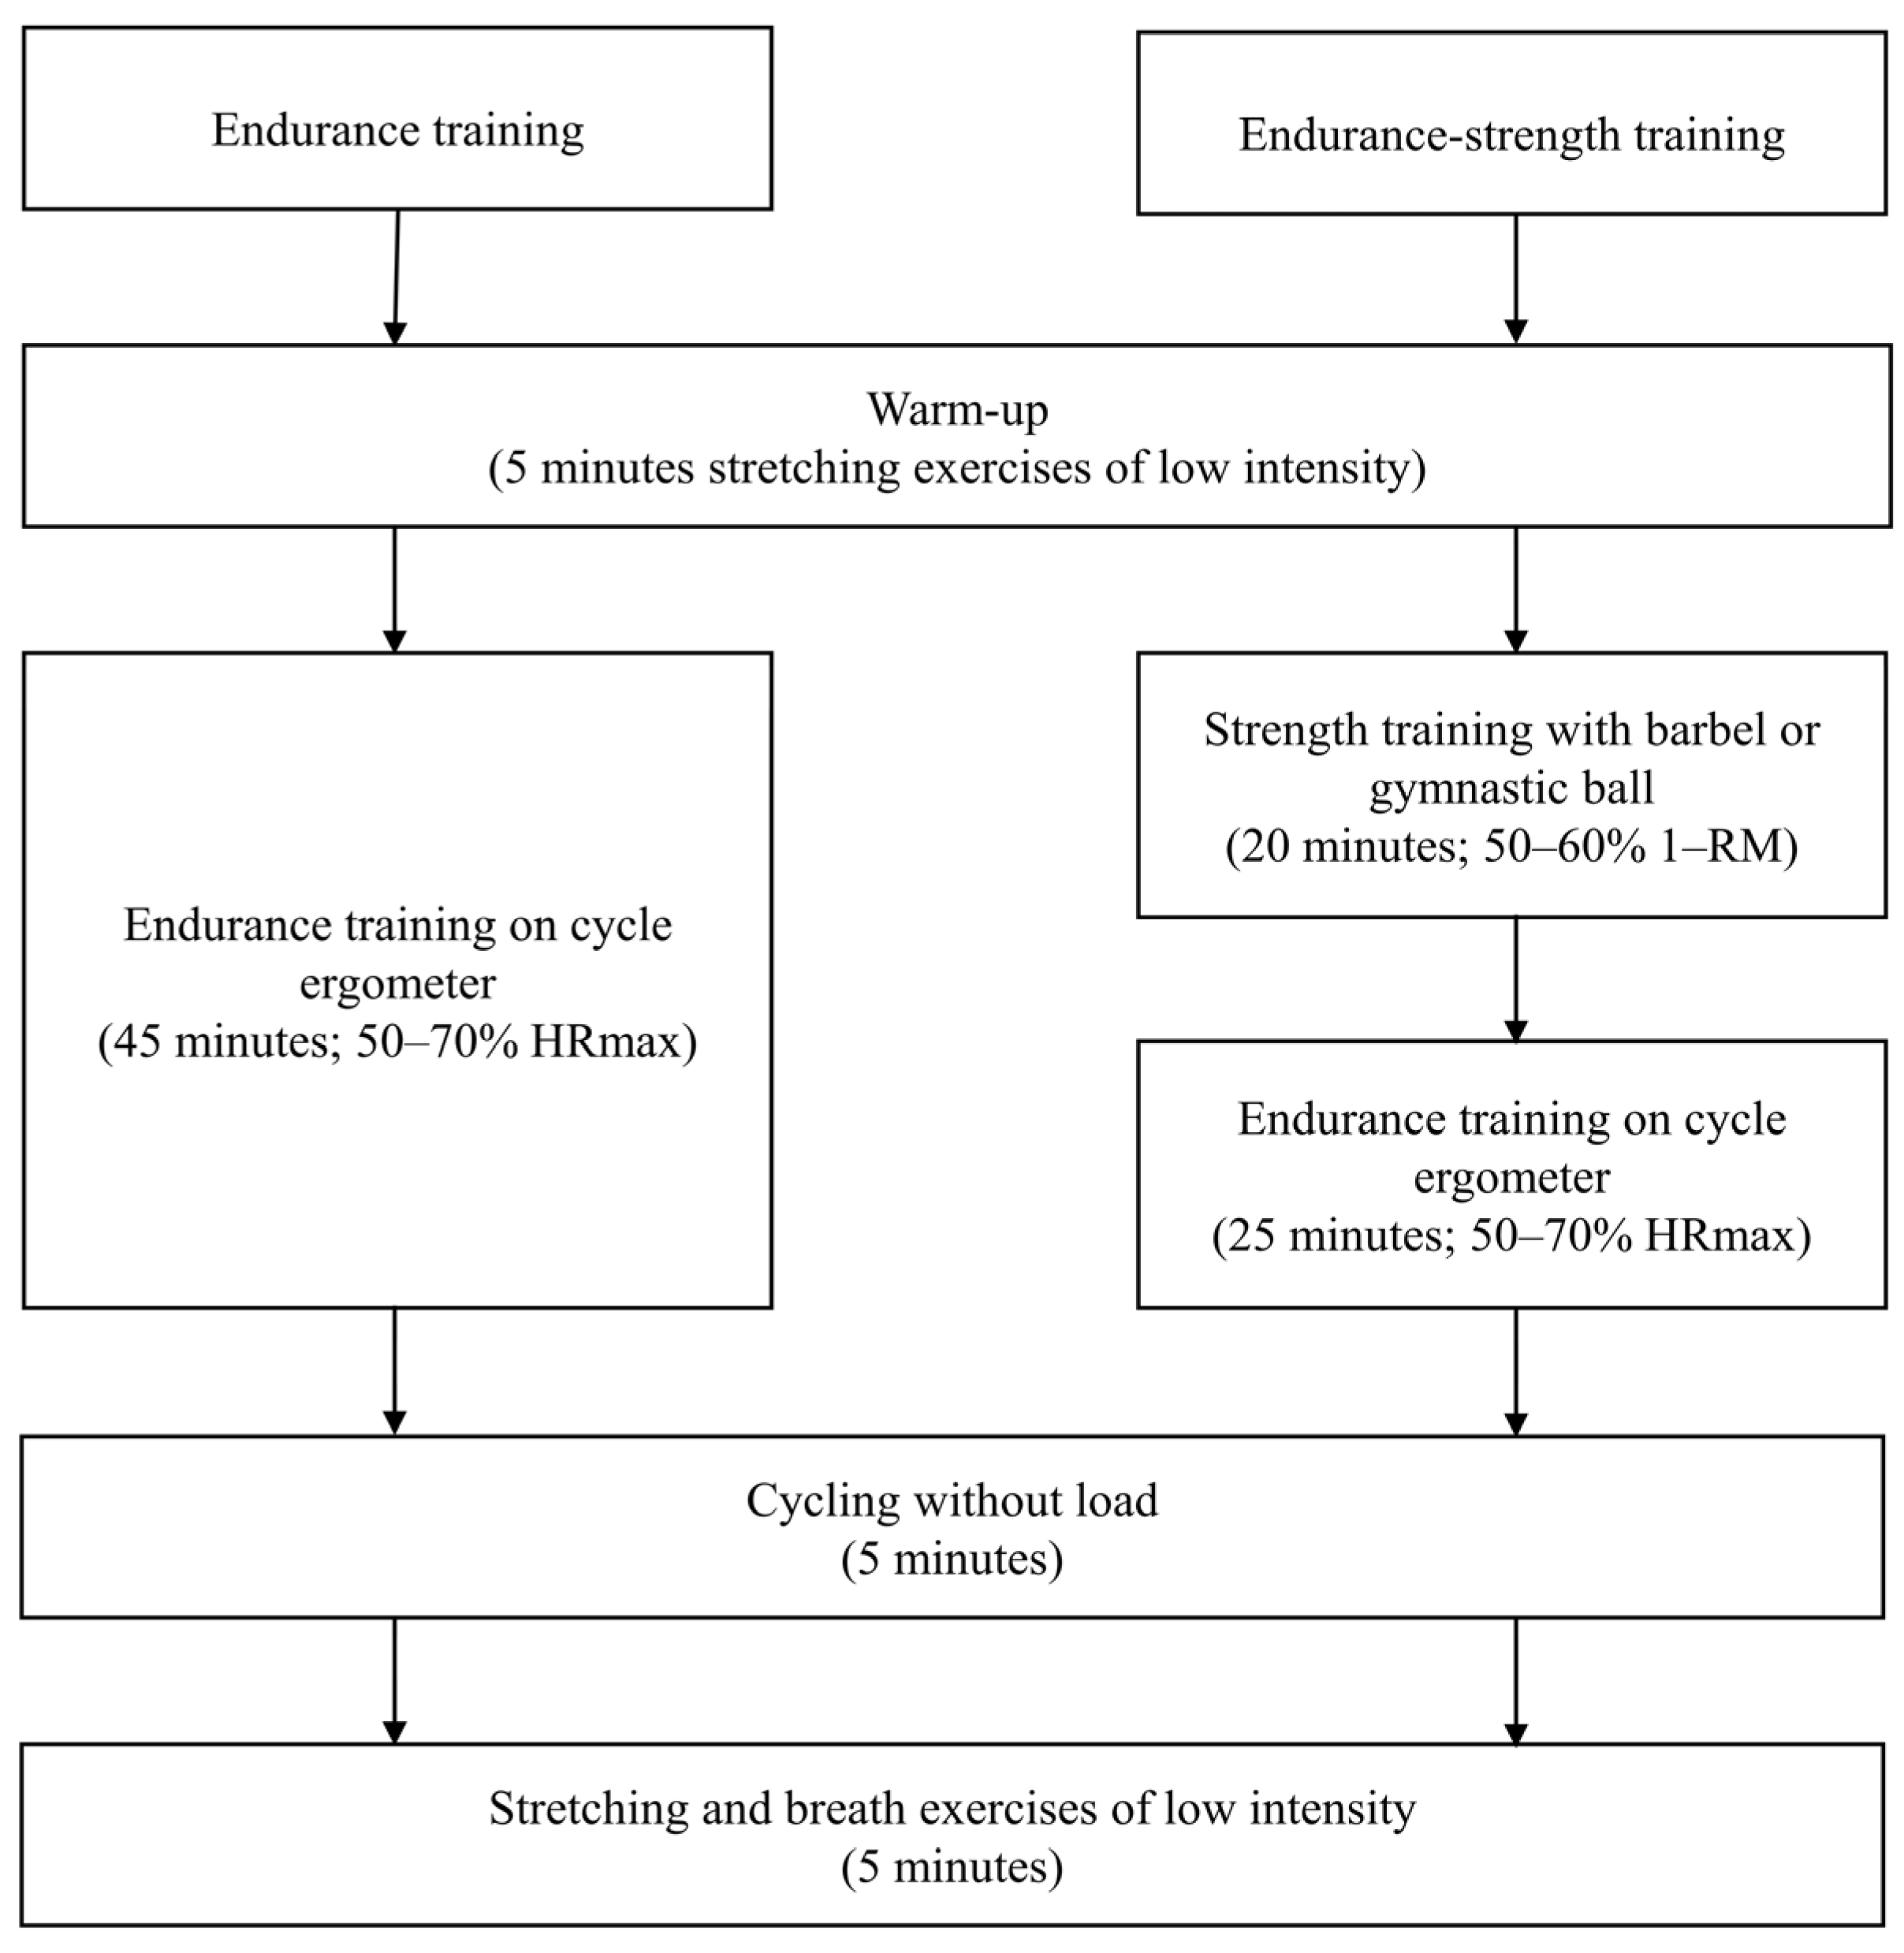
2.3. Intervention
2.4. Outcomes
2.5. Anthropometric Parameters
2.6. Densitometry Parameters
2.7. Graded Exercise Test
2.8. Blood Pressure
2.9. Randomization and Blinding
2.10. Minimum Sample Size
2.11. Statistical Analysis
3. Results
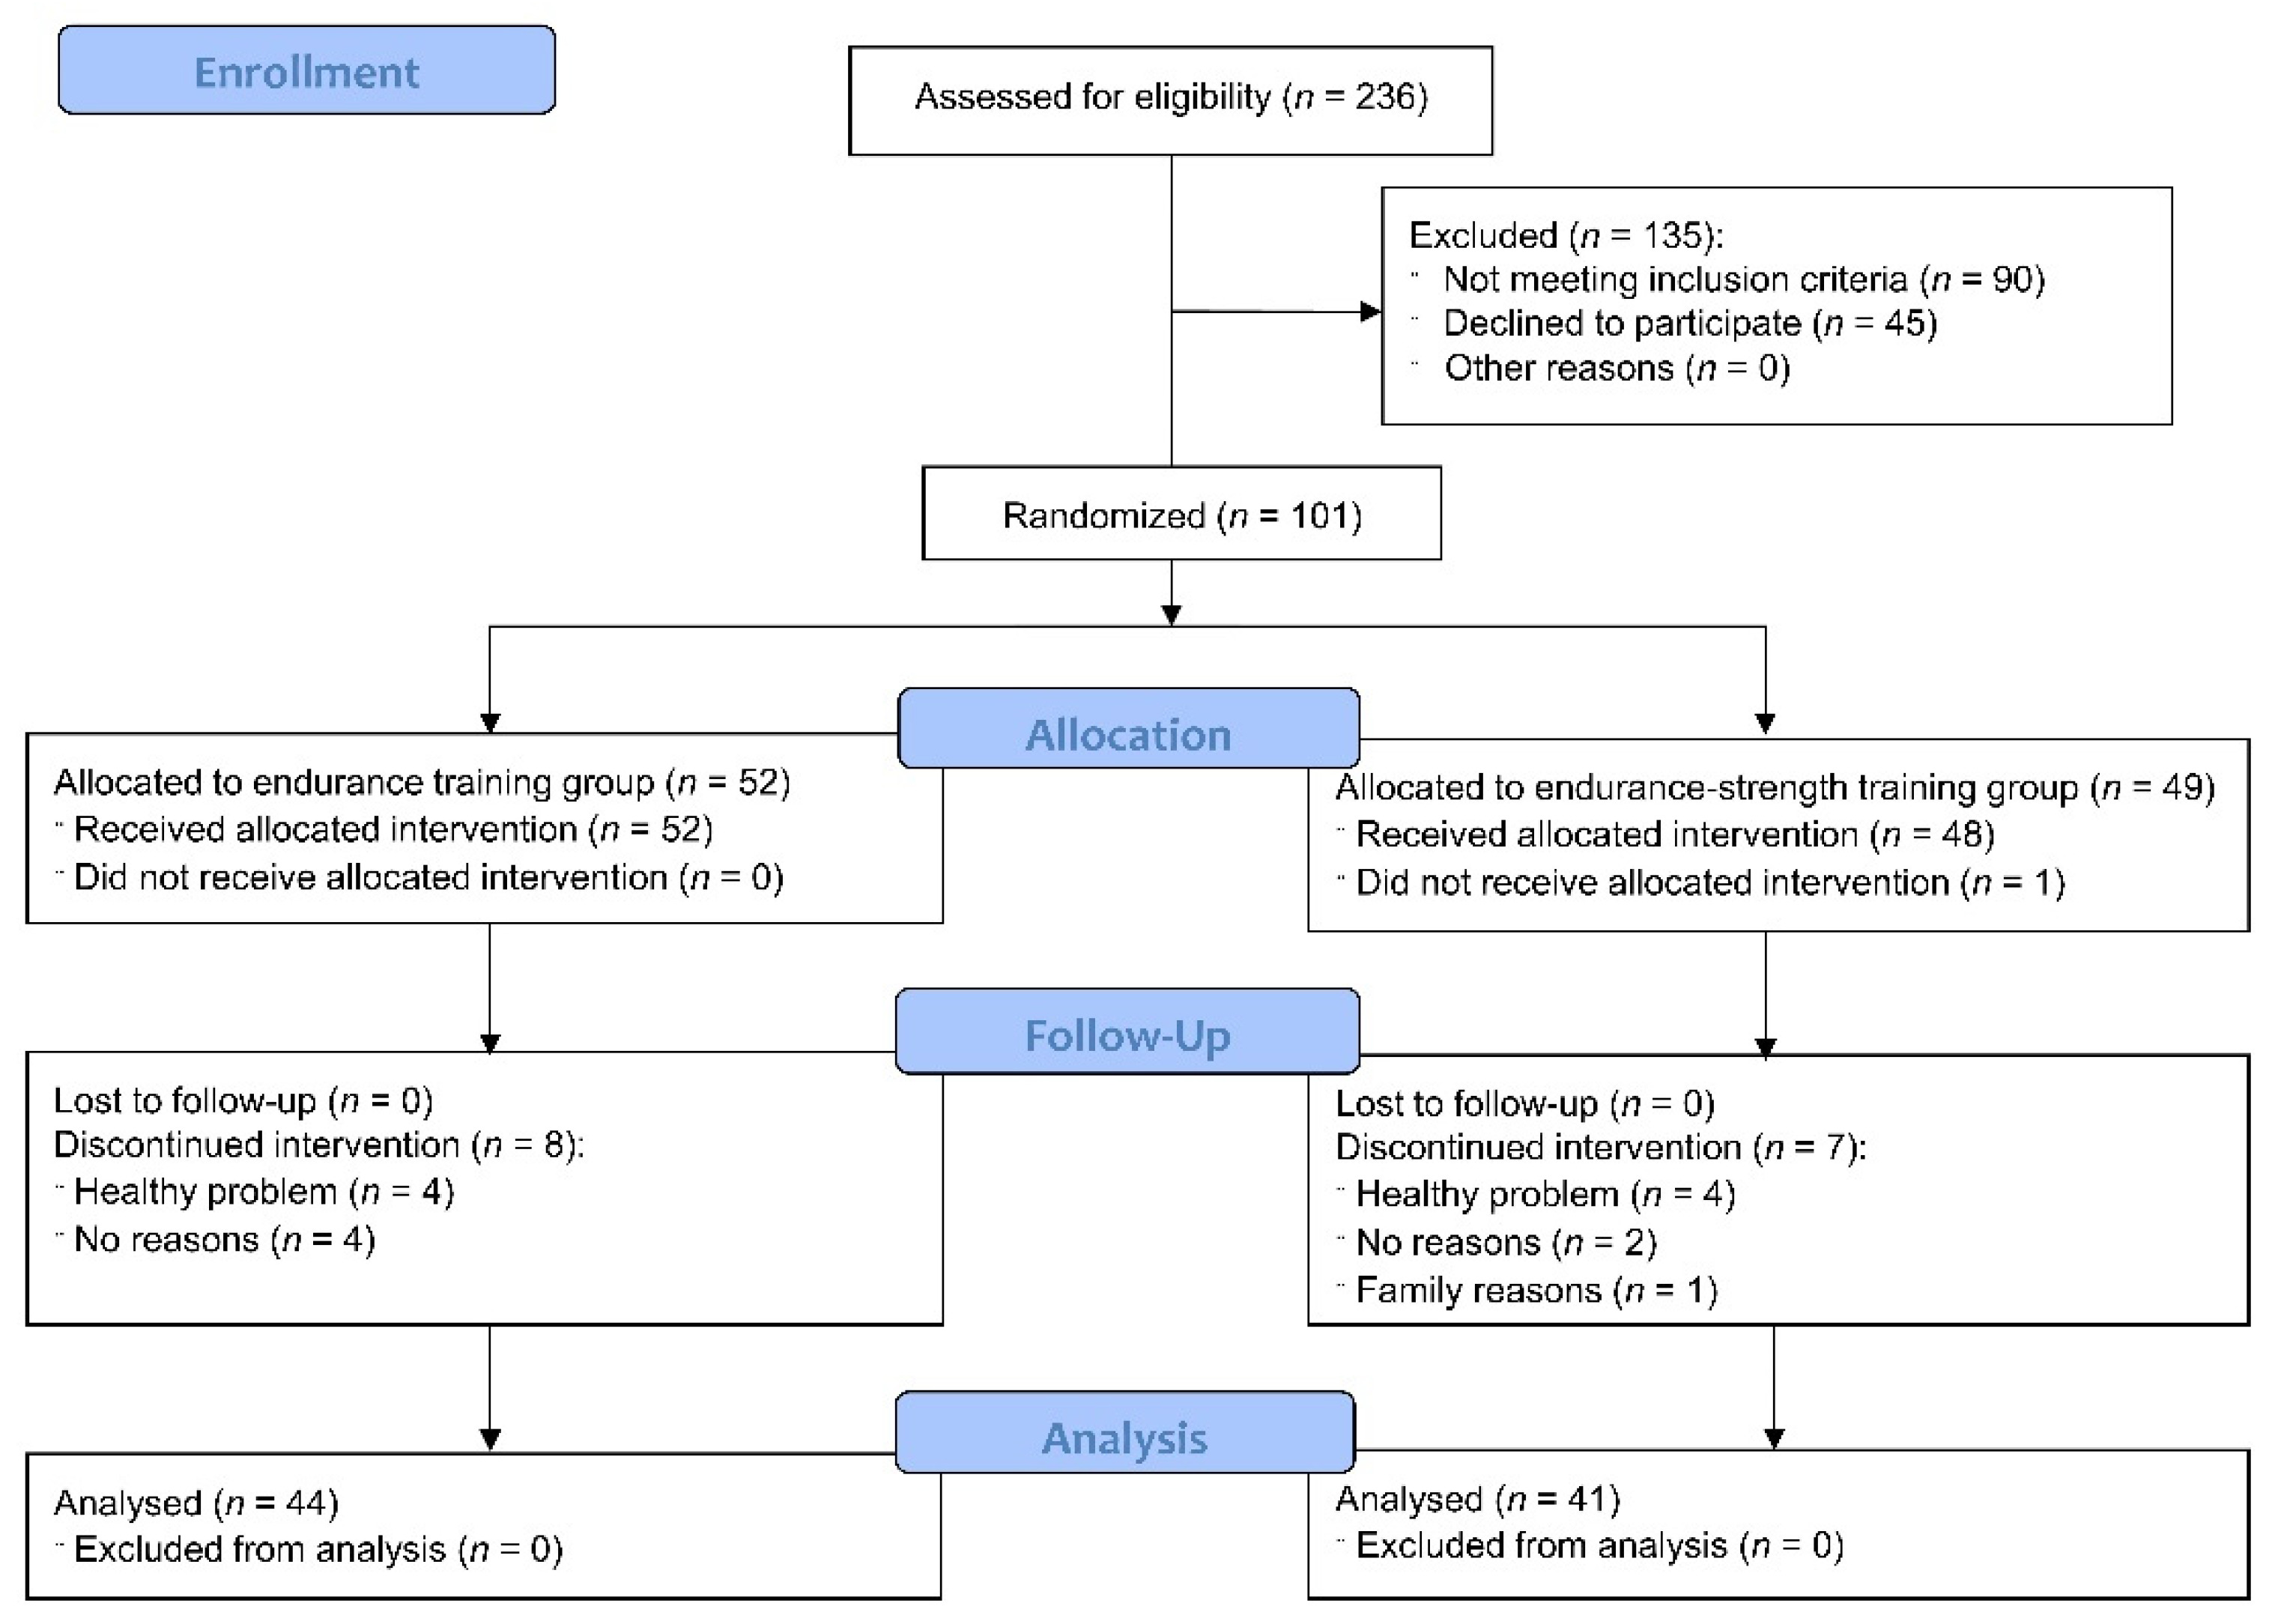
3.1. Participants Flow and Baseline Characteristic
3.2. The Effect of Endurance and Endurance-Strength Training on Densitometric Parameters
3.3. The Effect of Endurance and Endurance-Strength Training on Physical Capacity
3.4. Comparison of the Effect of Endurance and Endurance-Strength Training on Densitometric Parameters and Physical Capacity
4. Discussion
5. Conclusions
Supplementary Materials
Author Contributions
Funding
Institutional Review Board Statement
Informed Consent Statement
Data Availability Statement
Acknowledgments
Conflicts of Interest
References
- Salamat, M.; Salamat, A.; Abedi, I.; Janghorbani, M. Relationship between weight, body mass index, and bone mineral density in men referred for dual-energy X-ray absorptiometry scan in Isfahan, Iran. J. Osteoporos. 2013, 2013, 205963. [Google Scholar] [CrossRef] [Green Version]
- Villareal, D.T.; Fontana, L.; Weiss, E.P.; Racette, S.B.; Steger-May, K.; Schechtman, K.B.; Klein, S.; Holloszy, J.O. Bone mineral density response to caloric restriction-induced weight loss or exercise-induced weight loss: A randomized controlled trial. Arch. Intern. Med. 2006, 166, 2502–2510. [Google Scholar] [CrossRef]
- Filip, R.; Raszewski, G. Bone mineral density and bone turnover in relation to serum leptin, α-ketoglutarate and sex steroids in overweight and obese postmenopausal women. Clin. Endocrinol. 2009, 70, 214–220. [Google Scholar] [CrossRef]
- Ettinger, B.; Pressman, A.; Sklarin, P.; Bauer, D.C.; Cauley, J.A.; Cummings, S.R. Associations between low levels of serum estradiol, bone density, and fractures among elderly women: The study of osteoporotic fractures. J. Clin. Endocrinol. Metab. 1998, 83, 2239–2243. [Google Scholar] [CrossRef]
- Reid, I.R. Relationships among body mass, its components, and bone. Bone 2002, 31, 547–555. [Google Scholar] [CrossRef]
- Kim, K.C.; Shin, D.H.; Lee, S.Y.; Im, J.A.; Lee, D.C. Relation between obesity and bone mineral density and vertebral fractures in Korean postmenopausal women. Yonsei. Med. J. 2010, 51, 857–863. [Google Scholar] [CrossRef] [Green Version]
- Hsu, Y.; Venners, S.; Terwedow, H.; Feng, Y.; Niu, T.; Li, Z.; Laird, N.; Brain, J.D.; Cummings, S.R.; Bouxsein, M.L.; et al. Relation of body composition, fat mass, and serum lipids to osteoporotic fractures and bone mineral density in Chinese men and women. Am. J. Clin. Nutr. 2006, 83, 146–154. [Google Scholar] [CrossRef] [Green Version]
- Cornish, J.; Callon, K.E.; Bava, U.; Lin, C.; Naot, D.; Hill, B.L.; Grey, A.B.; Broom, N.; Myers, D.E.; Nicholson, G.C.; et al. Leptin directly regulates bone cell function in vitro and reduces bone fragility in vivo. J. Endocrinol. 2002, 175, 405–415. [Google Scholar] [CrossRef] [Green Version]
- Arazi, H.; Eghbali, E. Effects of different types of physical training on bone mineral density in men and women. J. Osteopor. Phys. Act. 2017, 5, 207. [Google Scholar] [CrossRef] [Green Version]
- Shah, K.; Armamento-Villareal, R.; Parimi, N.; Chode, S.; Sinacore, D.R.; Hilton, T.N.; Napoli, N.; Qualls, C.; Villareal, D.T. Exercise training in obese older adults prevents increase in bone turnover and attenuates decrease in hip bone mineral density induced by weight loss despite decline in bone-active hormones. J. Bone. Min. Res. 2011, 26, 2851–2859. [Google Scholar] [CrossRef] [Green Version]
- Yuan, Y.; Chen, X.; Zhang, L.; Wu, J.; Guo, J.; Zou, D.; Chen, B.; Sun, Z.; Shen, C.; Zou, J. The roles of exercise in bone remodeling and in prevention and treatment of osteoporosis. Prog. Biophys. Mol. Biol. 2016, 122, 122–130. [Google Scholar] [CrossRef]
- Pomerants, T.; Tillmann, V.; Karelson, K.; Jürimäe, J.; Jürimäe, T. Impact of acute exercise on bone turnover and growth hormone/insulin-like growth factor axis in boys. J. Sports Med. Phys. Fit. 2008, 48, 266–271. [Google Scholar]
- Weinreb, M.; Shamir, D.; Machwate, M.; Rodan, G.A.; Harada, S.; Keila, S. Prostaglandin E2 (PGE2) increases the number of rat bone marrow osteogenic stromal cells (BMSC) via binding the EP4 receptor, activating sphingosine kinase and inhibiting caspase activity. Prostaglandins Leukot. Essent. Fat. Acids 2006, 75, 81–90. [Google Scholar] [CrossRef]
- Martyn-St. James, M.; Carroll, S. High-intensity resistance training and postmenopausal bone loss: A meta-analysis. Osteoporos. Int. 2006, 17, 1225–1240. [Google Scholar] [CrossRef]
- Martyn-St. James, M.; Carroll, S. Progressive high-intensity resistance training and bone mineral density changes among premenopausal women: Evidence of discordant site-specific skeletal effects. Sports Med. 2006, 36, 683–704. [Google Scholar] [CrossRef]
- Tsuzuku, S.; Shimokata, H.; Ikegami, Y.; Yabe, K.; Wasnich, R.D. Effects of high versus low-intensity resistance training on bone mineral density in young males. Calcif. Tissue Int. 2001, 68, 342–347. [Google Scholar] [CrossRef]
- Bull, F.C.; Al-Ansari, S.S.; Biddle, S.; Borodulin, K.; Buman, M.P.; Cardon, G.; Carty, C.; Chaput, J.P.; Chastin, S.; Chou, R.; et al. World Health Organization 2020 guidelines on physical activity and sedentary behaviour. Br. J. Sports Med. 2020, 54, 1451–1462. [Google Scholar] [CrossRef] [PubMed]
- Kohrt, W.M.; Bloomfield, S.A.; Little, K.D.; Nelson, M.E.; Yingling, V.R. American College of Sports Medicine Position Stand: Physical activity and bone health. Med. Sci. Sports Exerc. 2004, 36, 1985–1996. [Google Scholar] [CrossRef] [Green Version]
- Liang, M.T.C.; Braun, W.; Bassin, S.L.; Dutto, D.; Pontello, A.; Wong, N.D.; Spalding, T.W.; Arnaud, S.B. Effect of high-impact aerobics and strength training on BMD in young women aged 20–35 years. Int. J. Sports Med. 2011, 32, 100–108. [Google Scholar] [CrossRef]
- Hinton, P.S.; Nigh, P.; Thyfault, J. Effectiveness of resistance training or jumping-exercise to increase bone mineral density in men with low bone mass: A 12-month randomized, clinical trial. Bone 2015, 79, 203–212. [Google Scholar] [CrossRef] [Green Version]
- Campos, R.M.; Túlio de Mello, M.; Tock, L.; Silva, P.L.; Masquio, D.L.; de Piano, A.; Sanches, P.L.; Carnier, J.; Corgosinho, F.C.; Foschini, D.; et al. Aerobic plus resistance training improves bone metabolism and inflammation in obese adolescents. J. Strength Cond. Res. 2014, 28, 758–766. [Google Scholar] [CrossRef]
- Beavers, K.; Beavers, D.; Martin, S.; Marsh, A.; Lyles, M.; Lenchik, L.; Shapses, S.A.; Nicklas, B.J. Change in bone mineral density during weight loss with resistance versus aerobic exercise training in older adults. J. Gerontol. A Biol. Sci. Med. Sci. 2017, 72, 1582–1585. [Google Scholar] [CrossRef] [Green Version]
- Villareal, D.T.; Aguirre, L.; Gurney, A.B.; Waters, D.L.; Sinacore, D.R.; Colombo, E.; Armamento-Villareal, R.; Qualls, C. Aerobic or resistance exercise, or both, in dieting obese older adults. N. Engl. J. Med. 2017, 376, 1943–1955. [Google Scholar] [CrossRef] [Green Version]
- Stensvold, D.; Tjønna, A.E.; Skaug, E.A.; Aspenes, S.; Stølen, T.; Wisløff, U.; Slørdahl, S.A. Strength training versus aerobic interval training to modify risk factors of metabolic syndrome. J. Appl. Physiol. 2010, 108, 804–810. [Google Scholar] [CrossRef] [Green Version]
- Moher, D.; Hopewell, S.; Schulz, K.F.; Montori, V.; Gøtzsche, P.C.; Devereaux, P.J.; Elbourne, D.; Egger, M.; Altman, D.G. CONSORT 2010 explanation and elaboration: Updated guidelines for reporting parallel group randomised trials. BMJ 2010, 340, c869. [Google Scholar] [CrossRef] [Green Version]
- Jamka, M.; Bogdański, P.; Krzyżanowska-Jankowska, P.; Karolkiewicz, J.; Mądry, R.; Lisowska, A.; Walkowiak, J.; Mądry, E. Comparison of the effects of endurance and endurance-strength training programmes on the level of endothelial dysfunction in women with abdominal obesity: Study protocol for a randomised controlled trial. J. Med. Sci. 2020, 88, 266–272. [Google Scholar] [CrossRef]
- American Council on Exercise. Percent Body Fat Calculator. Available online: https://www.acefitness.org/education-and-resources/lifestyle/blog/112/what-are-the-guidelines-for-percentage-of-body-fatloss/ (accessed on 2 February 2021).
- National Strength and Conditioning Association. Strength and conditioning professional standards and guidelines. Strength Cond. J. 2009, 31, 14–38. [Google Scholar] [CrossRef]
- Skrypnik, D.; Bogdański, P.; Mądry, E.; Karolkiewicz, J.; Ratajczak, M.; Kryściak, J.; Pupek-Musialik, D.; Walkowiak, J. Effects of endurance and endurance strength training on body composition and physical capacity in women with abdominal obesity. Obes. Facts 2015, 8, 175–187. [Google Scholar] [CrossRef]
- Hangartner, T.N.; Warner, S.; Braillon, P.; Jankowski, L.; Shepherd, J. The official positions of the International Society for Clinical Densitometry: Acquisition of dual-energy X-ray absorptiometry body composition and considerations regarding analysis and repeatability of measures. J. Clin. Densitom. 2013, 16, 520–536. [Google Scholar] [CrossRef] [PubMed]
- Williams, B.; Mancia, G.; Spiering, W.; Agabiti Rosei, E.; Azizi, M.; Burnier, M.; Clement, D.L.; Coca, A.; de Simone, G.; Dominiczak, A.; et al. ESC Scientific Document Group. 2018 ESC/ESH guidelines for the management of arterial hypertension. Eur. Heart J. 2018, 39, 3021–3104. [Google Scholar] [CrossRef]
- Jamka, M.; Bogdański, P.; Krzyżanowska-Jankowska, P.; Miśkiewicz-Chotnicka, A.; Karolkiewicz, J.; Duś-Żuchowska, M.; Mądry, R.; Lisowska, A.; Gotz-Więckowska, A.; Iskakova, S.; et al. Endurance training depletes antioxidant system but does not affect endothelial functions in women with abdominal obesity: A randomized trial with a comparison to endurance-strength training. J. Clin. Med. 2021, 10, 1639. [Google Scholar] [CrossRef]
- Heinonen, A.; Kannus, P.; Sievänen, H.; Oja, P.; Pasanen, M.; Rinne, M.; Uusi-Rasi, K.; Vuori, I. Randomised controlled trial of effect of high-impact exercise on selected risk factors for osteoporotic fractures. Lancet 1996, 348, 1343–1347. [Google Scholar] [CrossRef]
- Friedlander, A.L.; Genant, H.K.; Sadowsky, S.; Byl, N.N.; Glüer, C.C. A two-year program of aerobics and weight training enhances bone mineral density of young women. J. Bone Min. Res. 1995, 10, 574–585. [Google Scholar] [CrossRef]
- Campanha-Versiani, L.; Pereira, D.A.G.; Ribeiro-Samora, G.A.; Ramos, A.V.; de Sander Diniz, M.F.H.; de Marco, L.A.; Soares, M.M.S. The effect of a muscle weight-bearing and aerobic exercise program on the body composition, muscular strength, biochemical markers, and bone mass of obese patients who have undergone gastric bypass surgery. Obes. Surg. 2017, 27, 2129–2137. [Google Scholar] [CrossRef]
- Lim, J.S.; Jang, G.-C.; Moon, K.-R.; Kim, E.Y. Combined aerobic and resistance exercise is effective for achieving weight loss and reducing cardiovascular risk factors without deteriorating bone health in obese young adults. Ann. Pediatr. Endocrinol. Metab. 2013, 18, 26–31. [Google Scholar] [CrossRef] [Green Version]
- Benedetti, M.G.; Furlini, G.; Zati, A.; Letizia Mauro, G. The effectiveness of physical exercise on bone density in osteoporotic patients. Biomed. Res. Int. 2018, 2018, 4840531. [Google Scholar] [CrossRef]
- Howe, T.E.; Shea, B.; Dawson, L.J.; Downie, F.; Murray, A.; Ross, C.; Harbour, R.T.; Caldwell, L.M.; Creed, G. Exercise for preventing and treating osteoporosis in postmenopausal women. Cochrane Database Syst. Rev. 2011, 7, CD000333. [Google Scholar] [CrossRef] [PubMed]
- Nelson, M.E.; Rejeski, W.J.; Blair, S.N.; Duncan, P.W.; Judge, J.O.; King, A.C.; Macera, C.A.; Castaneda-Sceppa, C. Physical activity and public health in older adults. Circulation 2007, 116, 1094–1105. [Google Scholar] [CrossRef] [Green Version]
- Almstedt, H.C.; Canepa, J.A.; Ramirez, D.A.; Shoepe, T.C. Changes in bone mineral density in response to 24 weeks of resistance training in college-age men and women. J. Strength Cond. Res. 2011, 25, 1098–1103. [Google Scholar] [CrossRef] [PubMed]
- Heaney, R.P. The bone-remodeling transient: Implications for the interpretation of clinical studies of bone mass change. J. Bone Min. Res. 1994, 9, 1515–1523. [Google Scholar] [CrossRef] [PubMed]
- Marcus, R. Exercise: Moving in the right direction. J. Bone Min. Res. 1998, 13, 1793–1796. [Google Scholar] [CrossRef]
- Olmedillas, H.; González-Agüero, A.; Moreno, L.A.; Casajus, J.A.; Vicente-Rodríguez, G. Cycling and bone health: A systematic review. BMC Med. 2012, 10, 168. [Google Scholar] [CrossRef] [Green Version]
- Abrahin, O.; Rodrigues, R.P.; Marçal, A.C.; Alves, E.A.; Figueiredo, R.C.; Sousa, E.C. Swimming and cycling do not cause positive effects on bone mineral density: A systematic review. Rev. Bras. Reum. 2016, 56, 345–351. [Google Scholar] [CrossRef] [Green Version]
- Price, C.T.; Langford, J.R.; Liporace, F.A. Essential nutrients for bone health and a review of their availability in the average North American diet. Open Orthop. J. 2012, 6, 143–149. [Google Scholar] [CrossRef] [Green Version]
- Kannus, P.; Haapasalo, H.; Sievänen, H.; Oja, P.; Vuori, I. The site-specific effects of long-term unilateral activity on bone mineral density and content. Bone 1994, 15, 279–284. [Google Scholar] [CrossRef]
- National Health and Nutrition Examination Survey (NHANES). Anthropometry Procedures Manual. Available online: https://www.cdc.gov/nchs/data/nhanes/nhanes_07_08/manual_an.pdf (accessed on 16 November 2020).
- Hulens, M.; Vansant, G.; Lysens, R.; Claessens, A.L.; Muls, E. Exercise capacity in lean versus obese women. Scand. J. Med. Sci. Sports 2001, 11, 305–309. [Google Scholar] [CrossRef]
- Park, S.K.; Park, J.H.; Kwon, Y.C.; Kim, H.S.; Yoon, M.S.; Park, H.T. The effect of combined aerobic and resistance exercise training on abdominal fat in obese middle-aged women. J. Physiol. Anthr. Appl. Hum. Sci. 2003, 22, 129–135. [Google Scholar] [CrossRef] [Green Version]
- Schjerve, I.E.; Tyldum, G.A.; Tjønna, A.E.; Stølen, T.; Loennechen, J.P.; Hansen, H.E.; Haram, P.M.; Heinrich, G.; Bye, A.; Najjar, S.M.; et al. Both aerobic endurance and strength training programmes improve cardiovascular health in obese adults. Clin. Sci. 2008, 115, 283–293. [Google Scholar] [CrossRef] [Green Version]
- Hendrickson, N.R.; Sharp, M.A.; Alemany, J.A.; Walker, L.A.; Harman, E.A.; Spiering, B.A.; Hatfield, D.L.; Yamamoto, L.M.; Maresh, C.M.; Kraemer, W.J.; et al. Combined resistance and endurance training improves physical capacity and performance on tactical occupational tasks. Eur. J. Appl. Physiol. 2010, 109, 1197–1208. [Google Scholar] [CrossRef] [PubMed]
- Jorge, M.L.M.P.; de Oliveira, V.N.; Resende, N.M.; Paraiso, L.F.; Calixto, A.; Diniz, A.L.; Resende, E.S.; Ropelle, E.R.; Carvalheira, J.B.; Espindola, F.S.; et al. The effects of aerobic, resistance, and combined exercise on metabolic control, inflammatory markers, adipocytokines, and muscle insulin signaling in patients with type 2 diabetes mellitus. Metabolism 2011, 60, 1244–1252. [Google Scholar] [CrossRef]
- Kargarfard, M.; Rouzbehani, R.; Basati, F. Effects of exercise rehabilitation on blood pressure of patients after myocardial infarction. Int. J. Prev. Med. 2010, 1, 124–130. [Google Scholar] [PubMed]
- Cornelissen, V.A.; Smart, N.A. Exercise training for blood pressure: A systematic review and meta-analysis. J. Am. Heart Assoc. 2013, 2, e004473. [Google Scholar] [CrossRef] [PubMed] [Green Version]
- Tipton, C. Exercise, training, and hypertension. Exerc. Sport Sci. Rev. 1984, 12, 245–306. [Google Scholar] [CrossRef] [PubMed]
- Koga, M.; Ideishi, M.; Matsusaki, M.; Tashiro, E.; Kinoshita, A.; Ikeda, M.; Tanaka, H.; Shindo, M.; Arakawa, K. Mild exercise decreases plasma endogenous digital is like substance in hypertensive individuals. Hypertension 1992, 19, II231–II236. [Google Scholar] [CrossRef] [Green Version]


| Endurance (n = 52) | Endurance-Strength (n = 49) | p | ||||
|---|---|---|---|---|---|---|
| Median (Q1–Q3) | Mean ± SD (95% CI) | Median (Q1–Q3) | Mean ± SD (95% CI) | |||
| Age [years] | 55 (50–60) | 55 ± 7 (53 to 57) | 54 (50–60) | 55 ± 7 (53 to 58) | 0.84 | |
| Body weight [kg] | 93.4 (84.9–104.9) | 96.0 ± 15.1 (91.7 to 100.2) | 91.0 (82.4–101.8) | 93.2 ± 13.9 (89.2 to 97.2) | 0.41 | |
| BMI [kg/m2] | 35.64 (32.07–38.00) | 35.87 ± 4.43 (34.63 to 37.10) | 35.42 (31.79–39.10) | 35.98 ± 5.10 (34.52 to 37.45) | 0.86 | |
| Waist circumference [cm] | 109 (103–114) | 110 ± 10 (107 to 113) | 108 (103–117) | 110 ± 10 (107 to 113) | 1.00 | |
| Femoral neck | BMC [g] | 4.29 (4.07–4.67) | 4.38 ± 0.67 (4.19 to 4.57) | 4.56 (3.86–4.84) | 4.45 ± 0.77 (4.23 to 4.67) | 0.61 |
| BMD [g/cm2] | 0.866 (0.805–0.945) | 0.870 ± 0.120 (0.836 to 0.903) | 0.906 (0.792–0.995) | 0.901 ± 0.135 (0.862 to 0.940) | 0.26 | |
| Lumbar spine (L1–L4) | BMC [g] | 59.20 (52.73–66.24) | 60.20 ± 11.02 (57.13 to 63.26) | 65.14 (52.60–68.11) | 63.12 ± 11.38 (59.84 to 66.38) | 0.18 |
| BMD [g/cm2] | 1.028 (0.936–1.146) | 1.035 ± 0.133 (0.998 to 1.072) | 1.072 (0.972–1.160) | 1.080 ± 0.126 (1.044 to 1.116) | 0.08 | |
| Total | BMC [g] | 2369.94 (2240.06–2565.25) | 2417.98 ± 349.84 (2320.59 to 2515.38) | 2447.10 (2247.34–2714.55) | 2466.74 ± 344.62 (2367.75 to 2565.72) | 0.37 |
| BMD [g/cm2] | 1.179 (1.115–1.236) | 1.173 ± 0.098 (1.145 to 1.200) | 1.178 (1.113–1.293) | 1.201 ± 0.115 (1.168 to 1.234) | 0.30 | |
| Endurance (n = 52) | Endurance-Strength (n = 49) | p | ||||
|---|---|---|---|---|---|---|
| Median (Q1–Q3) | Mean ± SD (95% CI) | Median (Q1–Q3) | Mean ± SD (95% CI) | |||
| VT values | WRVT [W] | 75 (50–100) | 76 ± 21 (71 to 82) | 75 (50–87) | 73 ± 20 (67 to 80) | 0.53 |
| HRVT [bpm] | 121 (112–132) | 122 ± 13 (118 to 126) | 127 (115–133) | 124 ± 15 (119 to 128) | 0.31 | |
| TVT [min] | 7 (5–8) | 7 ± 2 (6 to 7) | 6 (5–7) | 7 ± 2 (6 to 7) | 0.31 | |
| Peak values | VO2peak [ml/(kg × min)] | 15.7 (14–17) | 16.0 ± 3.1 (15.2 to 16.9) | 15.7 (1.9–17.6) | 15.9 ± 3.0 (15.0 to 16.7) | 0.99 |
| WRmax [W] | 125 (100–125) | 117 ± 29 (109 to 125) | 100 (75–125) | 109 ± 30 (100 to 117) | 0.24 | |
| HRpeak [bpm] | 140 (132–150) | 142 ± 17 (138 to 147) | 146 (126–158) | 143 ± 20 (137 to 149) | 0.40 | |
| TTE [min] | 10 (8–11) | 10 ± 2 (9 to 10) | 9 (7–10) | 9 ± 2 (8 to 10) | 0.23 | |
| BP | SBP a [mmHg] | 130 (125–145) | 134 ± 15 (130 to 138) | 135 (130–140) | 135 ± 12 (131 to 138) | 0.68 |
| DBP a [mmHg] | 80 (80–90) | 84 ± 9 (81 to 86) | 85 (80–90) | 83 ± 9 (80 to 85) | 0.94 | |
| SBPVT [mmHg] | 170 (150–190) | 174 ± 21 (168 to 179) | 170 (160–180) | 171 ± 20 (166 to 177) | 0.62 | |
| DBPVT [mmHg] | 90 (80–95) | 86 ± 13 (83 to 90) | 90 (80–95) | 87 ± 11 (84 to 90) | 0.89 | |
| Endurance (n = 44) | p | Endurance-Strength (n = 41) | p | ||||||||
|---|---|---|---|---|---|---|---|---|---|---|---|
| Pre-Intervention | Post-Intervention | Pre-Intervention | Post-Intervention | ||||||||
| Median (Q1–Q3) | Mean ± SD (95% CI) | Median (Q1–Q3) | Mean ± SD (95% CI) | Median (Q1–Q3) | Mean ± SD (95% CI) | Median (Q1–Q3) | Mean ± SD (95% CI) | ||||
| Femoral neck | BMC (g) | 4.29 (4.08–4.67) | 4.36 ± 0.65 (4.16 to 4.55) | 4.31 (4.08–4.73) | 4.35 ± 0.6 (4.14 to 4.55) | 0.77 | 4.56 (3.86–4.90) | 4.47 ± 0.79 (4.22 to 4.72) | 4.49 (3.87–4.94) | 4.48 ± 0.81 (4.23 to 4.74) | 0.92 |
| BMD (g/cm2) | 0.860 (0.802–0.937) | 0.863 ± 0.118) (0.827 to 0.899) | 0.846 (0.792–0.933) | 0.861 ± 0.124 (0.823 to 0.899) | 0.96 | 0.904 (0.805–0.995) | 0.901 ± 0.134 (0.859 to 0.943) | 0.886 (0.790–1.004) | 0.898 ± 0.135 (0.855 to 0.940) | 0.44 | |
| Lumbar spine(L1–L4) | BMC (g) | 59.83 (52.73–65.71) | 60.04 ± 10.56 (56.83 to 63.25) | 60.20 (54.24–64.84) | 60.87 ± 10.69 (57.62 to 64.11) | 0.08 | 65.14 (53.56–68.11) | 63.48 ± 11.83 (59.75 to 67.21) | 62.81 (53.32–69.07) | 62.81 ±11.35 (59.23 to 66.40) | 0.31 |
| BMD (g/cm2) | 1.029 (0.938–1.150) | 1.041 ± 0.137 (0.999 to 1.082) | 1.029 (0.931–1.154) | 1.044 ± 0.133 (1.004 to 1.085) | 0.35 | 1.072 (0.963–1.160) | 1.079 ± 0.132 (1.037 to 1.120) | 1.083 (0.956–1.151) | 1.071 ± 0.127 (1.031 to 1.112) | 0.17 | |
| Total | BMC (g) | 2369.94 (2252.26–2552.05) | 2425.88 ± 360.03 (2316.42 to 2535.34) | 2358.48 (2255.76–2570.16) | 2431.95 ± 365.52 (2320.82 to 2542.08) | 0.53 | 2436.41 (2247.34–2681.05) | 2457.36 ± 347.60 (2347.64 to 2567.07) | 2450.18 (2221.46–2716.82) | 2466.69 ± 348.34 (2356.74 to 2576.64) | 0.25 |
| BMD (g/cm2) | 1.179 (1.104–1.222) | 1.169 ± 0.100 (1.138 to 1.199) | 1.176 (1.255–1.242) | 1.174 ± 0.103 (1.143 to 1.206) | 0.16 | 1.169 (1.113–1.274) | 1.197 ±0.118 (1.160 to 1.234) | 1.191 (1.115–1.278) | 1.205 ±0.116 (1.168 to 1.241) | 0.02 | |
| Endurance (n = 44) | p | Endurance-Strength (n = 41) | p | ||||||||
|---|---|---|---|---|---|---|---|---|---|---|---|
| Pre-Intervention | Post-Intervention | Pre-Intervention | Post-Intervention | ||||||||
| Median (Q1–Q3) | Mean ± SD (95% CI) | Median (Q1–Q3) | Mean ± SD (95% CI) | Median (Q1–Q3) | Mean ± SD (95% CI) | Median (Q1–Q3) | Mean ± SD (95% CI) | ||||
| VT values | WRVT [W] | 75 (50–100) | 76 ± 20 (70 to 82) | 100 (100–125) | 105 ± 24 (97 to 112) | <0.001 | 75 (50–100) | 75 ± 21 (68 to 82) | 100 (100–100) | 100 ± 21 (93 to 107) | <0.001 |
| HRVT [bpm] | 124 (110–132) | 122 ± 13 (118 to 127) | 129 (120–137) | 127 ± 13 (123 to 131) | <0.001 | 127 (118–132) | 124 ± 15 (119 to 129) | 131 (123–139) | 130 ± 14 (125 to 134) | <0.001 | |
| TVT [min] | 7 (5–8) | 7 ± 2 (6 to 7) | 9 (8–10) | 9 ± 2 (8 to 10) | <0.001 | 6 (5–8) | 7 ± 2 (6 to 7) | 9 (8–9) | 9 ± 2 (8 to 9) | <0.001 | |
| Peak values | VO2peak [ml/(kg × min)] | 15.9 (14.2–17.5) | 16.2 ± 3.0 (15.3 to 17.1) | 19.1 (17.6–22.0) | 19.7 ± 3.4 (18.7 to 20.8) | <0.001 | 15.9 (14.1–17.8) | 16.2 ± 2.9 (15.3 to 17.1) | 19.4 (16.8–22.1) | 19.7 ± 3.4 (18.6 to 20.8) | <0.001 |
| WRmax [W] | 125 (100–125) | 119 ± 28 (110 to 127) | 150 (125–175) | 148 ± 34 (138 to 159) | <0.001 | 125 (100–125) | 112 ± 31 (102 to 121) | 150 (125–175) | 148 ± 25 (140 to 156) | <0.001 | |
| HRpeak [bpm] | 143 (134–152) | 143 ± 16 (138 to 148) | 147 (139–157) | 148 ± 16 (143 to 153) | 0.02 | 148 (134–158) | 145 ± 19 (139 to 151) | 155 (141–164) | 152 ± 17 (147 to 157) | <0.001 | |
| TTE [min] | 10 (8–11) | 10 ± 2 (9 to 11) | 12 (10–13) | 12 ± 3 (11 to 13) | <0.001 | 10 (7–10) | 9 ± 2 (9 to 10) | 12 (11–14) | 12 ± 2 (12 to 13) | <0.001 | |
| BP | SBP a [mmHg] | 130 (125–145) | 135 ± 15 (130 to 140) | 130 (120–140) | 131 ± 14 (127 to 135) | 0.26 | 135 (130–140) | 135 ± 11 (132 to 139) | 130 (120–140) | 129 ± 16 (124 to 134) | 0.07 |
| DBP a [mmHg] | 80 (80–90) | 84 ± 9 (81 to 87) | 80 (75–85) | 79 ± 7 (76 to 81) | 0.007 | 85 (80–90) | 84 ± 8 (81 to 86) | 80 (70–80) | 76 ± 7 (74 to 78) | <0.001 | |
| SBPVT [mmHg] | 180 (160–190) | 175 ± 20 (168 to 181) | 190 (175–205) | 188 ± 21 (182 to 195) | <0.002 | 170 (160–180) | 172 ± 19 (166 to 178) | 180 (170–200) | 183 ± 22 (176 to 189) | 0.006 | |
| DBPVT [mmHg] | 90 (80–95) | 86 ± 14 (82 to 90) | 82 (80–90) | 84 ± 10 (81 to 87) | 0.48 | 90 (85–95) | 89 ± 10) (85 to 92) | 80 (75–90) | 82 ± 12 (78 to 86) | 0.006 | |
| Endurance (n = 44) | Endurance-Strength (n = 41) | p | ||||
|---|---|---|---|---|---|---|
| Median (Q1–Q3) | Mean (SD) (95% CI) | Median (Q1–Q3) | Mean (SD) (95% CI) | |||
| Femoral neck | Δ BMC [g] | −0.01 (−0.16–0.10) | −0.01 ± 0.24 (−0.08 to 0.06) | −0.03 (−0.13–0.13) | 0.01 ± 0.21 (−0.05 to 0.08) | 0.80 |
| Δ BMD [g/cm2] | 0.002 (−0.014–0.012) | −0.002 ± 0.022 (−0.009 to 0.005) | 0.002 (−0.023–0.012) | −0.003 ± 0.032 (−0.014 to 0.007) | 0.57 | |
| Lumbar spine (L1–L4) | Δ BMC [g] | 0.84 (−0.73–2.31) | 0.83 ± 4.38 (−0.50 to 2.16) | −0.32 (−1.89–0.99) | −0.67 ± 3.23 (−1.68 to 0.35) | 0.04 |
| Δ BMD [g/cm2] | 0.006 (−0.013–0.025) | 0.004 ± 0.039 (−0.008 to 0.016) | −0.008 (−0.021–0.011) | −0.007 ± 0.030 (−0.017 to 0.002) | 0.10 | |
| Total | Δ BMC [g] | 6.35 (−26.75–36.28) | 6.07 ± 49.70 (−9.04 to 21.19) | 10.22 (−27.91–38.86) | 9.33 ± 49.95 (−6.44 to 25.09) | 0.71 |
| Δ BMD [g/cm2] | 0.003 (−0.009–0.014) | 0.006 ± 0.022 (−0.001 to 0.012) | 0.008 (0.003–0.022) | 0.008 ± 0.020 (0.001 to 0.014) | 0.42 | |
| Endurance (n = 44) | Endurance-Strength (n = 41) | p | ||||
|---|---|---|---|---|---|---|
| Median (Q1–Q3) | Mean ± SD (95% CI) | Median (Q1–Q3) | Mean ± SD (95% CI) | |||
| VT values | Δ WRVT [W] | 25 (25–50) | 30 ± 13 (26 to 35) | 25 (25–25) | 26 ± 15 (21 to 31) | 0.31 |
| Δ HRVT [bpm] | 6 (−1–13) | 6 ± 9 (3 to 9) | 5 (1–14) | 6 ± 10 (3 to 9) | 0.82 | |
| Δ TVT [min] | 2 (2–3) | 2 ± 1 (2 to 3) | 2 (1–3) | 2 ± 1 (2 to 2) | 0.26 | |
| Peak values | Δ VO2peak [ml/(kg × min)] | 3.2 (2.2–5.1) | 3.5 ± 2.2 (2.8 to 4.1) | 3.7 (2.1–4.5) | 3.5 ± 1.9 (2.9 to 4.1) | 0.99 |
| Δ WRmax [W] | 25 (25–50) | 29 ± 23 (22 to 36) | 25 (25–50) | 37 ± 19 (31 to 42) | 0.15 | |
| Δ HRpeak [bpm] | 5 (−4–13) | 5 ± 12 (1 to 9) | 7 (0–16) | 7 ± 11 (3 to 10) | 0.39 | |
| Δ TTE [min] | 2 (1–3) | 2 ± 2 (2 to 3) | 3 (2–4) | 3 ± 1 (2 to 3) | 0.11 | |
| BP | Δ SBP a [mmHg] | 0 (−20–10) | −3 ± 16 (−9 to 2) | −5 (−10–5) | −6 ± 17 (−11 to 0) | 0.49 |
| Δ DBP a [mmHg] | −5 (−10–0) | −5 ± 11 (−8 to−2) | −5 (−15–0) | −8 ± 11 (−11 to −4) | 0.34 | |
| Δ SBPVT [mmHg] | 25 (25–50) | 30 ± 13 (26 to 35) | 25 (25–25) | 26 ± 15 (21 to 31) | 0.31 | |
| Δ DBPVT [mmHg] | 6 (−1–13) | 6 ± 9 (3 to 9) | 5 (1–14) | 6 ± 10 (3 to 9) | 0.82 | |
Publisher’s Note: MDPI stays neutral with regard to jurisdictional claims in published maps and institutional affiliations. |
© 2021 by the authors. Licensee MDPI, Basel, Switzerland. This article is an open access article distributed under the terms and conditions of the Creative Commons Attribution (CC BY) license (https://creativecommons.org/licenses/by/4.0/).
Share and Cite
Jamka, M.; Mądry, E.; Bogdański, P.; Kryściak, J.; Mądry, R.; Lisowska, A.; Ismagulova, E.; Gotz-Więckowska, A.; Chudzicka-Strugała, I.; Amanzholkyzy, A.; et al. The Effect of Endurance and Endurance-Strength Training on Bone Mineral Density and Content in Abdominally Obese Postmenopausal Women: A Randomized Trial. Healthcare 2021, 9, 1074. https://doi.org/10.3390/healthcare9081074
Jamka M, Mądry E, Bogdański P, Kryściak J, Mądry R, Lisowska A, Ismagulova E, Gotz-Więckowska A, Chudzicka-Strugała I, Amanzholkyzy A, et al. The Effect of Endurance and Endurance-Strength Training on Bone Mineral Density and Content in Abdominally Obese Postmenopausal Women: A Randomized Trial. Healthcare. 2021; 9(8):1074. https://doi.org/10.3390/healthcare9081074
Chicago/Turabian StyleJamka, Małgorzata, Edyta Mądry, Paweł Bogdański, Jakub Kryściak, Radosław Mądry, Aleksandra Lisowska, Elnara Ismagulova, Anna Gotz-Więckowska, Izabela Chudzicka-Strugała, Ainur Amanzholkyzy, and et al. 2021. "The Effect of Endurance and Endurance-Strength Training on Bone Mineral Density and Content in Abdominally Obese Postmenopausal Women: A Randomized Trial" Healthcare 9, no. 8: 1074. https://doi.org/10.3390/healthcare9081074