
Archimedes Optimization Algorithm with Deep Learning-Based Prostate Cancer Classification on Magnetic Resonance Imaging

 ,
,  ,
,  ,
,
Abstract
:1. Introduction
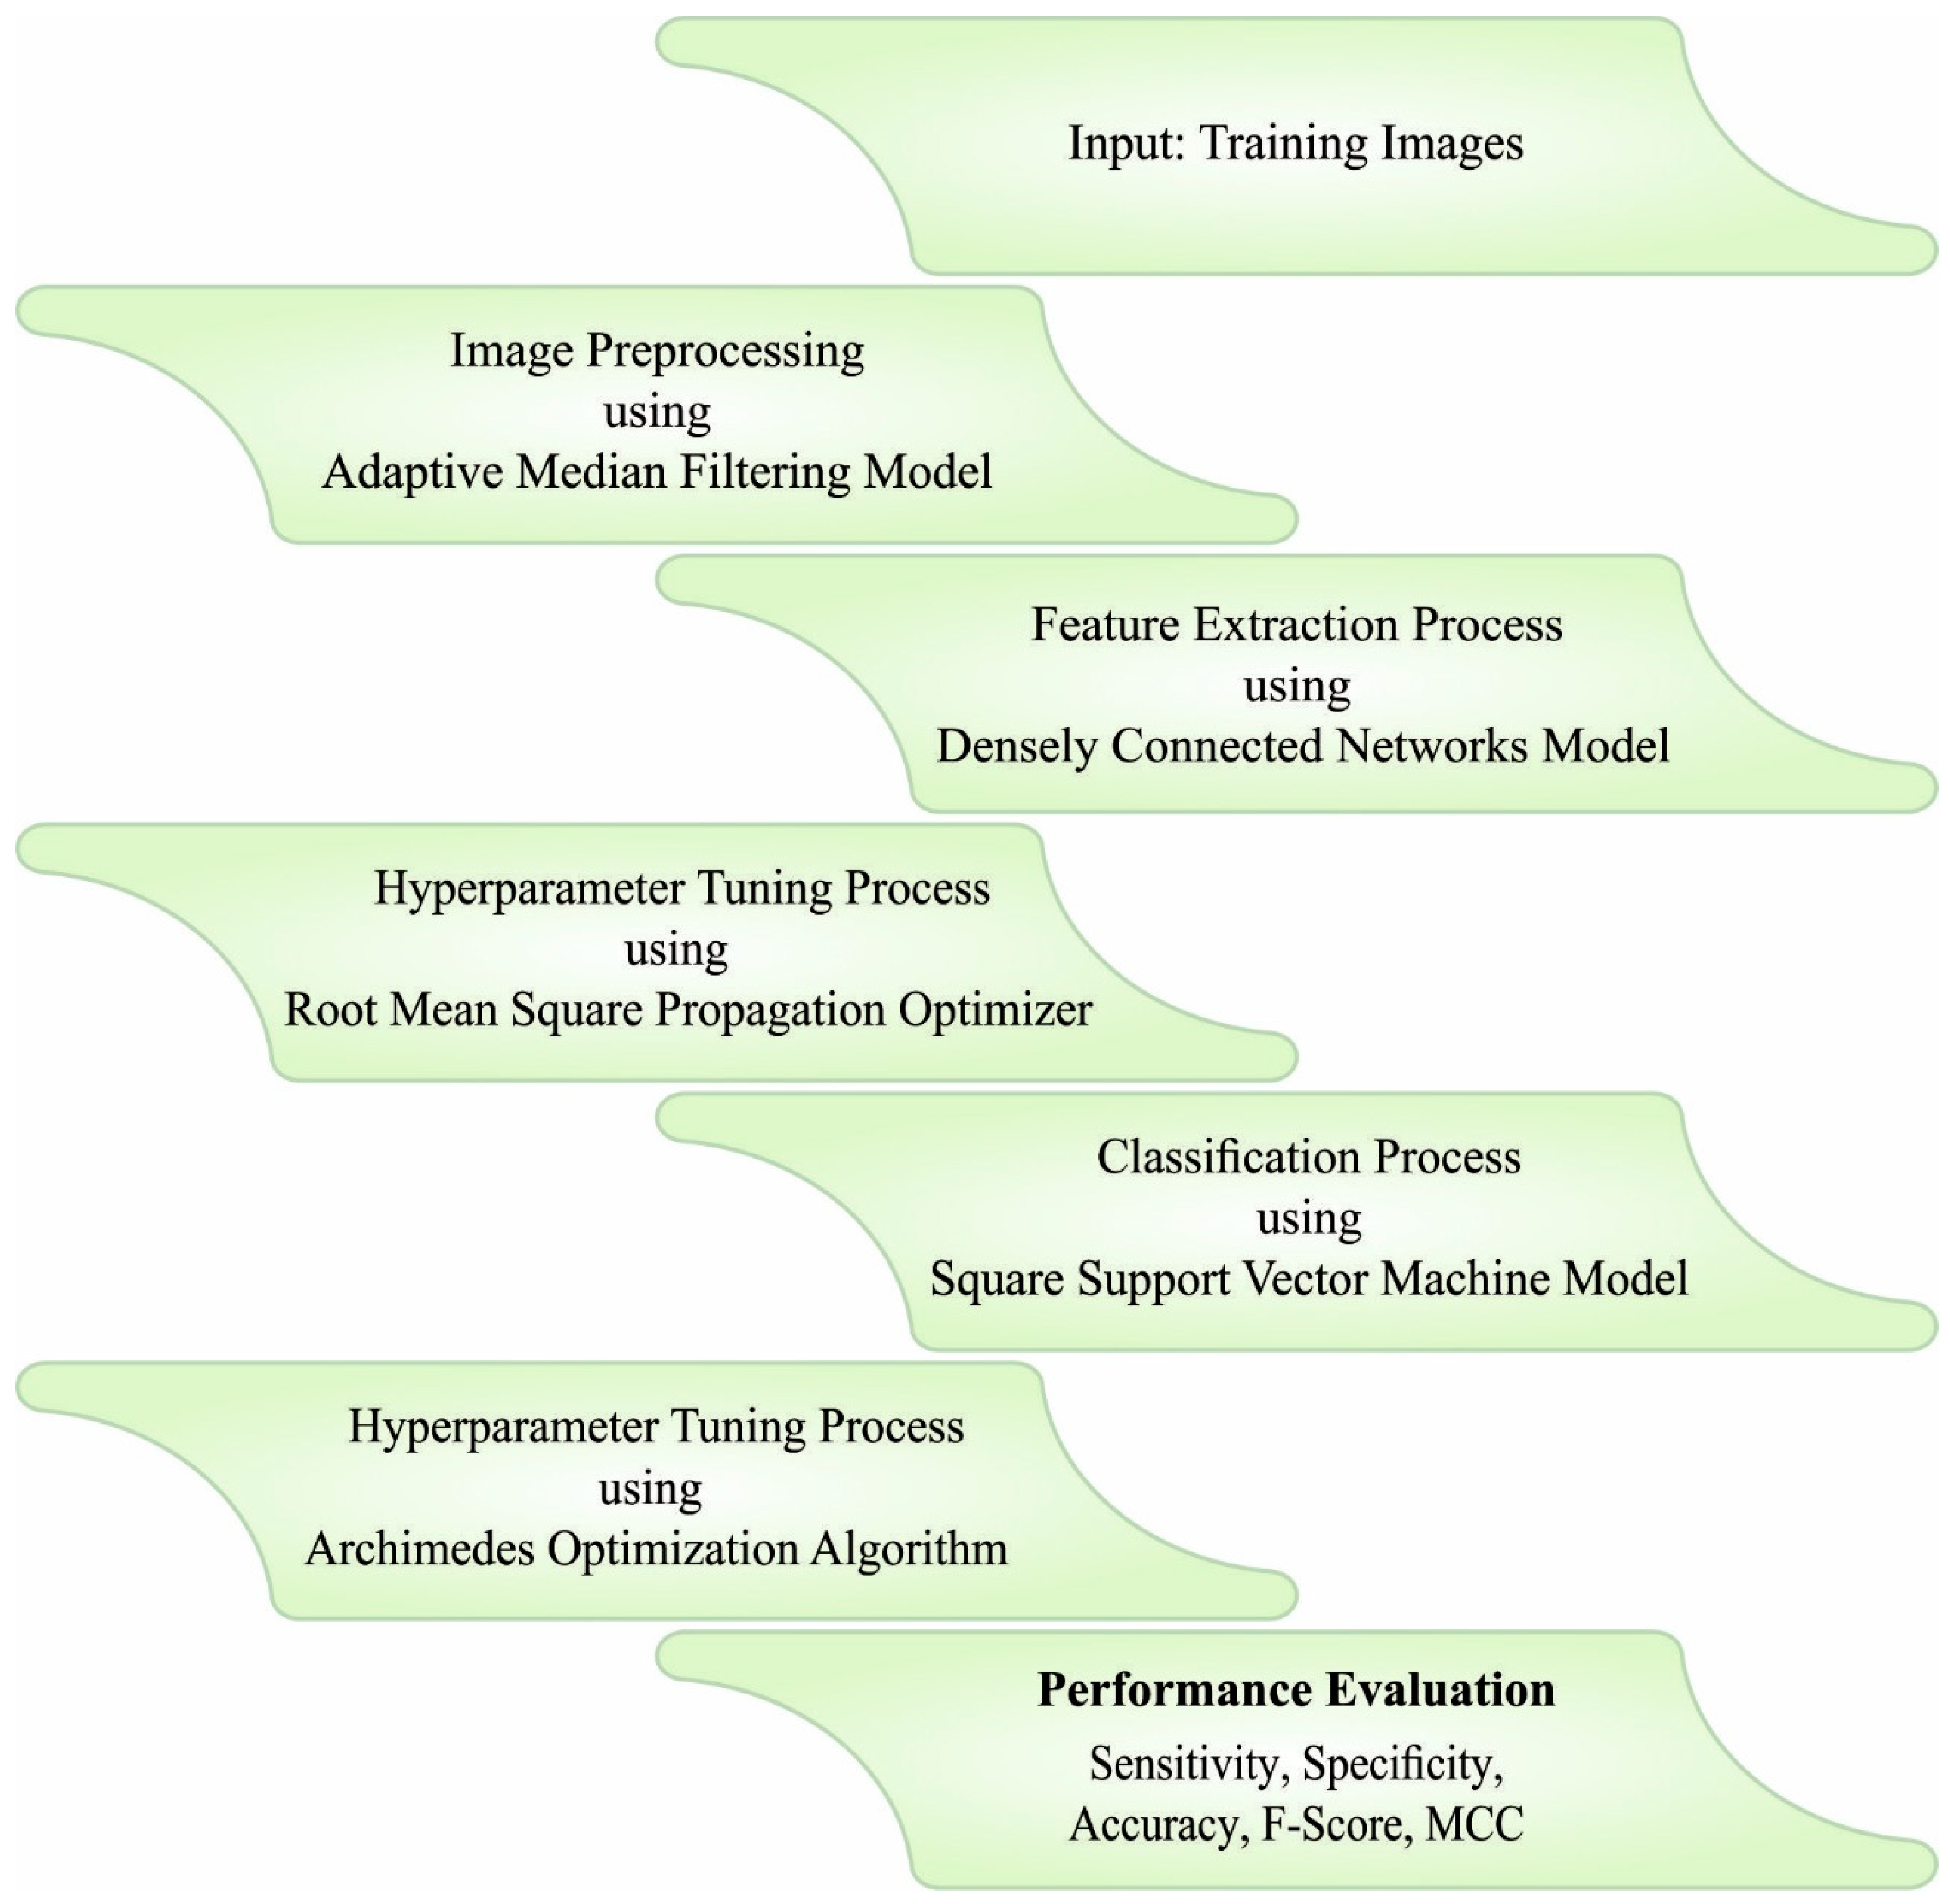
- An intelligent AOADLB-P2C technique is presented, and it comprises AMF-based pre-processing, DenseNet-161-based feature extraction, RMSProp optimizer, LS-SVM classification, and AOA-based hyperparameter tuning. To the best of the researchers’ knowledge, a AOADLB-P2C model has never been presented in the literature.
- A RMSProp optimizer is applied in this study for the selection of hyperparameters involved in the DenseNet-161 model.
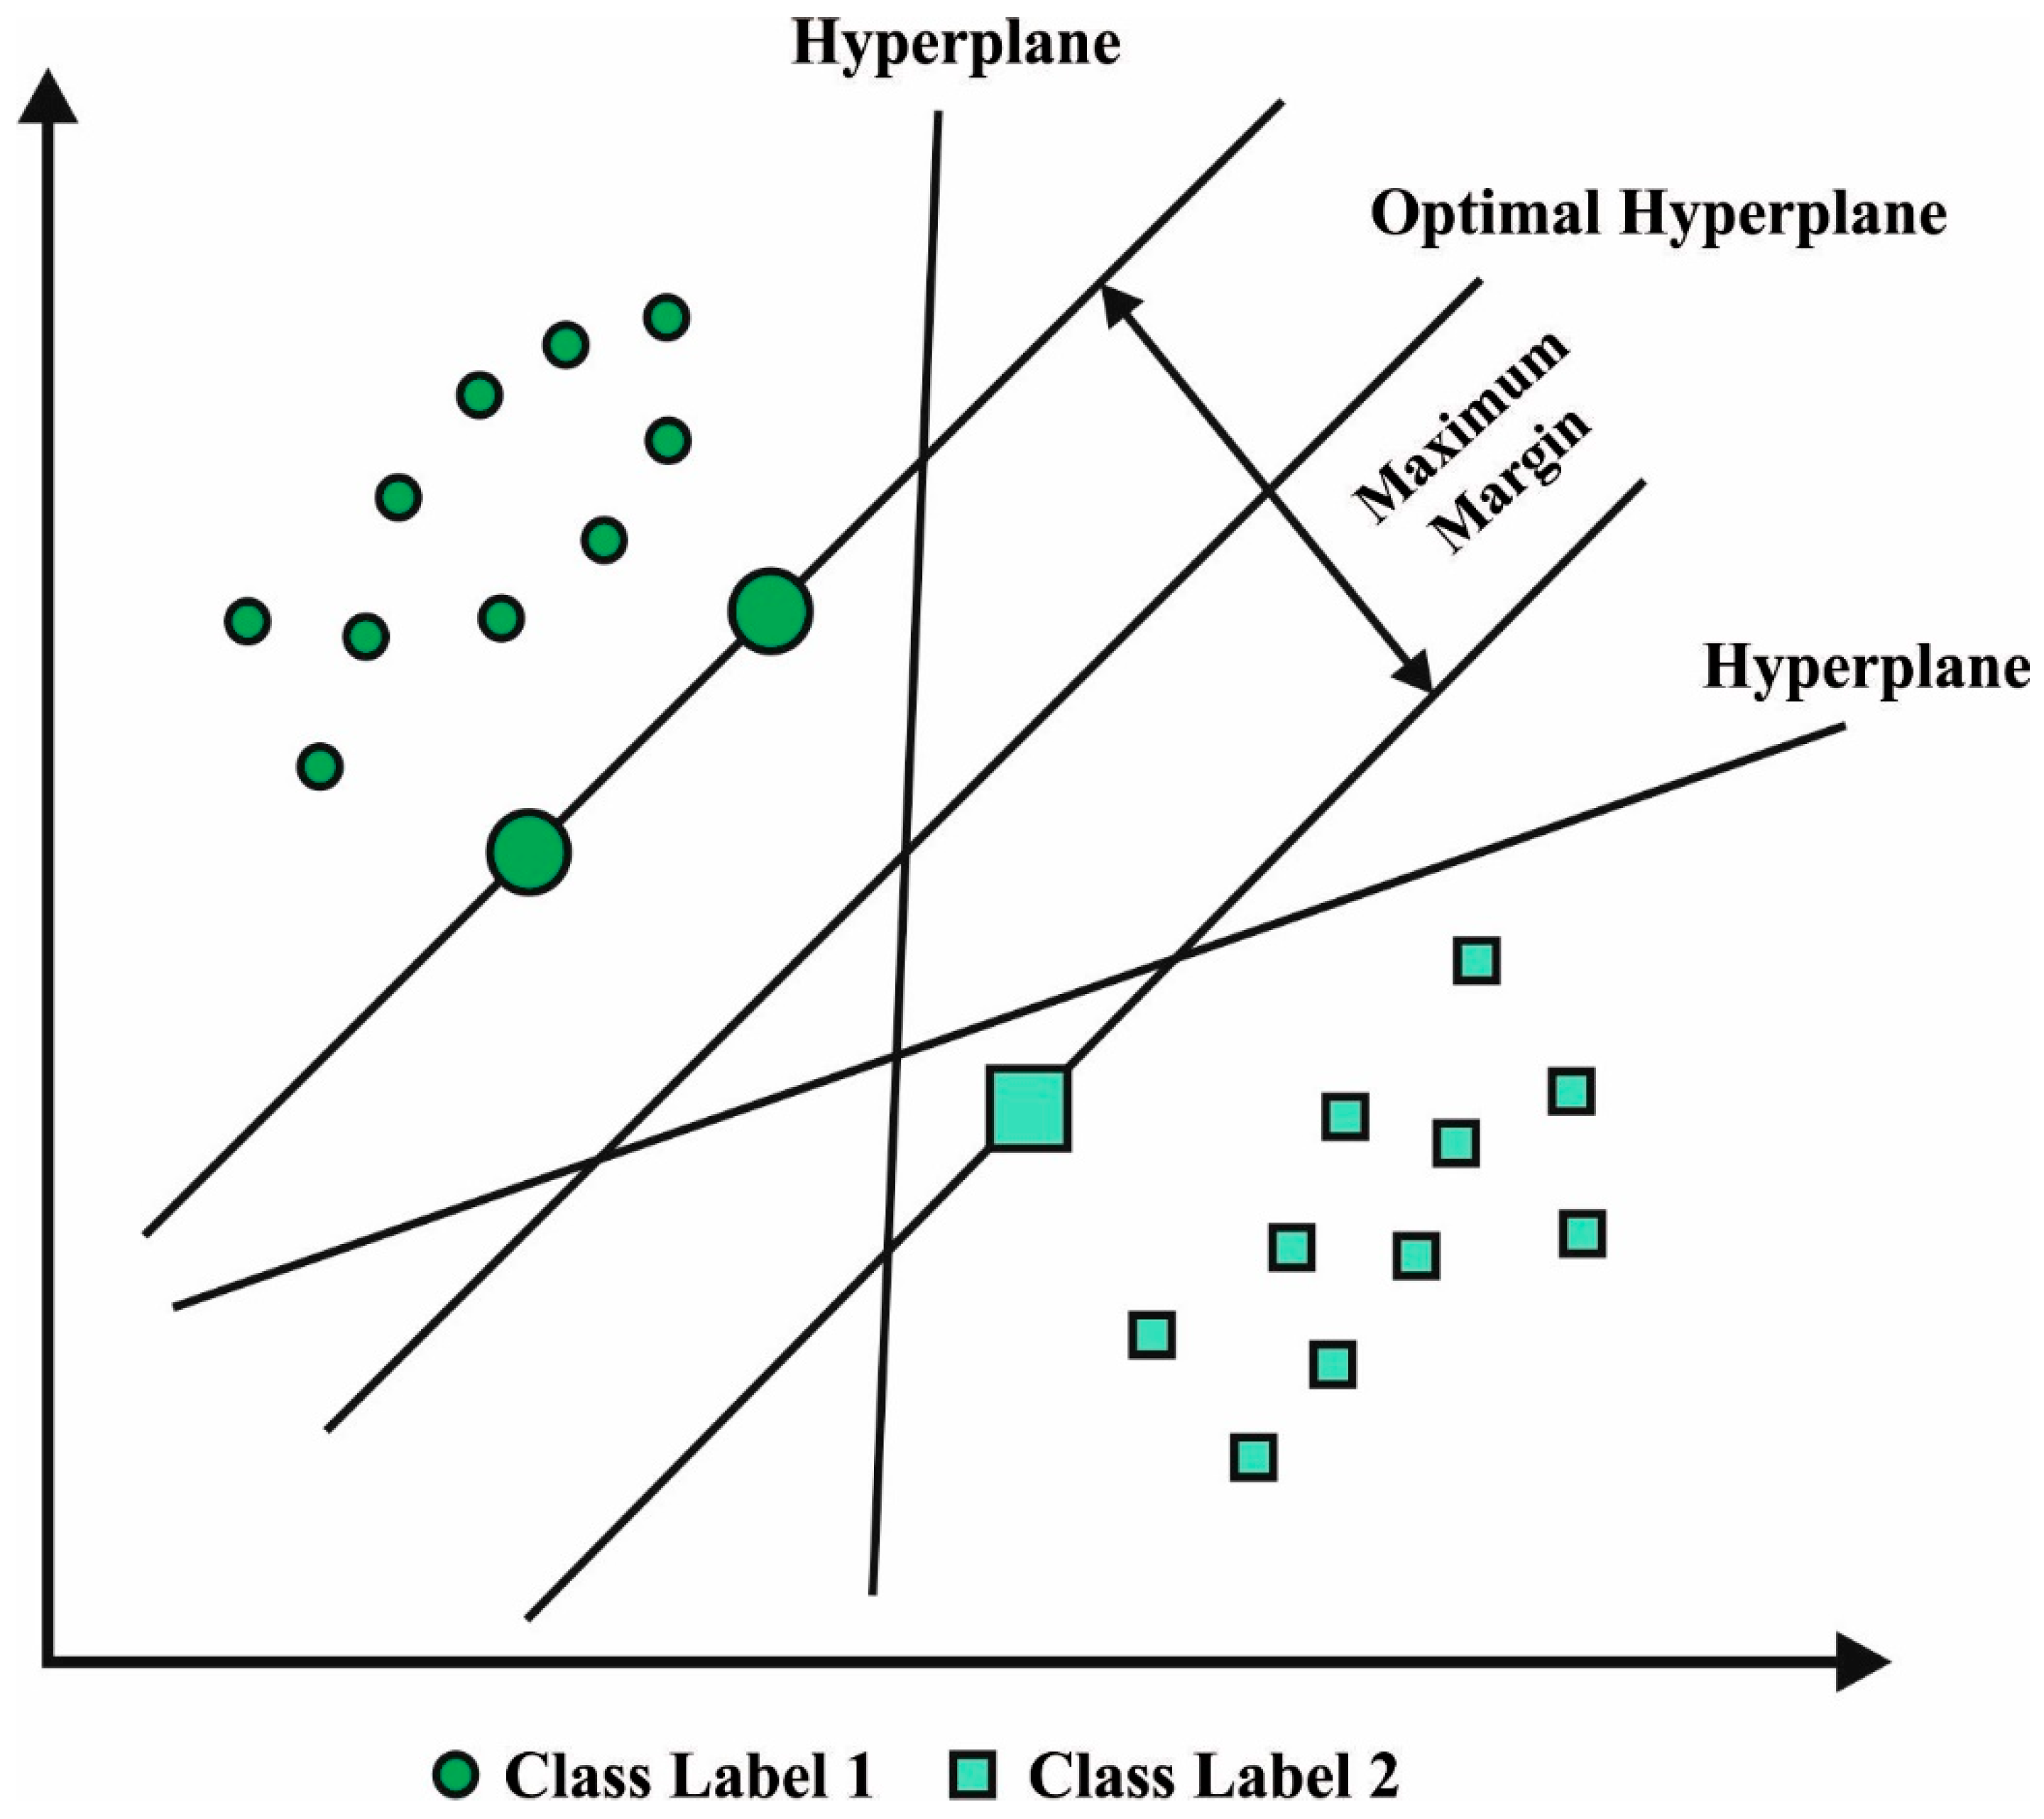
- The parameter optimization of the LS-SVM model using the AOA algorithm and cross-validation helps in boosting the predictive outcome of the proposed model for unseen data.
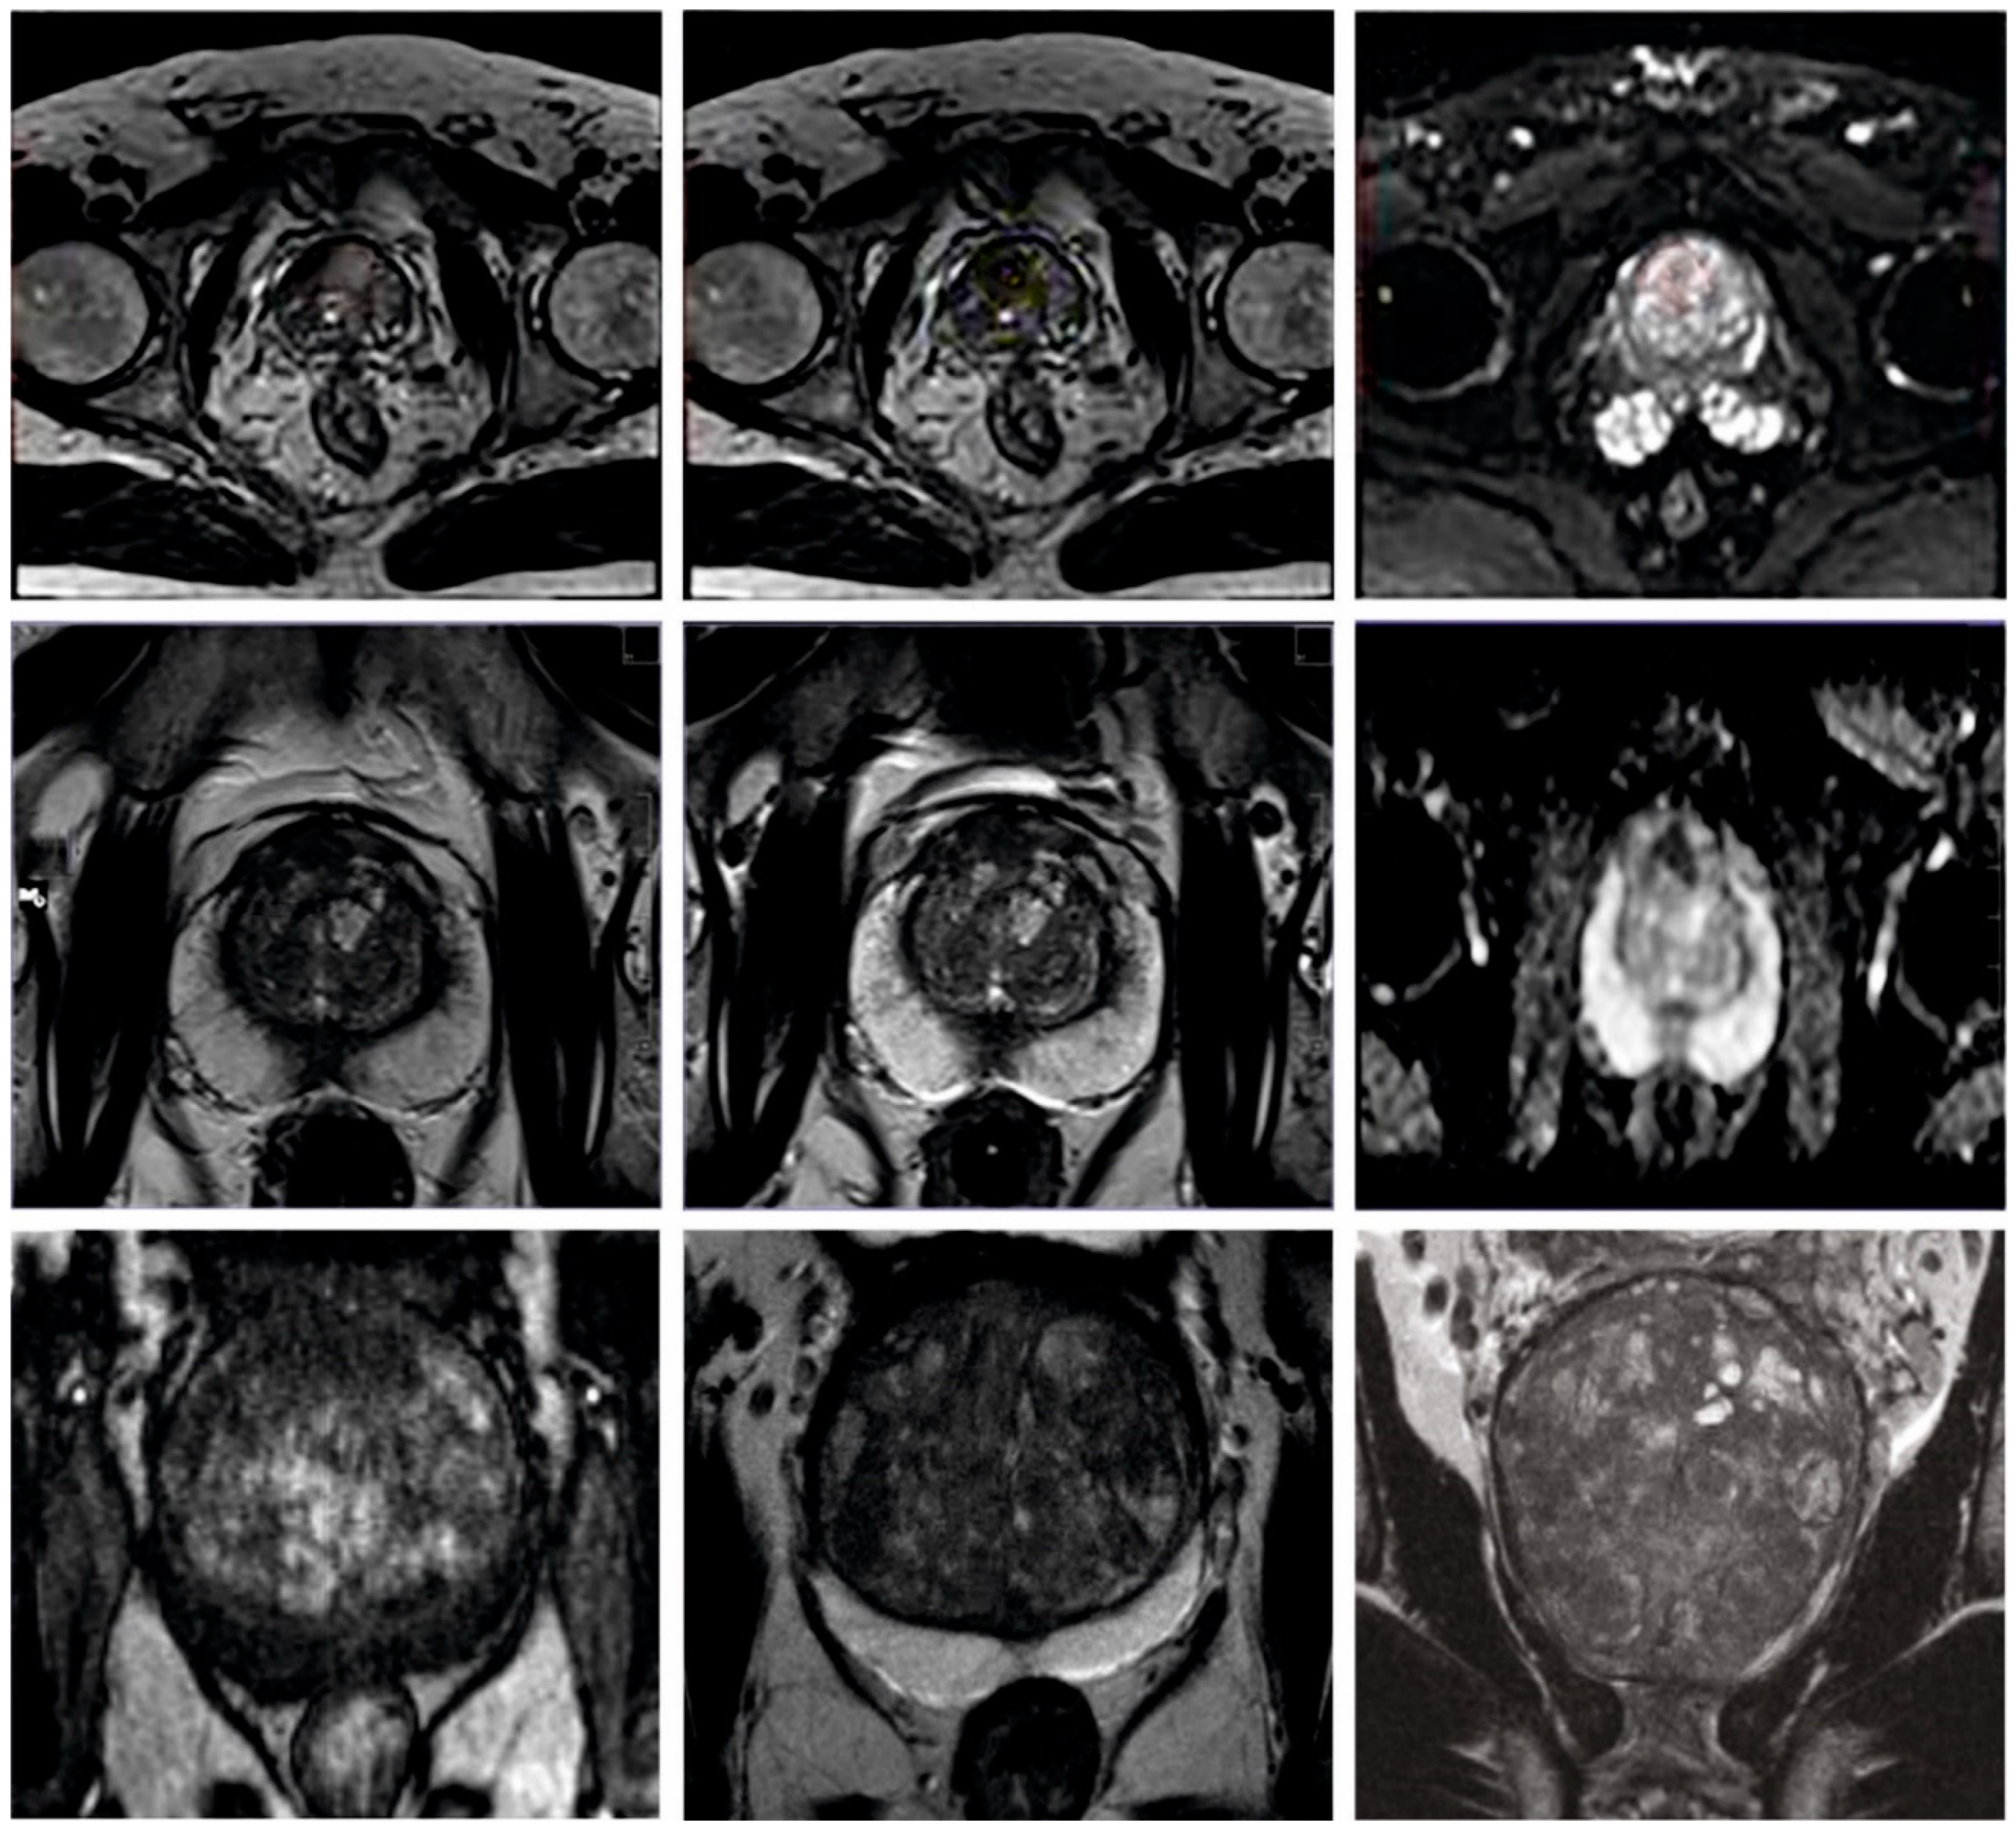
- The performance of the proposed model is validated using a PCa dataset.
2. Related Works
3. The Proposed Model
3.1. Pre-Processing
3.2. Feature Extraction
3.3. Prostate Cancer Classification
4. Results and Discussion
5. Conclusions
Author Contributions
Funding
Institutional Review Board Statement
Informed Consent Statement
Data Availability Statement
Acknowledgments
Conflicts of Interest
References
- Xie, W.; Reder, N.P.; Koyuncu, C.; Leo, P.; Hawley, S.; Huang, H.; Mao, C.; Postupna, N.; Kang, S.; Serafin, R.; et al. Prostate cancer risk stratification via non-destructive 3D pathology with deep learning-assisted gland analysis. Cancer Res. 2022, 82, 334. [Google Scholar] [CrossRef] [PubMed]
- Hartenstein, A.; Lübbe, F.; Baur, A.D.; Rudolph, M.M.; Furth, C.; Brenner, W.; Amthauer, H.; Hamm, B.; Makowski, M.; Penzkofer, T. Prostate cancer nodal staging: Using deep learning to predict 68Ga-PSMA-positivity from CT imaging alone. Sci. Rep. 2020, 10, 3398. [Google Scholar] [CrossRef] [PubMed] [Green Version]
- Liu, Y.; Zheng, H.; Liang, Z.; Miao, Q.; Brisbane, W.G.; Marks, L.S.; Raman, S.S.; Reiter, R.E.; Yang, G.; Sung, K. Textured-Based Deep Learning in Prostate Cancer Classification with 3T Multiparametric MRI: Comparison with PI-RADS-Based Classification. Diagnostics 2021, 11, 1785. [Google Scholar] [CrossRef] [PubMed]
- Tolkach, Y.; Dohmgörgen, T.; Toma, M.; Kristiansen, G. High-accuracy prostate cancer pathology using deep learning. Nat. Mach. Intell. 2020, 2, 411–418. [Google Scholar] [CrossRef]
- Iqbal, S.; Siddiqui, G.F.; Rehman, A.; Hussain, L.; Saba, T.; Tariq, U.; Abbasi, A.A. Prostate cancer detection using deep learning and traditional techniques. IEEE Access 2021, 9, 27085–27100. [Google Scholar] [CrossRef]
- Yoo, S.; Gujrathi, I.; Haider, M.A.; Khalvati, F. Prostate cancer detection using deep convolutional neural networks. Sci. Rep. 2019, 9, 19518. [Google Scholar] [CrossRef] [Green Version]
- Han, W.; Johnson, C.; Gaed, M.; Gómez, J.A.; Moussa, M.; Chin, J.L.; Pautler, S.; Bauman, G.S.; Ward, A.D. Histologic tissue components provide major cues for machine learning-based prostate cancer detection and grading on prostatectomy specimens. Sci. Rep. 2020, 10, 9911. [Google Scholar] [CrossRef]
- Yuan, Y.; Qin, W.; Buyyounouski, M.; Ibragimov, B.; Hancock, S.; Han, B.; Xing, L. Prostate cancer classification with multiparametric MRI transfer learning model. Med. Phys. 2019, 46, 756–765. [Google Scholar] [CrossRef]
- Arvidsson, I.; Overgaard, N.C.; Marginean, F.E.; Krzyzanowska, A.; Bjartell, A.; Åström, K.; Heyden, A. Generalization of prostate cancer classification for multiple sites using deep learning. In Proceedings of the 2018 IEEE 15th International Symposium on Biomedical Imaging (ISBI 2018), Washington, DC, USA, 4–7 April 2018; IEEE: Piscataway, NJ, USA, 2018; pp. 191–194. [Google Scholar]
- Ragab, M.; Albukhari, A.; Alyami, J.; Mansour, R.F. Ensemble deep-learning-enabled clinical decision support system for breast cancer diagnosis and classification on ultrasound images. Biology 2022, 11, 439. [Google Scholar] [CrossRef]
- Mansouri, R.A.; Ragab, M. Equilibrium Optimization Algorithm with Ensemble Learning Based Cervical Precancerous Lesion Classification Model. Healthcare 2023, 11, 55. [Google Scholar] [CrossRef]
- Ragab, M.; Ashary, E.B.; Sabir, M.F.S.; Bahaddad, A.A.; Mansour, R.F. Mathematical Modelling of Quantum Kernel Method for Biomedical Data Analysis. Cmc-Comput. Mater. Contin. 2022, 71, 5441–5457. [Google Scholar] [CrossRef]
- Abbasi, A.A.; Hussain, L.; Awan, I.A.; Abbasi, I.; Majid, A.; Nadeem, M.S.A.; Chaudhary, Q.A. Detecting prostate cancer using deep learning convolution neural network with transfer learning approach. Cogn. Neurodyn. 2020, 14, 523–533. [Google Scholar] [CrossRef] [PubMed]
- Liu, Z.; Yang, C.; Huang, J.; Liu, S.; Zhuo, Y.; Lu, X. Deep learning framework based on integration of S-Mask R-CNN and Inception-v3 for ultrasound image-aided diagnosis of prostate cancer. Future Gener. Comput. Syst. 2021, 114, 358–367. [Google Scholar] [CrossRef]
- Hassan, M.R.; Islam, M.F.; Uddin, M.Z.; Ghoshal, G.; Hassan, M.M.; Huda, S.; Fortino, G. Prostate cancer classification from ultrasound and MRI images using deep learning based Explainable Artificial Intelligence. Future Gener. Comput. Syst. 2022, 127, 462–472. [Google Scholar] [CrossRef]
- Toledo-Cortés, S.; Useche, D.H.; Müller, H.; González, F.A. Grading diabetic retinopathy and prostate cancer diagnostic images with deep quantum ordinal regression. Comput. Biol. Med. 2022, 145, 105472. [Google Scholar] [CrossRef]
- Alam, M.; Tahernezhadi, M.; Vege, H.K.; Rajesh, P. A machine learning classification technique for predicting prostate cancer. In Proceedings of the 2020 IEEE International Conference on Electro Information Technology (EIT), Chicago, IL, USA, 31 July–1 August 2020; IEEE: Piscataway, NJ, USA, 2020; pp. 228–232. [Google Scholar]
- Zhong, X.; Cao, R.; Shakeri, S.; Scalzo, F.; Lee, Y.; Enzmann, D.R.; Wu, H.H.; Raman, S.S.; Sung, K. Deep transfer learning-based prostate cancer classification using 3 Tesla multi-parametric MRI. Abdom. Radiol. 2019, 44, 2030–2039. [Google Scholar] [CrossRef]
- Wang, Y.; Wang, M. Selecting proper combination of mpMRI sequences for prostate cancer classification using multi-input convolutional neuronal network. Phys. Med. 2020, 80, 92–100. [Google Scholar] [CrossRef]
- Poojitha, U.P.; Sharma, S.L. Hybrid unified deep learning network for highly precise Gleason grading of prostate cancer. In Proceedings of the 2019 41st Annual International Conference of the IEEE Engineering in Medicine and Biology Society (EMBC), Berlin, Germany, 23–27 July 2020; IEEE: Piscataway, NJ, USA, 2019; pp. 899–903. [Google Scholar]
- Salciccia, S.; Capriotti, A.L.; Laganà, A.; Fais, S.; Logozzi, M.; De Berardinis, E.; Busetto, G.M.; Di Pierro, G.B.; Ricciuti, G.P.; Del Giudice, F.; et al. Biomarkers in prostate cancer diagnosis: From current knowledge to the role of metabolomics and exosomes. Int. J. Mol. Sci. 2021, 22, 4367. [Google Scholar] [CrossRef]
- Busetto, G.M.; Giovannone, R.; Antonini, G.; Rossi, A.; Del Giudice, F.; Tricarico, S.; Ragonesi, G.; Gentile, V.; De Berardinis, E. Short-term pretreatment with a dual 5α-reductase inhibitor before bipolar transurethral resection of the prostate (B-TURP): Evaluation of prostate vascularity and decreased surgical blood loss in large prostates. BJU Int. 2015, 116, 117–123. [Google Scholar] [CrossRef] [Green Version]
- Ferro, M.; de Cobelli, O.; Musi, G.; Del Giudice, F.; Carrieri, G.; Busetto, G.M.; Falagario, U.G.; Sciarra, A.; Maggi, M.; Crocetto, F.; et al. Radiomics in prostate cancer: An up-to-date review. Ther. Adv. Urol. 2022, 14, 17562872221109020. [Google Scholar] [CrossRef]
- Massanova, M.; Robertson, S.; Barone, B.; Dutto, L.; Caputo, V.F.; Bhatt, J.R.; Ahmad, I.; Bada, M.; Obeidallah, A.; Crocetto, F. The comparison of imaging and clinical methods to estimate prostate volume: A single-centre retrospective study. Urol. Int. 2021, 105, 804–810. [Google Scholar] [CrossRef] [PubMed]
- Gao, Z. December. An adaptive median filtering of salt and pepper noise based on local pixel distribution. In Proceedings of the 2018 International Conference on Transportation & Logistics, Information & Communication, Smart City (TLICSC 2018), Berlin, Germany, 30–31 October 2018; Atlantis Press: Chengdu, China, 2018; pp. 473–483. [Google Scholar]
- Ramadan, M.K.; Youssif, A.A.; El-Behaidy, W.H. Detection and Classification of Human-Carrying Baggage Using DenseNet-161 and Fit One Cycle. Big Data Cogn. Comput. 2022, 6, 108. [Google Scholar] [CrossRef]
- Zhang, C.; Yao, M.; Chen, W.; Zhang, S.; Chen, D.; Wu, Y. Gradient descent optimization in deep learning model training based on multistage and method combination strategy. Secur. Commun. Netw. 2021, 2021, 9956773. [Google Scholar] [CrossRef]
- Leong, W.C.; Bahadori, A.; Zhang, J.; Ahmad, Z. Prediction of water quality index (WQI) using support vector machine (SVM) and least square-support vector machine (LS-SVM). Int. J. River Basin Manag. 2021, 19, 149–156. [Google Scholar] [CrossRef]
- Hashim, F.A.; Hussain, K.; Houssein, E.H.; Mabrouk, M.S.; Al-Atabany, W. Archimedes optimization algorithm: A new metaheuristic algorithm for solving optimization problems. Appl. Intell. 2021, 51, 1531–1551. [Google Scholar] [CrossRef]
- Fathy, A.; Alharbi, A.G.; Alshammari, S.; Hasanien, H.M. Archimedes optimization algorithm based maximum power point tracker for wind energy generation system. Ain Shams Eng. J. 2022, 13, 101548. [Google Scholar] [CrossRef]


| Class | No. of Instances (Balanced) |
|---|---|
| Prostate | 200 |
| Brachytherapy | 200 |
| Total Number of Instances | 400 |
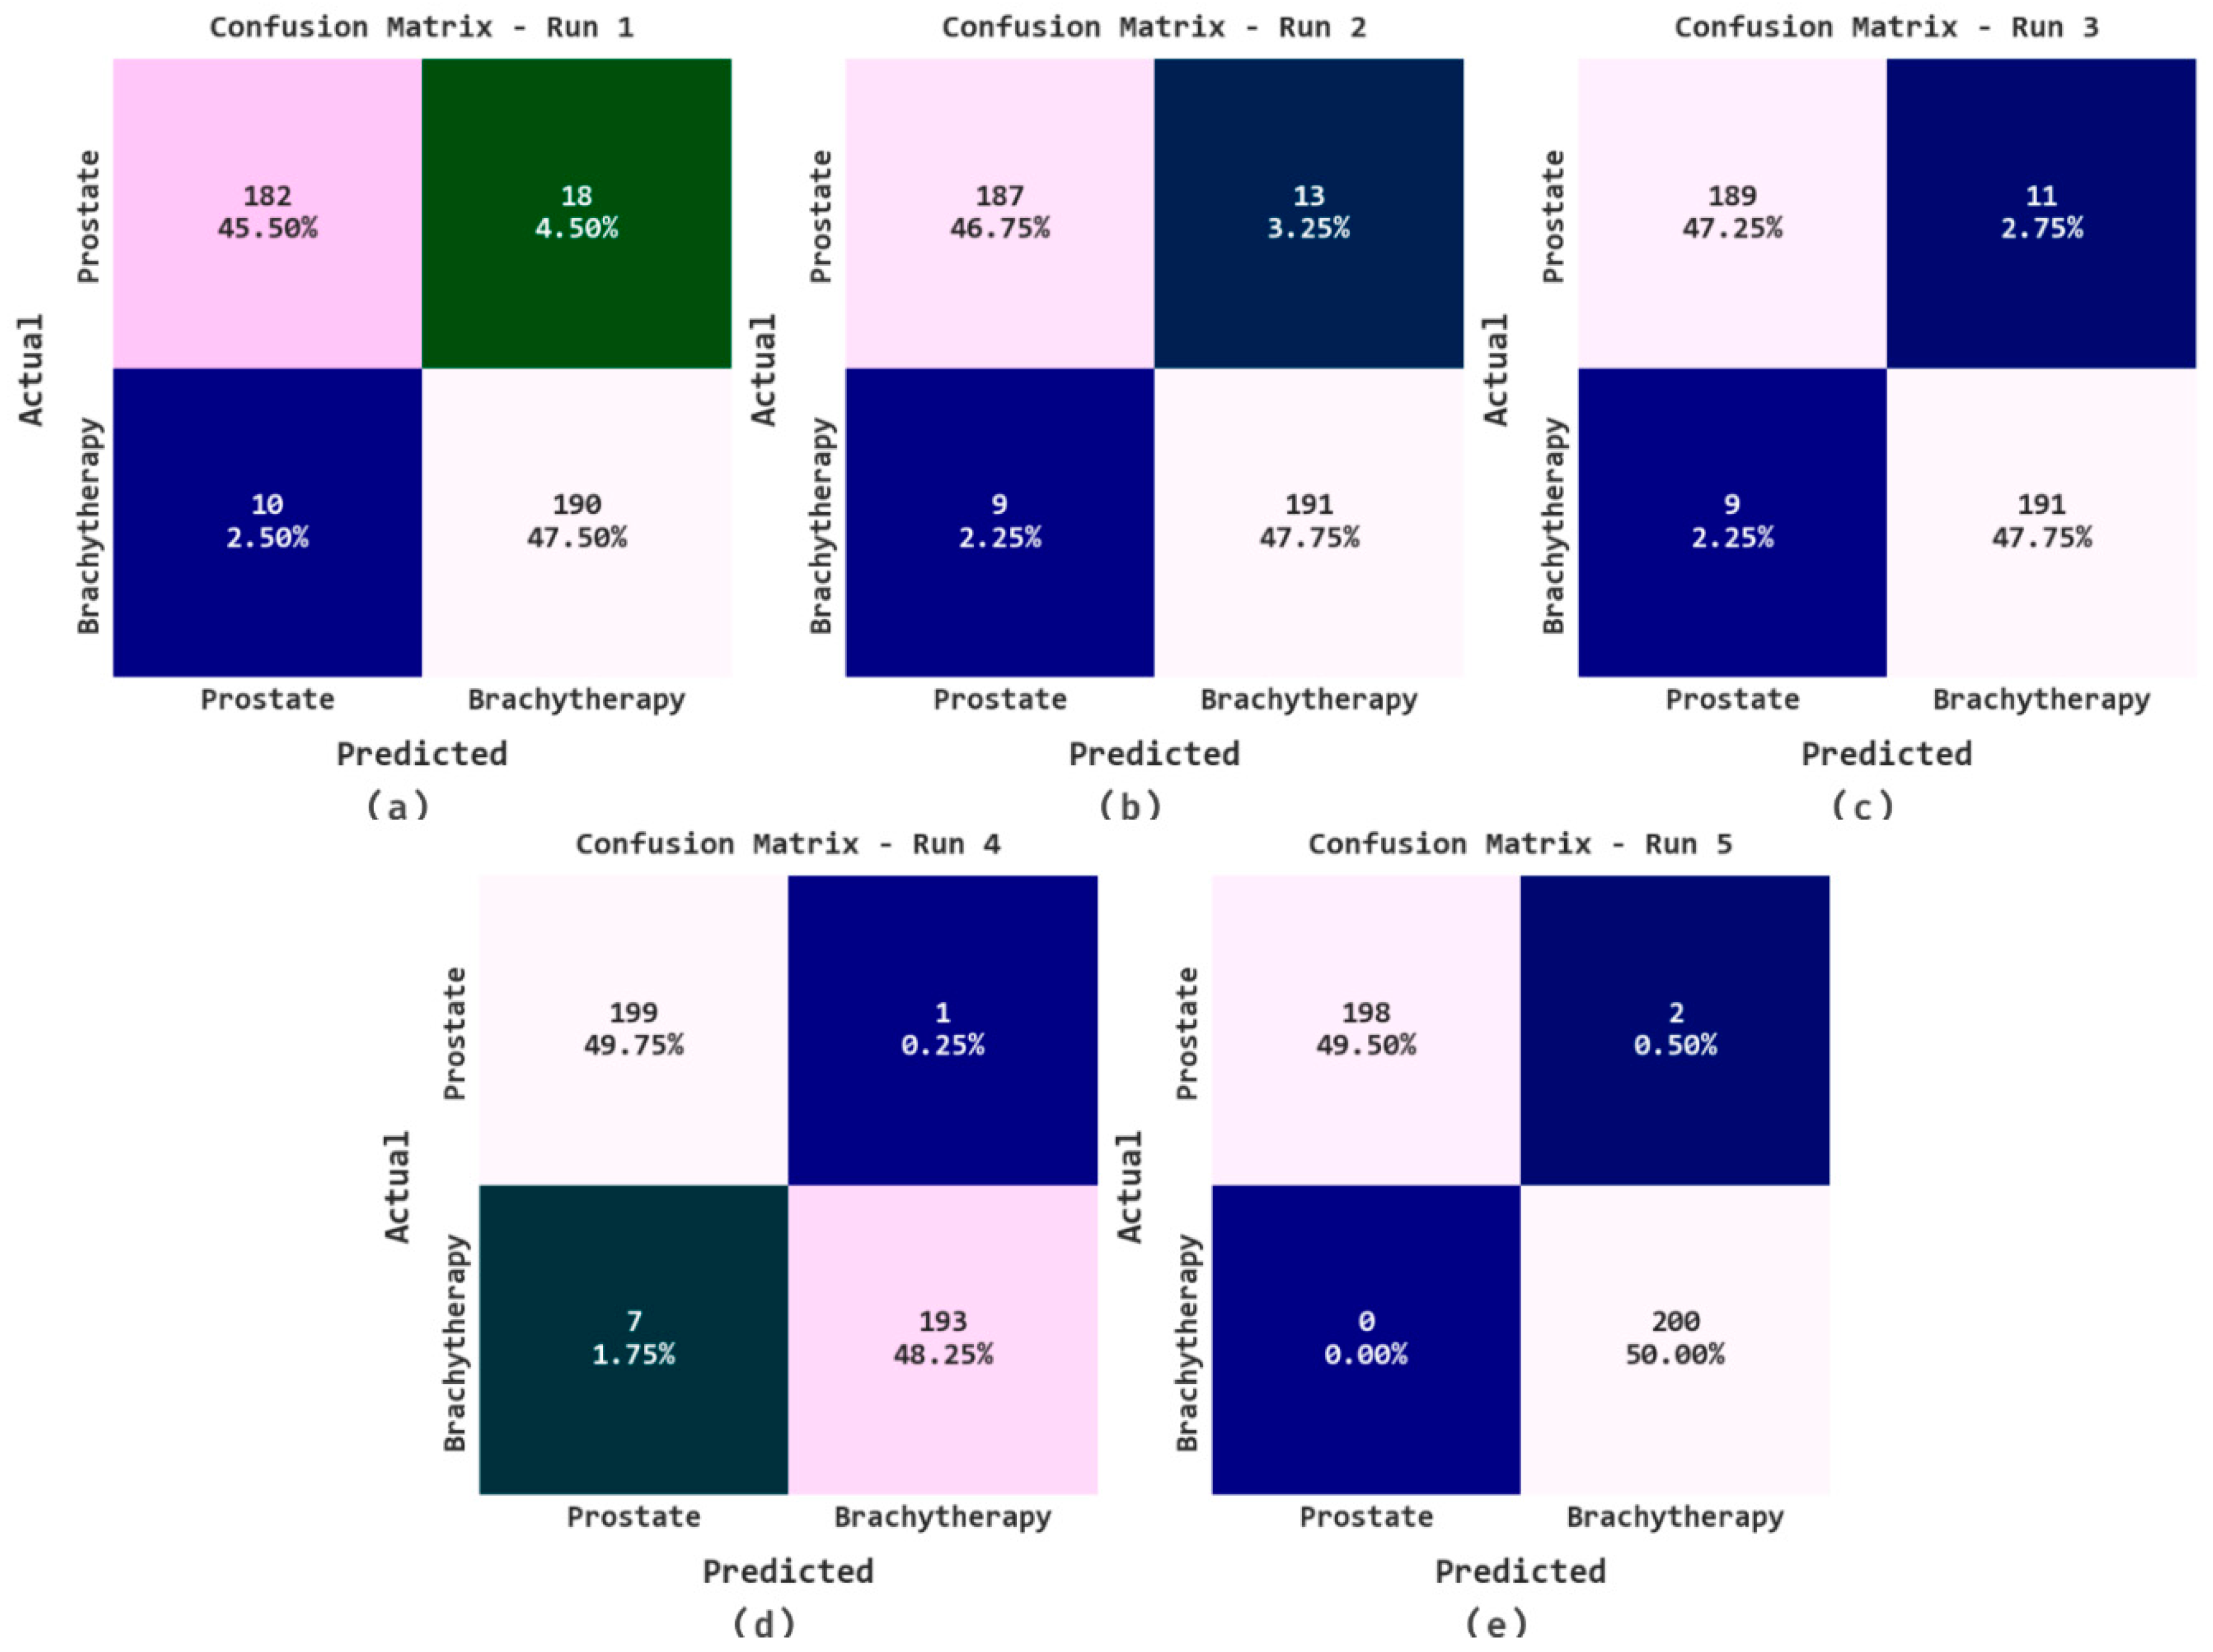
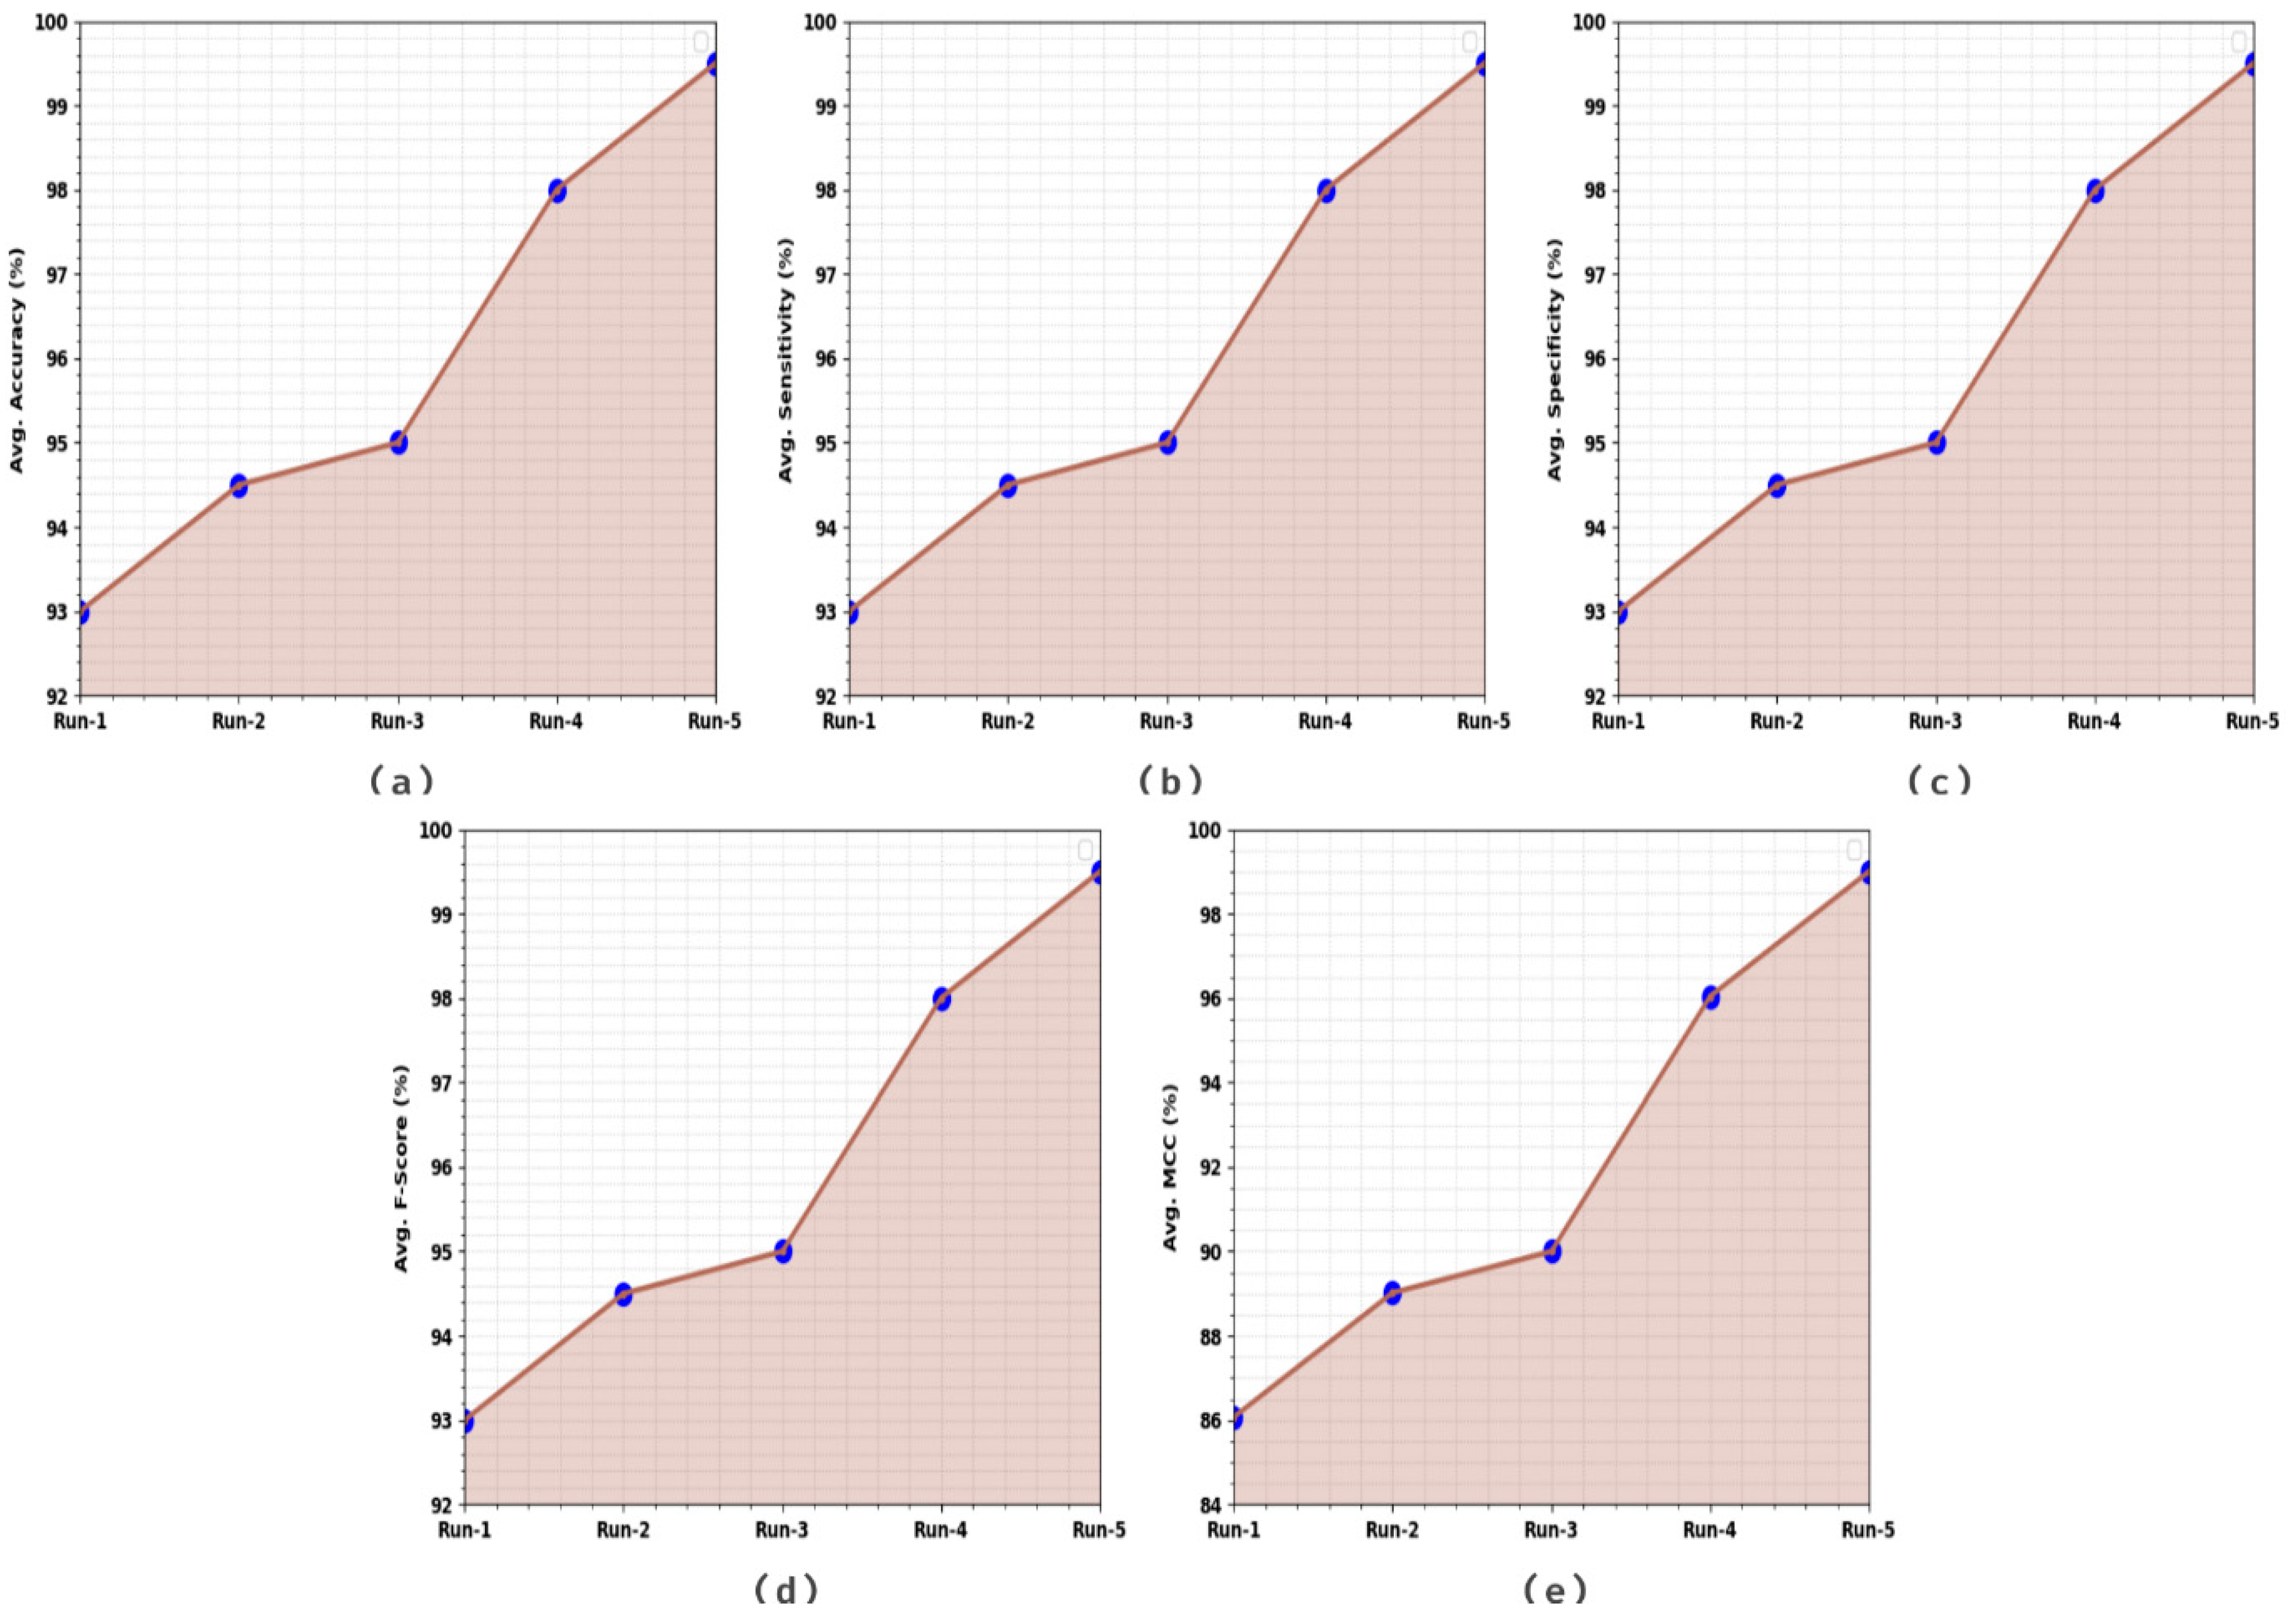
| Class | Accuracybal | Sensitivity | Specificity | F-Score | MCC |
|---|---|---|---|---|---|
| Run-1 | |||||
| Prostate | 91.00 | 91.00 | 95.00 | 92.86 | 86.07 |
| Brachytherapy | 95.00 | 95.00 | 91.00 | 93.14 | 86.07 |
| Average | 93.00 | 93.00 | 93.00 | 93.00 | 86.07 |
| Run-2 | |||||
| Prostate | 93.50 | 93.50 | 95.50 | 94.44 | 89.02 |
| Brachytherapy | 95.50 | 95.50 | 93.50 | 94.55 | 89.02 |
| Average | 94.50 | 94.50 | 94.50 | 94.50 | 89.02 |
| Run-3 | |||||
| Prostate | 94.50 | 94.50 | 95.50 | 94.97 | 90.00 |
| Brachytherapy | 95.50 | 95.50 | 94.50 | 95.02 | 90.00 |
| Average | 95.00 | 95.00 | 95.00 | 95.00 | 90.00 |
| Run-4 | |||||
| Prostate | 99.50 | 99.50 | 96.50 | 98.03 | 96.04 |
| Brachytherapy | 96.50 | 96.50 | 99.50 | 97.97 | 96.04 |
| Average | 98.00 | 98.00 | 98.00 | 98.00 | 96.04 |
| Run-5 | |||||
| Prostate | 99.00 | 99.00 | 100.00 | 99.50 | 99.00 |
| Brachytherapy | 100.00 | 100.00 | 99.00 | 99.50 | 99.00 |
| Average | 99.50 | 99.50 | 99.50 | 99.50 | 99.00 |
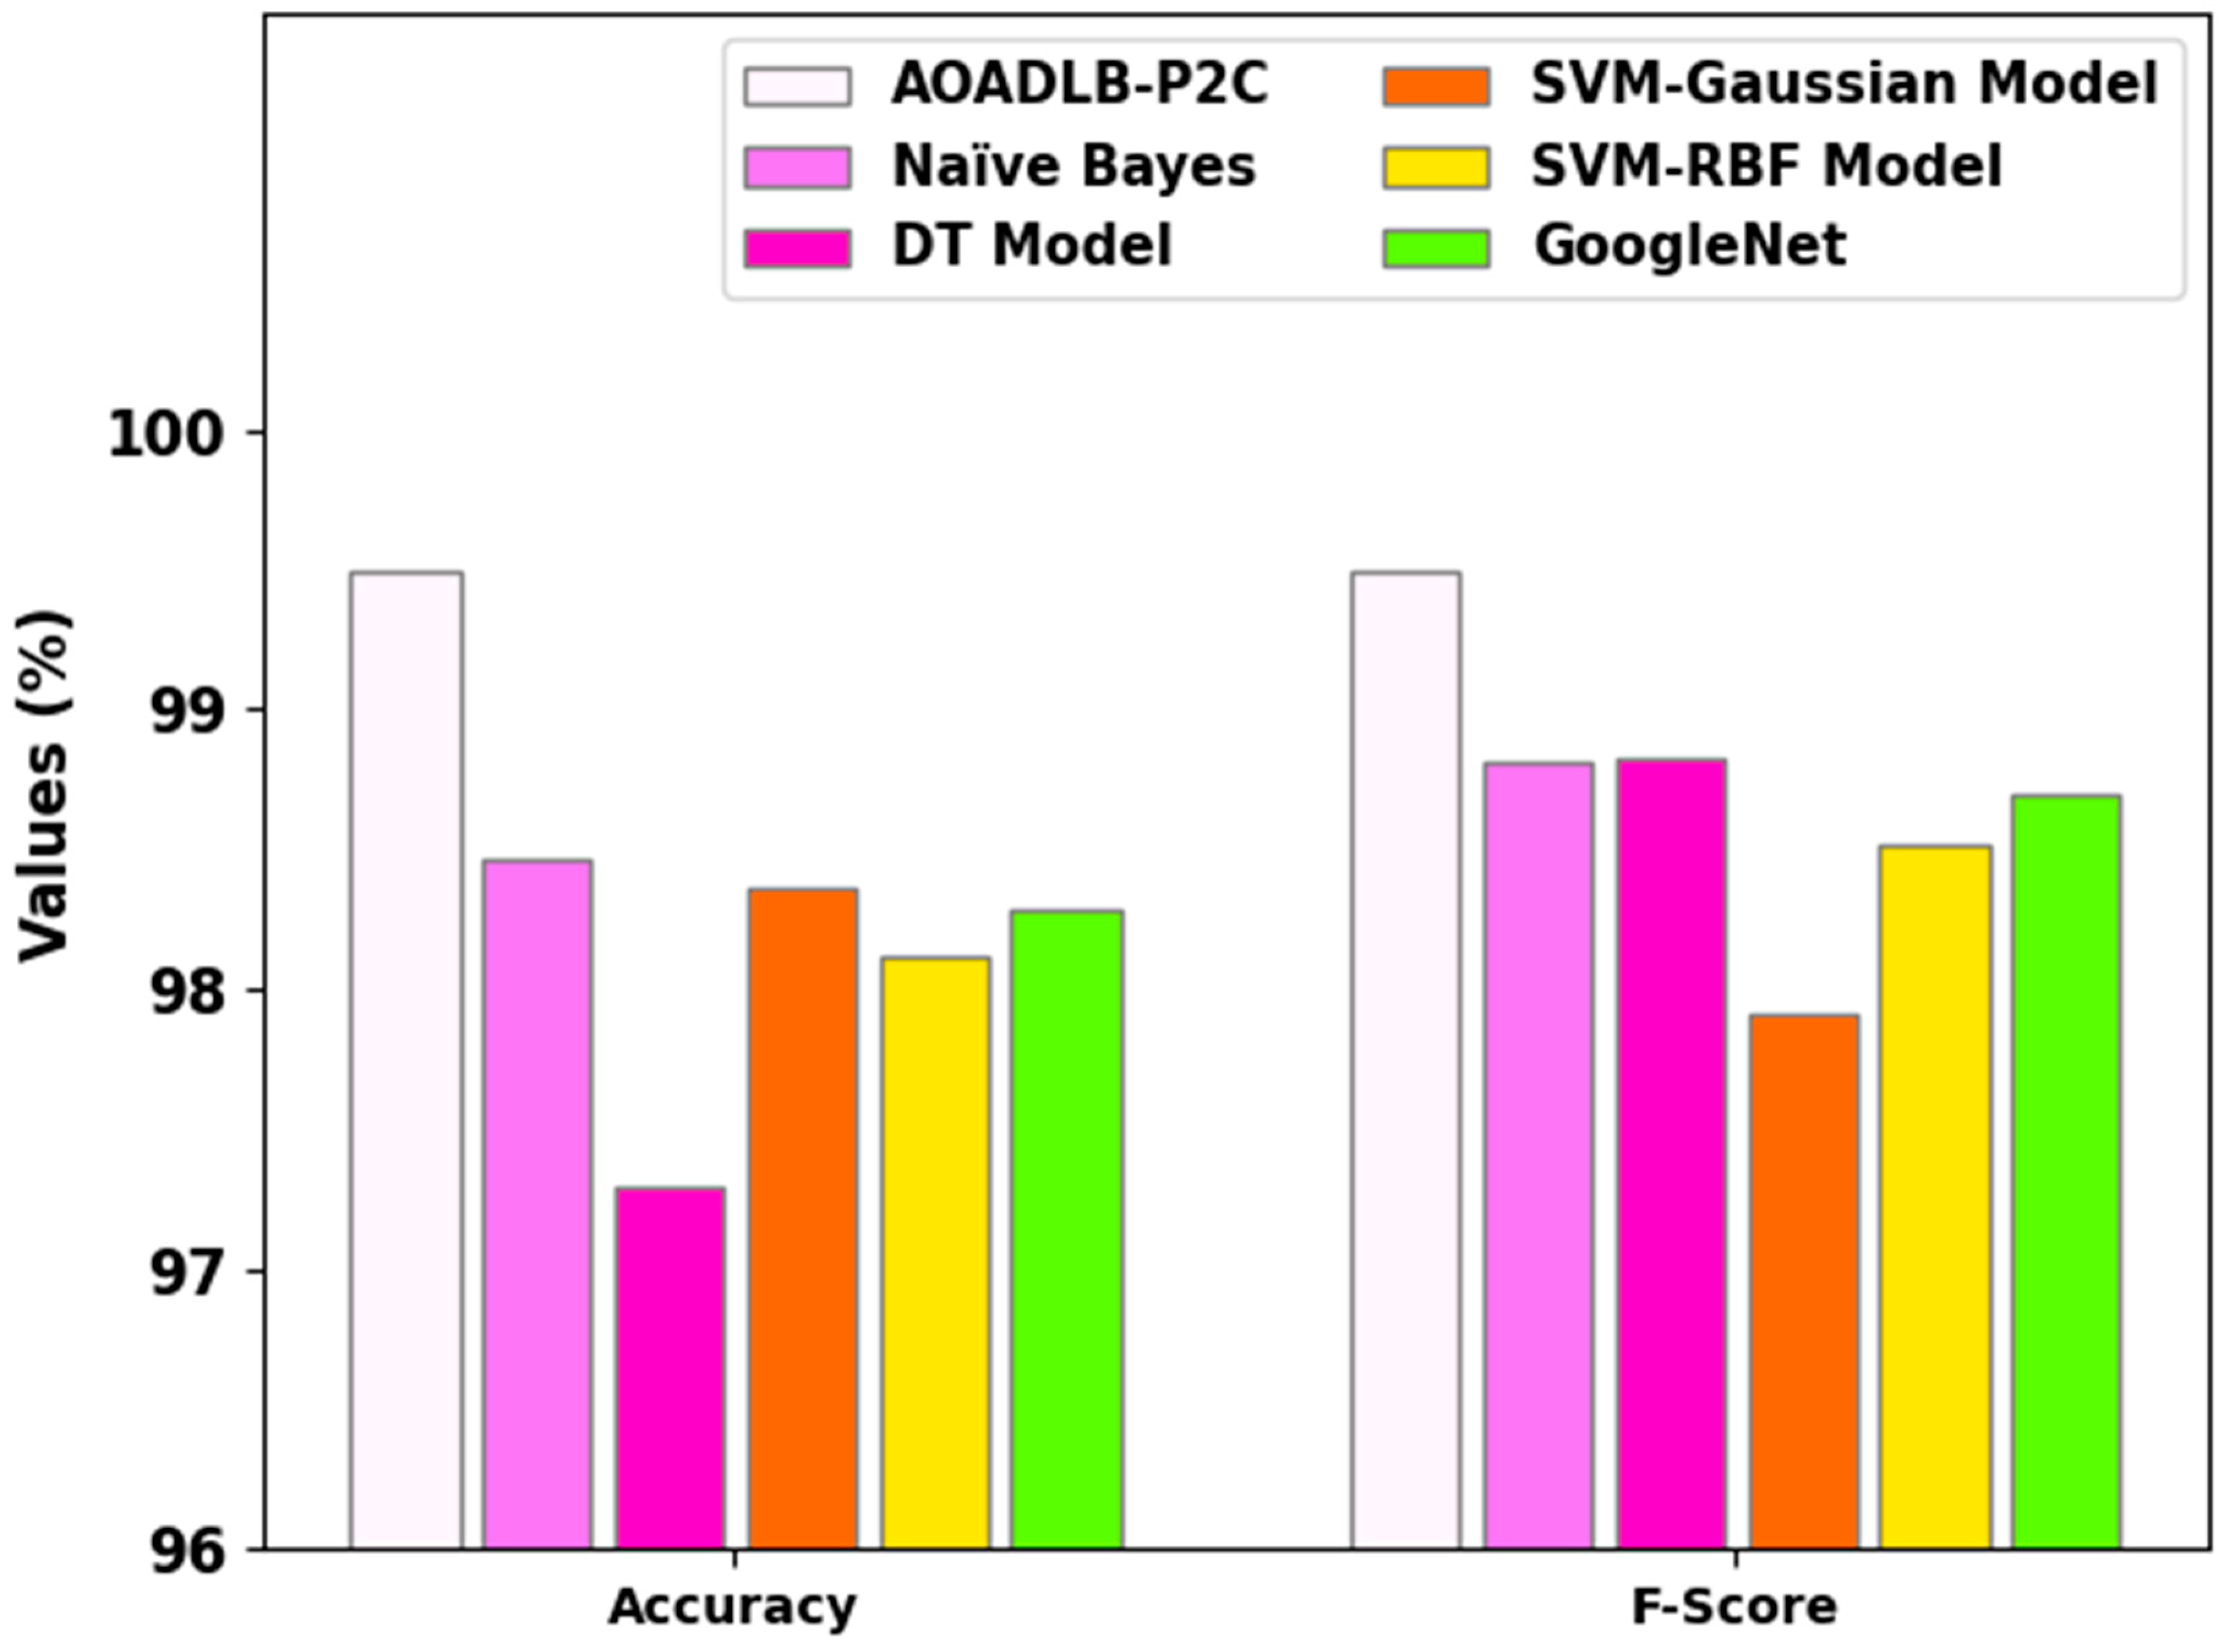
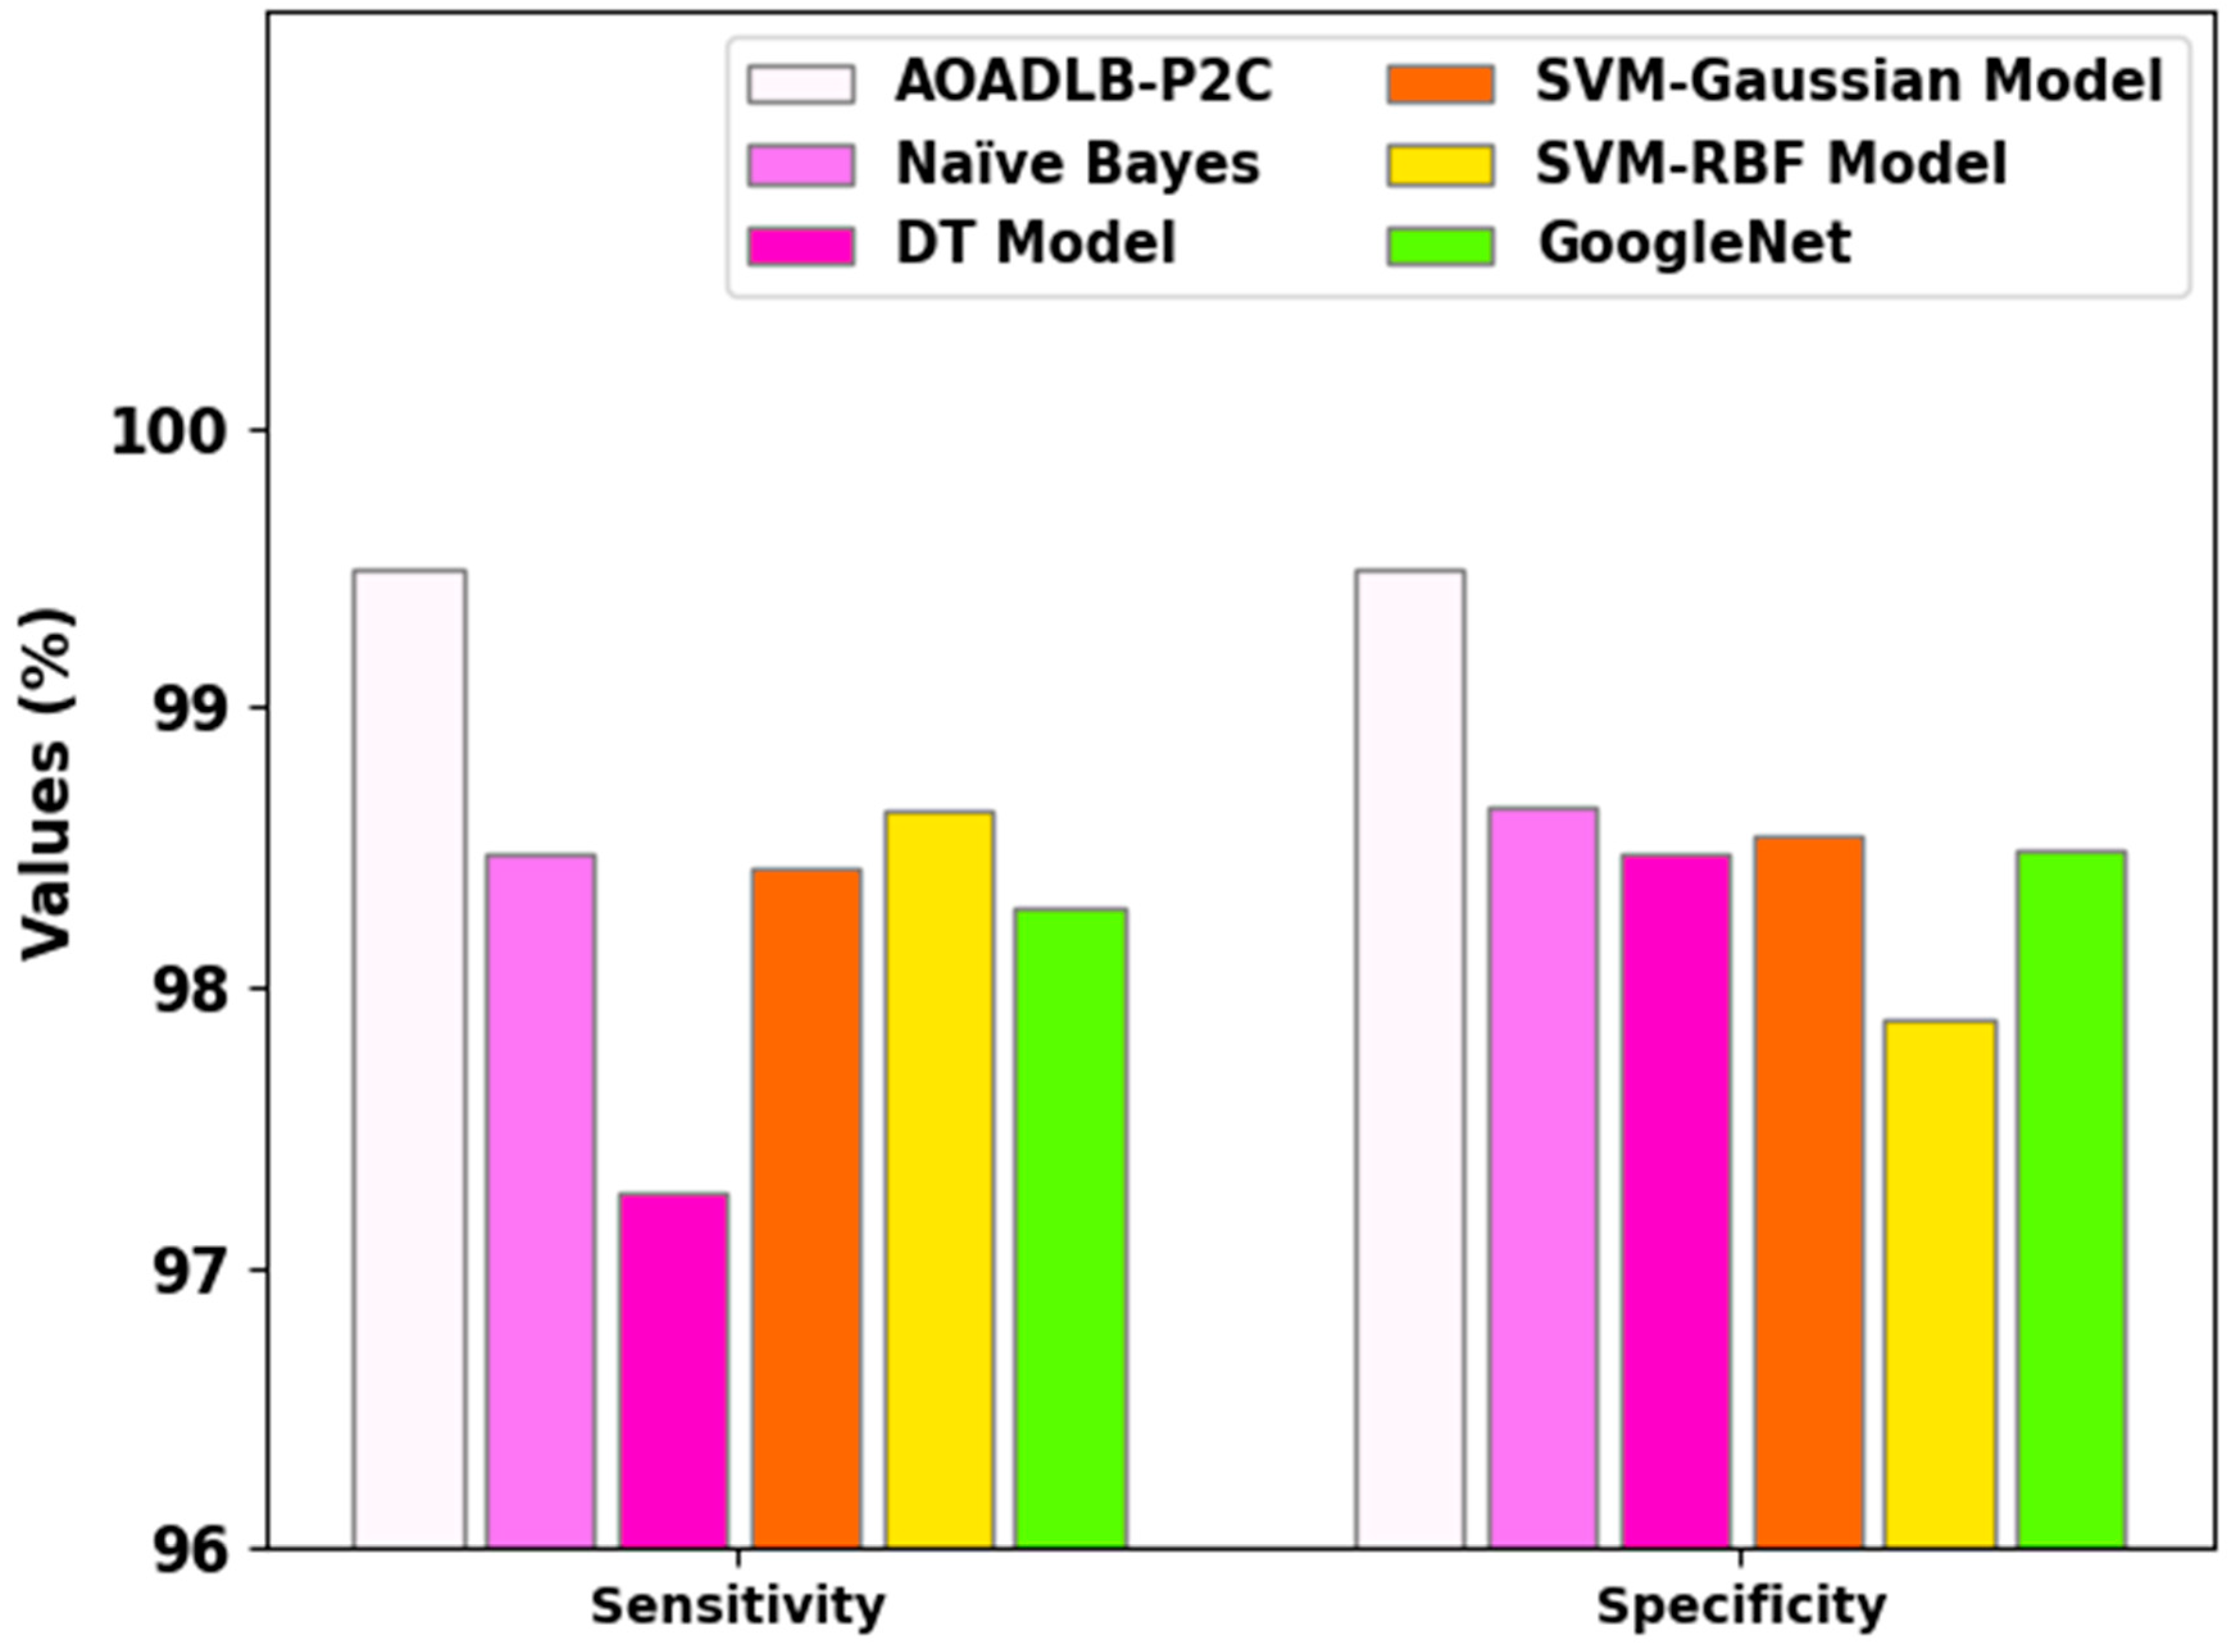
| Methods | Accuracy | Sensitivity | Specificity | F-Score |
|---|---|---|---|---|
| AOADLB-P2C | 99.50 | 99.50 | 99.50 | 99.50 |
| Naïve Bayes | 98.46 | 98.47 | 98.64 | 98.81 |
| DT Model | 97.29 | 97.26 | 98.47 | 98.83 |
| SVM-Gaussian Model | 98.36 | 98.43 | 98.54 | 97.91 |
| SVM-RBF Model | 98.12 | 98.63 | 97.89 | 98.52 |
| GoogleNet | 98.28 | 98.28 | 98.49 | 98.69 |
Disclaimer/Publisher’s Note: The statements, opinions and data contained in all publications are solely those of the individual author(s) and contributor(s) and not of MDPI and/or the editor(s). MDPI and/or the editor(s) disclaim responsibility for any injury to people or property resulting from any ideas, methods, instructions or products referred to in the content. |
© 2023 by the authors. Licensee MDPI, Basel, Switzerland. This article is an open access article distributed under the terms and conditions of the Creative Commons Attribution (CC BY) license (https://creativecommons.org/licenses/by/4.0/).
Share and Cite
Ragab, M.; Kateb, F.; El-Sawy, E.K.; Binyamin, S.S.; Al-Rabia, M.W.; A. Mansouri, R. Archimedes Optimization Algorithm with Deep Learning-Based Prostate Cancer Classification on Magnetic Resonance Imaging. Healthcare 2023, 11, 590. https://doi.org/10.3390/healthcare11040590
Ragab M, Kateb F, El-Sawy EK, Binyamin SS, Al-Rabia MW, A. Mansouri R. Archimedes Optimization Algorithm with Deep Learning-Based Prostate Cancer Classification on Magnetic Resonance Imaging. Healthcare. 2023; 11(4):590. https://doi.org/10.3390/healthcare11040590
Chicago/Turabian StyleRagab, Mahmoud, Faris Kateb, E. K. El-Sawy, Sami Saeed Binyamin, Mohammed W. Al-Rabia, and Rasha A. Mansouri. 2023. "Archimedes Optimization Algorithm with Deep Learning-Based Prostate Cancer Classification on Magnetic Resonance Imaging" Healthcare 11, no. 4: 590. https://doi.org/10.3390/healthcare11040590