
Measurement Property Evaluation of the Arabic Version of the Patient-Specific Functional Scale for Patients with Stroke
 , , , and
Abstract
:1. Introduction
2. Materials and Methods
2.1. Study Design
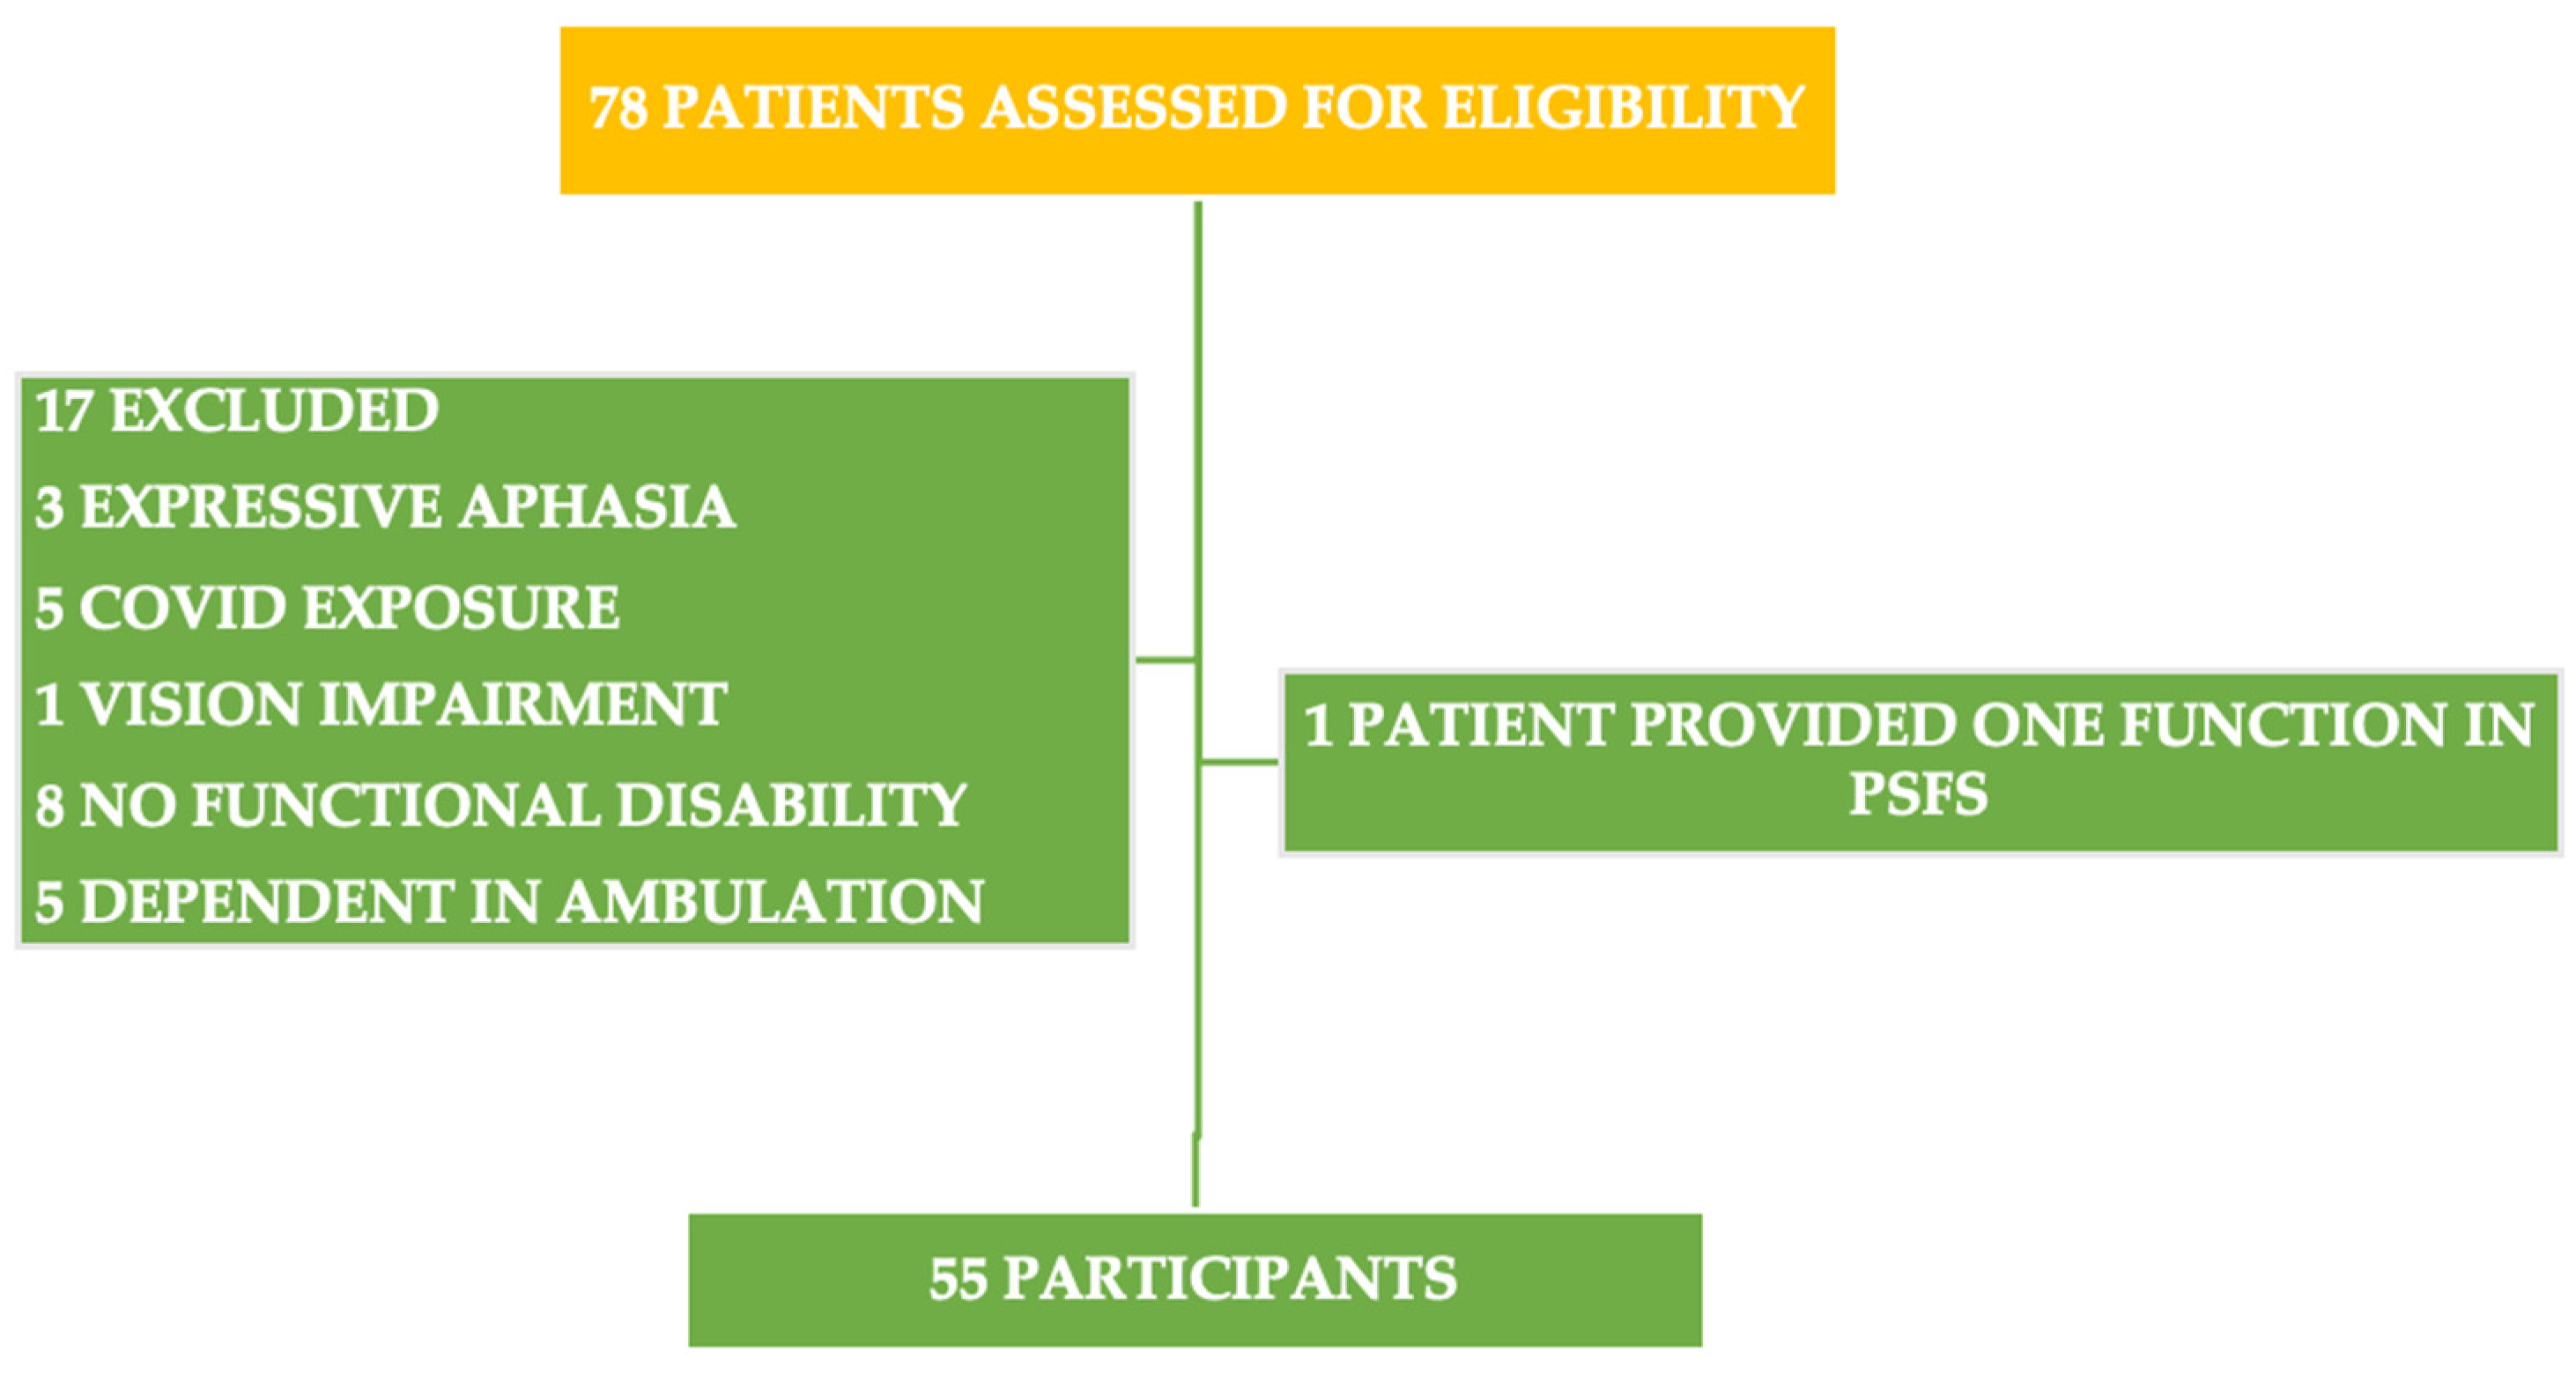
2.2. Setting and Participants
2.3. Procedure
2.3.1. The Patient-Specific Functional Scale (PSFS)
2.3.2. The Berg Balance Scale (BBS)
2.3.3. The Timed Up and Go (TUG) Test
2.3.4. The Functional Ambulation Categories
2.3.5. The Stroke-Specific Quality of Life Scale
2.3.6. The Global Rating of Change Scale
2.4. Statistical Analyses
3. Results
4. Discussion
Limitations and Futures Studies
5. Conclusions
Author Contributions
Funding
Institutional Review Board Statement
Informed Consent Statement
Data Availability Statement
Acknowledgments
Conflicts of Interest
References
- Wood, T.; Nance, E. Disease-directed engineering for physiology-driven treatment interventions in neurological disorders. APL Bioeng. 2019, 3, 040901. [Google Scholar] [CrossRef] [Green Version]
- Wang, H.; Naghavi, M.; Allen, C.; Barber, R.; Bhutta, Z.; Carter, A. A systematic analysis for the Global Burden of Disease Study 2015. Lancet 2016, 388, 1459–1544. [Google Scholar] [CrossRef] [Green Version]
- Taylor, J.A.; Ivry, R.B. Cerebellar and prefrontal cortex contributions to adaptation, strategies, and reinforcement learning. Prog. Brain Res. 2014, 210, 217–253. [Google Scholar]
- Asirvatham, A.R.; Marwan, M.Z. Stroke in Saudi Arabia: A review of the recent literature. Pan Afr. Med. J. 2014, 17, 14. [Google Scholar]
- Feigin, V.L.; Roth, G.A.; Naghavi, M.; Parmar, P.; Krishnamurthi, R.; Chugh, S.; Mensah, G.A.; Norrving, B.; Shiue, I.; Ng, M. Global burden of stroke and risk factors in 188 countries, during 1990–2013: A systematic analysis for the Global Burden of Disease Study 2013. Lancet Neurol. 2016, 15, 913–924. [Google Scholar] [CrossRef] [Green Version]
- Benjamin, E.J.; Muntner, P.; Alonso, A.; Bittencourt, M.S.; Callaway, C.W.; Carson, A.P.; Chamberlain, A.M.; Chang, A.R.; Cheng, S.; Das, S.R. Heart disease and stroke statistics—2019 update: A report from the American Heart Association. Circulation 2019, 139, e56–e528. [Google Scholar] [CrossRef] [PubMed]
- Winstein, C.J.; Stein, J.; Arena, R.; Bates, B.; Cherney, L.R.; Cramer, S.C.; Deruyter, F.; Eng, J.J.; Fisher, B.; Harvey, R.L. Guidelines for adult stroke rehabilitation and recovery: A guideline for healthcare professionals from the American Heart Association/American Stroke Association. Stroke 2016, 47, e98–e169. [Google Scholar] [CrossRef] [PubMed]
- Veerbeek, J.M.; van Wegen, E.; van Peppen, R.; van der Wees, P.J.; Hendriks, E.; Rietberg, M.; Kwakkel, G. What is the evidence for physical therapy poststroke? A systematic review and meta-analysis. PLoS ONE 2014, 9, e87987. [Google Scholar] [CrossRef] [PubMed] [Green Version]
- Moore, J.L.; Potter, K.; Blankshain, K.; Kaplan, S.L.; O’Dwyer, L.C.; Sullivan, J.E. A core set of outcome measures for adults with neurologic conditions undergoing rehabilitation: A clinical practice guideline. J. Neurol. Phys. Ther. 2018, 42, 174. [Google Scholar] [CrossRef]
- Kyte, D.; Calvert, M.; Van der Wees, P.; Ten Hove, R.; Tolan, S.; Hill, J. An introduction to patient-reported outcome measures (PROMs) in physiotherapy. Physiotherapy 2015, 101, 119–125. [Google Scholar] [CrossRef] [PubMed] [Green Version]
- Reeves, M.; Lisabeth, L.; Williams, L.; Katzan, I.; Kapral, M.; Deutsch, A.; Prvu-Bettger, J. Patient-reported outcome measures (PROMs) for acute stroke: Rationale, methods and future directions. Stroke 2018, 49, 1549–1556. [Google Scholar] [CrossRef] [PubMed]
- Frank, L.; Basch, E.; Selby, J.V.; Institute, P.-C.O.R. The PCORI perspective on patient-centered outcomes research. Jama 2014, 312, 1513–1514. [Google Scholar] [CrossRef] [Green Version]
- Stratford, P.; Gill, C.; Westaway, M.; Binkley, J. Assessing disability and change on individual patients: A report of a patient specific measure. Physiother. Can. 1995, 47, 258–263. [Google Scholar] [CrossRef]
- Angelozzi, M.; Madama, M.; Corsica, C.; Calvisi, V.; Properzi, G.; McCaw, S.T.; Cacchio, A. Rate of force development as an adjunctive outcome measure for return-to-sport decisions after anterior cruciate ligament reconstruction. J. Orthop. Sport. Phys. Ther. 2012, 42, 772–780. [Google Scholar] [CrossRef] [PubMed]
- Mann, M.; Musabyemariya, I.; Harding, L.; Braxley, B. Using patient-reported outcome measures to promote patient-centered practice: Building capacity among pediatric physiotherapists in Rwanda. Glob. Health: Sci. Pract. 2020, 8, 596–605. [Google Scholar] [CrossRef]
- Pathak, A.; Wilson, R.; Sharma, S.; Pryymachenko, Y.; Ribeiro, D.C.; Chua, J.; Abbott, J.H. Measurement Properties of the Patient-Specific Functional Scale and Its Current Uses: An Updated Systematic Review of 57 Studies Using COSMIN Guidelines. J. Orthop. Sport. Phys. Ther. 2022, 52, 262–275. [Google Scholar] [CrossRef]
- Alnahdi, A.H.; Murtada, B.A.; Zawawi, A.T.; Omar, M.T.; Alsobayel, H.I. Cross-cultural adaptation and measurement properties of the Arabic version of the Patient-Specific Functional Scale in patients with lower extremity musculoskeletal disorders. Disabil. Rehabil. 2022, 44, 4104–4110. [Google Scholar] [CrossRef]
- Horn, K.K.; Jennings, S.; Richardson, G.; Van Vliet, D.; Hefford, C.; Abbott, J.H. The patient-specific functional scale: Psychometrics, clinimetrics, and application as a clinical outcome measure. J. Orthop. Sport. Phys. Ther. 2012, 42, 30–42. [Google Scholar] [CrossRef] [Green Version]
- Heldmann, P.; Hummel, S.; Bauknecht, L.; Bauer, J.M.; Werner, C. Construct Validity, Test-Retest Reliability, Sensitivity to Change, and Feasibility of the Patient-Specific Functional Scale in Acutely Hospitalized Older Patients With and Without Cognitive Impairment. J. Geriatr. Phys. Ther. 2022, 45, 134–144. [Google Scholar] [CrossRef]
- Bohannon, R.W.; Nair, P.; Green, M. Feasibility and informativeness of the Patient-Specific Functional Scale with patients with Parkinson’s disease. Physiother. Theory Pract. 2019, 36, 1241–1244. [Google Scholar] [CrossRef]
- Evensen, J.; Soberg, H.L.; Sveen, U.; Hestad, K.A.; Bronken, B.A. The Applicability of the Patient-Specific Functional Scale (PSFS) in Rehabilitation for Patients with Acquired Brain Injury (ABI)–A Cohort Study. J. Multidiscip. Healthc. 2020, 13, 1121–1132. [Google Scholar] [CrossRef]
- Berg, K.; Wood-Dauphine, S.; Williams, J.; Gayton, D. Measuring balance in the elderly: Preliminary development of an instrument. Physiother. Can. 1989, 41, 304–311. [Google Scholar] [CrossRef]
- Berg, K.; SL, W.-D.; Williams, J.I.; Maki, B. Measuring balance in the elderly: Validation of an instrument. Can. J. Public Health 1992, 83, S7–S11. [Google Scholar] [PubMed]
- Reynolds, C.R. Neuropsychological assessment and the habilitation of learning: Considerations in the search for the aptitude x treatment interaction. Sch. Psychol. Rev. 1981, 10, 343–349. [Google Scholar] [CrossRef]
- Duncan, P.W.; Bode, R.K.; Lai, S.M.; Perera, S.; Glycine Antagonist in Neuroprotection Americans Investigators. Rasch analysis of a new stroke-specific outcome scale: The Stroke Impact Scale. Arch. Phys. Med. Rehabil. 2003, 84, 950–963. [Google Scholar] [CrossRef] [PubMed]
- Hiengkaew, V.; Jitaree, K.; Chaiyawat, P. Minimal detectable changes of the Berg Balance Scale, Fugl-Meyer Assessment Scale, Timed “Up & Go” Test, gait speeds, and 2-minute walk test in individuals with chronic stroke with different degrees of ankle plantarflexor tone. Arch. Phys. Med. Rehabil. 2012, 93, 1201–1208. [Google Scholar]
- Bohannon, R.W. Reference values for the timed up and go test: A descriptive meta-analysis. J. Geriatr. Phys. Ther. 2006, 29, 64–68. [Google Scholar] [CrossRef] [Green Version]
- Aluko, B.T. Building urban local governance fiscal autonomy through property taxation financing option. Int. J. Strateg. Prop. Manag. 2005, 9, 201–214. [Google Scholar] [CrossRef] [Green Version]
- Flansbjer, U.-B.; Holmbäck, A.M.; Downham, D.; Patten, C.; Lexell, J. Reliability of gait performance tests in men and women with hemiparesis after stroke. J. Rehabil. Med. 2005, 37, 75–82. [Google Scholar]
- Roosink, M.; Renzenbrink, G.J.; Buitenweg, J.R.; Van Dongen, R.T.; Geurts, A.C.; IJzerman, M.J. Persistent shoulder pain in the first 6 months after stroke: Results of a prospective cohort study. Arch. Phys. Med. Rehabil. 2011, 92, 1139–1145. [Google Scholar] [CrossRef]
- Holden, M.K.; Gill, K.M.; Magliozzi, M.R. Gait assessment for neurologically impaired patients: Standards for outcome assessment. Phys. Ther. 1986, 66, 1530–1539. [Google Scholar] [CrossRef] [PubMed]
- Mehrholz, J.; Wagner, K.; Rutte, K.; Meiβner, D.; Pohl, M. Predictive validity and responsiveness of the functional ambulation category in hemiparetic patients after stroke. Arch. Phys. Med. Rehabil. 2007, 88, 1314–1319. [Google Scholar] [CrossRef] [PubMed]
- Sallam, S.A.; Al-Khamis, F.A.; Muaidi, Q.I.; Abdulla, F.A. Translation and validation of the stroke specific quality of life scale into Arabic. NeuroRehabilitation 2019, 44, 283–293. [Google Scholar] [CrossRef]
- Morris, G.L.; Mueller, W.M. Long-term treatment with vagus nerve stimulation in patients with refractory epilepsy. Neurology 1999, 53, 1731. [Google Scholar] [CrossRef] [PubMed]
- Kamper, S.J.; Maher, C.G.; Mackay, G. Global rating of change scales: A review of strengths and weaknesses and considerations for design. J. Man. Manip. Ther. 2009, 17, 163–170. [Google Scholar] [CrossRef] [PubMed] [Green Version]
- Jaeschke, R.; Singer, J.; Guyatt, G.H. Measurement of health status: Ascertaining the minimal clinically important difference. Control. Clin. Trials 1989, 10, 407–415. [Google Scholar] [CrossRef] [PubMed]
- Donders, A.R.T.; Van Der Heijden, G.J.; Stijnen, T.; Moons, K.G. A gentle introduction to imputation of missing values. J. Clin. Epidemiol. 2006, 59, 1087–1091. [Google Scholar] [CrossRef] [PubMed]
- Koo, T.K.; Li, M.Y. A guideline of selecting and reporting intraclass correlation coefficients for reliability research. J. Chiropr. Med. 2016, 15, 155–163. [Google Scholar] [CrossRef] [Green Version]
- McHorney, C.A.; Tarlov, A.R. Individual-patient monitoring in clinical practice: Are available health status surveys adequate? Qual. Life Res. 1995, 4, 293–307. [Google Scholar] [CrossRef]
- Khamis, H. Measures of association: How to choose? J. Diagn. Med. Sonogr. 2008, 24, 155–162. [Google Scholar] [CrossRef] [Green Version]
- Cohen, J. Statistical power analysis. Curr. Dir. Psychol. Sci. 1992, 1, 98–101. [Google Scholar] [CrossRef]
- Allali, G.; Launay, C.P.; Blumen, H.M.; Callisaya, M.L.; De Cock, A.-M.; Kressig, R.W.; Srikanth, V.; Steinmetz, J.-P.; Verghese, J.; Beauchet, O. Falls, cognitive impairment, and gait performance: Results from the GOOD initiative. J. Am. Med. Dir. Assoc. 2017, 18, 335–340. [Google Scholar] [CrossRef] [PubMed] [Green Version]
- Phan, H.T.; Blizzard, C.L.; Reeves, M.J.; Thrift, A.G.; Cadilhac, D.A.; Sturm, J.; Heeley, E.; Otahal, P.; Rothwell, P.; Anderson, C.S. Sex differences in long-term quality of life among survivors after stroke in the INSTRUCT. Stroke 2019, 50, 2299–2306. [Google Scholar] [CrossRef]
- Tsao, C.W.; Aday, A.W.; Almarzooq, Z.I.; Alonso, A.; Beaton, A.Z.; Bittencourt, M.S.; Boehme, A.K.; Buxton, A.E.; Carson, A.P.; Commodore-Mensah, Y. Heart disease and stroke statistics—2022 update: A report from the American Heart Association. Circulation 2022, 145, e153–e639. [Google Scholar] [CrossRef]
- Jørgensen, H.S.; Nakayama, H.; Raaschou, H.O.; Olsen, T.S. Stroke: Neurologic and functional recovery the Copenhagen Stroke Study. Phys. Med. Rehabil. Clin. North Am. 1999, 10, 887–906. [Google Scholar] [CrossRef]
- Hankey, G.; Spiesser, J.; Hakimi, Z.; Bego, G.; Carita, P.; Gabriel, S. Rate, degree, and predictors of recovery from disability following ischemic stroke. Neurology 2007, 68, 1583–1587. [Google Scholar] [CrossRef] [PubMed]
- Hurford, R.; Charidimou, A.; Fox, Z.; Cipolotti, L.; Werring, D.J. Domain-specific trends in cognitive impairment after acute ischaemic stroke. J. Neurol. 2013, 260, 237–241. [Google Scholar] [CrossRef]
- Nasreddine, Z.S.; Phillips, N.A.; Bédirian, V.; Charbonneau, S.; Whitehead, V.; Collin, I.; Cummings, J.L.; Chertkow, H. The Montreal Cognitive Assessment, MoCA: A brief screening tool for mild cognitive impairment. J. Am. Geriatr. Soc. 2005, 53, 695–699. [Google Scholar] [CrossRef]
- Folstein, M.F.; Folstein, S.E.; McHugh, P.R. “Mini-mental state”: A practical method for grading the cognitive state of patients for the clinician. J. Psychiatr. Res. 1975, 12, 189–198. [Google Scholar] [CrossRef]
- Blumenfeld, H. Neuroanatomy through Clinical Cases; Oxford University Press: Oxford, UK, 2002. [Google Scholar]
- Mokkink, L.B.; Terwee, C.B.; Patrick, D.L.; Alonso, J.; Stratford, P.W.; Knol, D.L.; Bouter, L.M.; de Vet, H.C. The COSMIN study reached international consensus on taxonomy, terminology, and definitions of measurement properties for health-related patient-reported outcomes. J. Clin. Epidemiol. 2010, 63, 737–745. [Google Scholar] [CrossRef] [Green Version]
- Beattie, P. Measurement of health outcomes in the clinical setting: Applications to physiotherapy. Physiother. Theory Pract. 2001, 17, 173–185. [Google Scholar] [CrossRef]
- Haley, S.M.; Fragala-Pinkham, M.A. Interpreting change scores of tests and measures used in physical therapy. Phys. Ther. 2006, 86, 735–743. [Google Scholar] [CrossRef] [Green Version]
- Schultz-Larsen, K.; Lomholt, R.K.; Kreiner, S. Mini-Mental Status Examination: A short form of MMSE was as accurate as the original MMSE in predicting dementia. J. Clin. Epidemiol. 2007, 60, 260–267. [Google Scholar] [CrossRef] [PubMed]
- Nazari, G.; Bobos, P.; Lu, Z.; Reischl, S.; MacDermid, J.C. Psychometric properties of Patient-Specific Functional Scale in patients with upper extremity disorders. A systematic review. Disabil. Rehabil. 2022, 44, 2958–2967. [Google Scholar] [CrossRef] [PubMed]


| Variable | Mean (SD) or N (%) |
|---|---|
| Age | 62.3 (11.3) |
| Gender | |
| Male | 50 (90.9%) |
| Female | 5 (9.1%) |
| Hemiparetic side | |
| Right | 26 (47.3%) |
| Left | 29 (52.7%) |
| Type of stroke | |
| Ischemic | 53 (96.4%) |
| Hemorrhagic | 2 (3.6%) |
| Stroke stages | |
| Subacute (early/late) | 26 (47.3) |
| Chronic | 29 (52.7%) |
| Diagnosis | |
| Basal ganglia stroke | 15 (27.3%) |
| Corona radiata stroke | 9 (16.4%) |
| Internal capsule stroke | 3 (5.5%) |
| Corpus callosum stroke | 1 (1.8%) |
| Thalamic stroke | 5 (9.1%) |
| Pontine stroke | 8 (14.5%) |
| Medullary stroke | 1 (1.8%) |
| MCA stroke | 7 (12.7%) |
| PCA stroke | 5 (9.1%) |
| ACA stroke | 1 (1.8%) |
| Dominant hand | |
| Right hand | 51 (92.7%) |
| Left hand | 4 (7.3%) |
| Variable | Median (Range) or N (%) |
|---|---|
| BBS a | 50 (19–56) |
| TUG b | 18 (9–146) |
| FAC c | |
| 0 | 0 (0%) |
| 1 | 8 (14.5%) |
| 2 | 7 (12.7%) |
| 3 | 4 (7.3%) |
| 4 | 13 (23.6%) |
| 5 | 23 (41.8%) |
| SSQOL-Ar d | 3.3 (1.3–4.9) |
| EnSQ e | 2 (1–5) |
| FaSQ f | 3 (1–5) |
| LaSQ g | 4.6 (1–5) |
| MoSQ h | 2.3 (1–5) |
| MSQ i | 4.2 (1–5) |
| PeSQ j | 3 (1–5) |
| SCSQ k | 3.2 (1–5) |
| SoSQ l | 2 (1–5) |
| ThSQ m | 4 (1–5) |
| ULFSQ n | 3 (1–5) |
| ViSQ o | 4.7 (1–5) |
| WoSQ p | 1 (1–5) |
| Variable | n * = 55 | n ** = 53 |
|---|---|---|
| PSFS a | ||
| DBT12 b median (range) | 5 (4–12), | 5 (4–12) |
| AT1 c median (range) | 3.8 (0.4–7.4) | 3.6 (0.4–7.4) |
| AT2 d median (range) | 3.4 (0.4–8) | 3.4 (0.4–8) |
| GROC e median (range) | 0 (−2–4) | 0 (−2–2) |
| Mean (SD) | Mean Difference (95%CI) | ICC2,1 a (95%CI) | SEM b | MDC95 c | |
|---|---|---|---|---|---|
| Test | 3.5 (±1.8) | −0.1 (−0.21–0.05) | 0.96 1 (0.94–0.98) p < 0.001 | 0.37 2 | 1.03 3 |
| Retest | 3.6 (±1.8) |
| Variable | R | p |
|---|---|---|
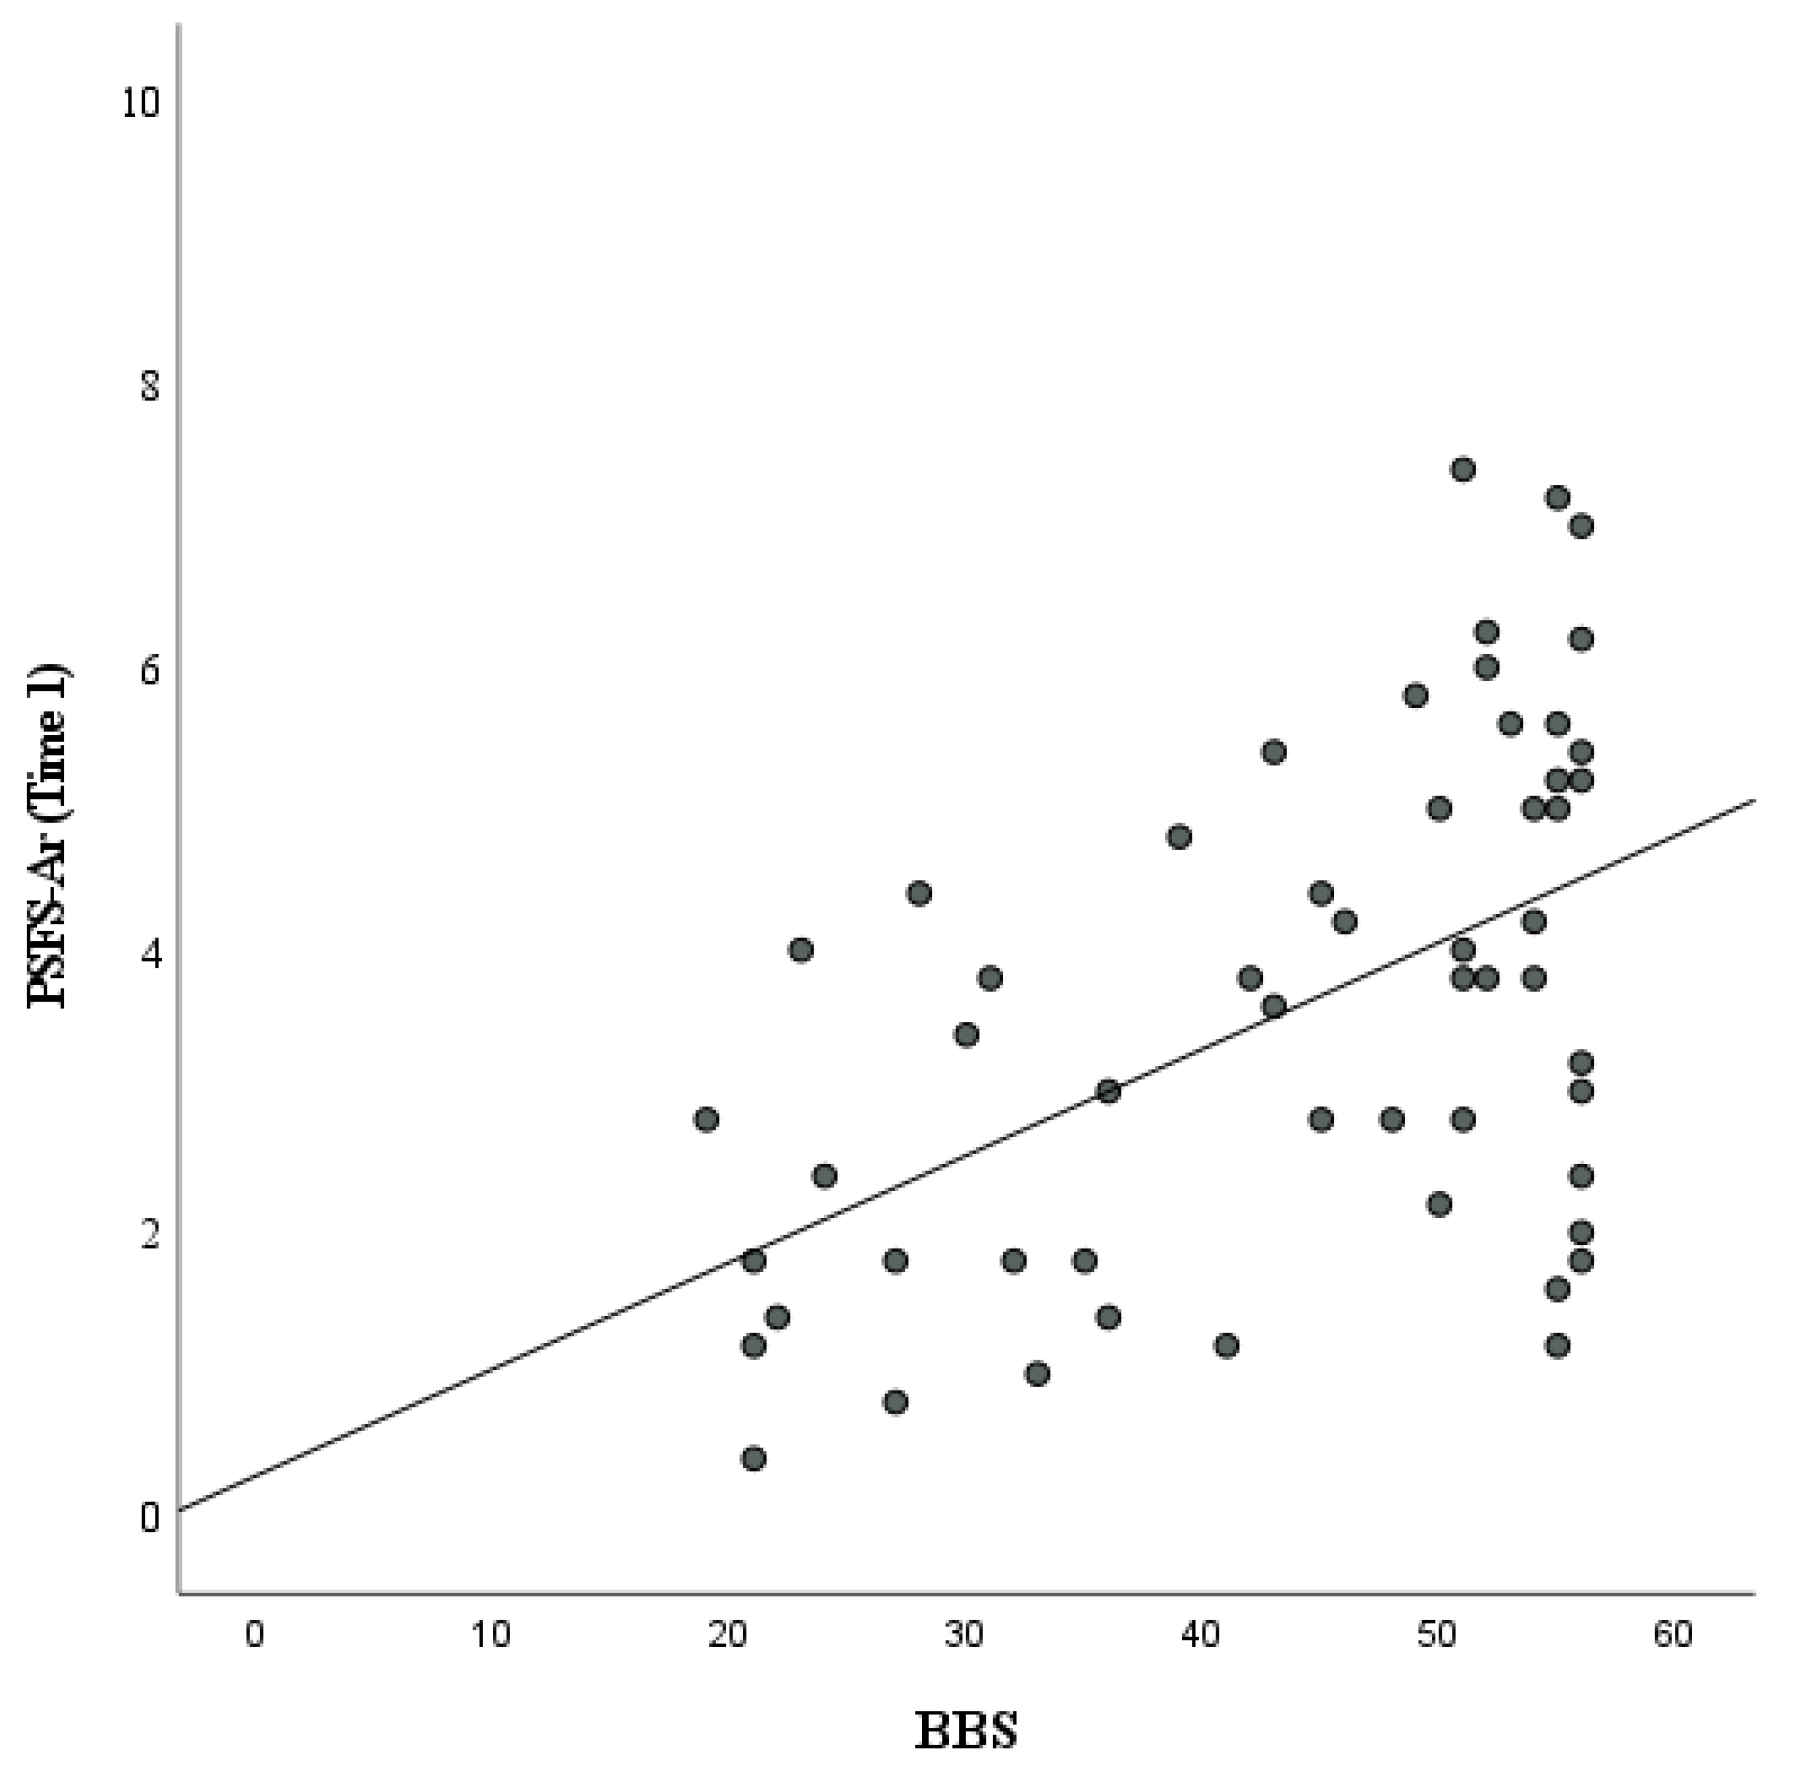
| BBS a,* | 0.45 | p < 0.001 |
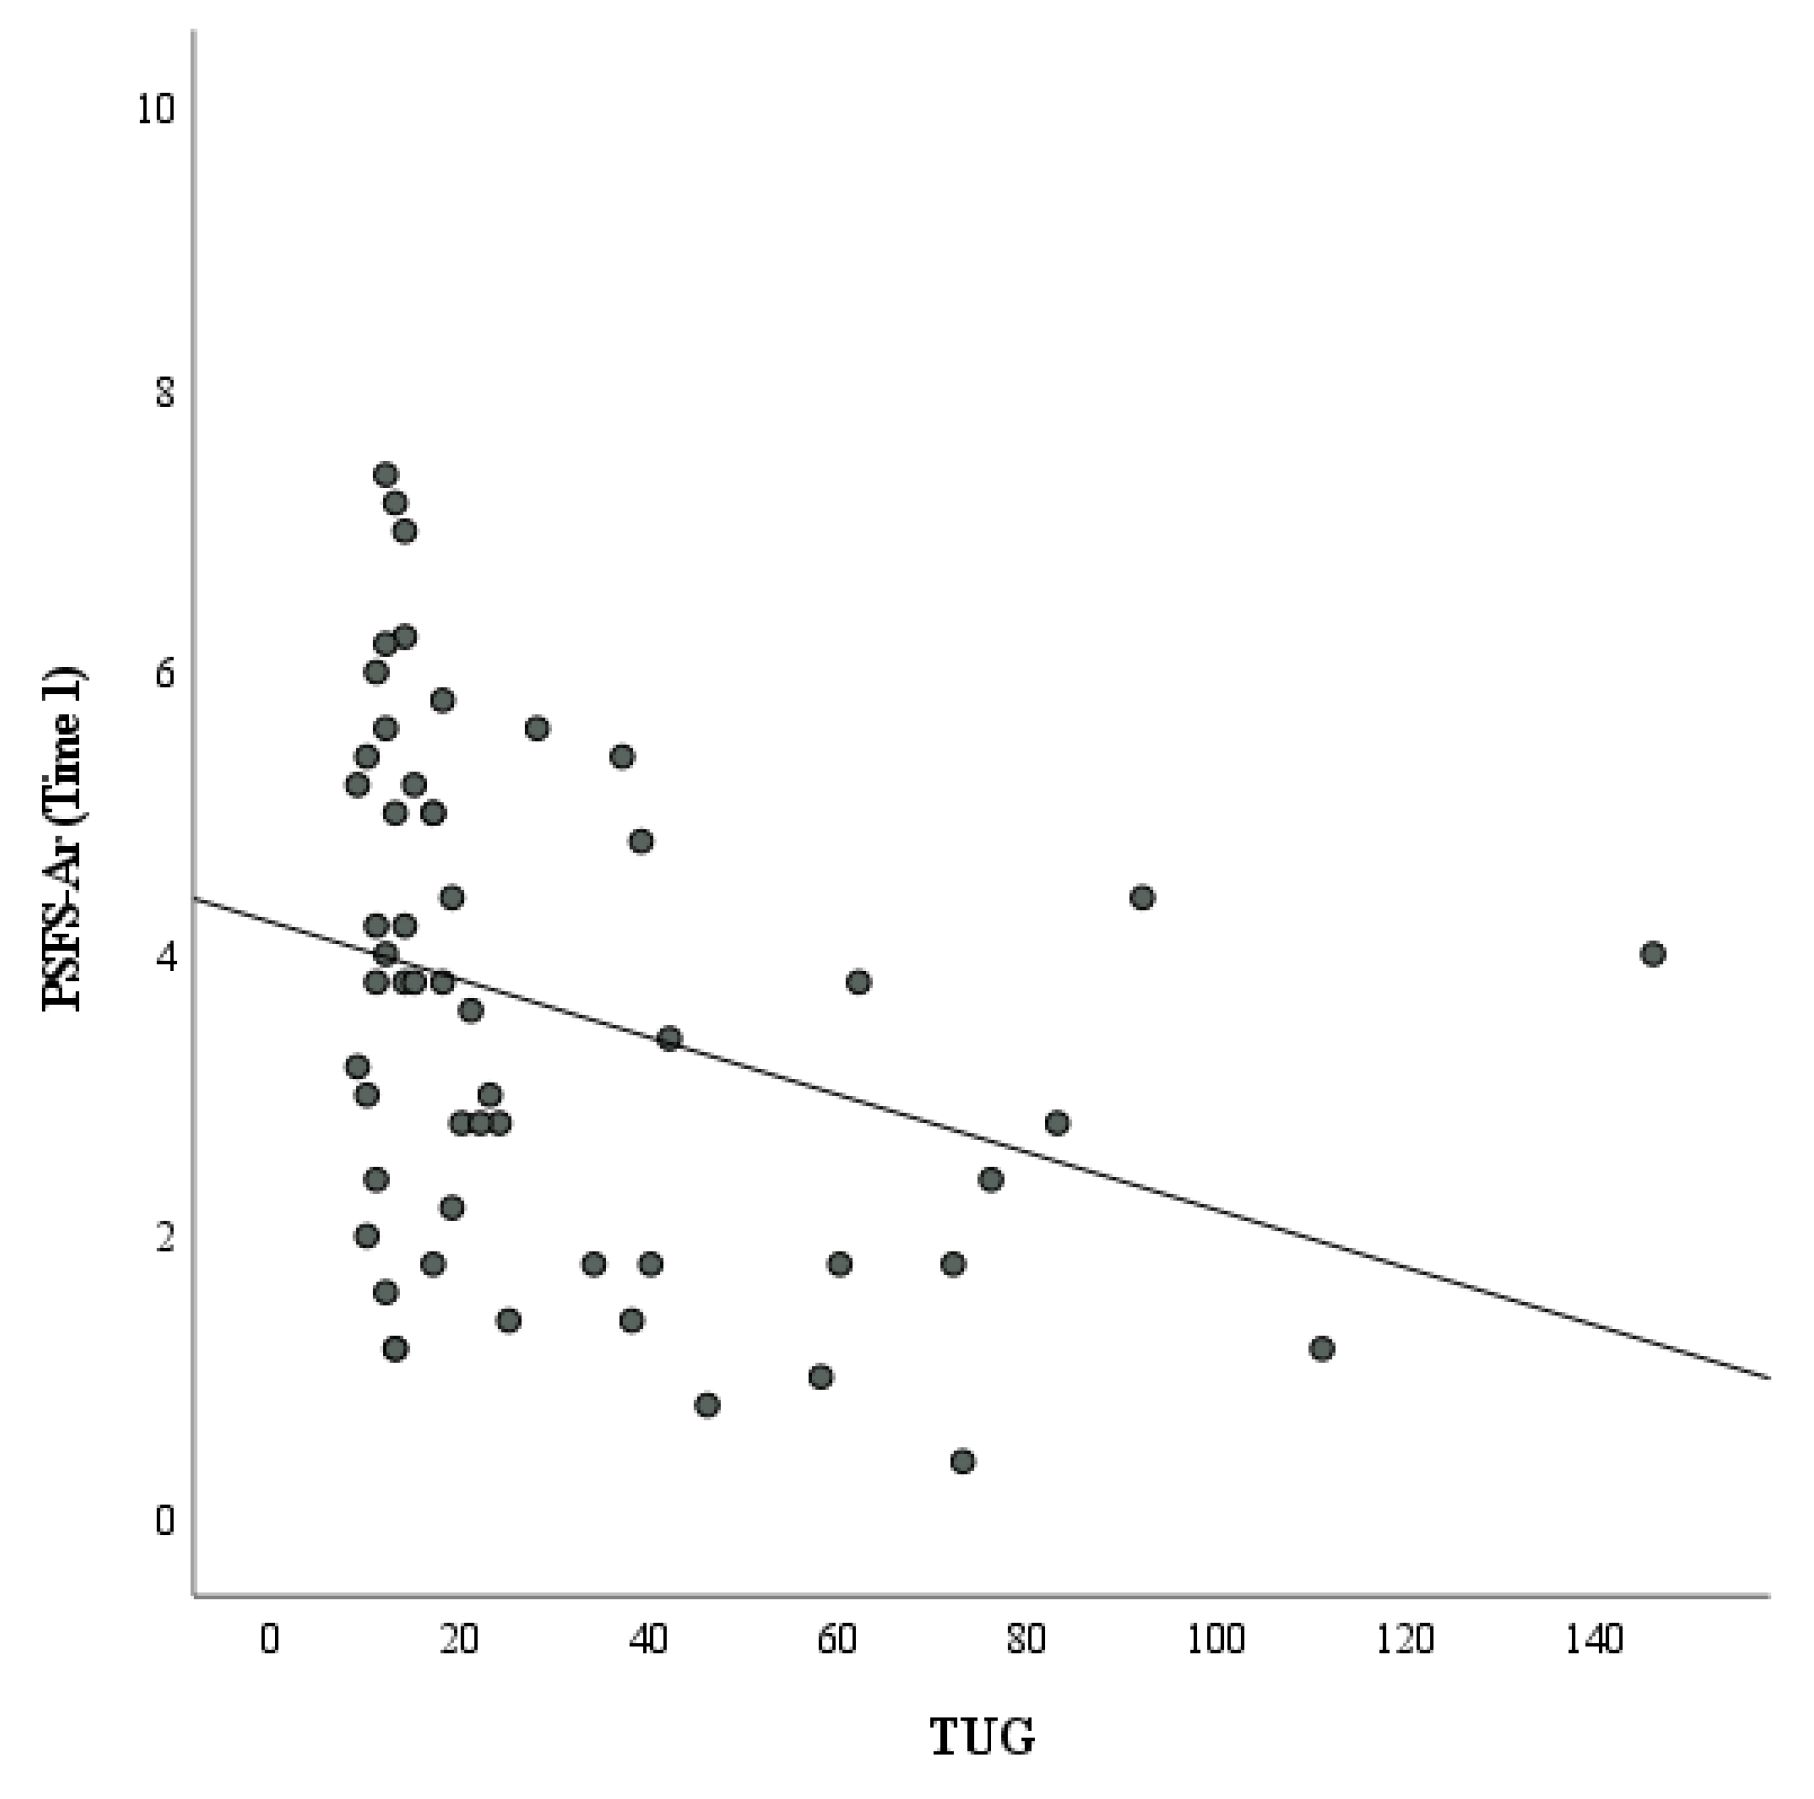
| TUG b,* | −0.39 | p = 0.004 |
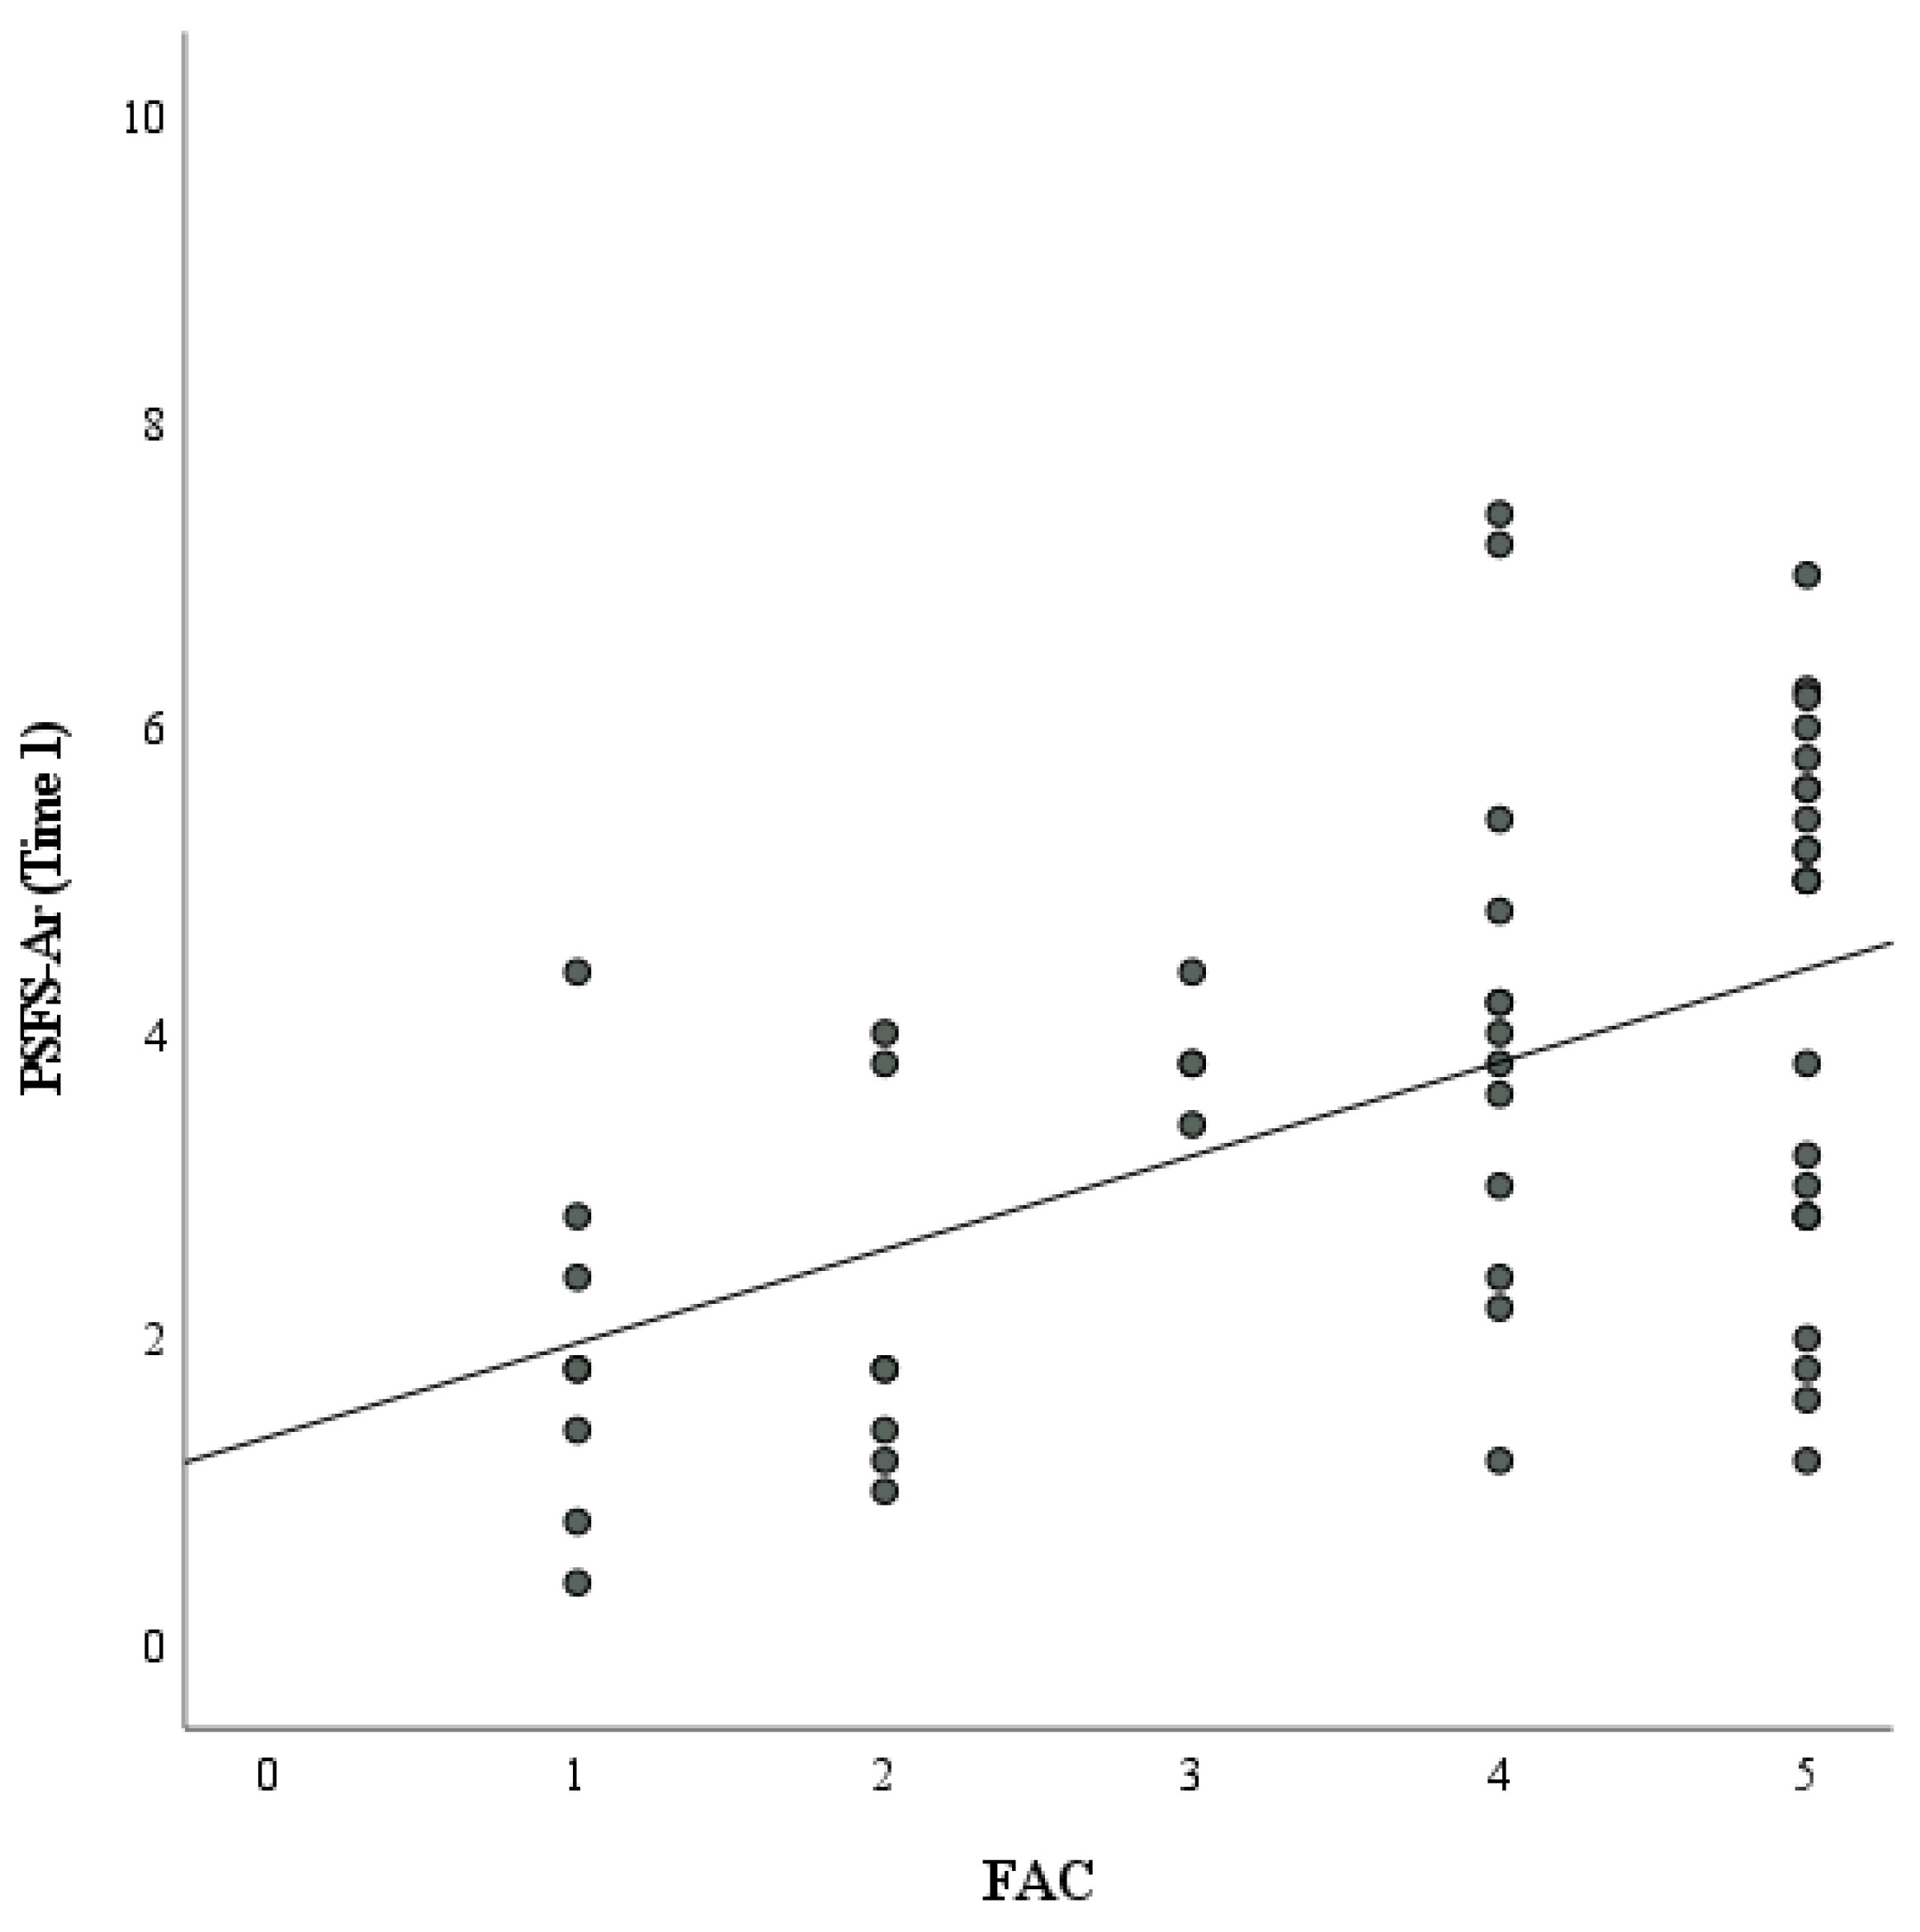
| FAC c,* | 0.47 | p < 0.001 |
| SSQOL-Ar d | ||
| Mobility domain * | 0.49 | p < 0.001 |
| Mood domain * | 0.16 | p = 0.2 |
| Self-care domain * | 0.5 | p < 0.001 |
| Upper limb function domin * | 0.43 | p = 0.001 |
Disclaimer/Publisher’s Note: The statements, opinions and data contained in all publications are solely those of the individual author(s) and contributor(s) and not of MDPI and/or the editor(s). MDPI and/or the editor(s) disclaim responsibility for any injury to people or property resulting from any ideas, methods, instructions or products referred to in the content. |
© 2023 by the authors. Licensee MDPI, Basel, Switzerland. This article is an open access article distributed under the terms and conditions of the Creative Commons Attribution (CC BY) license (https://creativecommons.org/licenses/by/4.0/).
Share and Cite
ALMohiza, M.A.; Khafaji, M.A.; Asiri, F.; Al-Heizan, M.O.; Alnahdi, A.H.; Reddy, R.S. Measurement Property Evaluation of the Arabic Version of the Patient-Specific Functional Scale for Patients with Stroke. Healthcare 2023, 11, 1642. https://doi.org/10.3390/healthcare11111642
ALMohiza MA, Khafaji MA, Asiri F, Al-Heizan MO, Alnahdi AH, Reddy RS. Measurement Property Evaluation of the Arabic Version of the Patient-Specific Functional Scale for Patients with Stroke. Healthcare. 2023; 11(11):1642. https://doi.org/10.3390/healthcare11111642
Chicago/Turabian StyleALMohiza, Mohammad A., Mohammed A. Khafaji, Faisal Asiri, Muhammad O. Al-Heizan, Ali H. Alnahdi, and Ravi Shankar Reddy. 2023. "Measurement Property Evaluation of the Arabic Version of the Patient-Specific Functional Scale for Patients with Stroke" Healthcare 11, no. 11: 1642. https://doi.org/10.3390/healthcare11111642