
Detection of Pneumonia from Chest X-ray Images Utilizing MobileNet Model

 , , , , and
Abstract
:1. Introduction
- In this research, a MobileNet model has been proposed to detect pneumonia. The model is simulated on two datasets having 5856 and 112,120 chest X-ray images.
- The performance of the proposed MobileNet model has been compared with ResNet50, ResNet152V2, DenseNet201, EfficientNet, Xception, VGG16, and DenseNet121 in terms of accuracy, precision, recall, F1-score, and the area under the curve (AUC).
- The proposed model has been simulated with different optimizers namely ADAM, ADADELTA, and SGD with different batch sizes and epochs of 16, 32, and 64.
2. Related Work
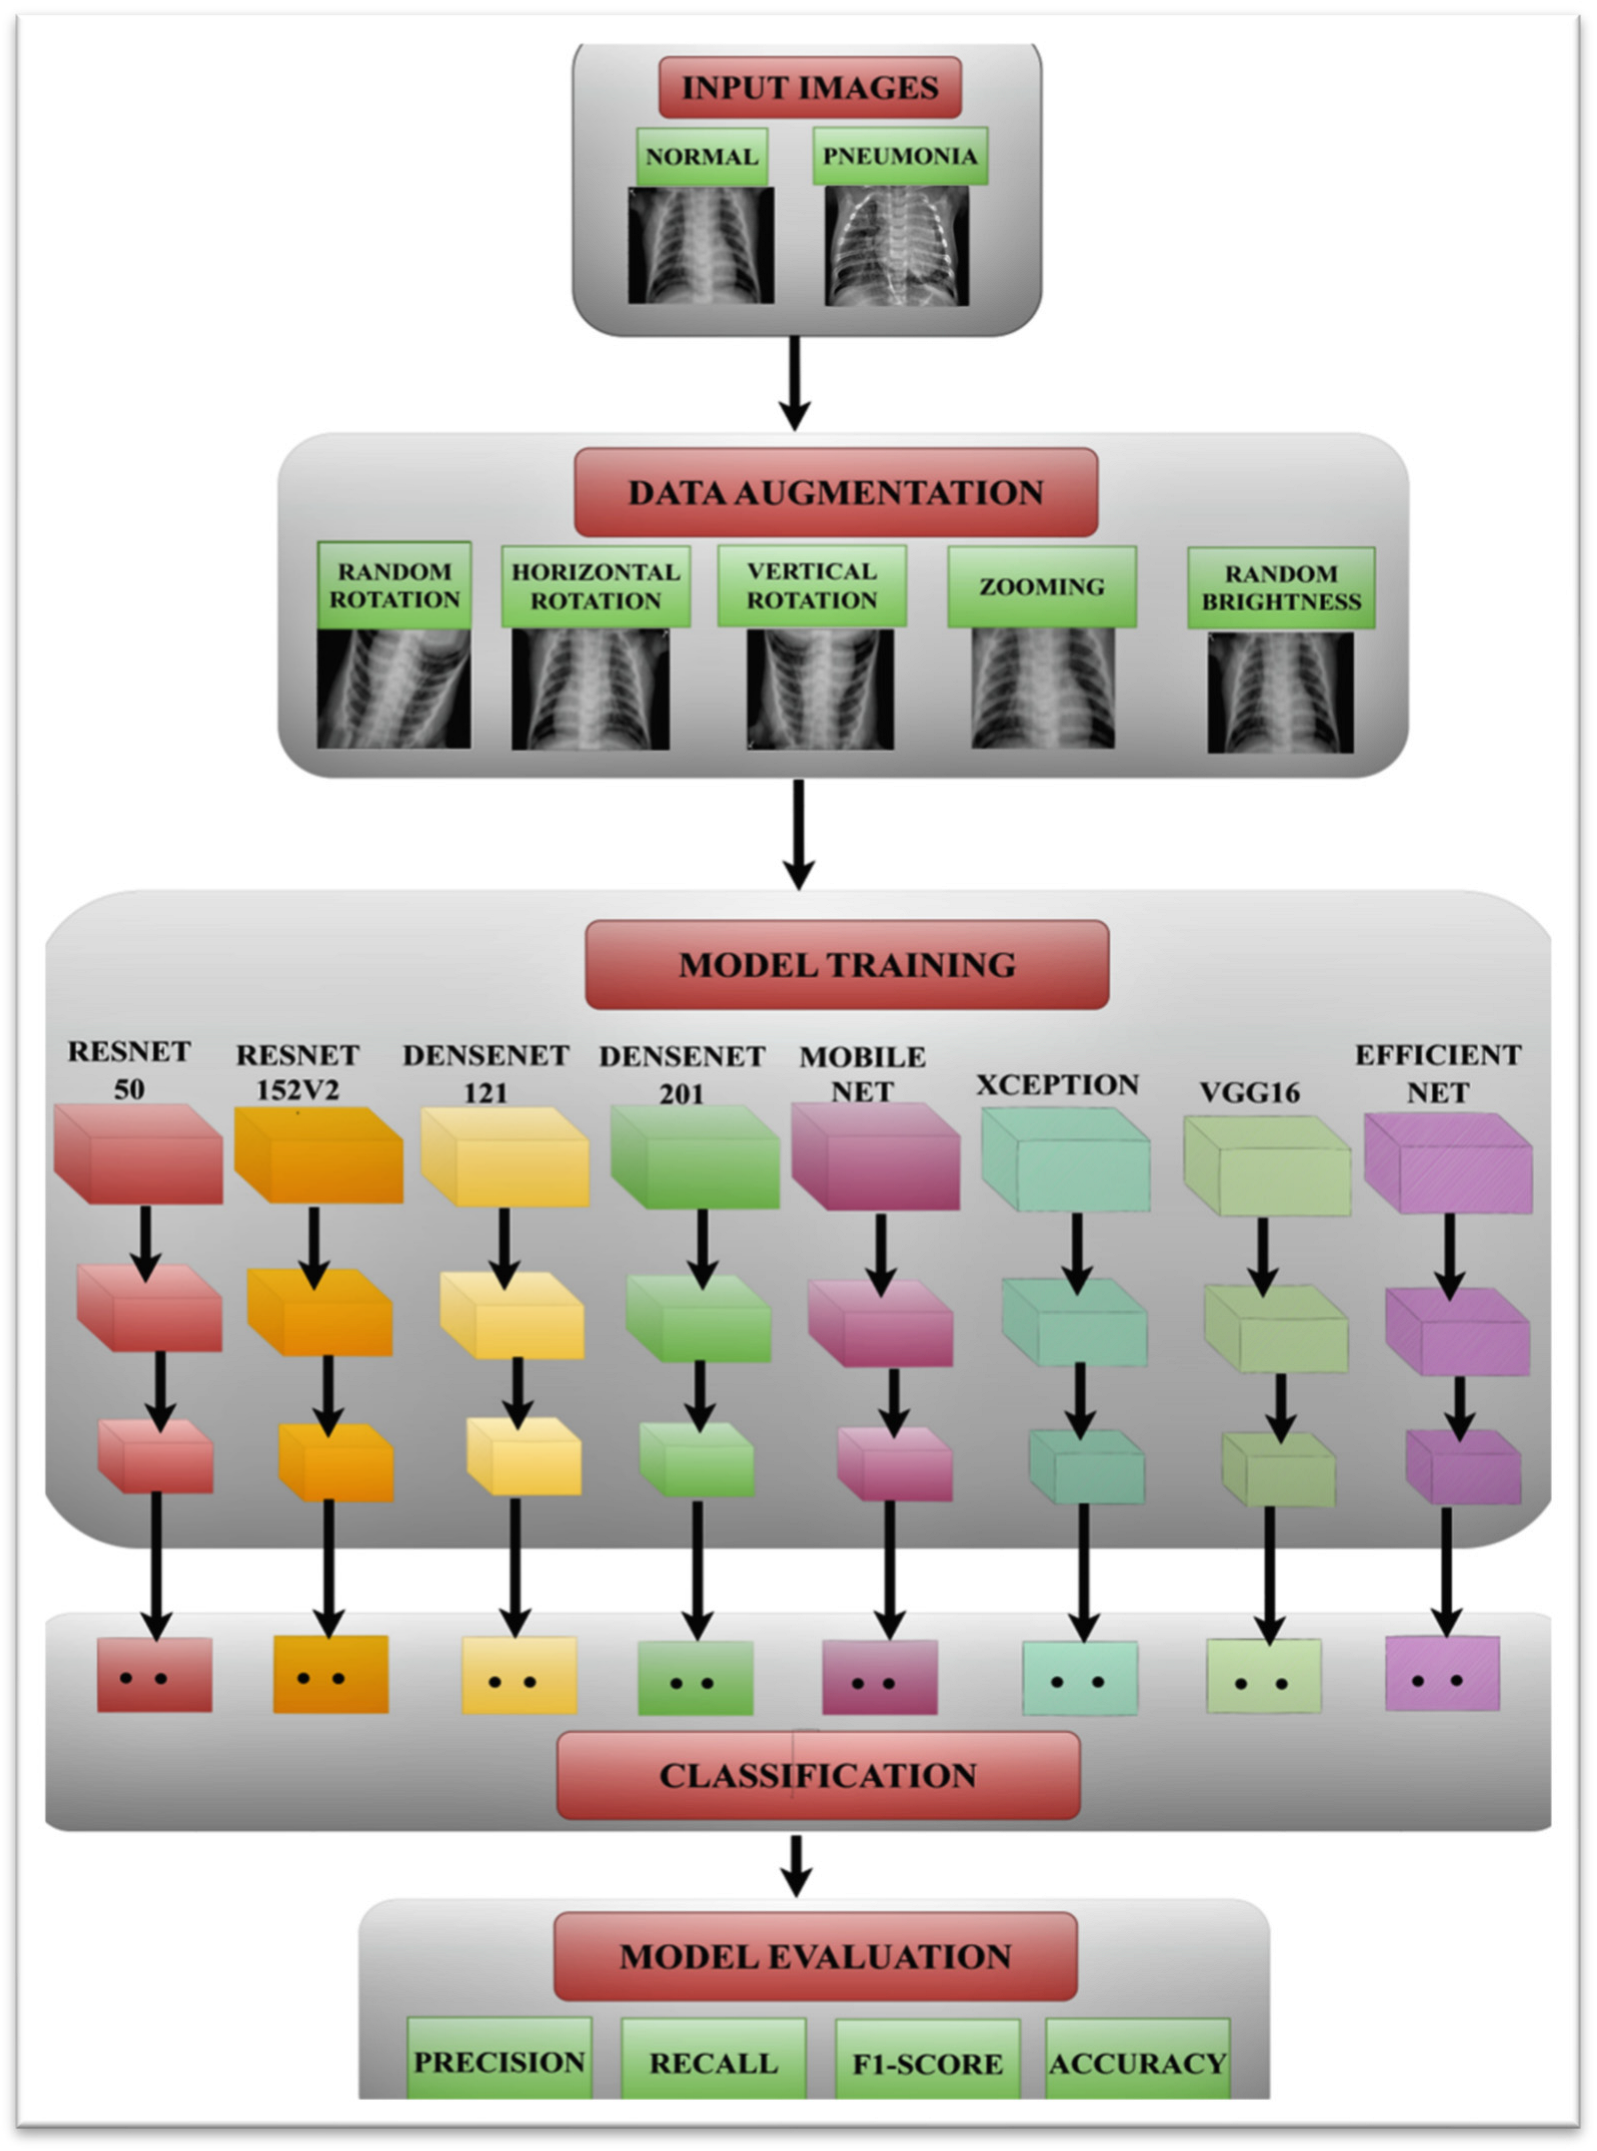
3. Proposed Methodology
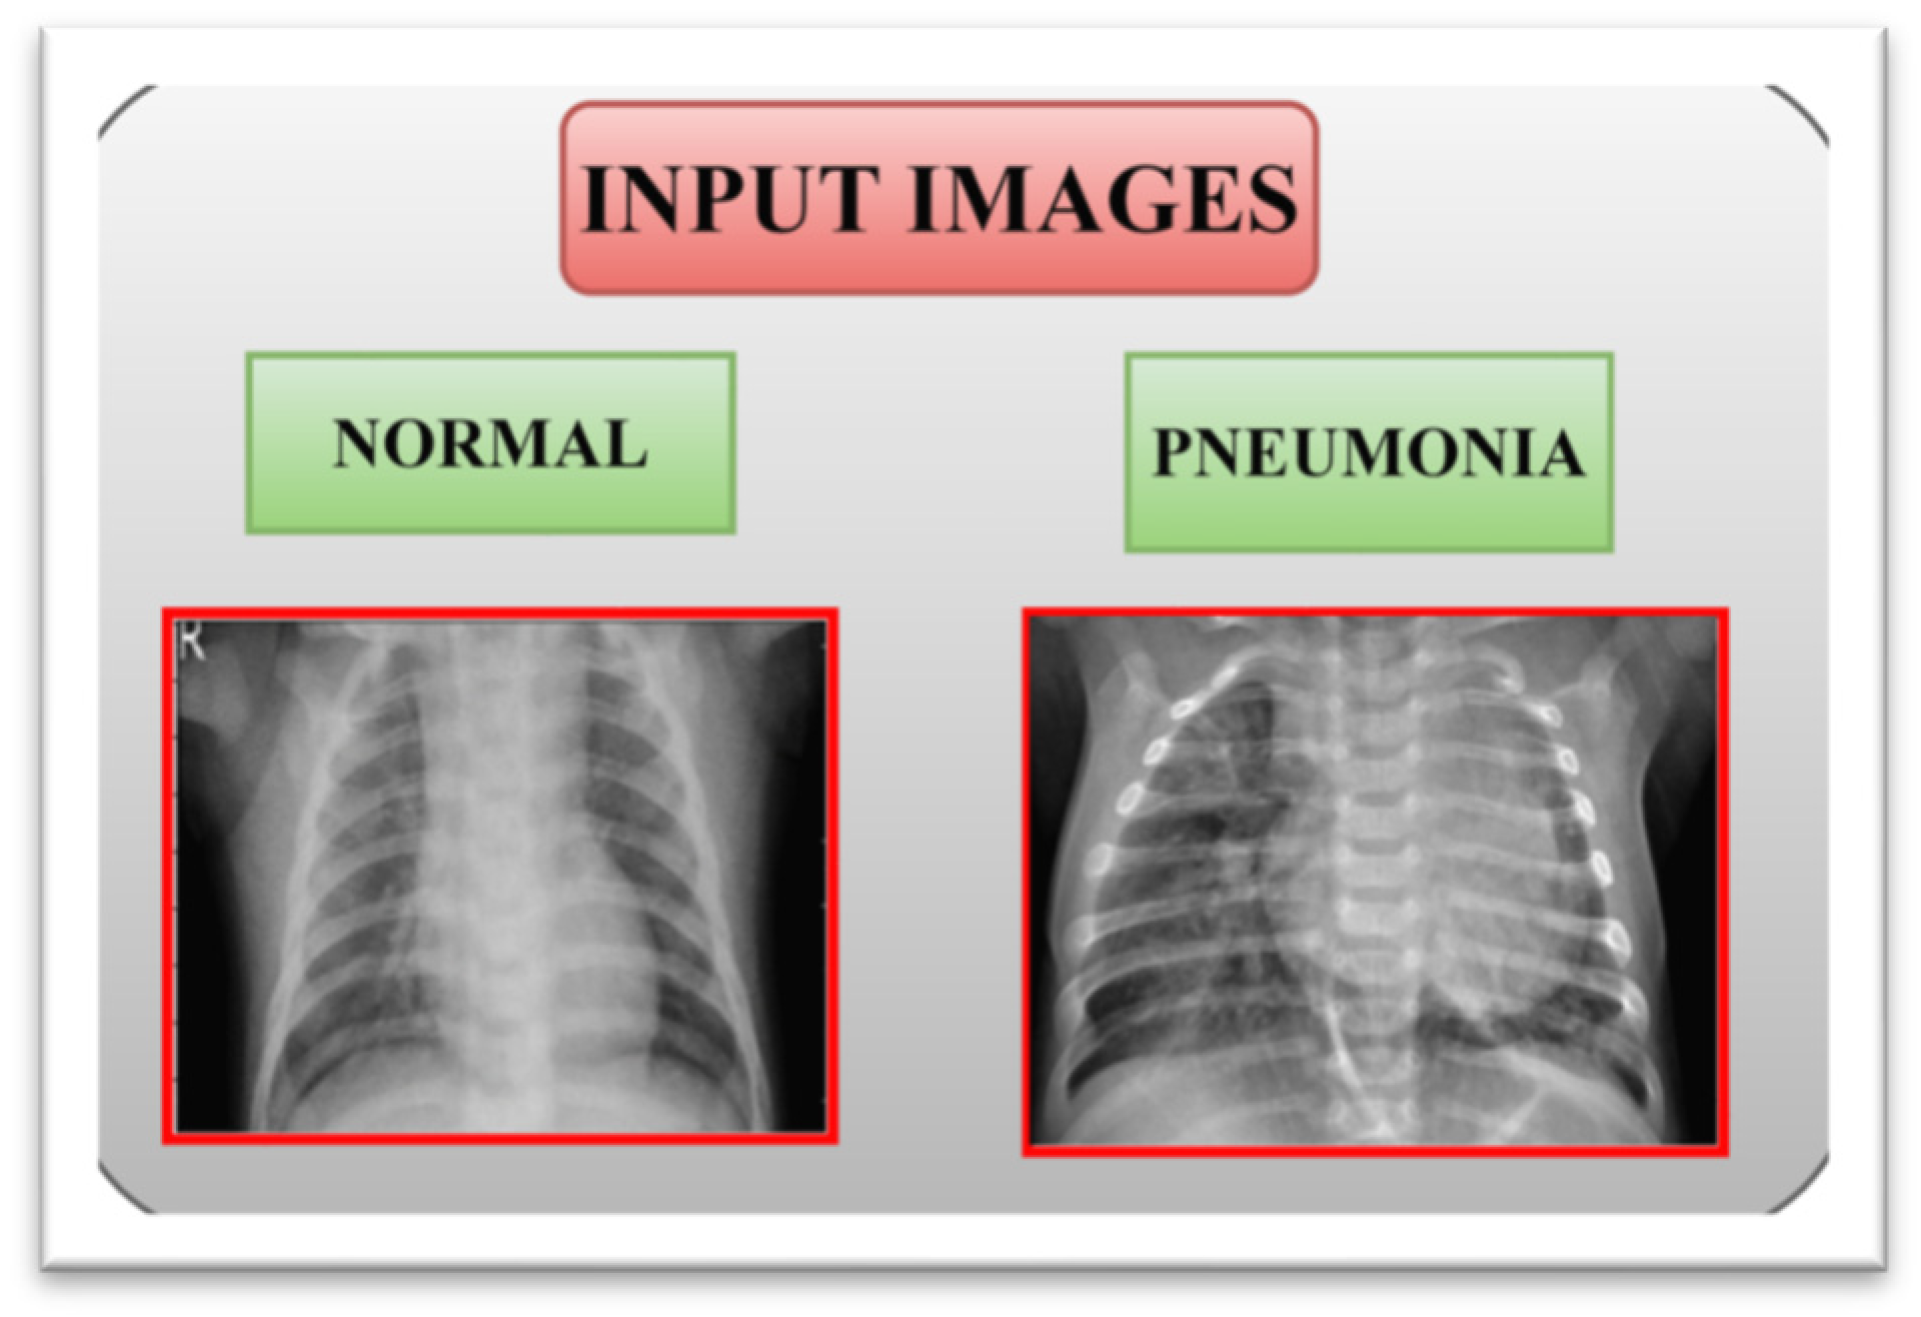
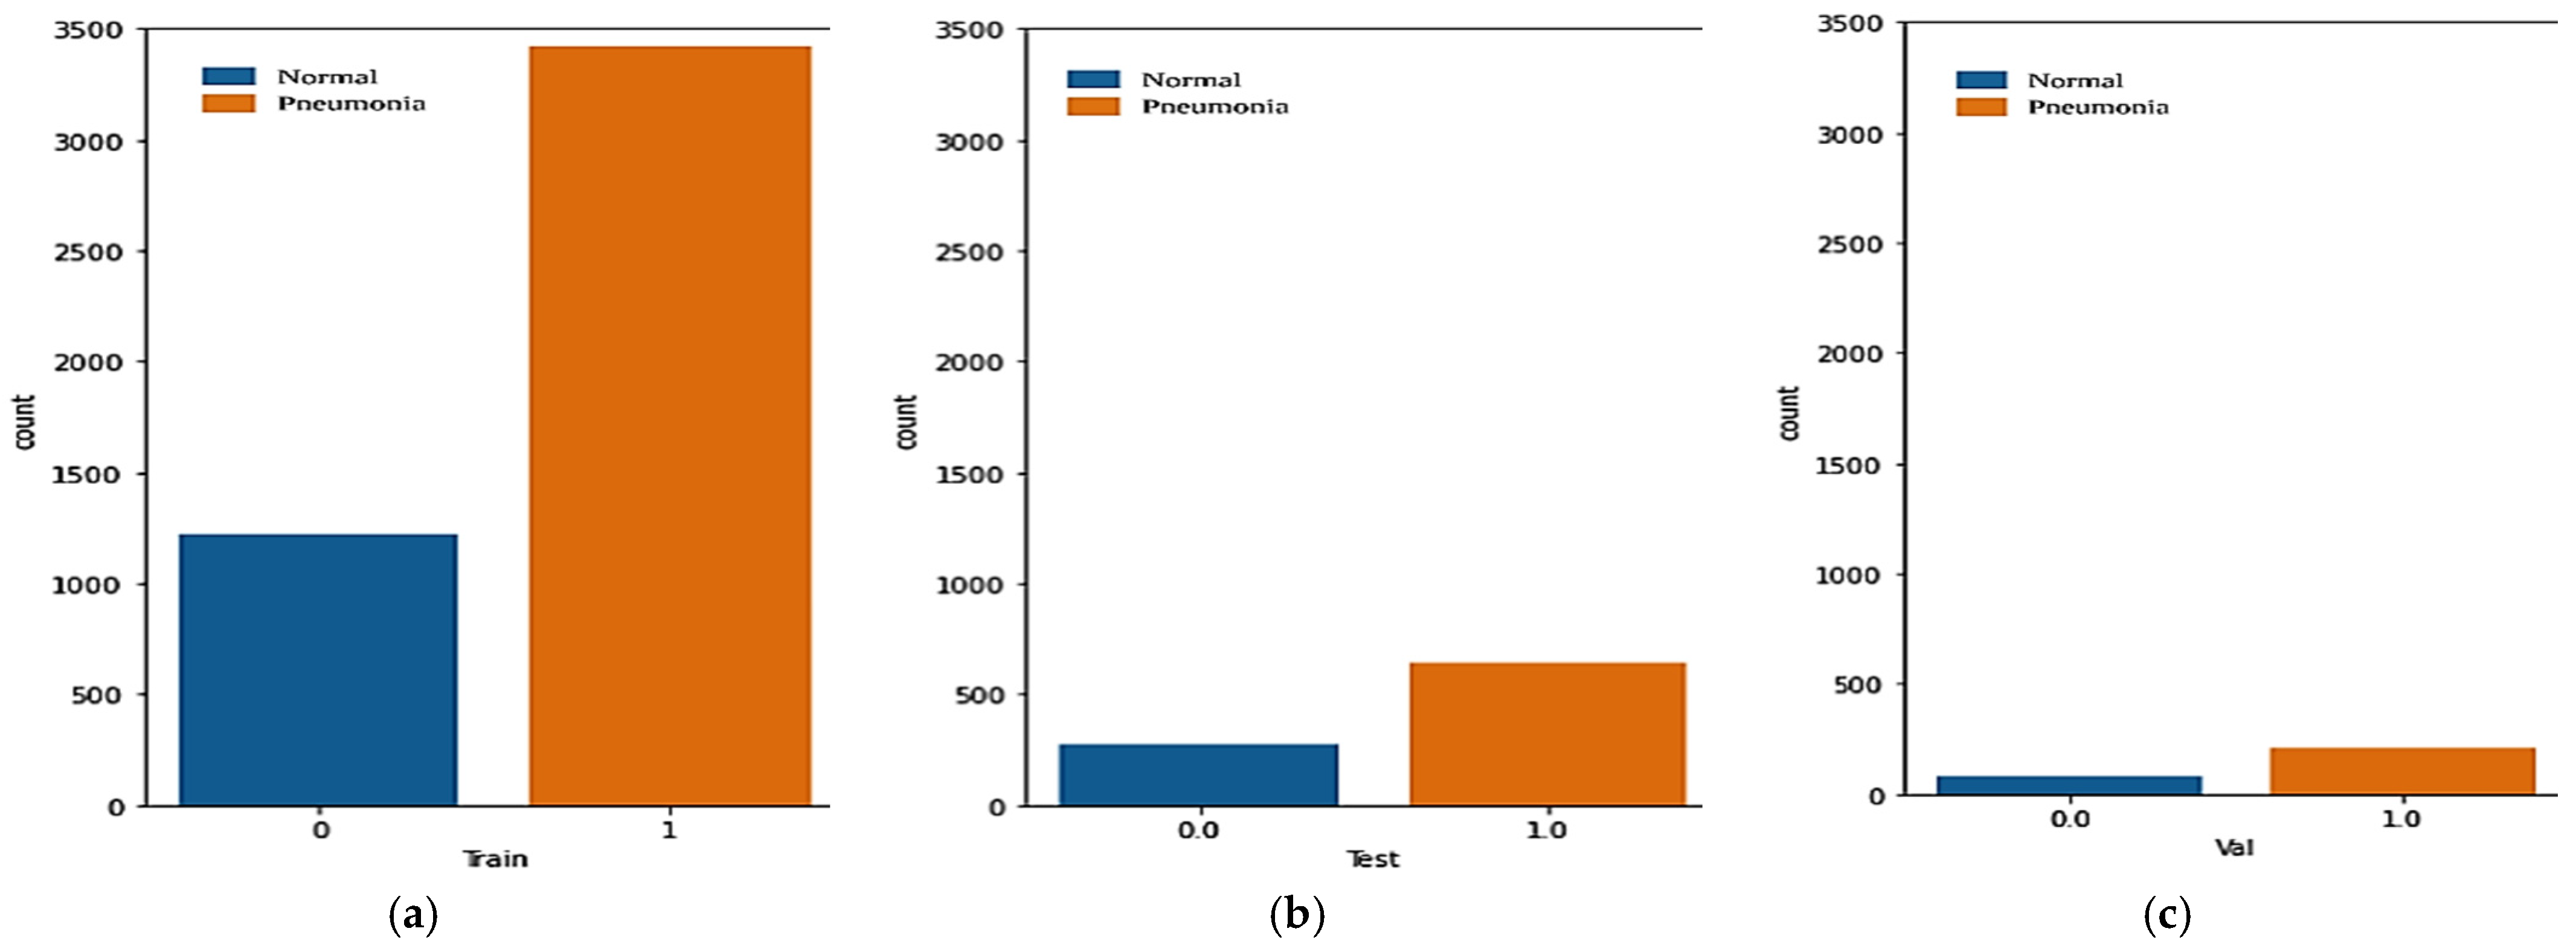
3.1. Input Dataset
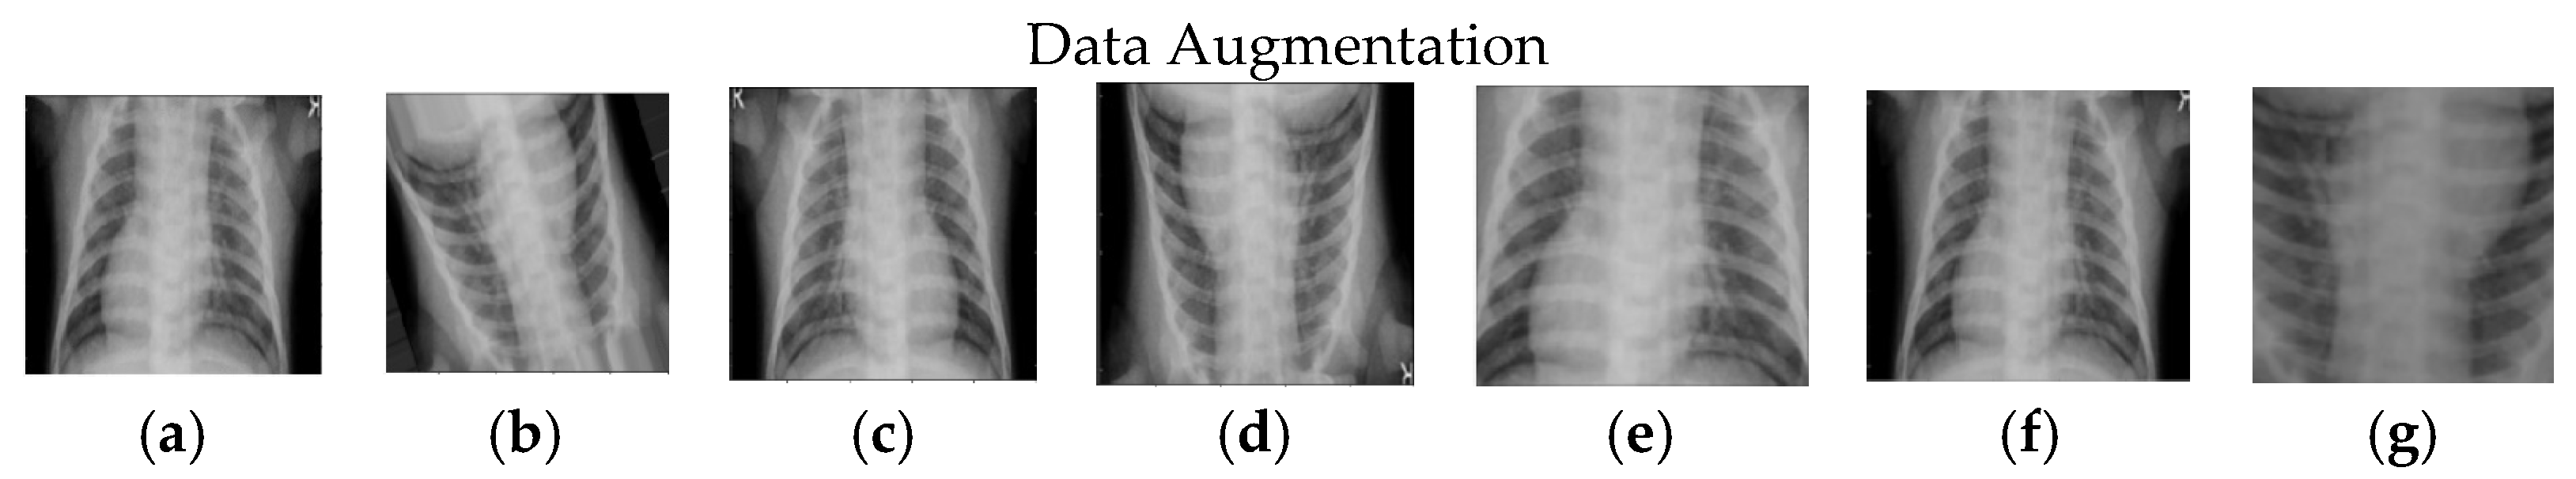
3.2. Data Augmentation
3.3. Pneumonia Prediction Using Pre-Trained Models
3.4. Performance Parameters
4. Results and Discussion
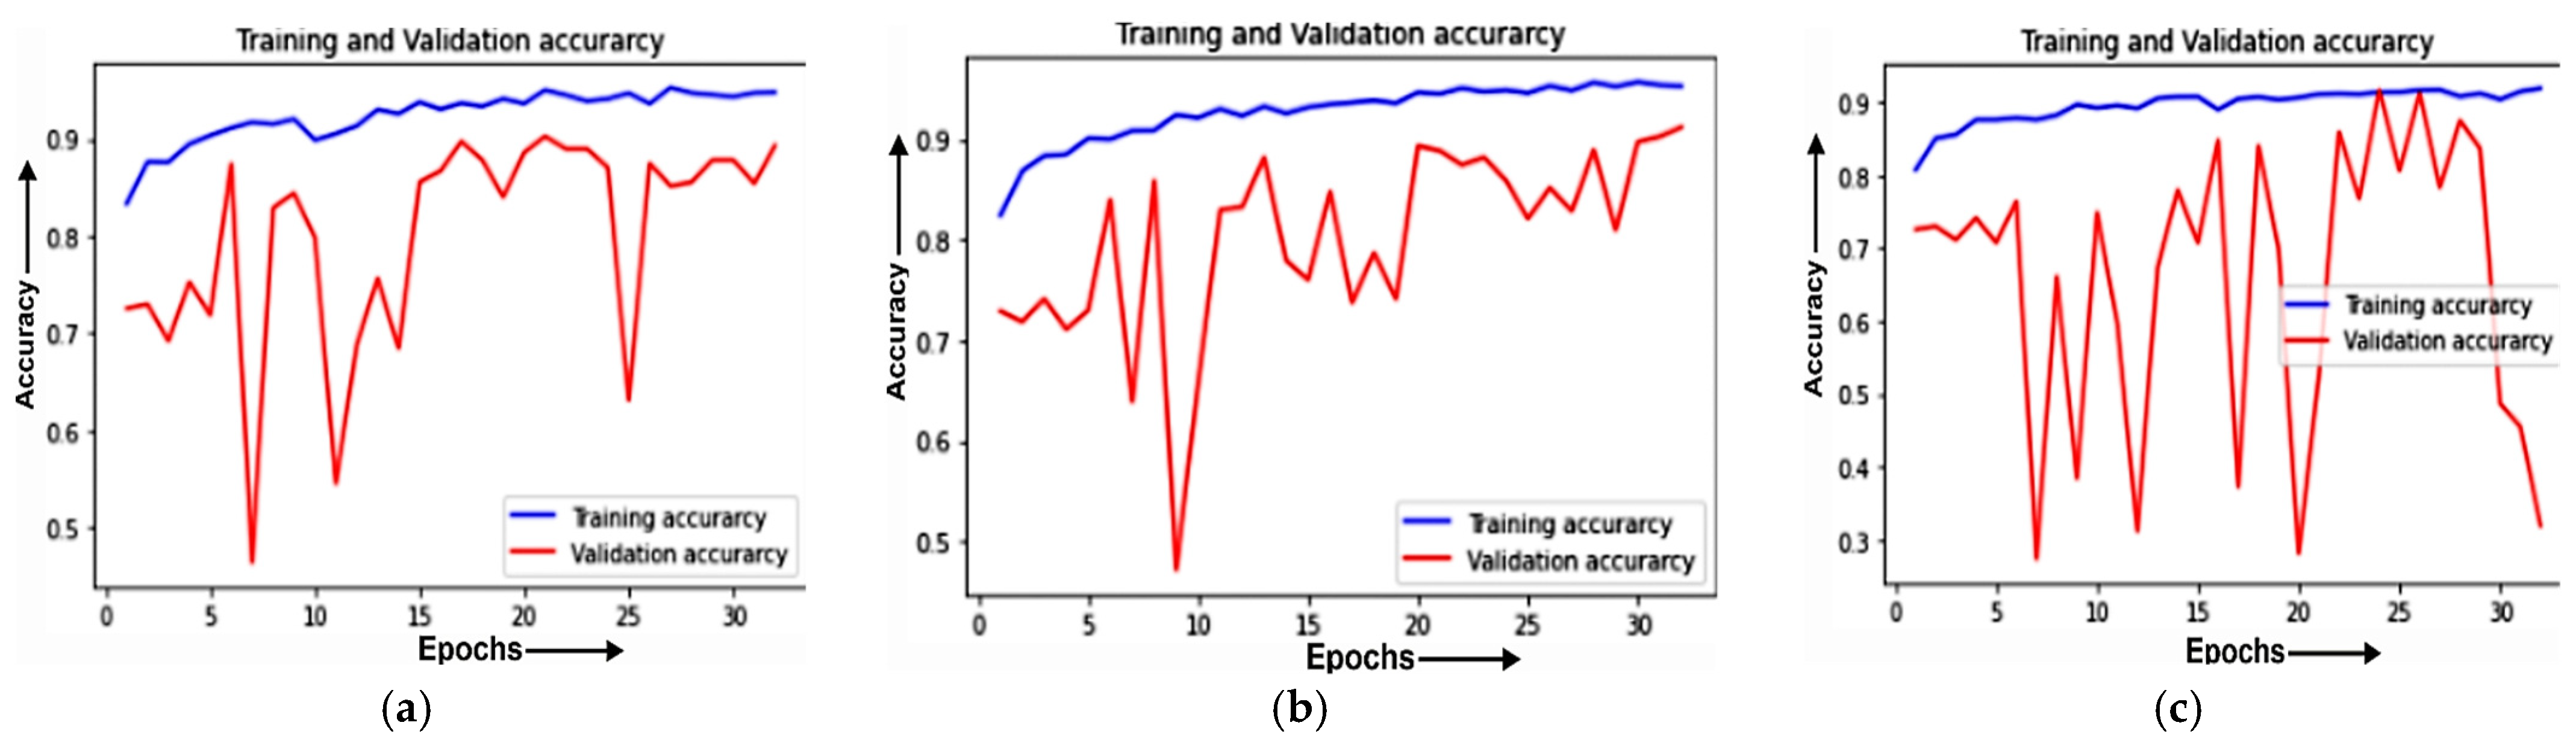
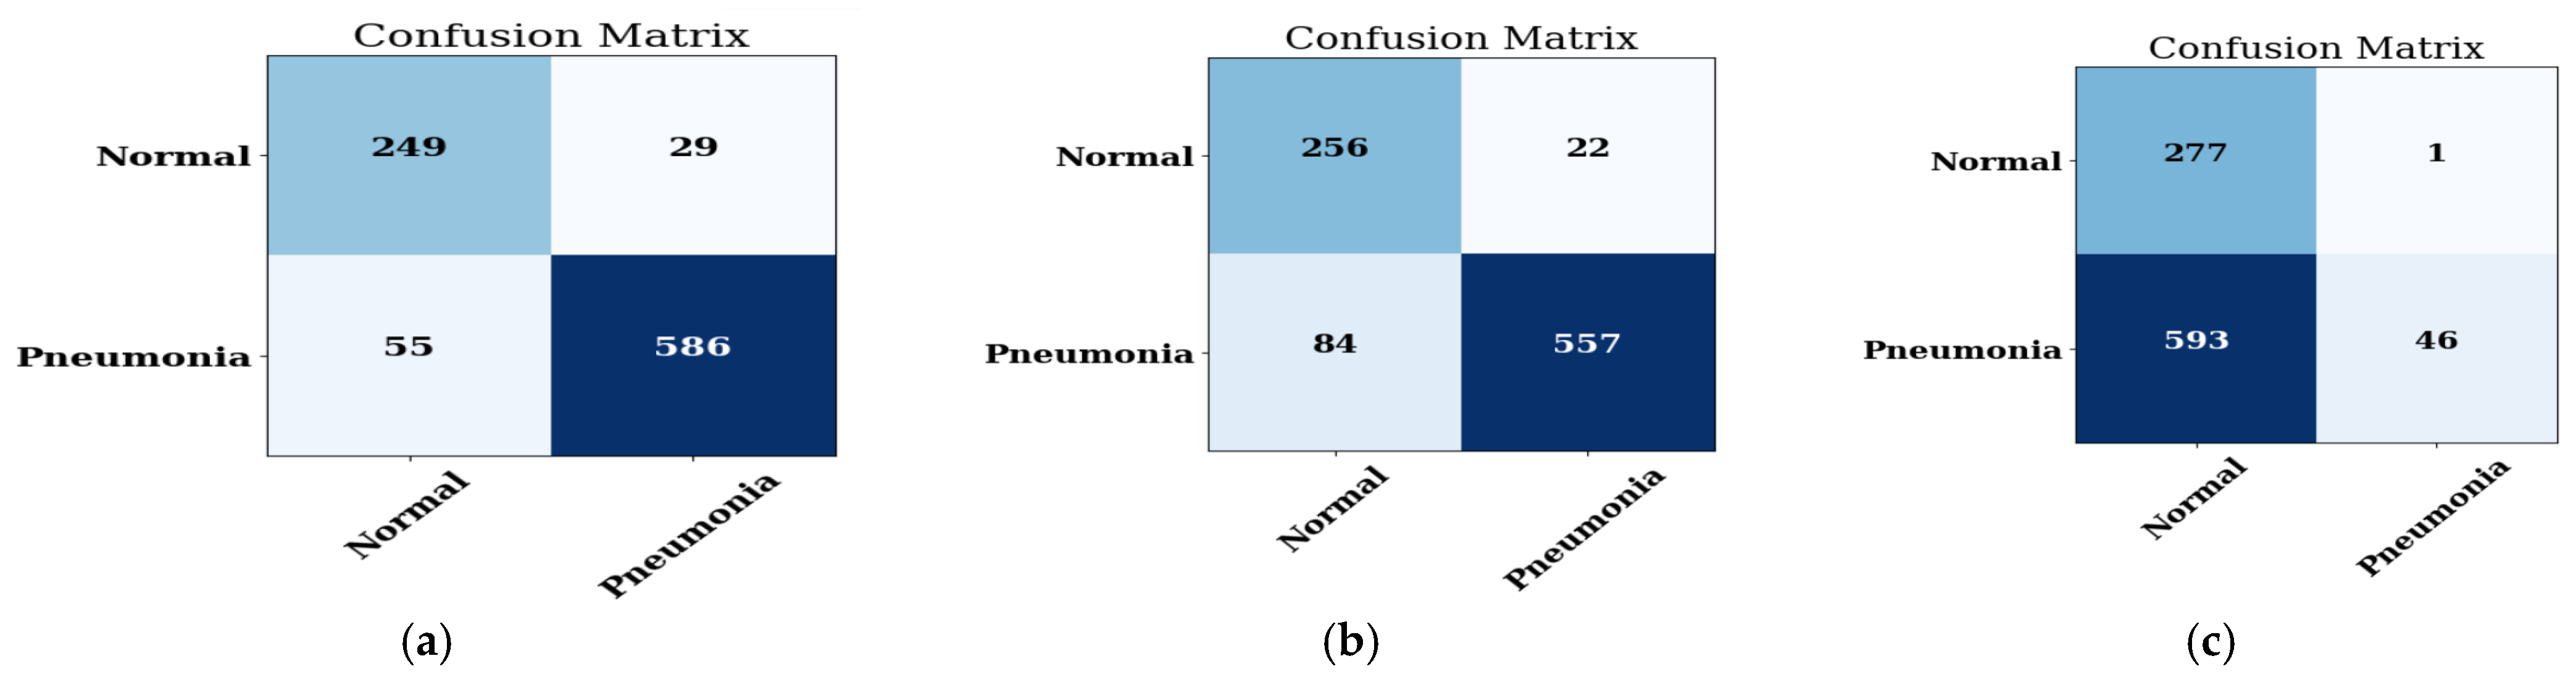
4.1. Analysis of the Best Model with Different Optimizers
4.1.1. Training and Validation Curve
4.1.2. Confusion Matrix
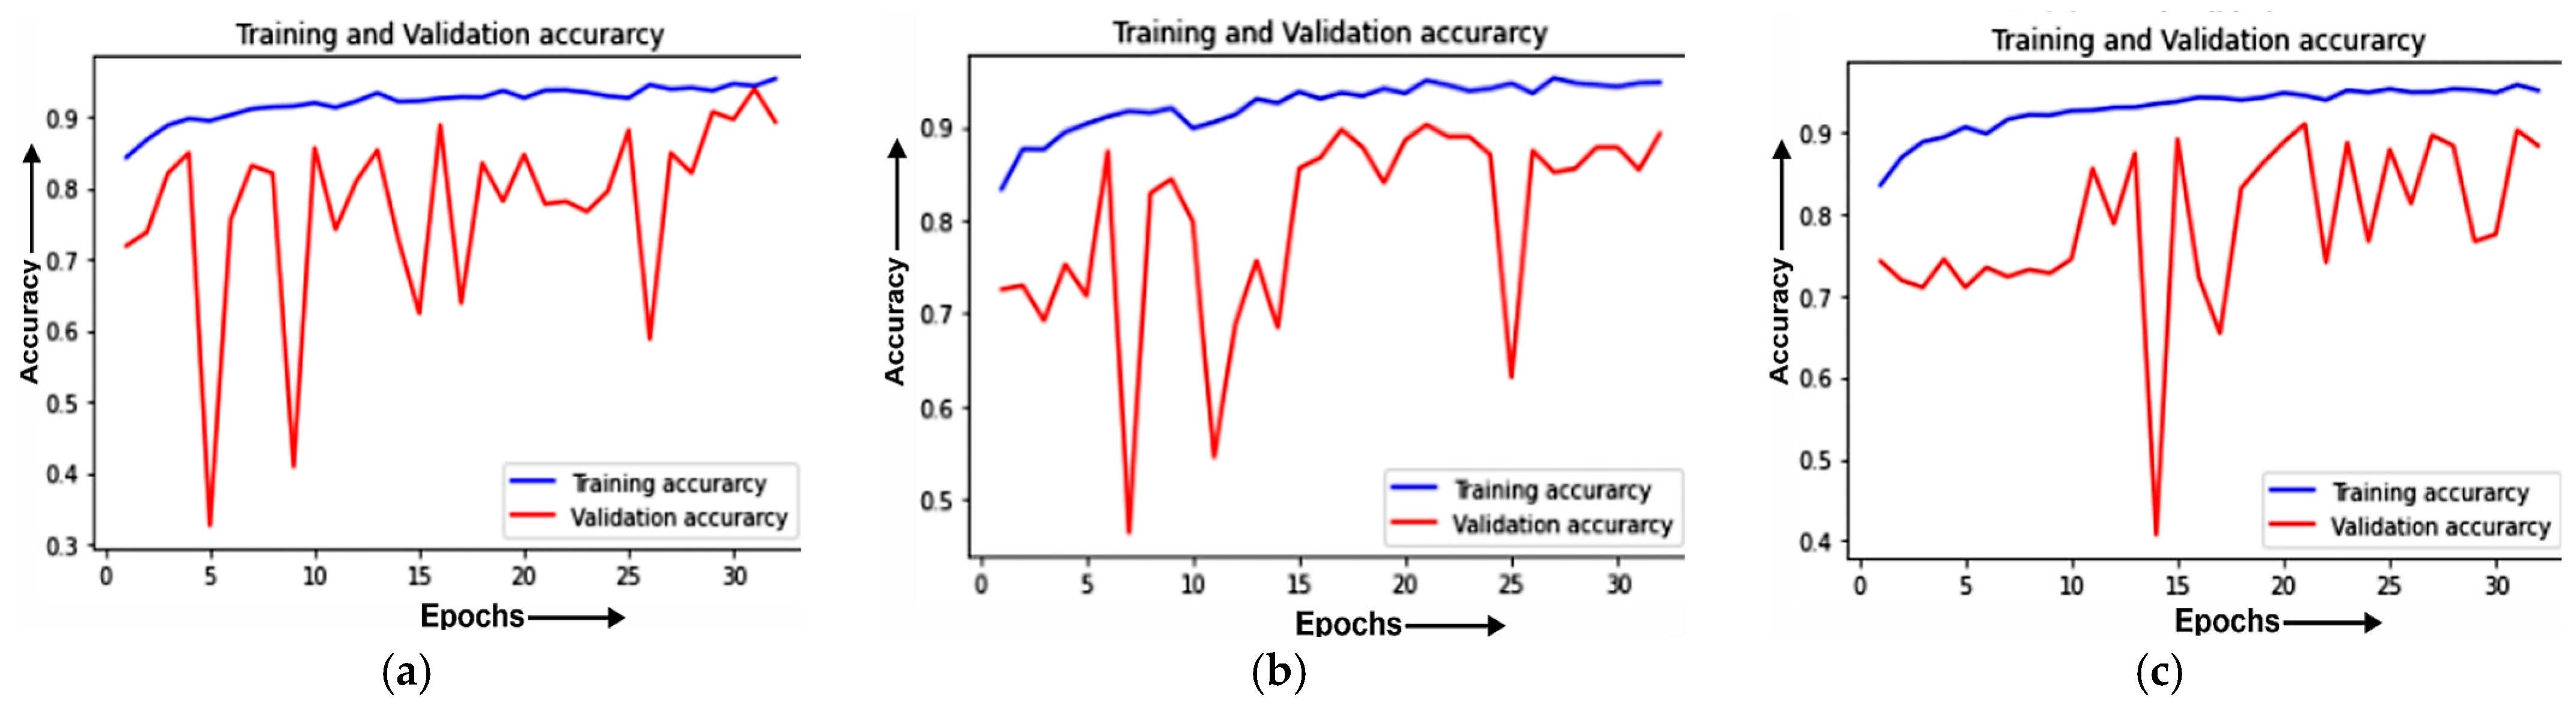
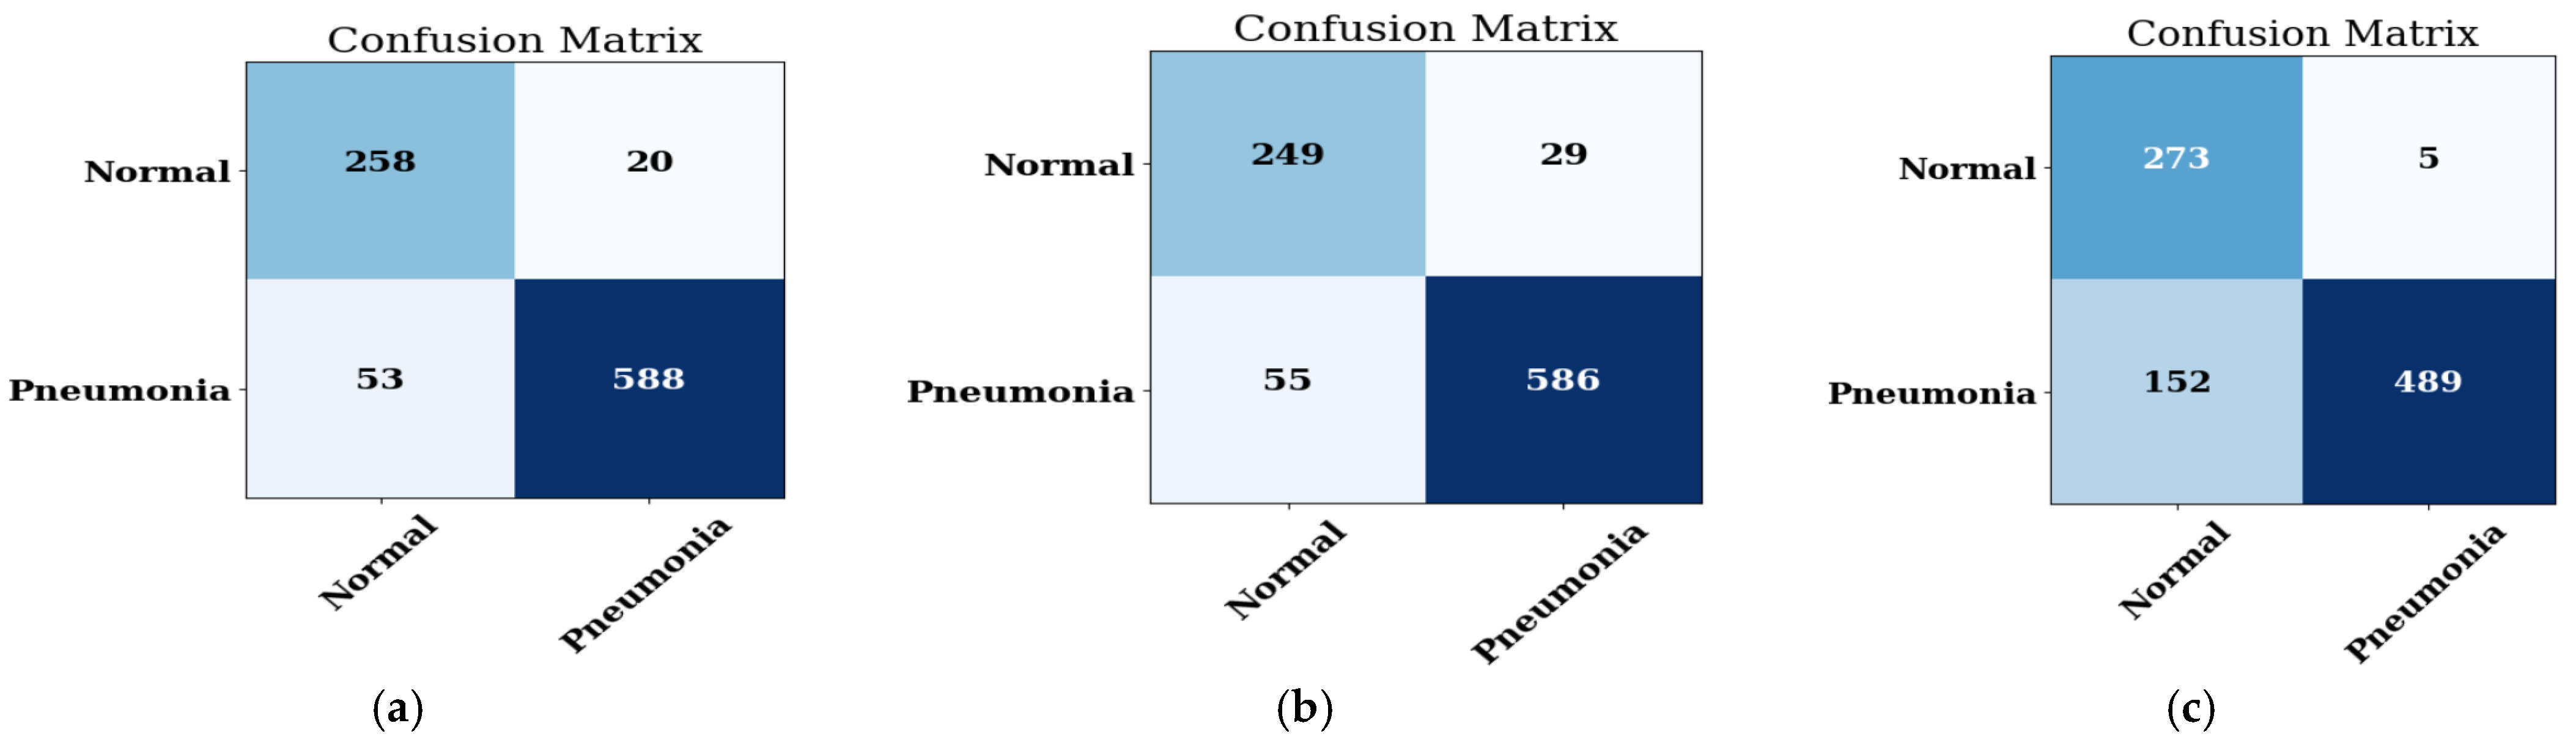
4.2. Analysis of Best Model with Different Batch Sizes
4.2.1. Training and Validation Curve
4.2.2. Confusion Matrix
4.3. Analysis of Best Model with Different Epochs
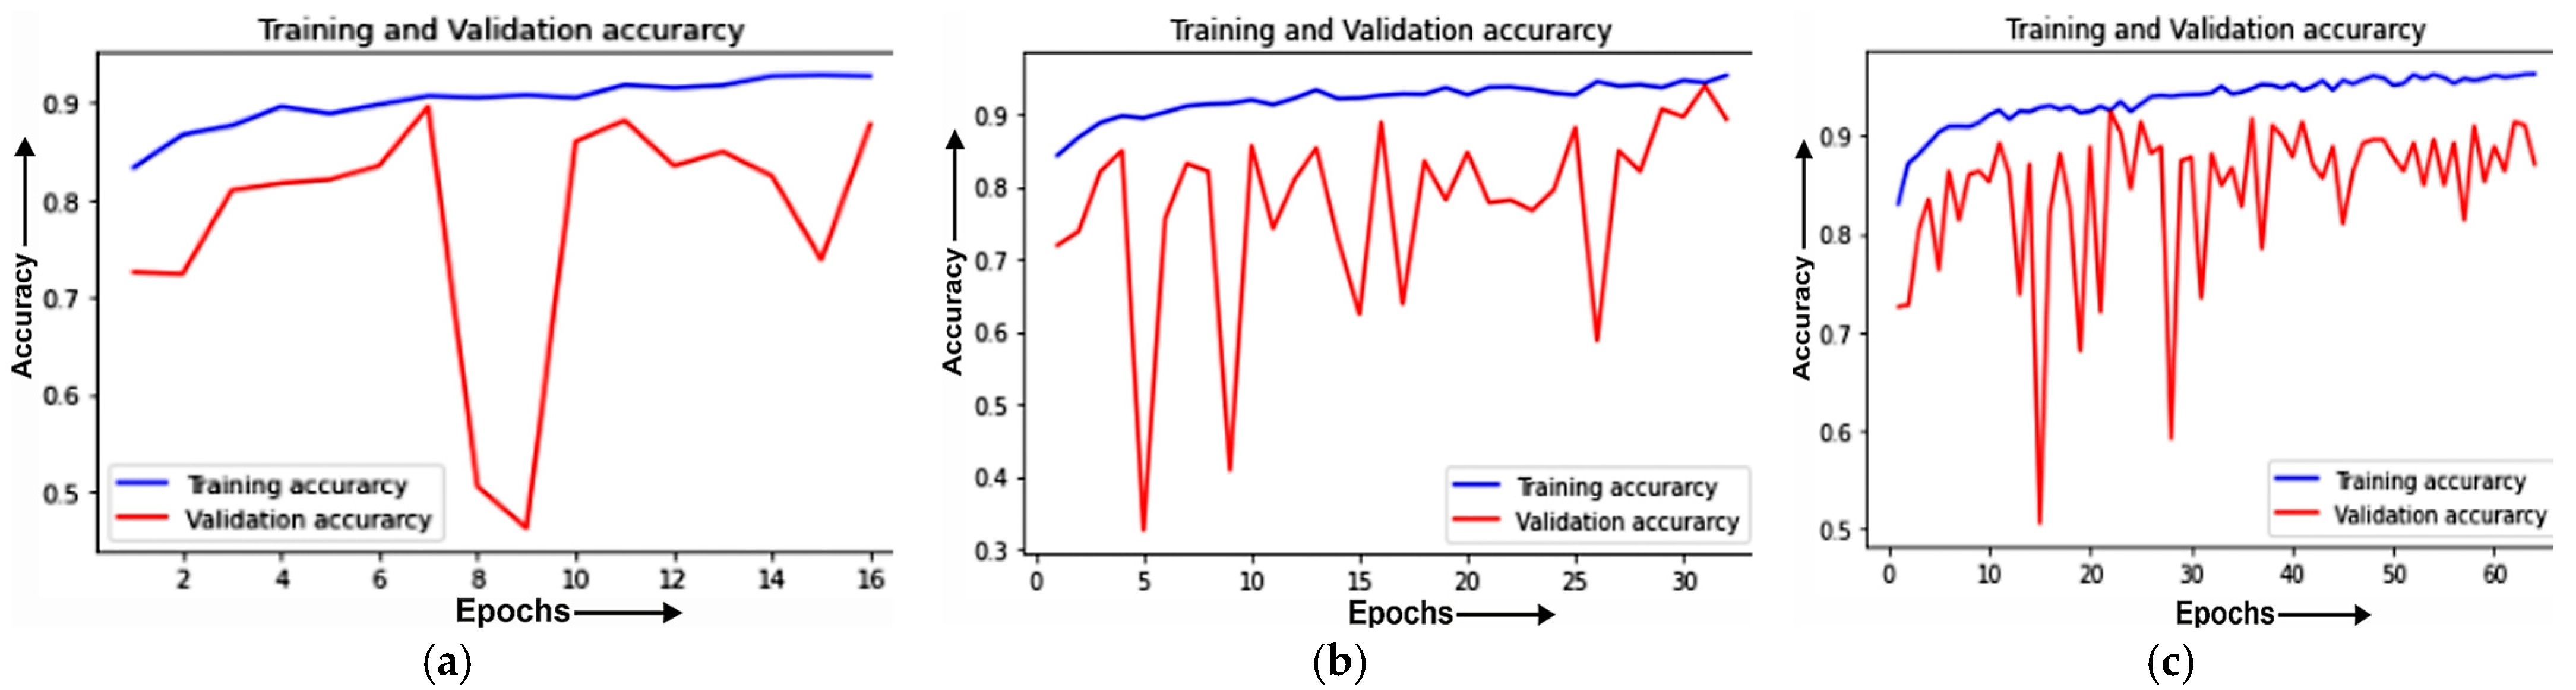
4.3.1. Training and Validation Curve
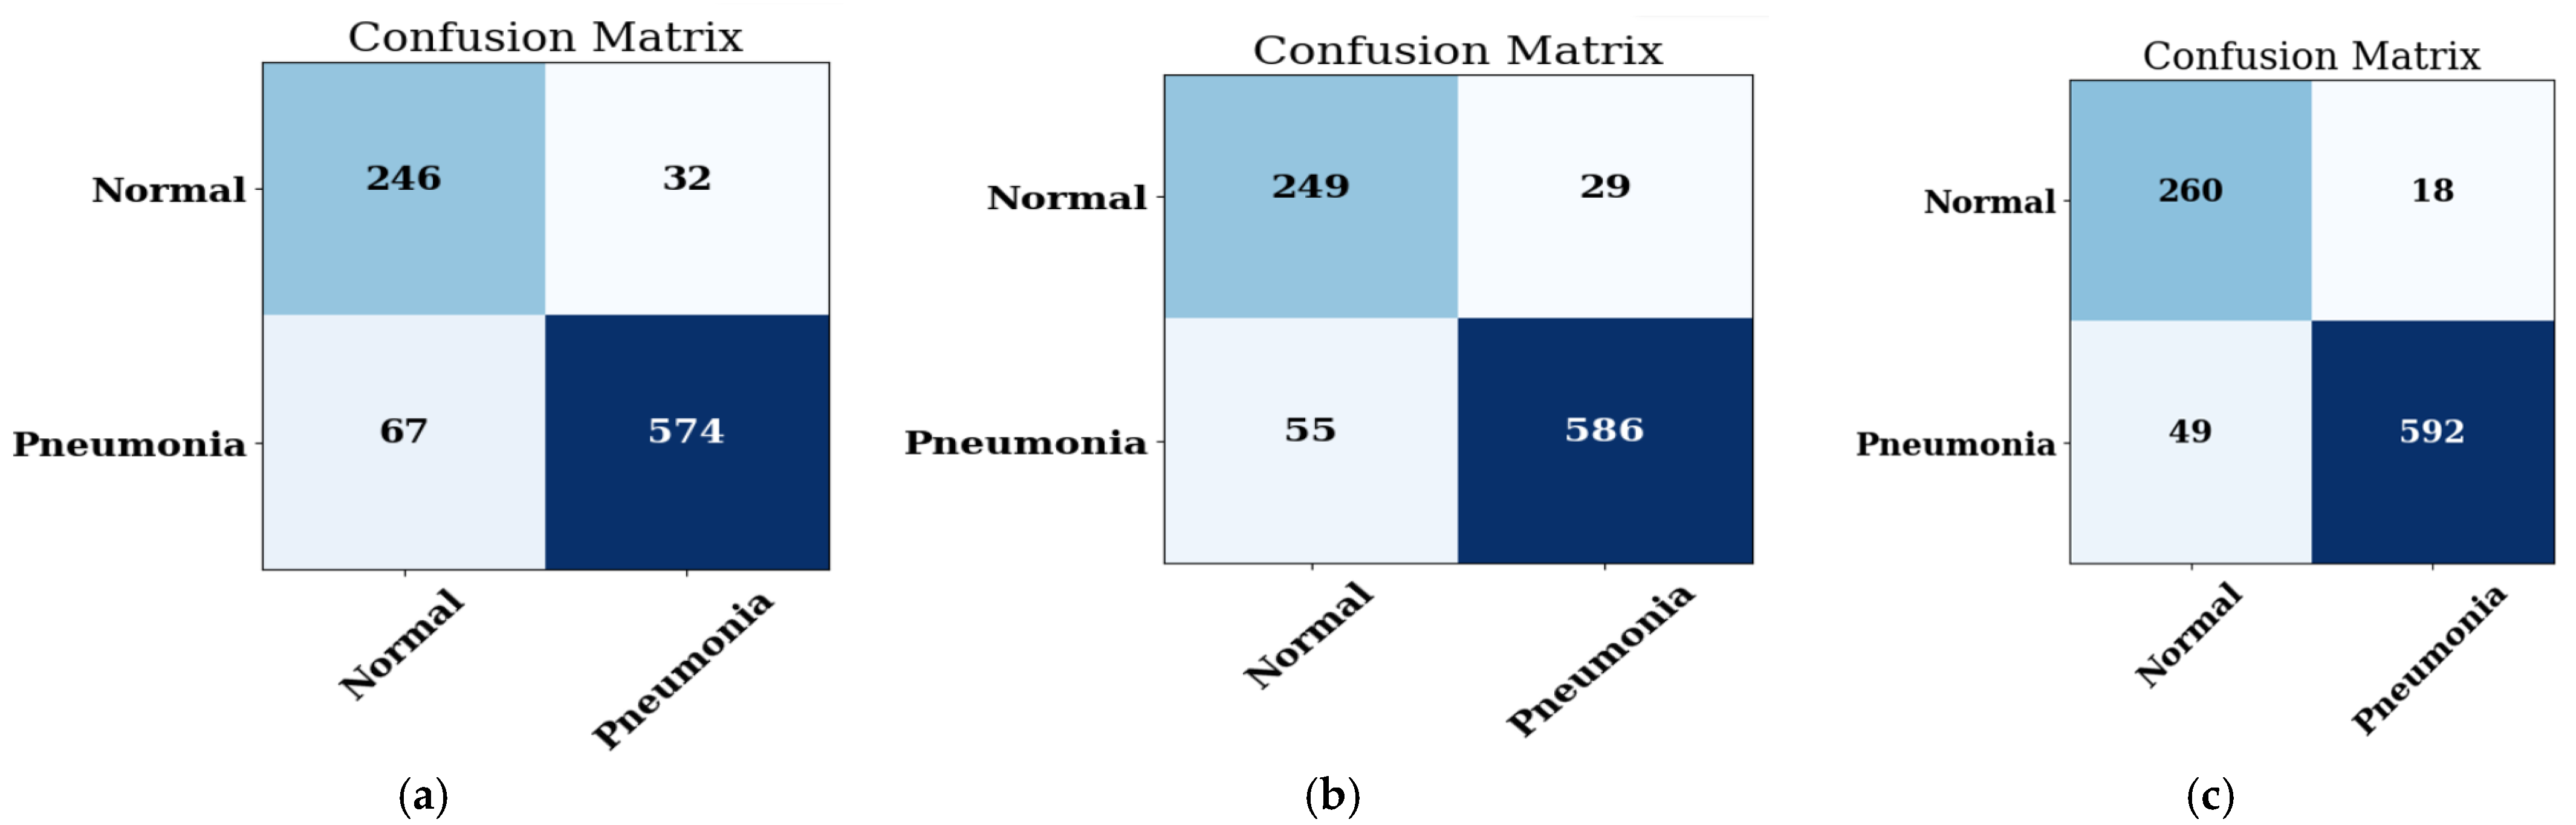
4.3.2. Confusion Matrix
4.3.3. Evaluation of Best Model at Different Datasets
4.3.4. State-of-Art Comparison (SOTA)
5. Conclusions
Author Contributions
Funding
Institutional Review Board Statement
Informed Consent Statement
Data Availability Statement
Conflicts of Interest
References
- Hu, Z.; Yang, Z.; Lafata, K.J.; Yin, F.F.; Wang, C. A radiomics-boosted deep-learning model for COVID-19 and non-COVID-19 pneumonia classification using chest X-ray images. Med. Phys. 2022, 49, 3213–3222. [Google Scholar] [CrossRef] [PubMed]
- Jaiswal, A.K.; Tiwari, P.; Kumar, S.; Gupta, D.; Khanna, A.; Rodrigues, J.J. Identifying pneumonia in chest X-rays: A deeplearning approach. Measurement 2019, 145, 511–518. [Google Scholar] [CrossRef]
- Zhang, D.; Ren, F.; Li, Y.; Na, L.; Ma, Y. Pneumonia detection from chest X-ray images based on convolutional neural network. Electronics 2021, 10, 1512. [Google Scholar] [CrossRef]
- Mercaldo, F.; Belfiore, M.P.; Reginelli, A.; Brunese, L.; Santone, A. Coronavirus COVID-19 detection by means of explainable deep learning. Sci. Rep. 2023, 13, 462. [Google Scholar] [CrossRef] [PubMed]
- Ahuja, S.; Panigrahi, B.K.; Dey, N.; Rajinikanth, V.; Gandhi, T.K. Deep transfer learning-based automated detection of COVID-19 from lung CT scan slices. Appl. Intell. 2021, 51, 571–585. [Google Scholar] [CrossRef]
- Attallah, O.; Samir, A. A wavelet-based deep learning pipeline for efficient COVID-19 diagnosis via CT slices. Appl. Soft Comput. 2022, 128, 109401. [Google Scholar] [CrossRef]
- Kini, A.S.; Gopal Reddy, A.N.; Kaur, M.; Satheesh, S.; Singh, J.; Martinetz, T.; Alshazly, H. Ensemble deep learning and internet of things-based automated COVID-19 diagnosis framework. Contrast Media Mol. Imaging 2022, 2022, 7377502. [Google Scholar] [CrossRef]
- Attallah, O. A computer-aided diagnostic framework for coronavirus diagnosis using texture-based radiomics images. Digit. Health 2022, 8, 20552076221092543. [Google Scholar] [CrossRef]
- Li, X.; Tan, W.; Liu, P.; Zhou, Q.; Yang, J. Classification of COVID-19 chest CT images based on ensemble deep learning. J. Healthc. Eng. 2021, 2021, 5528441. [Google Scholar] [CrossRef]
- Ksibi, A.; Zakariah, M.; Ayadi, M.; Elmannai, H.; Shukla, P.K.; Awal, H.; Hamdi, M. Improved Analysis of COVID-19 Influenced Pneumonia from the Chest X-Rays Using Fine-Tuned Residual Networks. Comput. Intell. Neurosci. 2022, 2022, 9414567. [Google Scholar] [CrossRef]
- Luz, E.; Silva, P.; Silva, R.; Silva, L.; Guimarães, J.; Miozzo, G.; Moreira, G.; Menotti, D. Towards an effective and efficient deep learning model for COVID-19 patterns detection in X-ray images. Res. Biomed. Eng. 2022, 38, 149–162. [Google Scholar] [CrossRef]
- Shah, A.; Shah, M. Advancement of deep learning in pneumonia/COVID-19 classification and localization: A systematic review with qualitative and quantitative analysis. Chronic Dis. Transl. Med. 2022, 8, 154–171. [Google Scholar] [CrossRef] [PubMed]
- Wong, P.K.; Yan, T.; Wang, H.; Chan, I.N.; Wang, J.; Li, Y.; Ren, H.; Wong, C.H. Automatic detection of multiple types of pneumonia: Open dataset and a multi-scale attention network. Biomed. Signal Process. Control 2022, 73, 103415. [Google Scholar] [CrossRef] [PubMed]
- Furtado, A.; Andrade, L.; Frias, D.; Maia, T.; Badaró, R.; Nascimento, E.G.S. Deep Learning Applied to Chest Radiograph Classification—A COVID-19 Pneumonia Experience. Appl. Sci. 2022, 12, 3712. [Google Scholar] [CrossRef]
- Gazzah, S.; Bayi, R.; Kaloun, S.; Bencharef, O. A deep learning to distinguish COVID-19 from others pneumonia cases. Intell. Autom. Soft Comput. 2022, 31, 677–692. [Google Scholar] [CrossRef]
- Barhoom, A.M.; Abu-Naser, S.S. Diagnosis of Pneumonia Using Deep Learning. Int. J. Acad. Eng. Res. (IJAER) 2022, 6, 48–68. [Google Scholar]
- Mahmoudi, R.; Benameur, N.; Mabrouk, R.; Mohammed, M.A.; Garcia-Zapirain, B.; Bedoui, M.H. A Deep Learning-Based Diagnosis System for COVID-19 Detection and Pneumonia Screening Using CT Imaging. Appl. Sci. 2022, 12, 4825. [Google Scholar] [CrossRef]
- Chhabra, M.; Kumar, R. An Efficient ResNet-50 based Intelligent Deep Learning Model to Predict Pneumonia from Medical Images. In Proceedings of the 2022 International Conference on Sustainable Computing and Data Communication Systems (ICSCDS), Erode, India, 7–9 April 2022; pp. 1714–1721. [Google Scholar]
- Kermany, D.S.; Goldbaum, M.; Cai, W.; Valentim, C.C.; Liang, H.; Baxter, S.L.; McKeown, A.; Yang, G.; Wu, X.; Yan, F.; et al. Identifying medical diagnoses and treatable diseases by image-based deep learning. Cell 2018, 172, 1122–1131. [Google Scholar] [CrossRef]
- Prema, C.E.; Suresh, S.; Krishnan, M.N.; Leema, N. A Novel Efficient Video Smoke Detection Algorithm Using Co-occurrence of Local Binary Pattern Variants. Fire Technol. 2022, 58, 3139–3165. [Google Scholar] [CrossRef]
- Singh, S.; Aggarwal, A.K.; Ramesh, P.; Nelson, L.; Damodharan, P.; Pandian, M.T. COVID 19: Identification of Masked Face using CNN Architecture. In Proceedings of the 2022 3rd International Conference on Electronics and Sustainable Communication Systems (ICESC), Coimbatore, India, 17–19 August 2022; pp. 1045–1051. [Google Scholar]
- Zhou, T.; Lu, H.; Yang, Z.; Qiu, S.; Huo, B.; Dong, Y. The ensemble deep learning model for novel COVID-19 on CT images. Appl. Soft Comput. 2021, 98, 106885. [Google Scholar] [CrossRef]
- Zhang, X.; Lu, S.; Wang, S.H.; Yu, X.; Wang, S.J.; Yao, L.; Pan, Y.; Zhang, Y.D. Diagnosis of COVID-19 pneumonia via a novel deep learning architecture. J. Comput. Sci. Technol. 2022, 37, 330–343. [Google Scholar] [CrossRef]
- Raje, N.R.; Jadhav, A. Automated Diagnosis of Pneumonia through Capsule Network in conjunction with ResNet50v2 model. In Proceedings of the 2022 International Conference on Emerging Smart Computing and Informatics (ESCI), Pune, India, 9–11 March 2022; pp. 1–6. [Google Scholar]
- Yang, L.; Wang, S.H.; Zhang, Y.D. EDNC: Ensemble deep neural network for COVID-19 recognition. Tomography 2022, 8, 869–890. [Google Scholar] [CrossRef] [PubMed]
- Ibrahim, A.U.; Ozsoz, M.; Serte, S.; Al-Turjman, F.; Yakoi, P.S. Pneumonia classification using deep learning from chest X-ray images during COVID-19. Cogn. Comput. 2021, 1–13. [Google Scholar] [CrossRef] [PubMed]
- Varshni, D.; Thakral, K.; Agarwal, L.; Nijhawan, R.; Mittal, A. Pneumonia detection using CNN based feature extraction. In Proceedings of the 2019 IEEE International Conference on Electrical, Computer and Communication Technologies (ICECCT), Coimbatore, India, 20–22 February 2019; pp. 1–7. [Google Scholar]
- Chouhan, V.; Singh, S.K.; Khamparia, A.; Gupta, D.; Tiwari, P.; Moreira, C.; Damaševičius, R.; De Albuquerque, V.H.C. A novel transfer learning based approach for pneumonia detection in chest X-ray images. Appl. Sci. 2020, 10, 559. [Google Scholar] [CrossRef]
- Hammoudi, K.; Benhabiles, H.; Melkemi, M.; Dornaika, F.; Arganda-Carreras, I.; Collard, D.; Scherpereel, A. Deep learning on chest X-ray images to detect and evaluate pneumonia cases at the era of COVID-19. J. Med. Syst. 2021, 45, 75. [Google Scholar] [CrossRef] [PubMed]
- Sitaula, C.; Hossain, M.B. Attention-based VGG-16 model for COVID-19 chest X-ray image classification. Appl. Intell. 2021, 51, 2850–2863. [Google Scholar] [CrossRef]
- Sitaula, C.; Shahi, T.B.; Aryal, S.; Marzbanrad, F. Fusion of multi-scale bag of deep visual words features of chest X-ray images to detect COVID-19 infection. Sci. Rep. 2021, 11, 23914. [Google Scholar] [CrossRef]
- Szepesi, P.; Szilágyi, L. Detection of pneumonia using convolutional neural networks and deep learning. Biocybern. Biomed. Eng. 2022, 42, 1012–1022. [Google Scholar] [CrossRef]
- Al-Taani, A.T.; Al-Dagamseh, I.T. Automatic detection of pneumonia using concatenated convolutional neural network. Jordanian J. Comput. Inf. Technol. (JJCIT) 2022, 2022, 118–136. [Google Scholar] [CrossRef]


| Class | First Dataset | ||
|---|---|---|---|
| Train | Validation | Test | |
| Pneumonia | 3418 | 214 | 641 |
| Normal | 1224 | 81 | 278 |
| Total | 4642 | 295 | 919 |
| Second Dataset | |||
| Pneumonia | 1145 | 71 | 215 |
| Normal | 1145 | 71 | 215 |
| Total | 2290 | 142 | 430 |
| Model | Layers | Parameters (in Millions) | Input Layer Size | Output Layer Size |
|---|---|---|---|---|
| MobileNet | 28 | 13 | 224 × 224 × 3 | (2,1) |
| ResNet50 | 50 | 25.6 | ||
| ResNet152V2 | 164 | 60.4 | ||
| DenseNet201 | 201 | 20.2 | ||
| DenseNet121 | 121 | 8.1 | ||
| Xception | 71 | 22.8 | ||
| VGG16 | 16 | 138 | ||
| EfficientNet | 10 | 8.4 |
| Model | Epochs | Loss | Binary Accuracy | MAE | Val_Loss | Val_Binary_ Accuracy | Val_Mae |
|---|---|---|---|---|---|---|---|
| MobileNet | 8 | 0.1996 | 0.9151 | 0.1160 | 0.6880 | 0.8289 | 0.2061 |
| . | . | . | . | . | . | . | |
| . | . | . | . | . | . | . | |
| 32 | 0.1368 | 0.9479 | 0.0755 | 0.3013 | 0.8935 | 0.1244 | |
| ResNet50 | 8 | 0.1934 | 0.9221 | 0.1075 | 2.6490 | 0.4106 | 0.5786 |
| . | . | . | . | . | . | . | |
| . | . | . | . | . | . | . | |
| 32 | 0.1465 | 0.9413 | 0.0820 | 34.8674 | 0.2890 | 0.7098 | |
| ResNet152V2 | 8 | 0.2059 | 0.9163 | 0.1204 | 1.2353 | 0.3270 | 0.5921 |
| . | . | . | . | . | . | . | |
| . | . | . | . | . | . | . | |
| 32 | 0.1690 | 0.9336 | 0.0969 | 1.6554 | 0.7833 | 0.2140 | |
| DenseNet201 | 8 | 0.2524 | 0.8931 | 0.1488 | 1.2489 | 0.3916 | 0.5913 |
| . | . | . | . | . | . | . | |
| . | . | . | . | . | . | . | |
| 32 | 0.1604 | 0.9351 | 0.0891 | 3.9718 | 0.3802 | 0.5980 | |
| DenseNet121 | 8 | 0.2195 | 0.9085 | 0.1252 | 2.5500 | 0.7148 | 0.2883 |
| . | . | . | . | . | . | . | |
| . | . | . | . | . | . | . | |
| 32 | 0.1557 | 0.9421 | 0.0846 | 0.7925 | 0.8251 | 0.1894 | |
| Xception | 8 | 0.2206 | 0.9108 | 0.1214 | 3.0510 | 0.7681 | 0.2259 |
| . | . | . | . | . | . | . | |
| . | . | . | . | . | . | . | |
| 32 | 0.1403 | 0.9442 | 0.0780 | 0.5172 | 0.8403 | 0.1698 | |
| VGG-16 | 8 | 0.6946 | 0.7232 | 0.4992 | 0.6934 | 0.2776 | 0.5001 |
| . | . | . | . | . | . | . | |
| . | . | . | . | . | . | . | |
| 32 | 0.6918 | 0.3599 | 0.5004 | 0.6938 | 0.2776 | 0.5003 | |
| EfficientNet | 8 | 0.6946 | 0.7232 | 0.4992 | 0.6934 | 0.2776 | 0.5001 |
| . | . | . | . | . | . | . | |
| . | . | . | . | . | . | . | |
| 16 | 0.6918 | 0.3599 | 0.5004 | 0.6938 | 0.2776 | 0.5003 |
| Model | Accuracy (%) | Precision (%) | Recall (%) | F1-Score |
|---|---|---|---|---|
| MobileNet | 90.85 | 95.28 | 91.41 | 91.41 |
| ResNet50 | 30.57 | 100 | 0.4680 | 93.10 |
| ResNet152V2 | 84.65 | 82.38 | 99.21 | 90.02 |
| DenseNet201 | 34.27 | 100 | 5.772 | 91.01 |
| DenseNet121 | 88.90 | 88.33 | 96.87 | 92.41 |
| Xception | 87.59 | 91.75 | 90.32 | 91.03 |
| VGG16 | 30.20 | 85.21 | 43.16 | 93.13 |
| EfficientNet | 51.02 | 86.21 | 45.85 | 90.10 |
| Optimizer | Accuracy (%) | Precision (%) | Recall (%) | F1-Score | AUC |
|---|---|---|---|---|---|
| ADAM | 90.85 | 95.28 | 91.41 | 91.41 | 0.933 |
| ADADELTA | 88.46 | 96.20 | 86.89 | 91.31 | 0.971 |
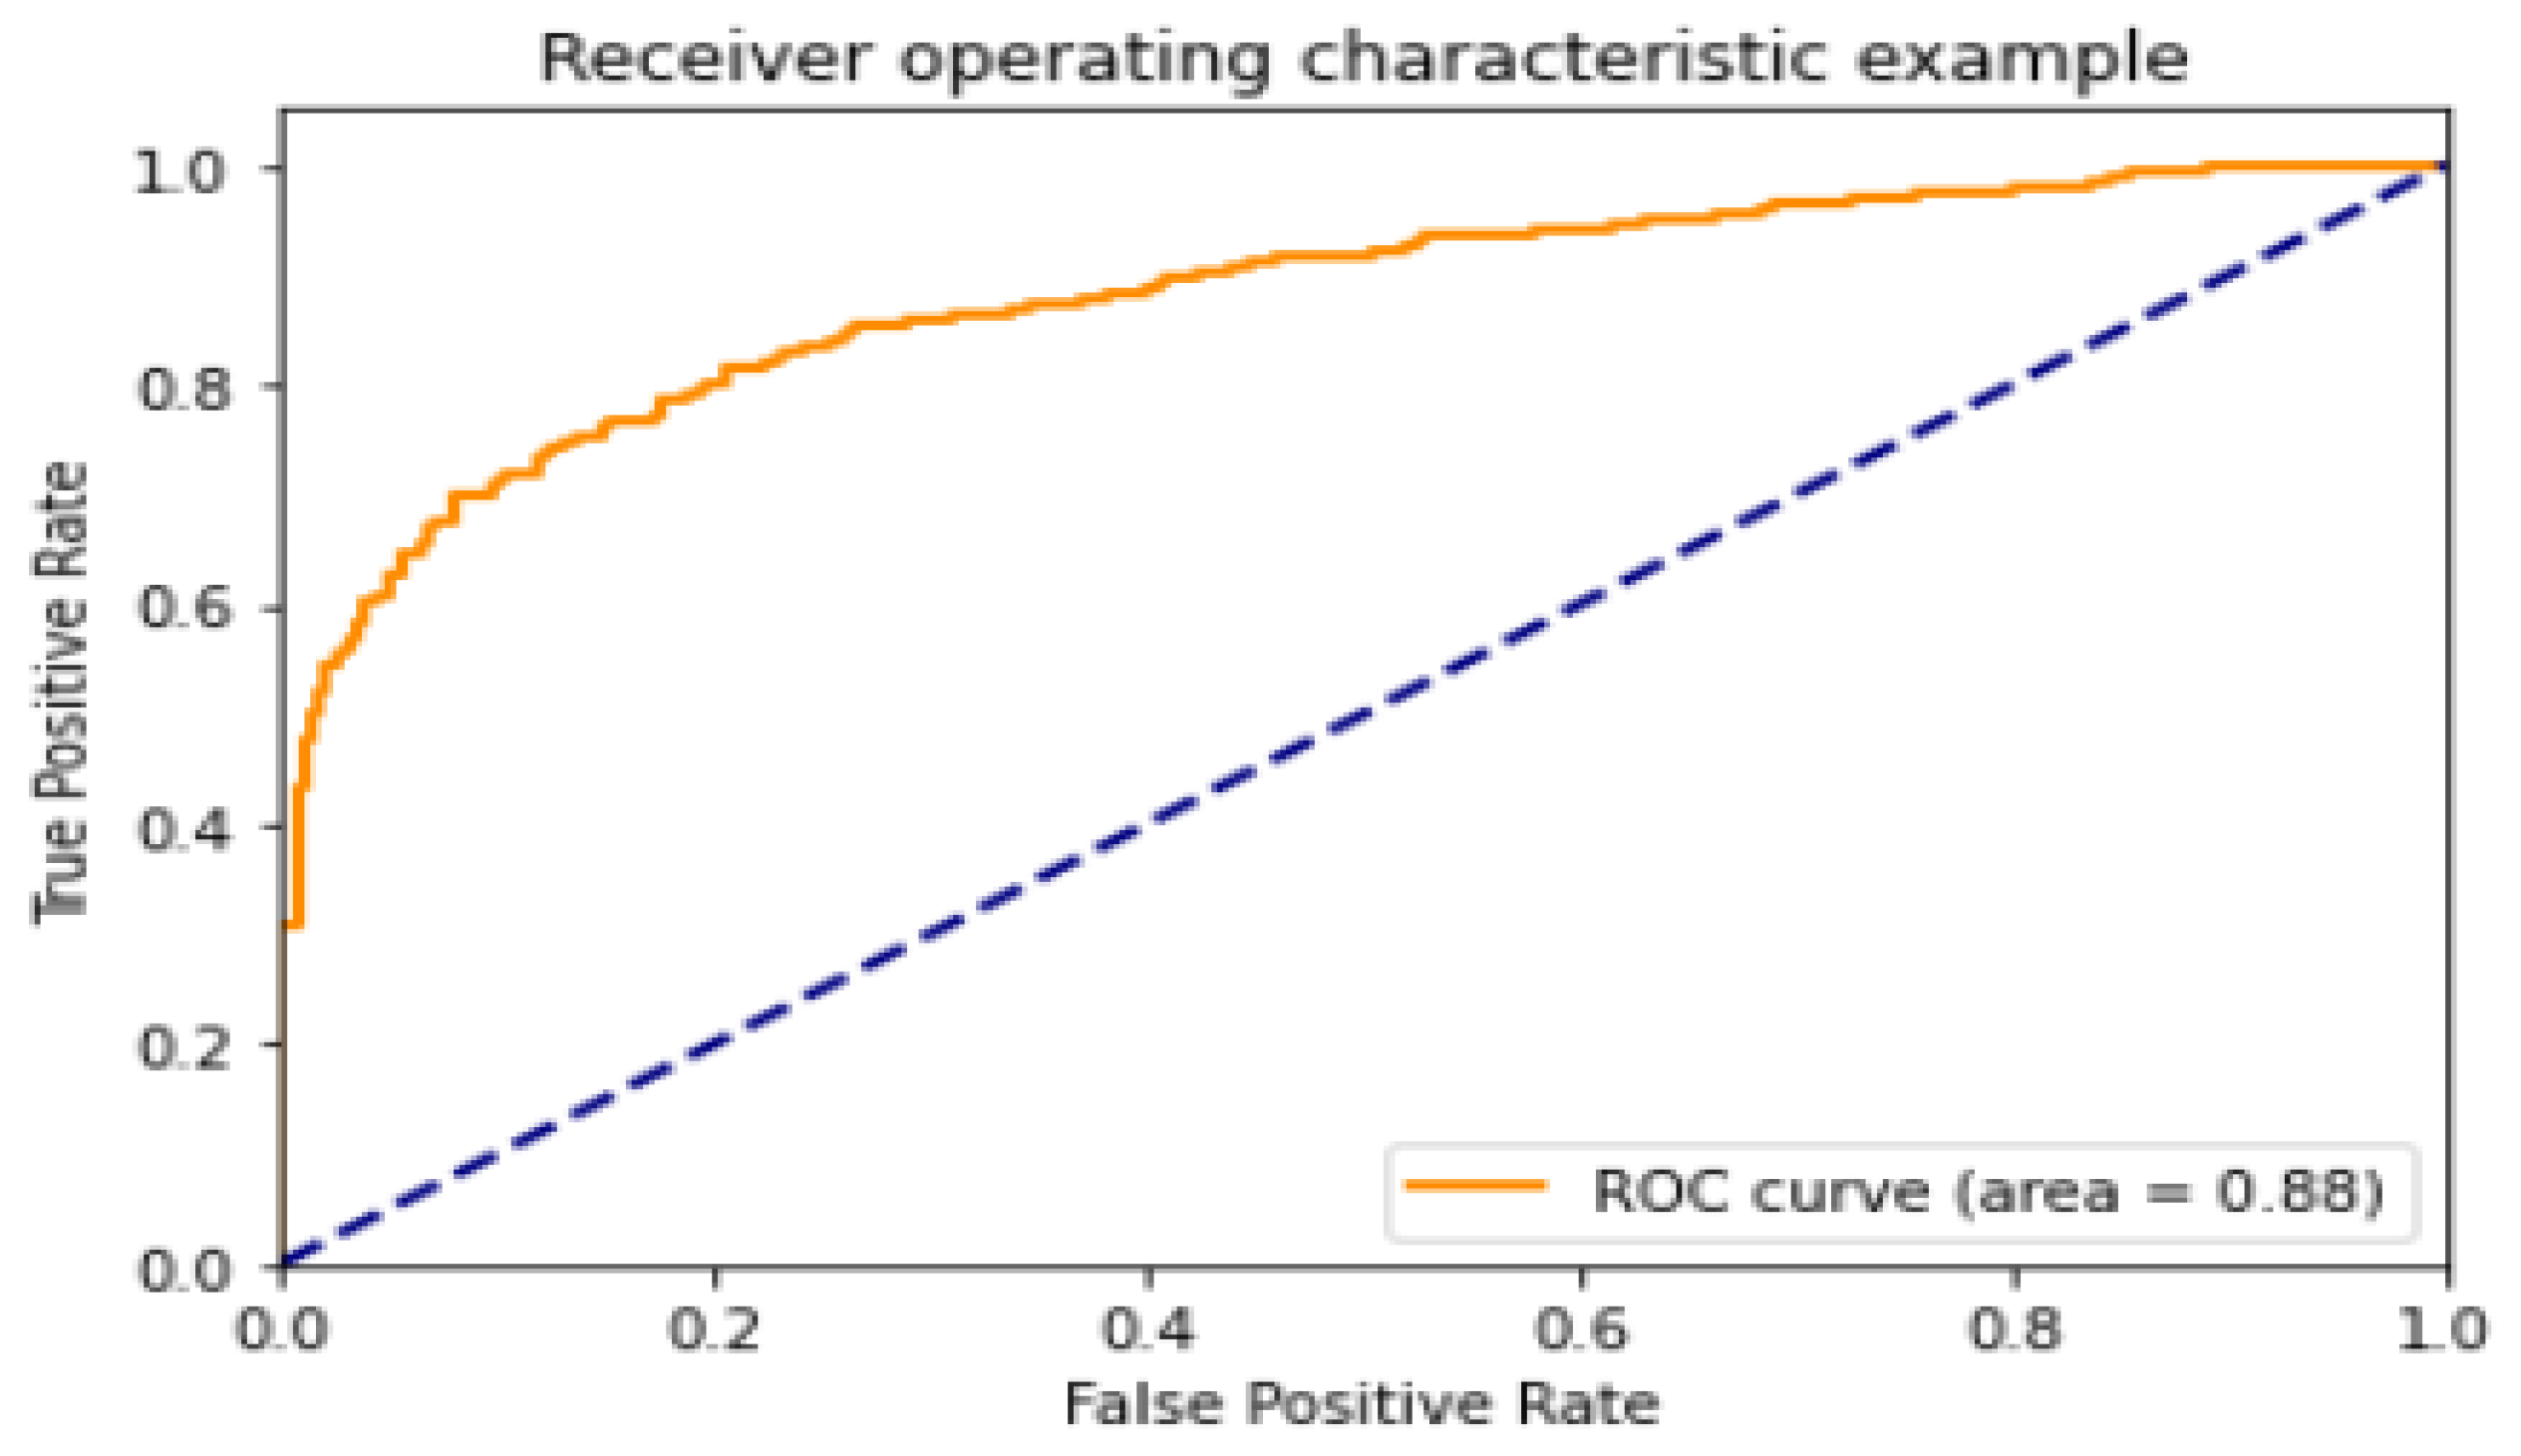
| SGD | 35.14 | 97.87 | 7.176 | 13.37 | 0.867 |
| Batch Size | Accuracy (%) | Precision (%) | Recall (%) | F1-Score | AUC |
|---|---|---|---|---|---|
| 16 | 92.05 | 96.71 | 91.73 | 94.15 | 0.980 |
| 32 | 90.85 | 95.28 | 91.41 | 93.31 | 0.970 |
| 64 | 82.91 | 98.98 | 76.28 | 86.16 | 0.971 |
| Epochs | Accuracy (%) | Precision (%) | Recall (%) | F1-Score | AUC |
|---|---|---|---|---|---|
| 16 | 89.22 | 94.71 | 89.54 | 92.06 | 0.955 |
| 32 | 92.05 | 96.71 | 91.73 | 94.15 | 0.980 |
| 64 | 94.23 | 93.75 | 98.28 | 95.96 | 0.972 |
| Number of Images | Accuracy (%) | Precision (%) | Recall (%) | F1-Score (%) |
|---|---|---|---|---|
| 5856 | 94.23 | 93.75 | 98.28 | 95.96 |
| 112,120 | 93.75 | 91.36 | 94.39 | 93.18 |
| Ref/Year | Technique | Classes | Number of Images | Accuracy |
|---|---|---|---|---|
| Based on COVID-19 Detection | ||||
| [22]/2021 | GoogleNet | Normal and novel COVID-19 | 5000 | 97.89% |
| [23]/2022 | DC-Net-R | Normal and COVID-19 | 296 | 96.13% |
| [24]/2022 | ResNet50v2 | Covid and Non COVID | 2756 | 87% |
| [25]/2022 | ResNet50V2 | COVID-19 and non-COVID-19 | 2458 | 97.75% |
| Based on Pneumonia Detection | ||||
| [5]/2021 | ResNet18 | Pneumonia, Non-pneumonia | 349 | 99.4% |
| [9]/2021 | VGG16 | novel coronavirus pneumonia, patients with common pneumonia (CP), and normal controls | 7000 | 93.57% |
| [26]/2021 | AlexNet | COVID-19, non-COVID-19 viral pneumonia, bacterial pneumonia, and normal | 2855 | 93.42% |
| [27]/2019 | AlexNet, GoogLeNet and ResNet | Normal and Pneumonia | 1431 pneumonia and 1431 normal | 90% |
| [28]/2020 | VGG-16 | Normal, Bacterial Pneumonia and Virus Pneumonia | 5232 | 93.0% |
| [29]/2021 | InceptionResNetV2 | Bacteria, Virus, normal, Pneumonia, | 5232 | 90.7% |
| [30]/2021 | Attention-based VGG-16 | COVID, Normal, No_findings, Pneumonia Bacteria, Pneumonia Viral | Dataset 1–1125, Dataset 2–1638, Dataset 3–2138 | 79.58% 85.43% 87.49% |
| [31]/2021 | Multi-scale bag of deep visual features with VGG | COVID, Normal, No_findings, Pneumonia Bacteria, Pneumonia Viral | Dataset 1–375, Dataset 2–1280, Dataset 3–1600, Dataset 4–276 | 84.37% 88.88% 90.30% 83.65% |
| [32]/2022 | CNN + modified dropout Model | Healthy and Pneumonia | 5856 | 91.0% |
| [33]/2022 | Pre-activation ResNet with DenseNet169 | Pneumonia and Non-Pneumonia | 5856 | 90% |
| Proposed model | MobileNet | Pneumonia, Non-Pneumonia | Dataset 1- 5856, Dataset 2- 1,12,120 | 94.23% 93.75% |
Disclaimer/Publisher’s Note: The statements, opinions and data contained in all publications are solely those of the individual author(s) and contributor(s) and not of MDPI and/or the editor(s). MDPI and/or the editor(s) disclaim responsibility for any injury to people or property resulting from any ideas, methods, instructions or products referred to in the content. |
© 2023 by the authors. Licensee MDPI, Basel, Switzerland. This article is an open access article distributed under the terms and conditions of the Creative Commons Attribution (CC BY) license (https://creativecommons.org/licenses/by/4.0/).
Share and Cite
Reshan, M.S.A.; Gill, K.S.; Anand, V.; Gupta, S.; Alshahrani, H.; Sulaiman, A.; Shaikh, A. Detection of Pneumonia from Chest X-ray Images Utilizing MobileNet Model. Healthcare 2023, 11, 1561. https://doi.org/10.3390/healthcare11111561
Reshan MSA, Gill KS, Anand V, Gupta S, Alshahrani H, Sulaiman A, Shaikh A. Detection of Pneumonia from Chest X-ray Images Utilizing MobileNet Model. Healthcare. 2023; 11(11):1561. https://doi.org/10.3390/healthcare11111561
Chicago/Turabian StyleReshan, Mana Saleh Al, Kanwarpartap Singh Gill, Vatsala Anand, Sheifali Gupta, Hani Alshahrani, Adel Sulaiman, and Asadullah Shaikh. 2023. "Detection of Pneumonia from Chest X-ray Images Utilizing MobileNet Model" Healthcare 11, no. 11: 1561. https://doi.org/10.3390/healthcare11111561