
The Efficacy of Machine-Learning-Supported Smart System for Heart Disease Prediction


 , , , , and
Abstract
:1. Introduction
2. Related Work
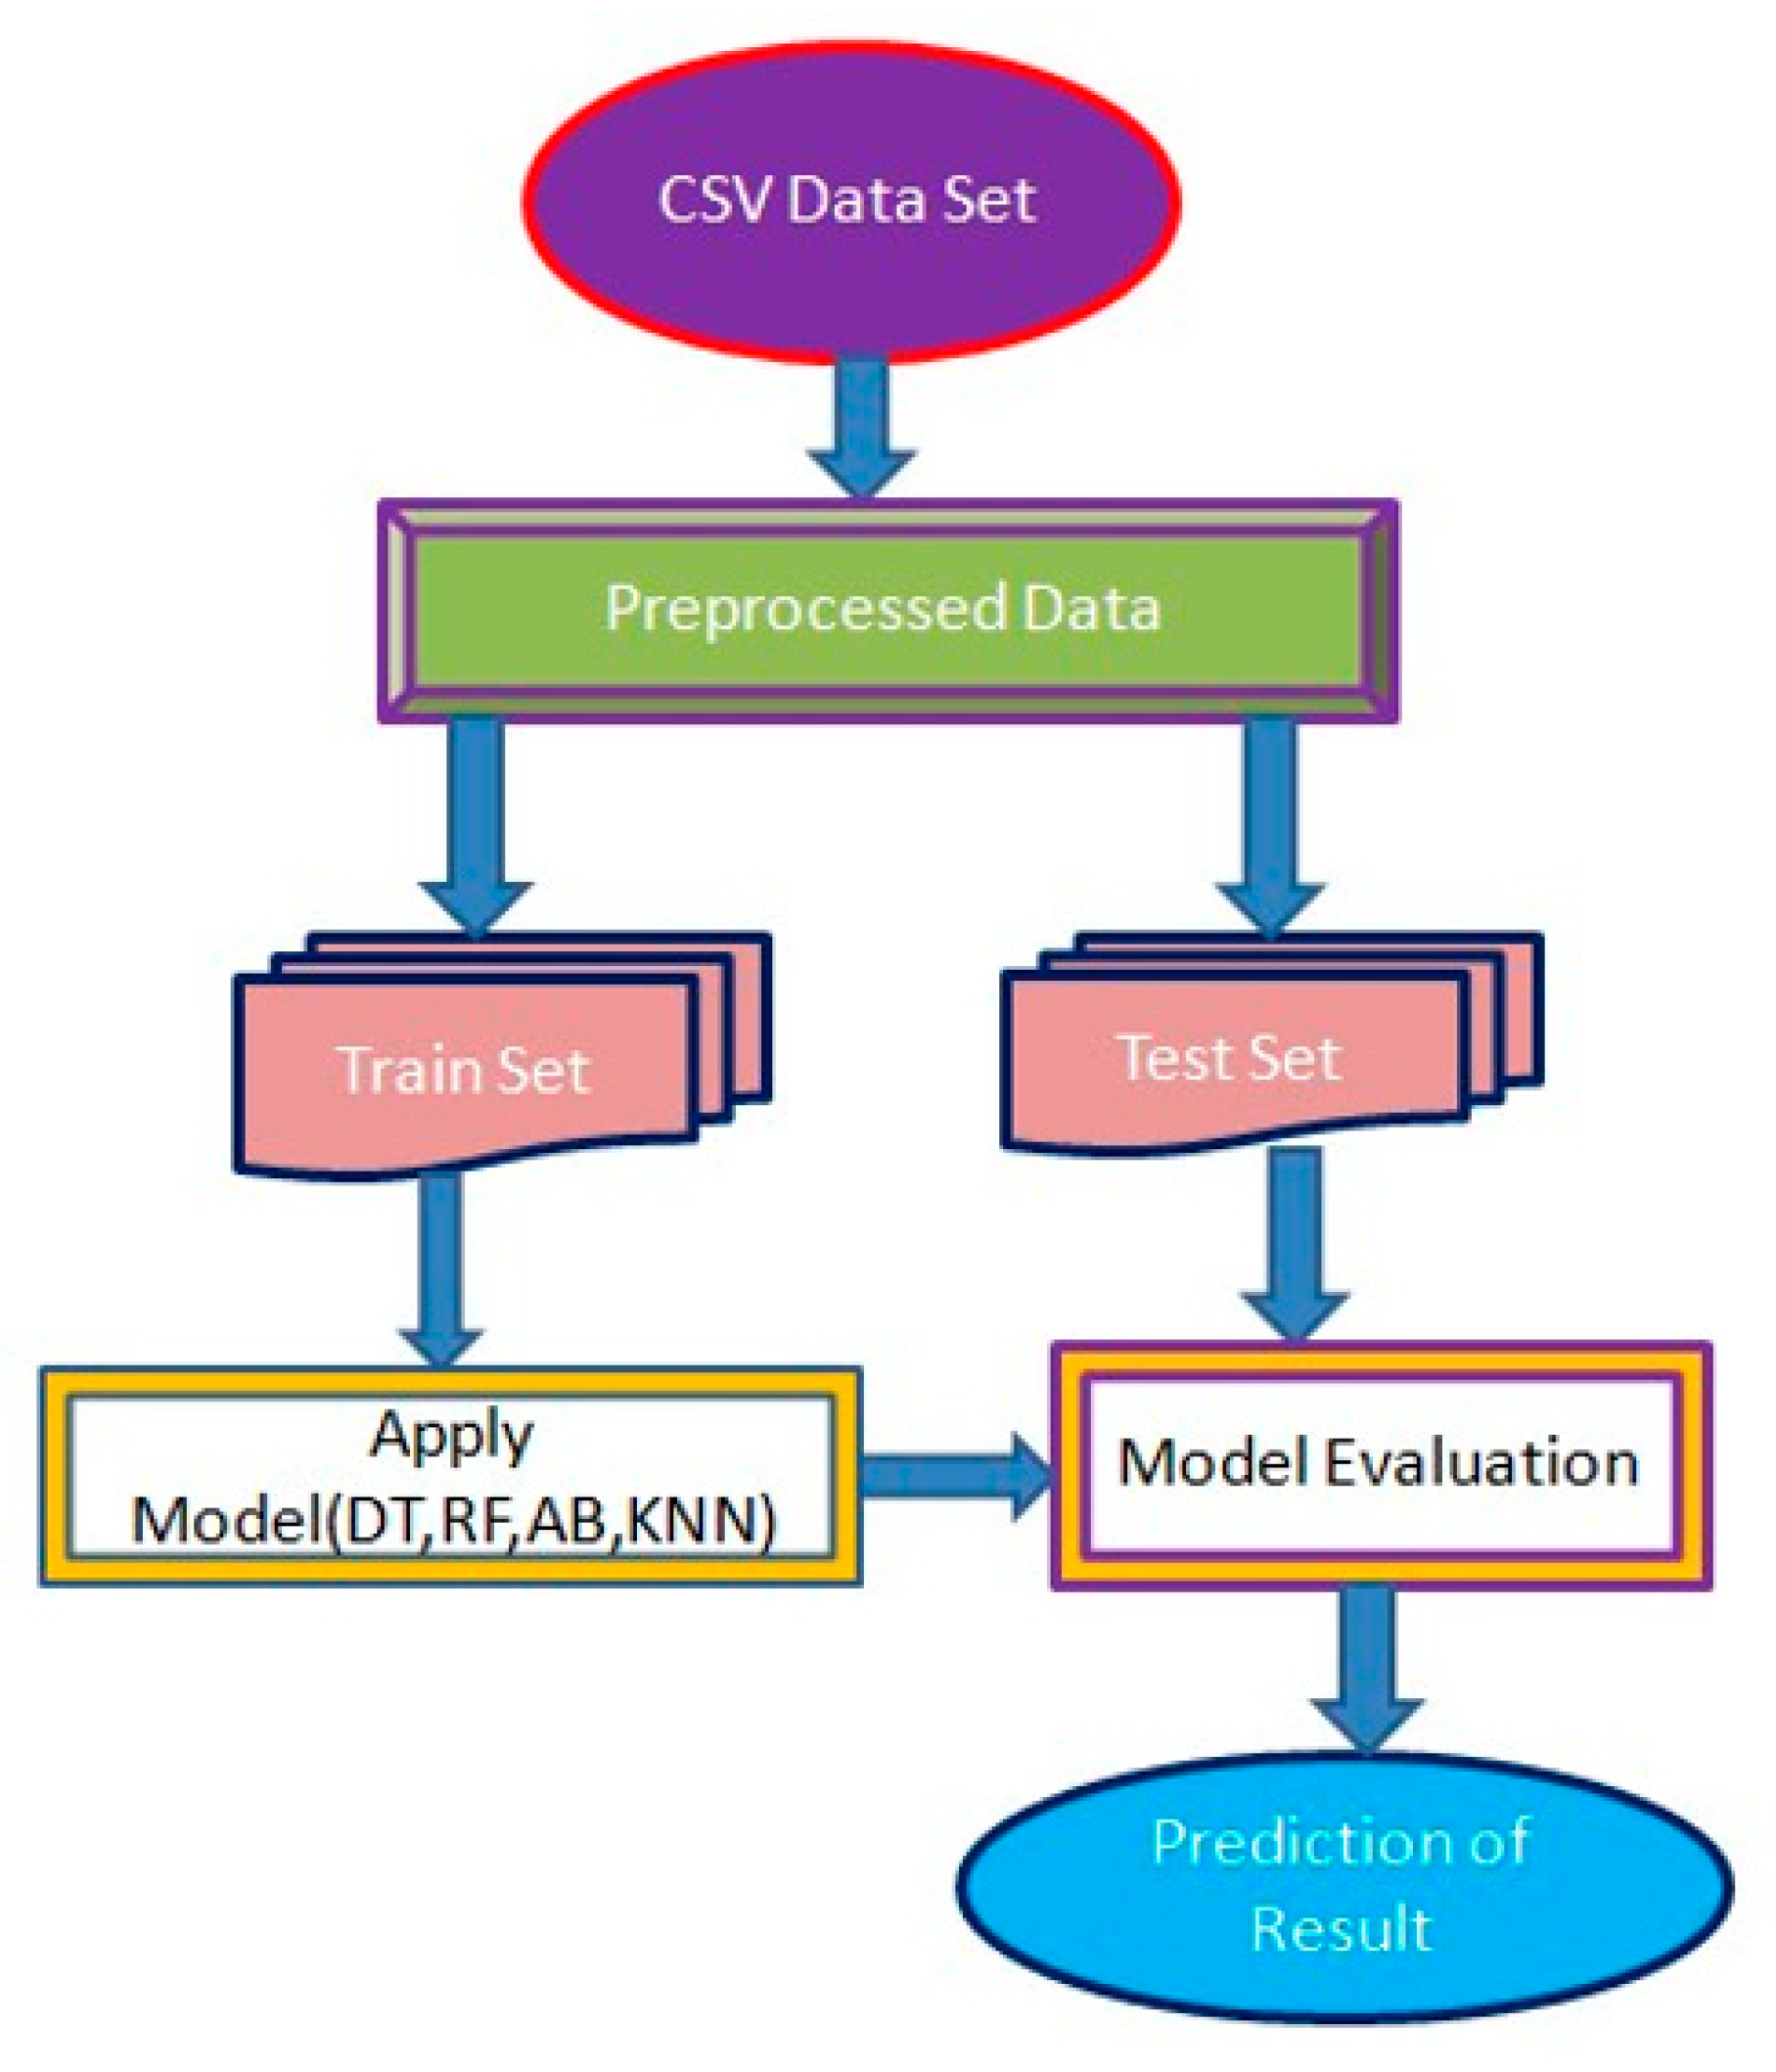
3. Methodology
| Algorithm 1: Algorithms for the CHSLB dataset used in this study. |
| Input: symptoms |
| Output: predict heart disease present or not present |
| 1. If (the model has not been trained), then |
| 2. Dataset load; |
| 3. Correlation of data; |
| 4. Split x and y; |
| 5. Train (70%), test (30%); |
| 6. Load pre-trained model; |
| 7. Educate the model; |
| 8. Save the model that has been trained. |
| 11. Loads trained model if everything else fails; |
| 12. Validate the model using the test data set; |
| 13. Confusion metrics and plot graphs. |
| Algorithm 2: The algorithm for the Cleveland dataset used in this study. |
| Input: symptoms |
| Output: predict heart disease present or not present |
| 1. If (the model has not been trained), then |
| 2. Dataset load; |
| 3. Correlation of data; |
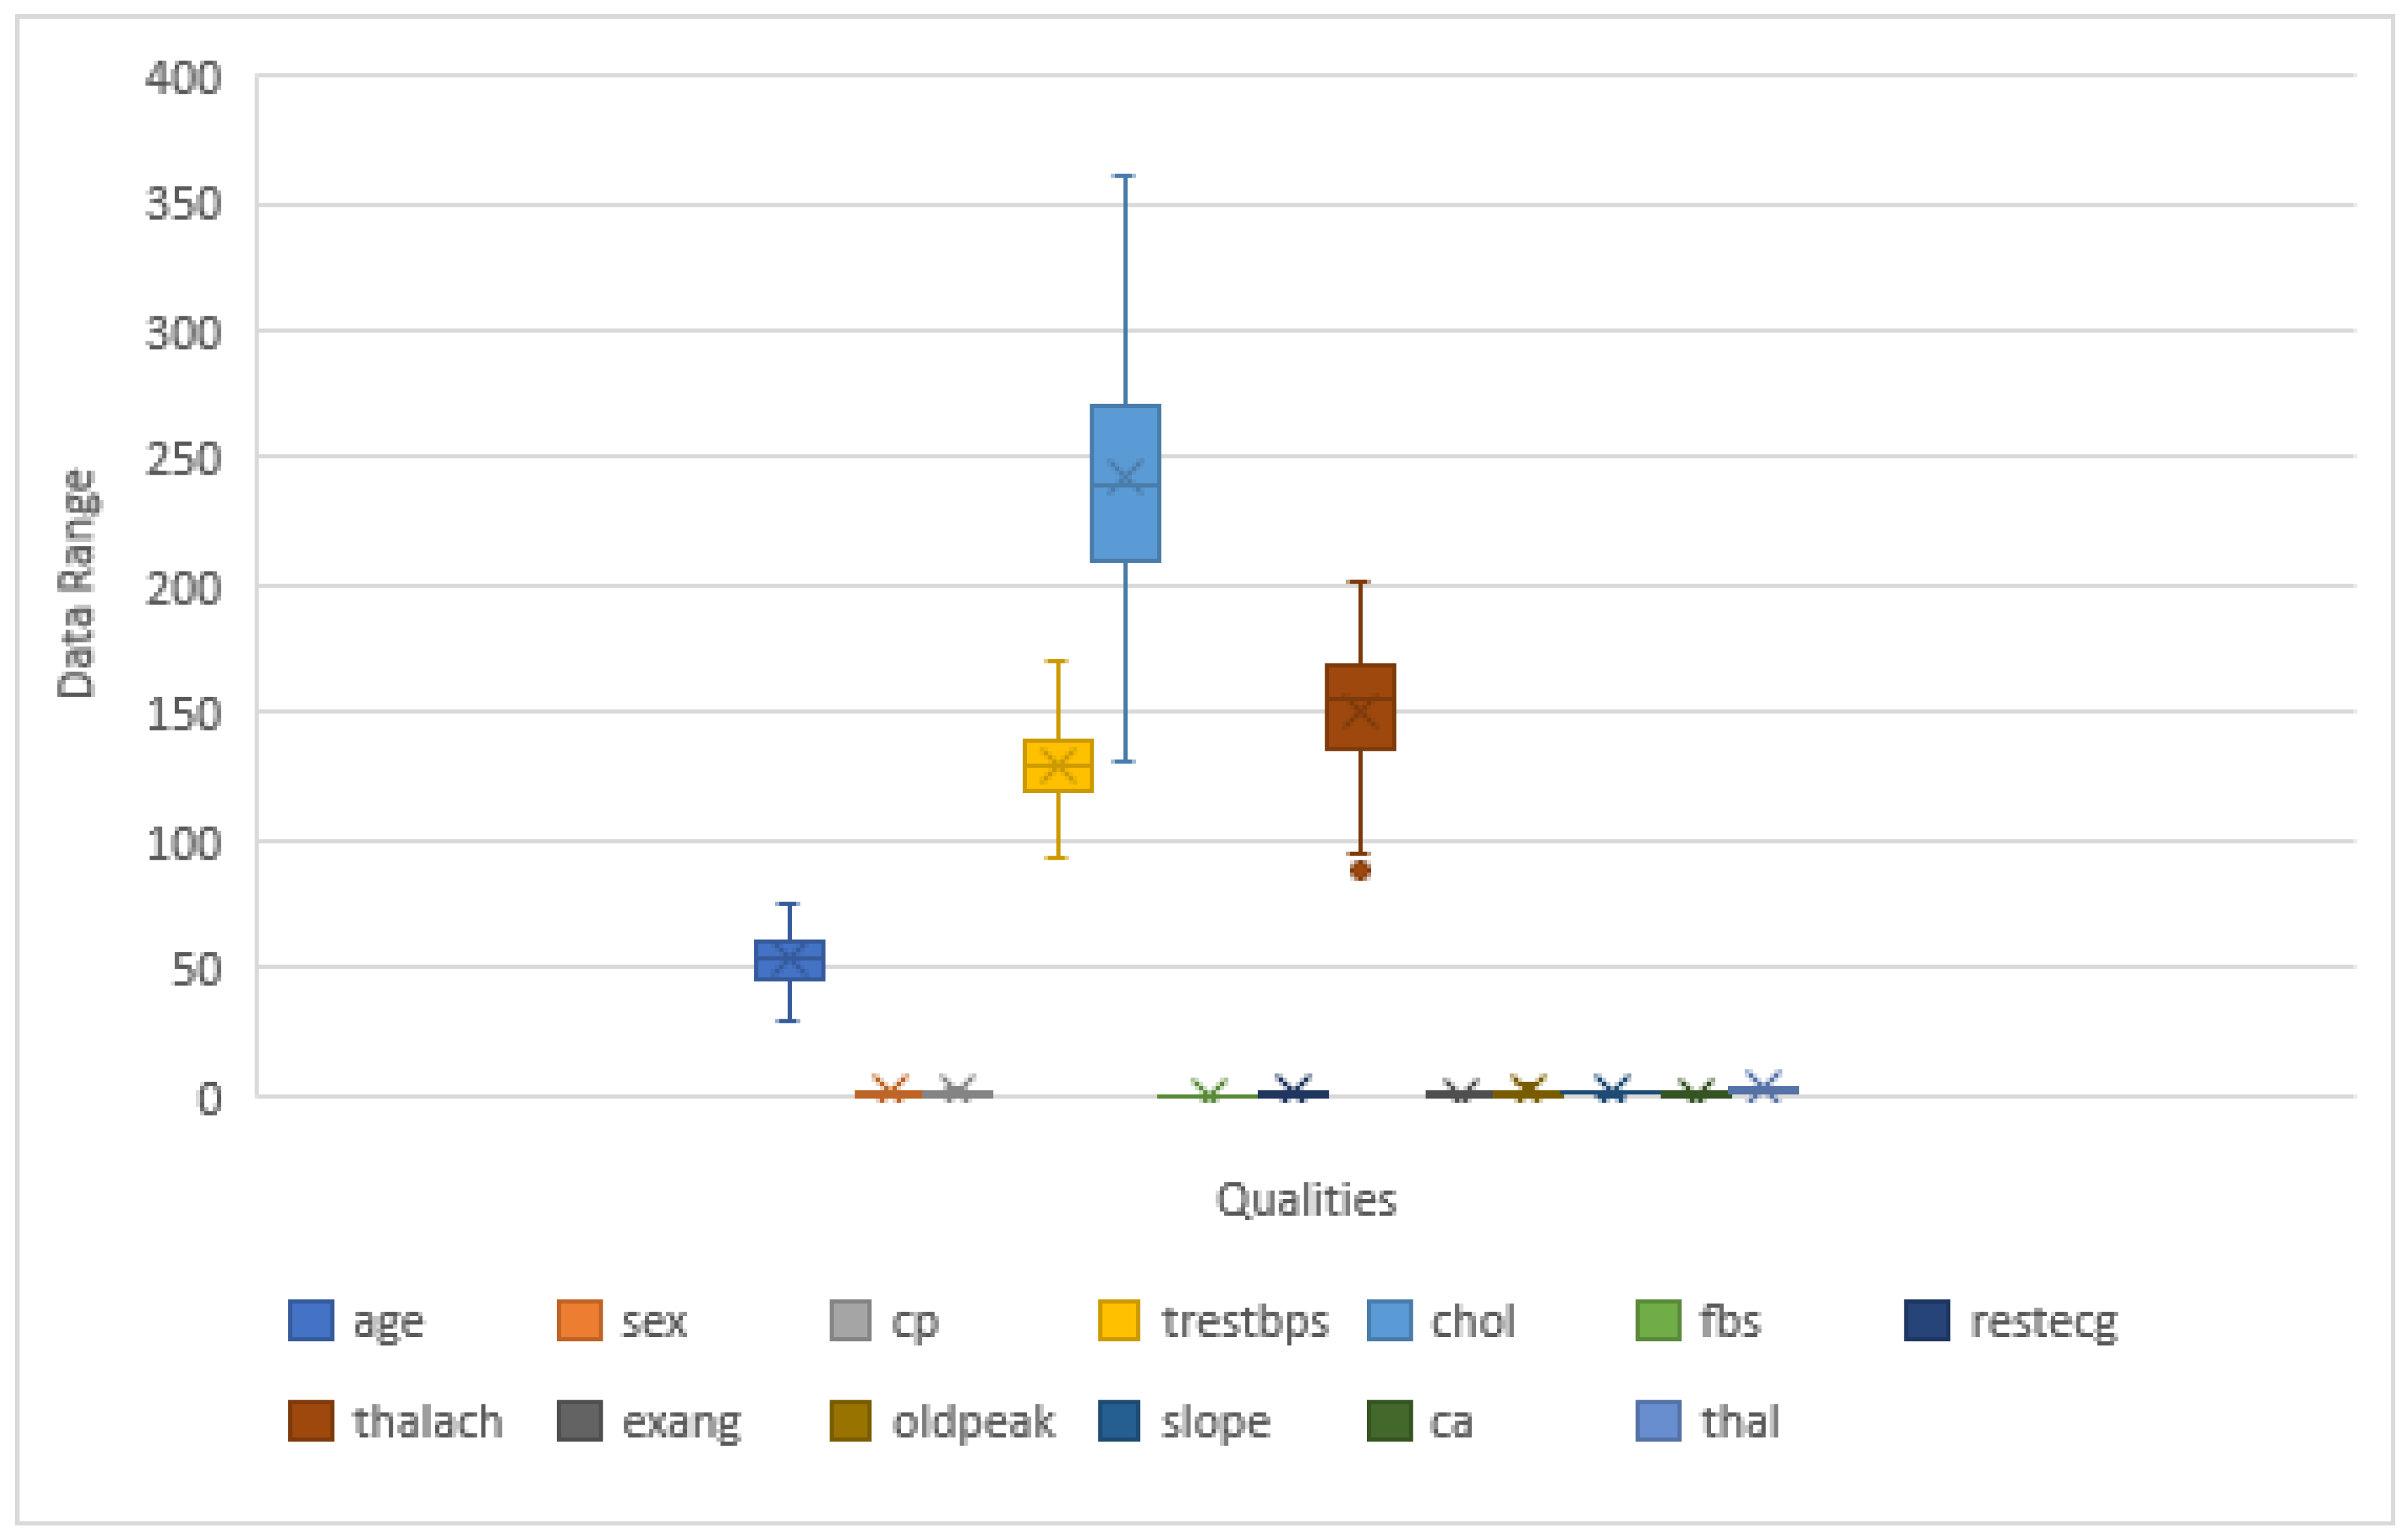
| 4. Check outliers; |
| 5. Remove outliers; |
| 6. Split x and y; |
| 7. Train (80%), test (20%); |
| 8. Load pre-trained model; |
| 9. Educate the model; |
| 10. Save the model that has been trained. |
| 11. Loads trained model if everything else fails; |
| 12. Validate the model using the test data set; |
| 13. Confusion metrics and plot graphs. |
4. Design and Implementation
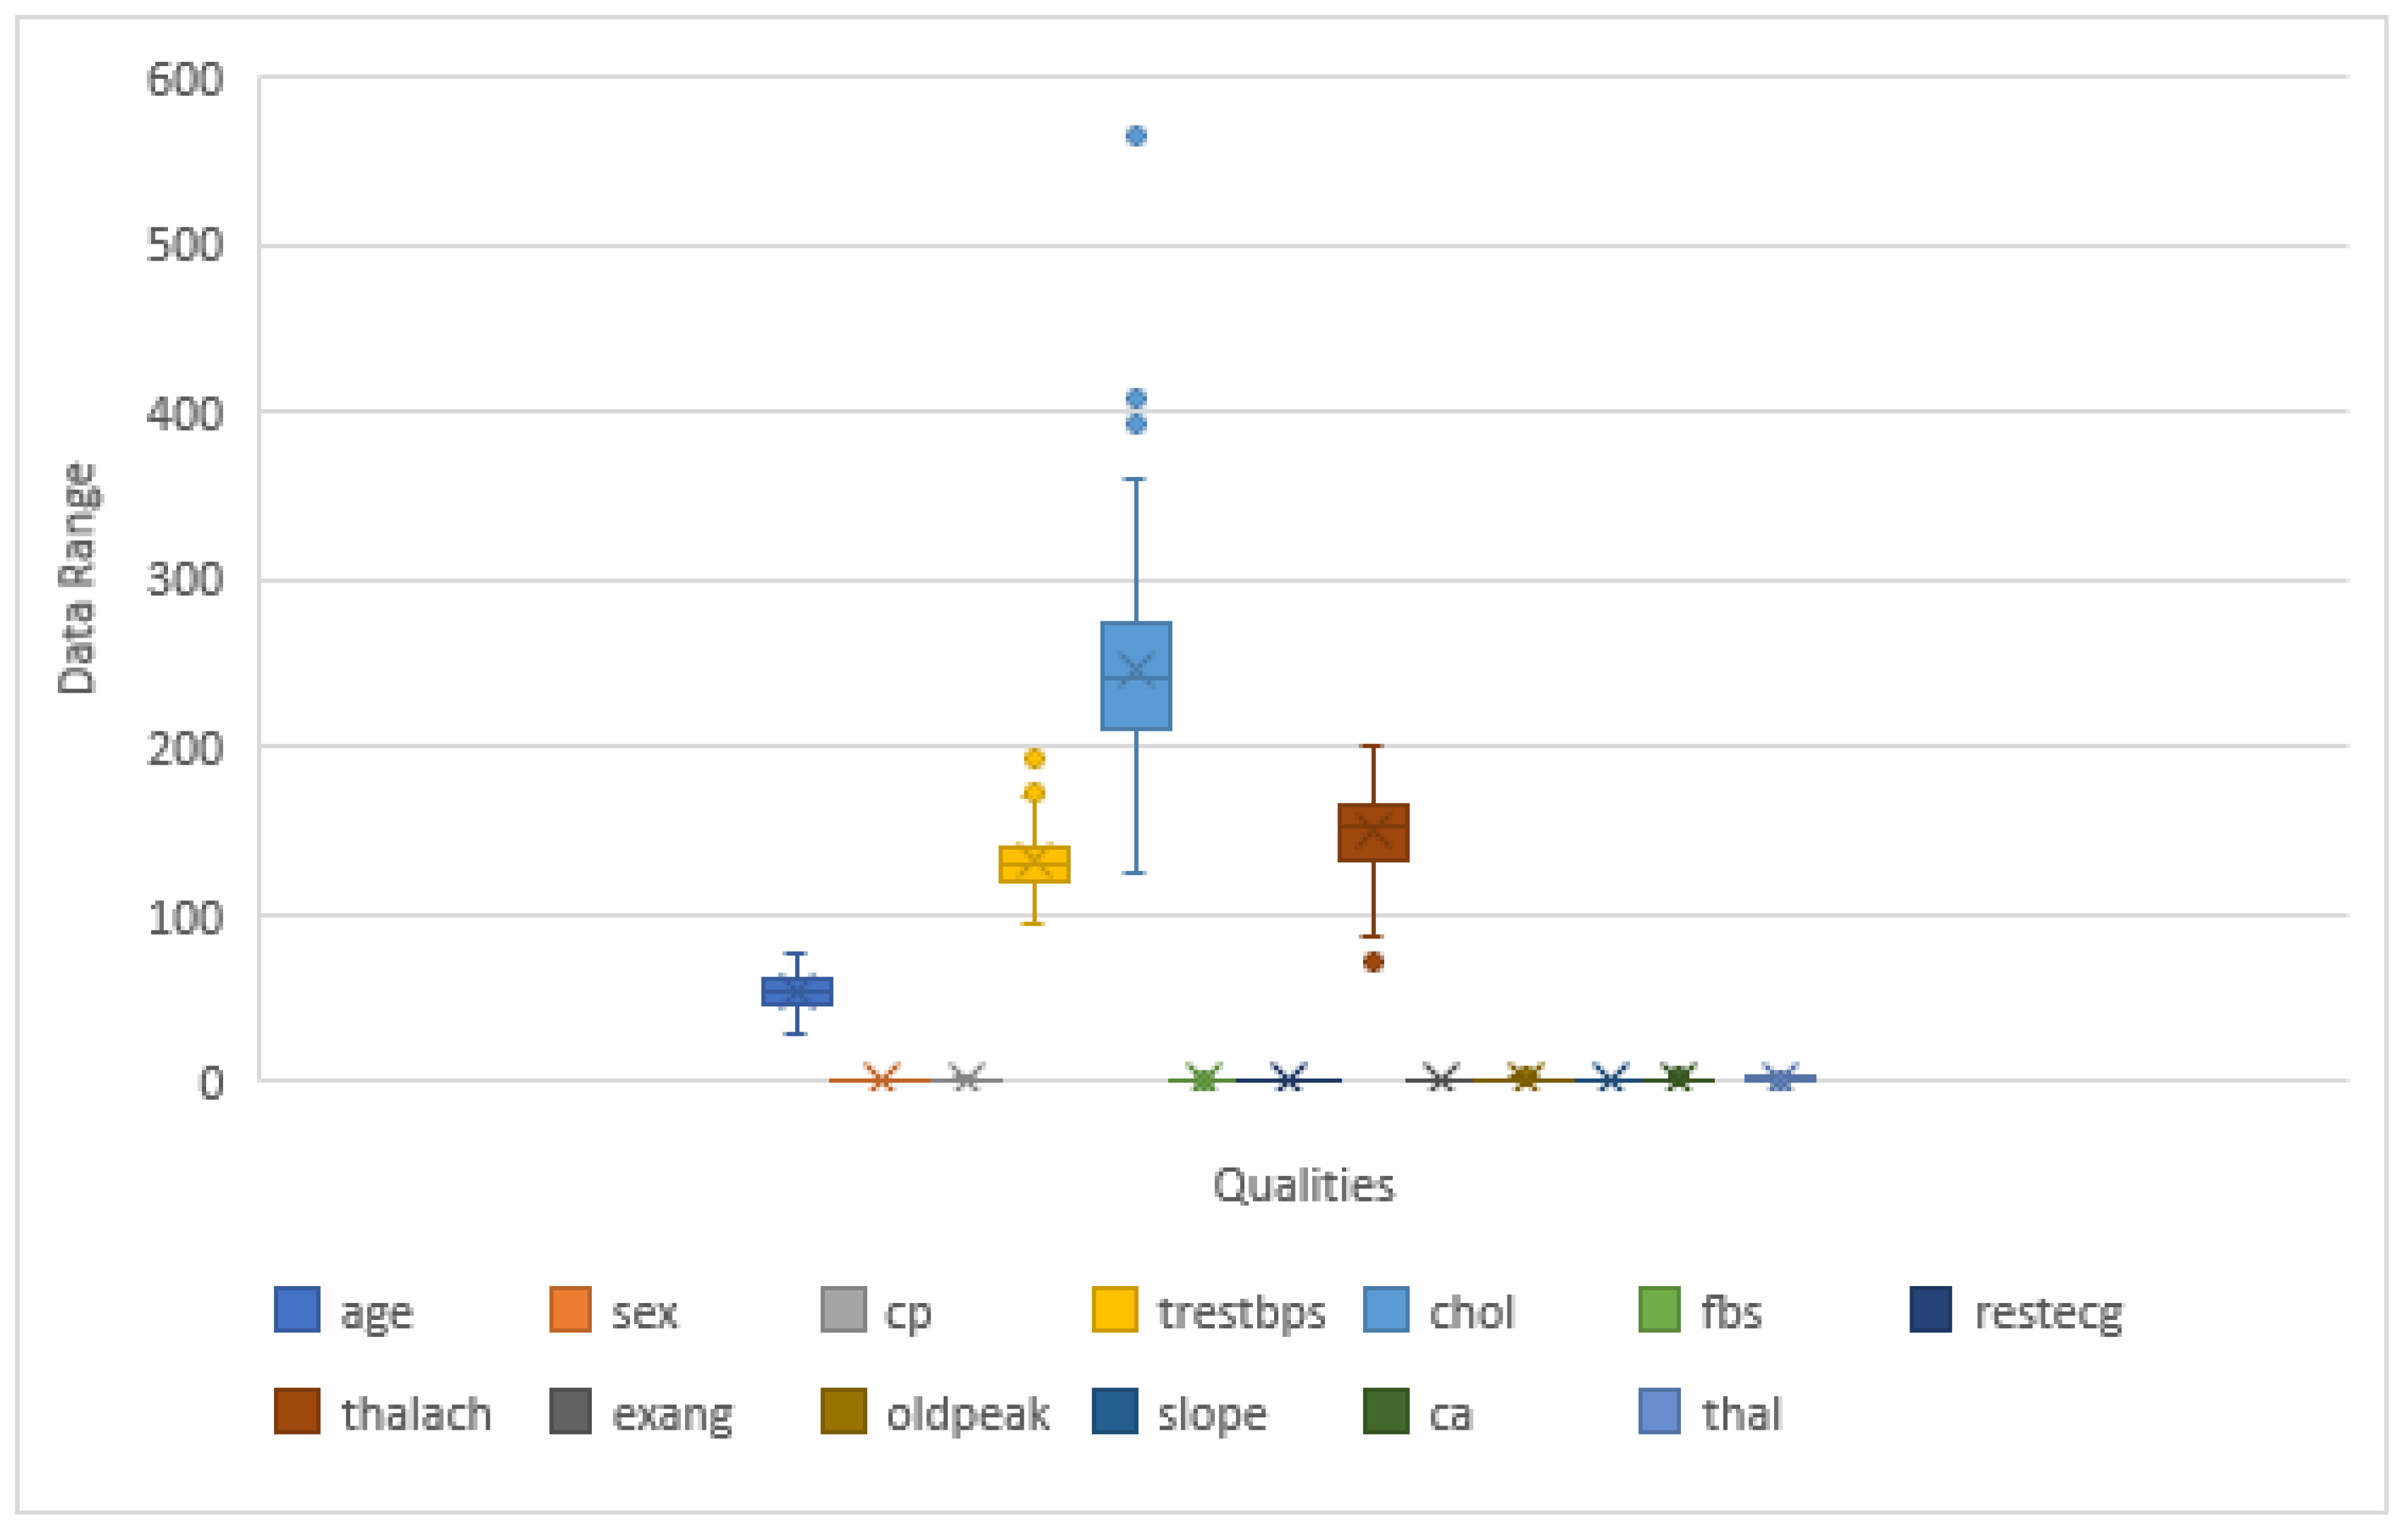
4.1. Dataset
Data Collection
4.2. Implementation of the System
4.3. Experimental Setup
4.4. Data Preprocessing
4.5. Classification Modeling
4.5.1. Random Forest
4.5.2. Decision Tree
4.5.3. Implementation of the Techniques by Using Two Datasets
Combined Cleveland, Hungary, Switzerland, and Long Beach Dataset:
- Criterion: The function to measure the quality of a split supported criteria is “Gini” for the Gini impurity and “entropy” for the information gain. In this paper, the researcher used “entropy”.
- Splitter: The strategy used to choose the split at each node. Supported strategies are “best” to choose the best division and “random” to choose the best random split. In this study, the researcher used “random”.
- Max_features: The numbers of features are “auto”, “sqrt”, and “log2” to think about while deciding on the optimal split. This study used “auto”.
- Criterion: The function for determining a split’s quality. The Gini impurity is supported by the criterion “Gini”, while the criterion “entropy” is a tree-specific parameter. In this study, the researcher used “entropy”.
- Max_samples: The number of samples to draw from X to train the individual base estimator if bootstrap is valid. This study used max_samples = 710.
- n_estimators: The number of estimators at which boosting is stopped. In a perfect match, the learning operation is terminated early. This study used n_estimators = 550.
- Algorithm: The nearest neighbors were computed using an algorithm. We utilized the algorithm “auto” in this investigation.
- Auto: “Auto” tries to find the most appropriate set of rules that are solely on the values exceeded to suit the technique.
- N_jobs: The number of parallel jobs that must be executed to find neighbors. Unless in the context of joblib parallel backend, none indicates 1; –1 indicates that all processors are being used, which is available in the Glossary. The fit technique is unaffected, and this study used n_jobs is 1.
- N_neighbors: The default number of neighbors for K-neighbors queries. This study utilized n neighbors = 10.
- P: The Minkowski metric’s strength element. The p = 1 is identical to the use of Manhattan distance (l1), and p = 2 is comparable in using Euclidean distance (l2). Minkowski distance (l p) is utilized for arbitrary p. This study used p =1.
- Weights: This is the distance to measure and utilize the tree. Minkowski is the default metric, and it is identical to the normal Euclidean metric with p = 2. A list of possible metrics may be found in the distance metric documentation. X is considered to be a distance matrix and must be squared during fit if the metric is “precomputed”. Only nodes with “nonzero” values are considered neighbors if X is a sparse graph. This study utilized a weight to measure “distance” in this analysis.
Cleveland Dataset:
- Max_samples: The number of samples to draw from X to train each base estimator if bootstrap is true. This study used max_samples = 80.
- Criterion: The forest’s total amount of trees. For this study, the criterion is “entropy”.
- N_jobs: The number of parallel jobs must be executed to find neighbors. Unless in the context of joblib parallel backend, none indicates 1; −1 indicates that all processors are being used. The fit technique is unaffected, and for N, jobs are −1 in this study.
- P: The Minkowski metric’s strength parameter. When p = 1, this is identical to the use of Manhattan distance (l1), and when p = 2, this is comparable to the use of the Euclidean distance (l2). Minkowski distance (l p) is utilized for arbitrary p. In this study, the researcher considered p = 1.
- Criterion: The feature is to a degree the exception of a split. Additionally, supported standards are “Gini” for the Gini impurity and “entropy” for the data gain. This parameter is tree-specific. In this study, entropy was used.
- n_estimators: The number of estimators at which boosting is stopped. In the event of a perfect match, the learning operation is terminated early. This study used n estimators = 450.
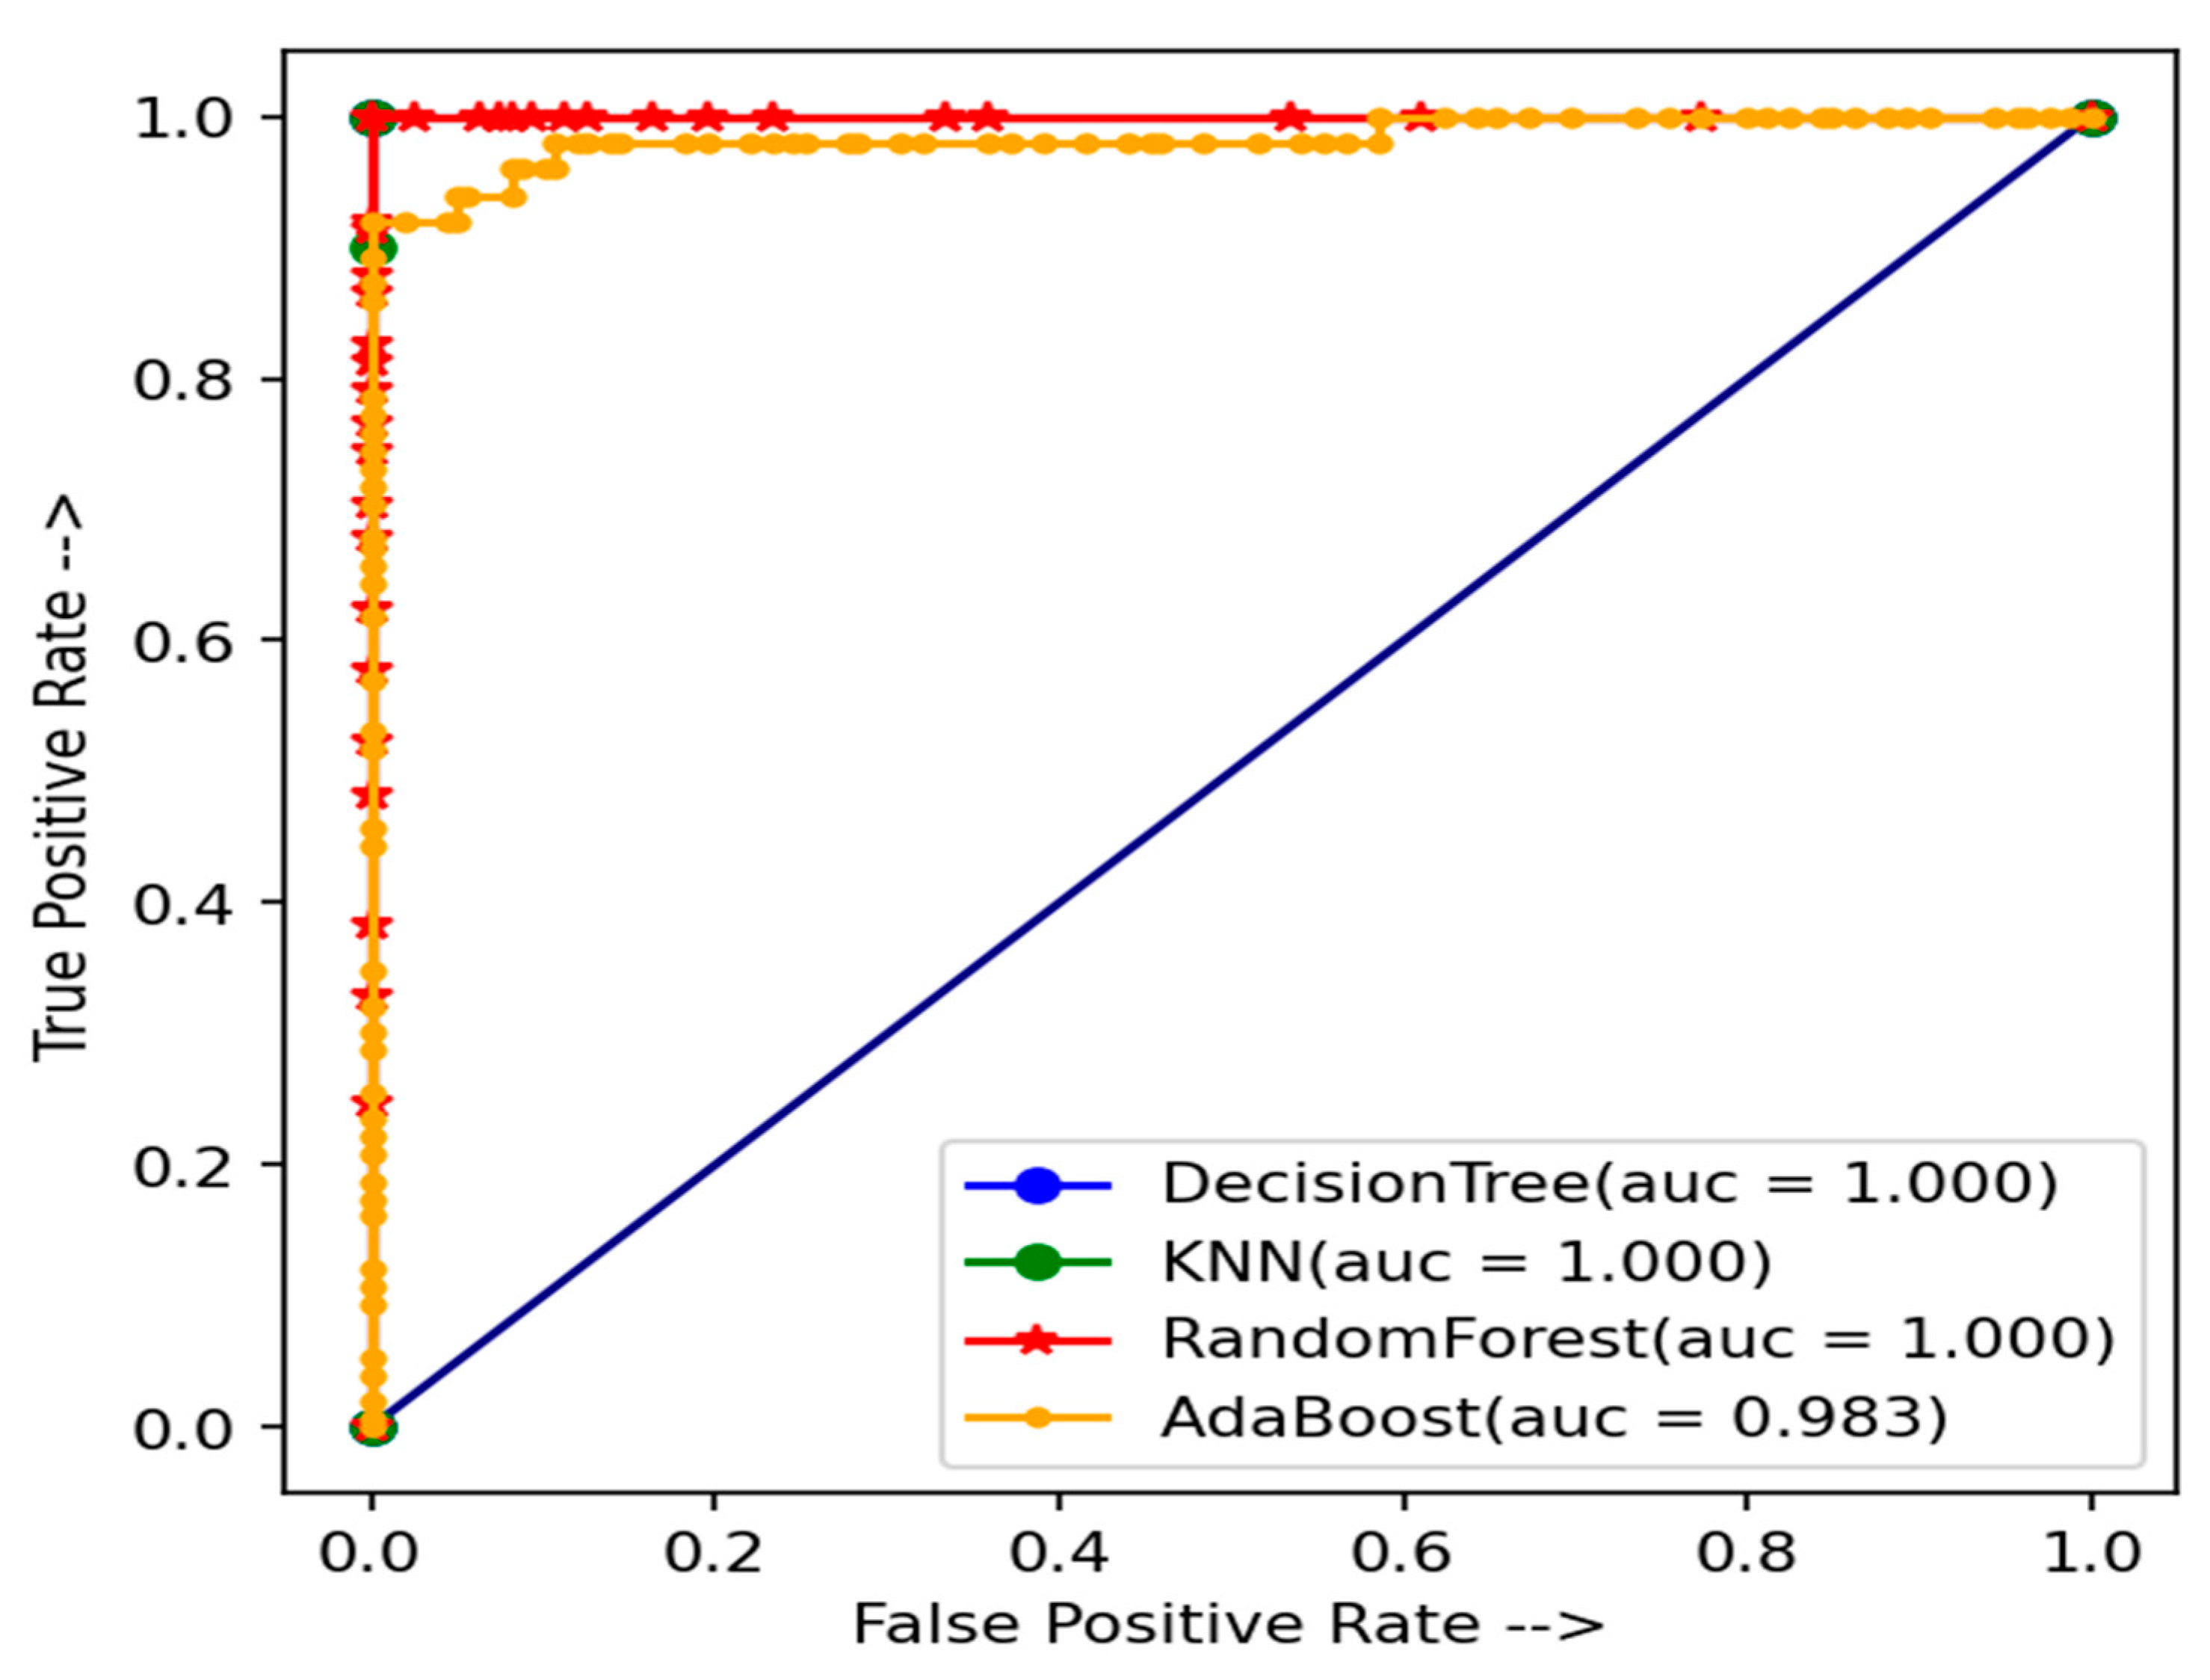
5. Results and Discussion
6. Conclusions
Author Contributions
Funding
Institutional Review Board Statement
Informed Consent Statement
Data Availability Statement
Conflicts of Interest
References
- Cardiometabolic Diseases. 2022. Available online: https://www.who.int/news-room/fact-sheets/detail/cardiovascular-diseases-(cvds) (accessed on 1 March 2022).
- Ayon, S.I.; Islam, M.; Hossain, R. Coronary Artery Heart Disease Prediction: A Comparative Study of Computational Intelligence Techniques. IETE J. Res. 2020, 1–20. [Google Scholar] [CrossRef]
- Ayon, S.I.; Islam, M.M. Diabetes prediction: A deep learning approach. Int. J. Inf. Eng. Electron. Bus. 2019, 11, 21–27. [Google Scholar]
- Manogaran, G.; Varatharajan, R.; Priyan, M.K. Hybrid Recommendation System for Heart Disease Diagnosis based on Multiple Kernel Learning with Adaptive Neuro-Fuzzy Inference System. Multimed. Tools Appl. 2017, 77, 4379–4399. [Google Scholar] [CrossRef]
- Hasan, M.K.; Islam, M.M.; Hashem, M.M.A. Mathematical model development to detect breast cancer using multigene genetic programming. In Proceedings of the 5th International Conference on Informatics, Electronics and Vision (ICIEV), Dhaka, Bangladesh, 13–14 May 2016; pp. 574–579. [Google Scholar]
- Haque, M.R.; Islam, M.M.; Iqbal, H.; Reza, M.S.; Hasan, M.K. Performance evaluation of random forests and artificial neural networks for the classification of Liver disorder. In Proceedings of the International Conference Computer, Communication, Chemical, Material and Electronic Engineering (IC4ME2), Rajshahi, Bangladesh, 8–9 February 2018; pp. 1–5. [Google Scholar]
- Islam, M.; Iqbal, H.; Haque, R.; Hasan, K. Prediction of breast cancer using support vector machine and K-Nearest neighbors. In Proceedings of the 2017 IEEE Region 10 Humanitarian Technology Conference (R10-HTC), Dhaka, Bangladesh, 21–23 December 2017; pp. 226–229. [Google Scholar]
- Kadam, K.; Pooja, V.K.; Amita, P.M. Cardiovascular disease prediction using data mining techniques: A proposed framework using big data approach. In AdvancedMetaheuristic Methods in Big Data Retrieval and Analytics; IGI Globa: Hershey, PA, USA, 2018; pp. 159–179. [Google Scholar]
- Nathan, M.; Kumar, P.M.; Panchatcharam, P.; Manogaran, G.; Varadharajan, R. A novel gini index decision tree data mining method with neural network classifiers for prediction of heart disease. Des. Autom. Embed. Syst. 2018, 22, 225–242. [Google Scholar]
- Shylaja, S.; Muralidharan, R. Comparative analysis of various classification and clustering algorithms for heart disease prediction system. Biom. Bioinf. 2018, 10, 74–77. [Google Scholar]
- Singh, P.; Singh, S.; Pandi-Jain, G.S. Effective heart disease prediction system using data mining techniques. Int. J. Nanomed. 2018, 13, 121–124. [Google Scholar] [CrossRef] [Green Version]
- Maneerat, Y.; Prasongsukarn, K.; Benjathummarak, S.; Dechkhajorn, W.; Chaisri, U. Intersected genes in hyperlipidemia and coronary bypass patients: Feasible biomarkers for coronary heart disease. Atherosclerosis 2016, 252, e183–e184. [Google Scholar] [CrossRef]
- Nakashima, T.; Noguchi, T.; Haruta, S.; Yamamoto, Y.; Oshima, S.; Nakao, K.; Taniguchi, Y.; Yamaguchi, J.; Tsuchihashi, K.; Seki, A. Prognostic impact of spontaneous coronary artery dissection in young female patients with acute myocardial infarction: A report from angina pectoris–myocardial infarction multicenter investigators in Japan. Int. J. Cardiol. 2016, 207, 341–348. [Google Scholar] [CrossRef] [Green Version]
- Zebrack, J.S.; Anderson, J.L.; Maycock, C.A.; Horne, B.D.; Bair, T.L.; Muhlestein, J.B.; Group, I.H.C.I.S. Usefulness of high-sensitivity C-reactive protein in predicting long-term risk of death or acute myocardial infarction in patients with unstable or stable angina pectoris or acute myocardial infarction. Am. J. Cardiol. 2002, 89, 145–149. [Google Scholar] [CrossRef]
- Kannel, W.B.; Gordon, T.; Castelli, W.P.; Margolis, J.R. Electrocardiographic left ventricular hypertrophy and risk of coronary heart disease. The Framingham study. Ann. Intern. Med. 1970, 72, 813–822. [Google Scholar] [CrossRef]
- Cook, S.; Ladich, E.; Nakazawa, G.; Eshtehardi, P.; Neidhart, M.; Vogel, R.; Togni, M.; Wenaweser, P.; Billinger, M.; Seiler, C. Correlation of intravascular ultrasound findings with histopathological analysis of thrombus aspirates in patients with very late drug-eluting stent thrombosis. Circulation 2009, 120, 391–399. [Google Scholar] [CrossRef] [PubMed]
- Nissen, S.E.; Tuzcu, E.M.; Libby, P.; Thompson, P.D.; Ghali, M.; Garza, D.; Berman, L.; Shi, H.; Buebendorf, E.; Topol, E.J. Effect of antihypertensive agents on cardiovascular events in patients with coronary disease and normal blood pressure: The CAMELOT study: A randomized controlled trial. JAMA 2004, 292, 2217–2225. [Google Scholar] [CrossRef] [Green Version]
- Bonow, R.O.; Carabello, B.A.; Chatterjee, K.; de Leon, A.C.; Faxon, D.P.; Freed, M.D.; Gaasch, W.H.; Lytle, B.W.; Nishimura, R.A.; O’Gara, P.T.; et al. 2008 Focused update incorporated into the ACC/AHA 2006 guidelines for the management of patients with valvular heart disease: A report of the American College of Cardiology/ American Heart Association Task Force on Practice Guidelines (writing committee to revise the 1998 guidelines for the management of patients with valvular heart disease) endorsed by the Society of Cardiovascular Anesthesiologists, Society for Cardiovascular Angiography and Interventions, and Society of Thoracic Surgeons. J. Am. Coll. Cardiol. 2008, 52, e1–e142. [Google Scholar] [PubMed] [Green Version]
- Narain, R.; Saxena, S.; Goyal, A.K. Cardiovascular risk prediction: A comparative study of Framingham and quantum neural network based approach. Patient Prefer. Adherence 2016, 10, 1259–1270. [Google Scholar] [CrossRef] [Green Version]
- Wu, R.; Peters, W.; Morgan, M.W. The next generation of clinical decision support: Linking evidence to best practice. J. Healthc. Inf. Manag. 2002, 16, 50–55. [Google Scholar]
- Acharya, U.R.; Faust, O.; Kadri, N.A.; Suri, J.S.; Yu, W. Automated identification of normal and diabetes heart rate signals using nonlinear measures. Comput. Biol. Med. 2013, 43, 1523–1529. [Google Scholar] [CrossRef]
- Barbieri, C.; Mari, F.; Stopper, A.; Gatti, E.; Escandell-Montero, P.; Martínez-Martínez, J.M.; Martín-Guerrero, J.D. A new machine learning approach for predicting the response to anemia treatment in a large cohort of end-stage renal disease patients undergoing dialysis. Comput. Biol. Med. 2015, 61, 56–61. [Google Scholar] [CrossRef]
- Robson, B.; Boray, S. Implementation of a web-based universal exchange and inference language for medicine: Sparse data, probabilities, and inference in data mining of clinical data repositories. Comput. Biol. Med. 2015, 66, 82–102. [Google Scholar] [CrossRef]
- Shenas, S.A.I.; Raahemi, B.; Tekieh, M.H.; Kuziemsky, C. Identifying high-cost patients using data mining techniques and a small set of non-trivial attributes. Comput. Biol. Med. 2014, 53, 9–18. [Google Scholar] [CrossRef]
- Kim, J.K.; Lee, J.S.; Park, D.K.; Lim, Y.S.; Lee, Y.H.; Jung, E.Y. Adaptive mining prediction model for content recommendation to coronary heart disease patients. Clust. Comput. 2014, 17, 881–891. [Google Scholar] [CrossRef]
- Azar, A.T.; Hassanien, A.E. Dimensionality reduction of medical big data using neural-fuzzy classifier. Soft Comput. 2014, 19, 1115–1127. [Google Scholar] [CrossRef]
- Peter, A.K. Fuzzy Set Theory in Medical Diagnosis. IEEE Trans. Syst. Man Cybern. 1986, 16, 260–265. [Google Scholar]
- Jothi, G.; Inbarani, H.H.; Azar, A.T. Hybrid Tolerance Rough Set: PSO Based Supervised Feature Selection for Digital Mammogram mages. Int. J. Fuzzy Syst. Appl. 2013, 3, 15–30. [Google Scholar] [CrossRef] [Green Version]
- Inbarani, H.H.; Banu, P.K.N.; Azar, A.T. Feature selection using swarm-based relative reduct technique for fetal heart rate. Neural Comput. Appl. 2014, 25, 793–806. [Google Scholar] [CrossRef]
- Inbarani, H.H.; Azar, A.T.; Jothi, G. Supervised hybrid feature selection based on PSO and rough sets for medical diagnosis. Comput. Methods Programs Biomed. 2014, 113, 175–185. [Google Scholar] [CrossRef]
- Lim, J.S. Finding Features for Real-Time Premature Ventricular Contraction Detection Using a Fuzzy Neural Network System. IEEE Trans. Neural Netw. 2009, 20, 522–527. [Google Scholar] [CrossRef]
- Exarchos, T.P.; Tzallas, A.T. EEG Transient Event Detection and Classification Using Association Rules. IEEE Trans. Inf. Technol. Biomed. 2006, 10, 451–457. [Google Scholar] [CrossRef]
- Ghosh-Dastidar, S.; Adeli, H.; Dadmehr, N. Principal Component Analysis-Enhanced Cosine Radial Basis Function Neural Network for Robust Epilepsy and Seizure Detection. IEEE Trans. Biomed. Eng. 2008, 55, 512–518. [Google Scholar] [CrossRef]
- Verma, L.; Srivastava, S.; Negi, P.C. A Hybrid Data Mining Model to Predict Coronary Artery Disease Cases Using Non-Invasive Clinical Data. J. Med. Syst. 2016, 40, 178. [Google Scholar] [CrossRef]
- Zhao, Z.; Ma, C. An intelligent system for noninvasive diagnosis of coronary artery disease with EMD-TEO and BP neural network. In Proceedings of the International Workshop on Education Technology and Training & 2008 International Workshop on Geoscience and Remote Sensing, Shanghai, China, 21–22 December 2008; pp. 631–635. [Google Scholar]
- Akay, M. Noninvasive diagnosis of coronary artery disease using a neural network algorithm. Biol. Cybern. 1992, 67, 361–367. [Google Scholar] [CrossRef]
- Kukar, M.; Kononenko, I.; Grošelj, C.; Kralj, K.; Fettich, J. Analyzing and improving the diagnosis of ischaemic heart disease with machine learning. Artif. Intell. Med. 1999, 16, 25–50. [Google Scholar] [CrossRef]
- Detrano, R.; Janosi, A.; Steinbrunn, W.; Pfisterer, M.; Schmid, J.J.; Sandhu, S.; Guppy, K.H.; Lee, S.; Froelicher, V. International application of a new probability algorithm for the diagnosis of coronary artery disease. Am. J. Cardiol. 1989, 64, 304–310. [Google Scholar] [CrossRef]
- Tan, P.N. Introduction to Data Mining; Pearson Addison Wesley: San Francisco, CA, USA, 2008. [Google Scholar]
- Witten, I.H.; Frank, E.; Hall, M.A. Data Mining: Practical Machine Learning Tools and Techniques, 3rd ed.; Morgan Kaufmann/Elsevier: Burlington, NJ, USA, 2011. [Google Scholar]
- Chadha, R.; Mayank, S.; Vardhan, A.; Pradhan, T. Application of Data Mining Techniques on Heart Disease Prediction: A Survey. In Emerging Research in Computing, Information, Communication and Applications; Springer: New Delhi, India, 2015; pp. 413–426. [Google Scholar]
- Fan, J.; Zhang, Q.; Zhu, J.; Zhang, M.; Yang, Z.; Cao, H. Robust deep auto-encoding Gaussian process regression for unsupervised anomaly detection. Neurocomputing 2020, 376, 180–190. [Google Scholar] [CrossRef]
- Nachman, B.; Shih, D. Anomaly detection with density estimation. Phys. Rev. D 2020, 101, 075042. [Google Scholar] [CrossRef] [Green Version]
- Sarker, I.H.; Abushark, Y.B.; Alsolami, F.; Khan, A.I. IntruDTree: A Machine Learning Based Cyber Security Intrusion Detection Model. Symmetry 2020, 12, 754. [Google Scholar] [CrossRef]
- Tu, B.; Yang, X.; Li, N.; Zhou, C.; He, D. Hyperspectral anomaly detection via density peak clustering. Pattern Recognit. Lett. 2019, 129, 144–149. [Google Scholar] [CrossRef]
- Mohan, S.; Thirumalai, C.; Srivastava, G. Effective Heart Disease Prediction Using Hybrid Machine Learning Techniques. IEEE Access 2019, 7, 81542–81554. [Google Scholar] [CrossRef]
- Avlopoulos, S.; Delopoulos, A. Designing and implementing the transition to a fully digital hospital. IEEE Trans. Inf. Technol. Biomed. 1999, 3, 6–19. [Google Scholar] [CrossRef]
- Kim, J.K.; Kang, S. Neural Network-Based Coronary Heart Disease Risk Prediction Using Feature Correlation Analysis. J. Health Eng. 2017, 2017, 1–13. [Google Scholar] [CrossRef]
- Malav, A.; Kadam, K.; Kamat, P. Prediction of heart disease using kb means and artificial neural network as a hybrid approach to improve accuracy. Int. J. Eng. Technol. 2017, 9, 3081–3085. [Google Scholar] [CrossRef] [Green Version]
- KarayÕlan, T.; KÕlÕç, Ö. Prediction of Heart Disease Using Neural Network. In Proceedings of the 2017 International Conference on Computer Science and Engineering (UBMK), Antalya, Turkey, 5–8 October 2017; pp. 719–723. [Google Scholar]
- Saxena, K.; Sharma, R. Efficient Heart Disease Prediction System. Procedia Comput. Sci. 2016, 85, 962–969. [Google Scholar] [CrossRef] [Green Version]
- Almustafa, K.M. Prediction of heart disease and classifiers’ sensitivity analysis. BMC Bioinform. 2020, 21, 1–18. [Google Scholar] [CrossRef] [PubMed]
- Shankar, V.; Kumar, V.; Devagade, U.; Karanth, V.; Rohitaksha, K. Heart Disease Prediction Using CNN Algorithm. SN Comput. Sci. 2020, 1, 1–8. [Google Scholar] [CrossRef]
- Ripan, R.C.; Sarker, I.H.; Furhad, H.; Musfique Anwar, M.; Hoque, M.M. An Effective Heart Disease Prediction Model based on Machine Learning Techniques. In International Conference on Hybrid Intelligent Systems; Springer: Cham, Switzerland, 2020; pp. 280–288. [Google Scholar]
- Kumar, S.S.U.; Inbarani, H.H. A novel neighborhood rough set-based classification approach for medical diagnosis. Procedia Comput. Sci. 2015, 47, 351–359. [Google Scholar] [CrossRef] [Green Version]
- Rajathi, S.; Radhamani, G. Prediction and analysis of Rheumatic heart disease using KNN classification with ACO. In Proceedings of the International conference on data mining and advanced computing (SAPIENCE), Ernakulam, India, 16–18 March 2016; pp. 68–73. [Google Scholar]
- Sharma, V.; Rasool, A.; Hajela, G. Prediction of Heart disease using DNN. In Proceedings of the 2020 Second International Conference on Inventive Research in Computing Applications (ICIRCA), Coimbatore, India, 15–17 July 2020; pp. 554–562, ISBN 978-1-7281-5374-2. [Google Scholar]
- Amin, S.U.; Agarwal, K.; Beg, R. Genetic neural network-based data mining in the prediction of heart disease using risk factors. In Proceedings of the 2003 IEEE Information and Communication Technologies (ICT), Thuckalay, India, 11–12 April 2013; pp. 1227–1231. [Google Scholar]
- Sonawane, J.S.; Patil, D.R. Prediction of heart disease using multilayer perceptron neural network. In Proceedings of the International Conference on Information Communication and Embedded Systems (ICICES2014), Chennai, India, 27–28 February 2014; pp. 1–6. [Google Scholar] [CrossRef]
- Cheng, C.; Chiu, H. An artificial neural network model for the evaluation of carotid artery stenting prognosis using a National- Wide Database. In Proceedings of the 39th Annual International Conference of the IEEE Engineering in Medicine and Biology Society (EMBC), Jeju, Korea, 11–15 July 2017; pp. 2566–2569. [Google Scholar]
- Kelwade, J.P.; Salankar, S.S. Radial basis function neural network for prediction of cardiac arrhythmias based on heart rate time series. In Proceedings of the 2016 IEEE First International Conference on Control, Measurement and Instrumentation (CMI), Kolkata, India, 8–10 January 2016; pp. 454–458. [Google Scholar] [CrossRef]
- Ketkar, N. Introduction to Keras. In Deep Learning with Python; Springer Apress: Berkeley, CA, USA, 2017; pp. 97–111. [Google Scholar]
- Heart Disease UCI|Kaggle. Available online: http://www.kaggle.com/ronitf/heart-disease-uci (accessed on 13 February 2020).
- Heart Disease Dataset. Available online: https://www.kaggle.com/johnsmith88/heart-disease-dataset (accessed on 1 March 2022).
- Rashmi, G.O.; Kumar, U.M.A. Machine learning methods for heart disease prediction. Int. J. Eng. Adv. Technol. 2019, 8, 220–223. [Google Scholar]
- Dinesh, K.G.; Arumugaraj, K.; Santhosh, K.D.; Mareeswari, V. Prediction of cardiovascular disease using machine learning algorithms. In Proceedings of the 2018 International Conference on Current Trends towards Converging Technologies (ICCTCT), Coimbatore, India, 1–3 March 2018; pp. 1–7. [Google Scholar]
- Sharma, S.; Parmar, M. Heart disease prediction using deep learning neural network model. In Proceedings of the 2020 International Conference on Inventive Computation Technologies (ICICT), Coimbatore, India, 26–28 February 2020; pp. 1–5. [Google Scholar]
- Enriko, I.K.A. Comparative study of heart disease diagnosis using top ten data mining classification algorithms. In Proceedings of the 5th International Conference on Frontiers of Educational Technologies, Beijing, China, 1–3 June 2019; pp. 159–164. [Google Scholar]
- Saqlain, M.; Hussain, W.; Saqib, N.A.; Khan, M.A. Identification of heart failure by using unstructured data of cardiac patients. In Proceedings of the 2016 45th International Conference on Parallel Processing Workshops (ICPPW), Philadelphia, PA, USA, 16–19 August 2016; pp. 426–431. [Google Scholar]
- Dwivedi, A.K. Evaluate the performance of different machine learning techniques for prediction of heart disease using ten-fold cross validation. Neural Comput. Appl. 2016, 29, 685–693. [Google Scholar] [CrossRef]
- Kaur, A. A comprehensive approach to predicting heart diseases using data mining. Int. J. Innov. Eng. Technol. 2017, 8, 1–5. [Google Scholar]
- Xu, S.; Zhang, Z.; Wang, D.; Hu, J.; Duan, X.; Zhu, T. Cardiovascular Risk Prediction Method Based on CFS Subset Evaluation and Random Forest Classification Framework. In Proceedings of the 2017 IEEE 2nd International Conference on Big Data Analysis, Beijing, China, 10–12 March 2017; pp. 228–232. [Google Scholar]
- Shahin, A.; Moudani, W.; Chakik, F.; Khalil, M. Data Mining in Healthcare Information Systems: Case Studies in Northern Lebanon. In Proceedings of the Third International Conference on e-Technologies and Networks for Development (ICeND2014), Beirut, Lebanon, 29 April 2014–1 May 2014; pp. 151–155, ISBN 978-1-4799-3166-8. [Google Scholar]
- Gupta, N.; Dharmale, G.; Parmar, D. Heart disease Prediction using Machine Learning. J. Emerg. Technol. Innov. Res. (JETIR) 2021, 8, 2818–2825. [Google Scholar]


| Si. No. | Qualities | Variety | Standard |
|---|---|---|---|
| (i) | Age | Integer | 29–77 |
| (ii) | Sex | Integer | male = 1; female = 0 |
| (iii) | Chest pain type | Integer | angina = 0; abnanr = 1; |
| notang = 2; | |||
| asympt = 3 | |||
| (iv) | Blood pressure value | Integer | 94–200 |
| (v) | Serum cholesterol | Integer | 126–564 |
| (vi) | Fasting blood sugar | Integer | true = 1; false = 0 |
| (vii) | Resting electro-cardiographic results | Integer | 0–2 |
| (viii) | Maximum heart rate | Integer | 71–202 |
| (x) | Old peak | Float | 0.0–6.2 |
| (xi) | The slant of the peak exercise ST segment | Integer | upsloping = 0; flat = 1; |
| Down sloping = 2 | |||
| (xii) | Number of major vessels | Integer | 0–4 |
| Exercise-induced angina | integer | 1 = yes; 0 = no | |
| (xiii) | Thal | Integer | |
| defect = 6; reversible | |||
| defect = 7 | |||
| (xiv) | Coronary heart disease | Integer | present = 1; absent = 0 |
| Sr. No. | Used Model for CHSLB Datasets | Predicted Value (Actual Class) | Predicted Value | Actual Value | ||
|---|---|---|---|---|---|---|
| 1. | Random Forest | N = 308 | NO | YES | ||
| NO | TN = 159 | FP = 0 | 159 | |||
| YES | FN = 3 | TP = 146 | 149 | |||
| Total predict | 162 | 146 | 308 | |||
| 2. | AdaBoost | N = 308 | NO | YES | ||
| NO | TN = 159 | FP = 0 | 159 | |||
| YES | FN = 12 | TP = 137 | 149 | |||
| Total predict | 171 | 137 | 308 | |||
| 3. | Decision Tree | N = 308 | NO | YES | ||
| NO | TN = 159 | FP = 0 | 159 | |||
| YES | FN = 0 | TP = 149 | 149 | |||
| Total predict | 159 | 149 | 308 | |||
| 4. | KNN | N = 308 | NO | YES | ||
| NO | TN = 159 | FP = 0 | 159 | |||
| YES | FN = 0 | TP = 149 | 149 | |||
| Total predict | 159 | 149 | 308 | |||
| Sr. No. | Used Model for Cleveland Datasets | Predicted Value (Actual Class) | Predicted Value | Actual Value | ||
|---|---|---|---|---|---|---|
| 1. | Random Forest | N = 46 | NO | YES | ||
| NO | TN = 15 | FP = 1 | 16 | |||
| YES | FN = 1 | TP = 29 | 30 | |||
| Total predict | 16 | 30 | 46 | |||
| 2. | AdaBoost | N = 46 | NO | YES | ||
| NO | TN = 14 | FP = 2 | 16 | |||
| YES | FN = 2 | TP = 28 | 30 | |||
| Total predict | 16 | 30 | 46 | |||
| 3. | Decision Tree | N = 46 | NO | YES | ||
| NO | TN = 13 | FP = 3 | 16 | |||
| YES | FN = 10 | TP = 20 | 30 | |||
| Total predict | 23 | 23 | 46 | |||
| 4. | KNN | N = 46 | NO | YES | ||
| NO | TN = 15 | FP = 1 | 16 | |||
| YES | FN = 0 | TP = 30 | 30 | |||
| Total predict | 15 | 31 | 46 | |||
| Performance Matrices | Models | |||
|---|---|---|---|---|
| RF | AB | DT | KNN | |
| Accuracy | 99.03% | 96.10% | 100% | 100% |
| Precision (0) | 0.98 | 0.93 | 1.00 | 1.00 |
| Precision (1) | 1.00 | 1.00 | 1.00 | 1.00 |
| Recall (0) | 1.00 | 1.00 | 1.00 | 1.00 |
| Recall (1) | 0.98 | 0.92 | 1.00 | 1.00 |
| F1-score (0) | 0.99 | 0.96 | 1.00 | 1.00 |
| F1-score (1) | 0.99 | 0.96 | 1.00 | 1.00 |
| MAE | 0.00974 | 0.0389610 | 0.0 | 0.0 |
| R2 Score | 96.09 | 84.08 | 1.0 | 1.0 |
| Performance Matrices | Models | |||
|---|---|---|---|---|
| RF | AB | DT | KNN | |
| accuracy | 93.478% | 91.30% | 71.739% | 97.826% |
| Precision (0) | 0.88 | 0.88 | 0.57 | 1.00 |
| Precision (1) | 0.97 | 0.93 | 0.87 | 0.97 |
| Recall (0) | 0.94 | 0.88 | 0.81 | 0.94 |
| recall (1) | 0.93 | 0.93 | 0.67 | 1.00 |
| F1-score (0) | 0.91 | 0.88 | 0.67 | 0.97 |
| f1-score (1) | 0.95 | 0.93 | 0.75 | 0.98 |
| MAE | 6.521% | 8.69 | 28.260% | 2.173% |
| R2 Score | 71.249% | 61.66% | 71.249% | 90.41% |
| Sr. No. | Used Data Set | Models | |||
|---|---|---|---|---|---|
| RF | AB | DT | KNN | ||
| 1 | CHSLB datasets (1025) (Present study) | 99.03% | 96.10% | 100% | 100% |
| Cleveland dataset (303) (Present study) | 93.478% | 91.30% | 71.739% | 97.826% | |
| 2 | Five-fold in the statlog dataset | 90.46% [2] | - | 96.42% [2] | 96.42% [2] |
| 3. | Cleveland dataset (303) | 75.55% [65] | 90.16% [66] | ||
| 4. | Cleveland dataset (303) | 80% [67] | |||
| 5. | Armed forces institute of cardiology | 68.6% [68] | 86.6% [68] | ||
| 6. | CHSLB datasets (920) | 80.89% [69] | |||
| 7. | Kita Hospital Jakarta (450) | 46% [70] | |||
| 8. | Cleveland dataset (303) | 54.13% [71] | |||
| 9. | Cleveland dataset (303) | 91.6% [72] | |||
| 10 | People’s Hospital dataset | 97% [72] | |||
| 11 | Northern Lebanon | 97.7% [73] | |||
| 12 | Cleveland dataset (303) | 84% [74] | - | 79% [74] | 87% [74] |
Publisher’s Note: MDPI stays neutral with regard to jurisdictional claims in published maps and institutional affiliations. |
© 2022 by the authors. Licensee MDPI, Basel, Switzerland. This article is an open access article distributed under the terms and conditions of the Creative Commons Attribution (CC BY) license (https://creativecommons.org/licenses/by/4.0/).
Share and Cite
Absar, N.; Das, E.K.; Shoma, S.N.; Khandaker, M.U.; Miraz, M.H.; Faruque, M.R.I.; Tamam, N.; Sulieman, A.; Pathan, R.K. The Efficacy of Machine-Learning-Supported Smart System for Heart Disease Prediction. Healthcare 2022, 10, 1137. https://doi.org/10.3390/healthcare10061137
Absar N, Das EK, Shoma SN, Khandaker MU, Miraz MH, Faruque MRI, Tamam N, Sulieman A, Pathan RK. The Efficacy of Machine-Learning-Supported Smart System for Heart Disease Prediction. Healthcare. 2022; 10(6):1137. https://doi.org/10.3390/healthcare10061137
Chicago/Turabian StyleAbsar, Nurul, Emon Kumar Das, Shamsun Nahar Shoma, Mayeen Uddin Khandaker, Mahadi Hasan Miraz, M. R. I. Faruque, Nissren Tamam, Abdelmoneim Sulieman, and Refat Khan Pathan. 2022. "The Efficacy of Machine-Learning-Supported Smart System for Heart Disease Prediction" Healthcare 10, no. 6: 1137. https://doi.org/10.3390/healthcare10061137