Article

A Fuzzy Evaluation Model Aimed at Smaller-the-Better-Type Quality Characteristics

by
Kuen-Suan Chen
1,2,3 and
Tsun-Hung Huang
1,*
1
Department of Industrial Engineering and Management, National Chin-Yi University of Technology, Taichung 411030, Taiwan
2
Department of Business Administration, Chaoyang University of Technology, Taichung 413310, Taiwan
3
Institute of Innovation and Circular Economy, Asia University, Taichung 41354, Taiwan
*
Author to whom correspondence should be addressed.
Mathematics 2021, 9(19), 2513; https://doi.org/10.3390/math9192513
Submission received: 14 September 2021 / Revised: 3 October 2021 / Accepted: 4 October 2021 / Published: 7 October 2021
(This article belongs to the Special Issue Fuzzy Applications in Industrial Engineering)

Abstract

:
Numerous key components of tool machines possess critical smaller-the-better-type quality characteristics. Under the assumption of normality, a one-to-one mathematical relationship exists between the process quality index and the process yield. Therefore, this paper utilized the index to produce a quality fuzzy evaluation model aimed at the small-the-better-type quality characteristics and adopted the model as a decision-making basis for improvement. First, we derived the 100(1 α )% confidence region of the process mean and process standard deviation. Next, we obtained the 100(1 α )% confidence interval of the quality index using the mathematical programming method. Furthermore, a one-tailed fuzzy testing method based on this confidence interval was proposed, aiming to assess the process quality. In addition, enterprises’ pursuit of rapid response often results in small sample sizes. Since the evaluation model is built on the basis of the confidence interval, not only can it diminish the risk of wrong judgment due to sampling errors, but it also can enhance the accuracy of evaluations for small sample sizes.

1. Introduction

According to Yu et al. [1], many key components of tool machines contain critical smaller-the-better-type (STB-type) quality characteristics. Several STB-type quality characteristics, such as roundness, concentricity, and verticality existing in gears, bearings, and axle centers, are commonly seen. In addition to important mechanical components, the radiation dose of computers, mobile phones, and home appliances; the regulations of various pollutant emission amounts; and the time interval of customers’ arrival at a store all belong to the STB-type characteristics [1,2,3]. Chen et al. [4] combined the six-sigma quality level with the concept of allowing the process mean to deviate by 1.5 standard deviations and proposed a STB-type six-sigma quality-level index. Since the proposed angle is based on the nominal-the-best-type quality characteristic, the measured value may be larger or smaller than the target value, while the measured value of the STB-type characteristic can only be larger than the target value in practice. Myriads of studies have emphasized that if the target value of the STB-type quality characteristics is T = 0, process mean μ will only be larger than target value T but cannot be smaller than target value T ; for example, the values of roundness and verticality will not be smaller than zero. In practice, considering limitations of costs and processing technology, the measured value of the product is usually distant from target value T and very close to U S L , that is, process mean μ is very close to U S L and process standard deviation σ is relatively small [2]. Therefore, Chang et al. [2] suggested a process quality index, specificially Q I S , for the STB-type quality characteristics, as follows:
Q I S = U S L μ σ ,
where U S L is the upper specification limit, μ is process mean, and σ is process standard deviation.
Furthermore, under the assumption of normality, a one-to-one mathematical relationship exists between process quality index Q I S and process yield Y i e l d % , as shown below:
Y i e l d % = p X U S L = p Z U S L μ σ = Q I S 1 2 π σ   e x p z 2 2 d z = Φ Q I S ,
where Z = X μ / σ is regarded as a standard normal distribution while Φ · is the cumulative function of the standard normal distribution. For instance, when Q I S = 3.0, we can guarantee the process yield: Y i e l d % = Φ 3.0 = 99.865%.
Many studies have indicated that in order to enhance enterprises’ market competitiveness and increase their own operational flexibility, the strategy of obtaining partial components offered by suppliers has become a trend in their operating models. Nevertheless, these components’ quality will influence the final products’ quality [5,6]. For instance, if the roundness or concentricity of the axle center is not good, it will cause vibrations of the subsequent operations of related tools and products, which will not only affect the quality of the final products but also reduce the lifetime of the products. Obviously, if the components that companies outsource or purchase from suppliers are of excellent quality, not only will it help improve the quality of the final products but it will also advance the entire industry chain’s competitiveness [7].
According to many studies, with the popularity of the environment of the Internet of Things (IoT) and the rapid development of big data analysis technology, enterprises’ pursuit of rapid responses will help the industry move towards the goal of smart manufacturing [8,9]. The development of a faster and more accurate process capability evaluation model has apparently become an important issue. Under this premise, the sample size will not be too large [10,11]. The advantage of interval estimation is that it can reduce the risk of misjudgment caused by sampling errors. However, in the case of a small sample, the interval length will be too long, which will cause big errors in the process quality evaluation.
The process quality index Q I S can not only measure the process quality level but it also has a one-to-one mathematical link with the process yield. This paper employs this index as well as proposes a confidence interval-based quality fuzzy evaluation model aimed at the STB-type quality characteristics, which will be used as a decision-making basis for improvement. Since the evaluation model is based on the confidence interval, the risk of misjudgment caused by sampling errors can be reduced. In addition, the fuzzy evaluation method can solve many risk assessment issues of industrial processes [12]. Furthermore, the model developed by this study not only has the advantages of the traditional fuzzy evaluation but is also capable of integrating the accumulated professional experience of the past production data [7,13], thus the accuracy of the evaluation can be maintained in the case of a small sample size. As a result, it can meet the needs of enterprises to pursue rapid response as well as can help the industry move towards the goal of smart manufacturing.
The rest of this paper is arranged as follows. Section 2 demonstrates the 100(1 α )% joint confidence region of the process mean and process standard deviation. Section 3 shows that the 100(1 α )% confidence interval of quality index Q I S is obtained by means of the mathematical programming method and a one-tailed confidence interval-based fuzzy testing method is proposed to assess the process quality as well as determine whether the process need improvement. Section 4 presents an application example demonstrating the applicability of the proposed approach. Section 5 provides the conclusions and discussion. Last but not least, Section 6 reviews the limitations. The flowchart of this model is shown in Figure 1.

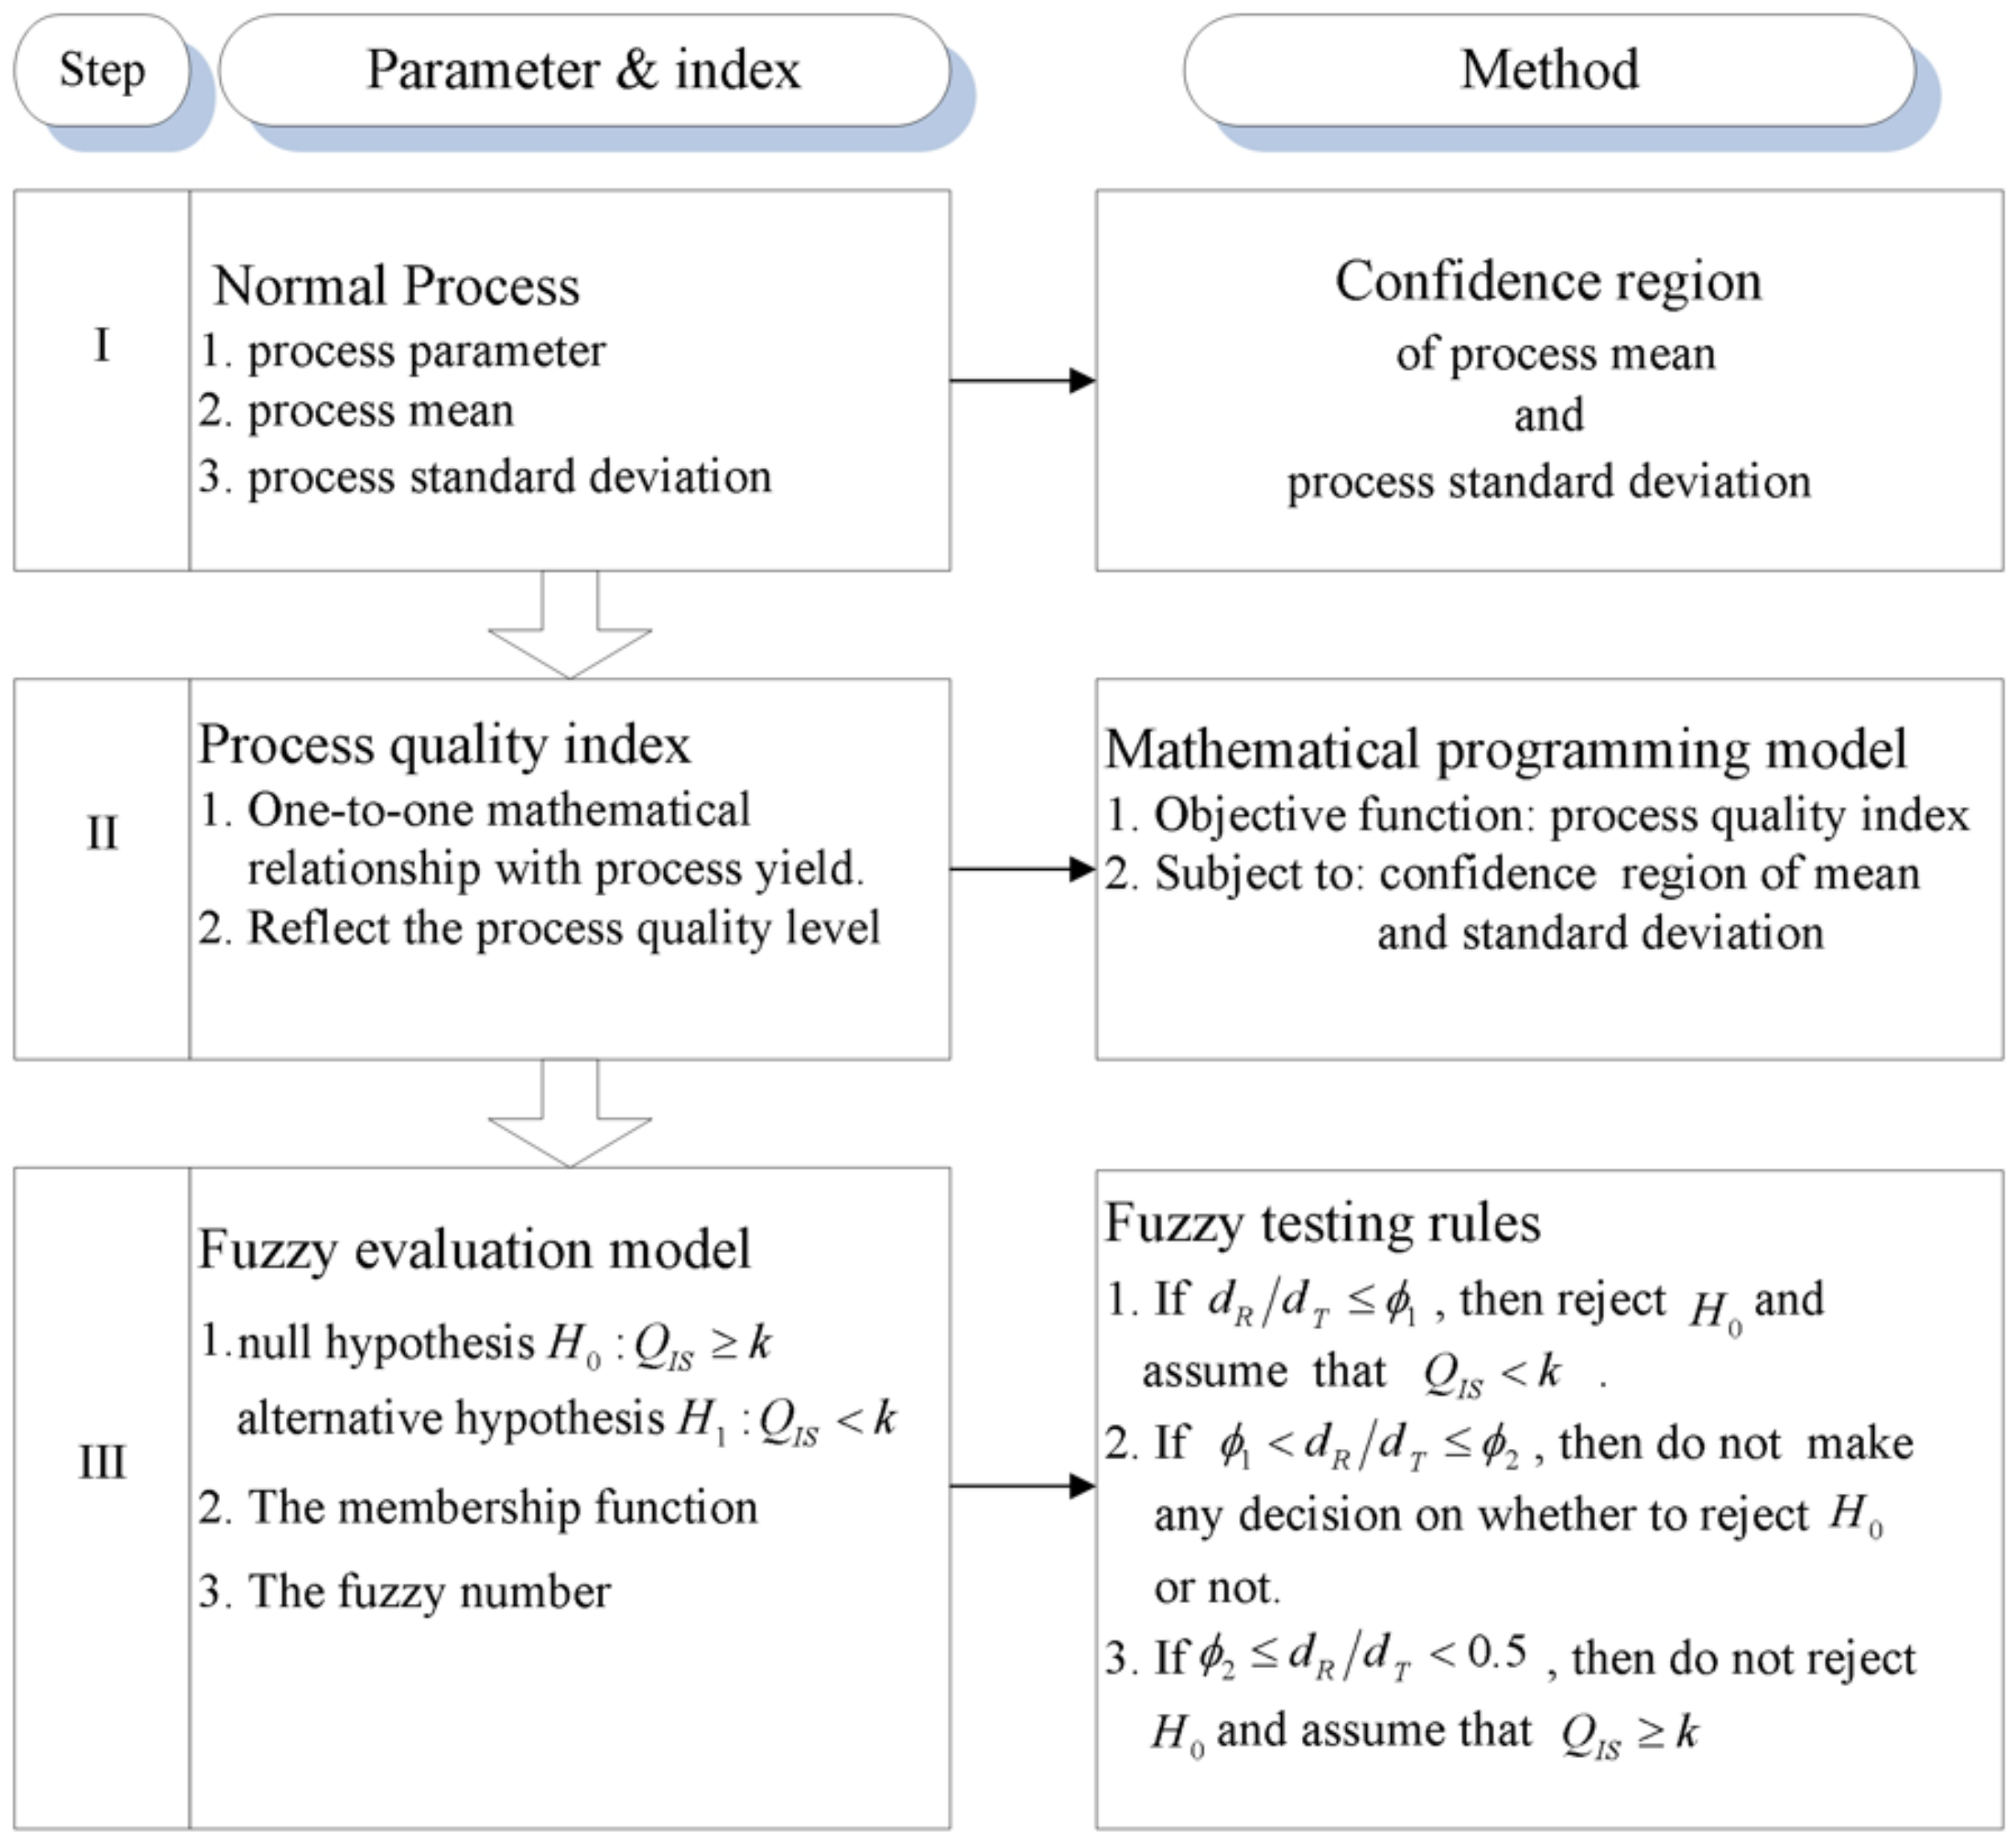
2. Joint Confidence Region of μ , σ

Let ( X 1 ,…, X i ,…, X n ) be a random sample obtained from N μ , σ 2 with sample size n, where N μ , σ 2 is a normal distribution with mean μ and variance σ 2 . Next, the maximum likelihood estimators (MLE) of the process mean and process standard deviation are expressed as follows:
X ¯ = 1 n i = 1 n X i   and   S = 1 n i = 1 n X i X ¯ 2 .
Therefore, the estimator of process quality index Q I S is represented as follows:
Q I S = U S L X ¯ S .
Obviously, n X ¯ μ / σ is distributed as N 0 , 1 and n S 2 / σ 2 is distributed as χ n 1 2 , where N 0 , 1 standard normal distribution and χ n 1 2 chi-square are the distribution with n−1 degree of freedom. Therefore,
p Z 0.5 1 α / 2 N 0 , 1 Z 0.5 1 α / 2 = 1 α
and
p χ 0.5 1 α / 2 ; n 1 2 χ n 1 2 χ 0.5 + 1 α / 2 ; n 1 2 = 1 α ,
where Z Z 0.5 1 α / 2 is the upper 0.5 1 α / 2 quintile of N 0 , 1 and χ a ; n 1 2 is the lower a quintile of χ n 1 2 , where a = 0.5 1 α / 2 or 0.5 + 1 α / 2 . Since X ¯ and S 2 are mutually independent,
1 α = p Z 0.5 1 α / 2 N 0 , 1 Z 0.5 1 α / 2 , χ 0.5 1 α / 2 ; n 1 2 χ n 1 2 χ 0.5 + 1 α / 2 ; n 1 2 = P X ¯ Z 0.5 1 α / 2 σ n μ X ¯ + Z 0.5 1 α / 2 σ n , σ L σ σ U ,
where
σ L = n χ 0.5 + 1 α / 2 ; n 1 2 S   and   σ U = n χ 0.5 1 α / 2 ; n 1 2 S .
Let x 1 , x 2 , , x n be the observed value of X 1 , X 2 , , X n and let both x ¯ and s be the observed values of X ¯ and S , respectively, as follows:
x ¯ = 1 n i = 1 n x i   and   s = 1 n i = 1 n x i x ¯ 2 .
Thus, the observed value of Q I S is
q I S = U S L x ¯ s .
The confidence region of μ , σ is illustrated as follows:
C R = μ , σ x ¯ Z 0.5 1 α / 2 σ n μ x ¯ + Z 0.5 1 α / 2 σ n , σ l σ σ u ,
where
σ l = n χ 0.5 + 1 α / 2 ; n 1 2 s   and   σ u = n χ 0.5 1 α / 2 ; n 1 2 s .
Obviously, process quality index Q I S is a function of μ , σ . This paper used process quality index Q I S μ , σ as an objective function and the confidence region C R as a feasible solution area. Additionally, the mathematical programming model for the lower confidence limit is depicted as follows:
L Q I S = M i n   Q I S μ , σ   s u b j e c t   t o μ , σ C R .
For any μ , σ C R and σ σ u , Q I S μ , σ Q I S μ , σ u . Thus, the mathematical programming model can be represented as
L Q I S = M i n   U S L μ / σ u   s u b j e c t   t o x ¯ e U μ x ¯ + e U ,
where L Q I S is the lower confidence limit of index Q I S and error item e U can be shown as follows:
e U = Z 0.5 1 α / 2 s χ 0.5 1 α / 2 ; n 1 2 .
Based on Equation (10), for any μ x ¯ + e U , Q I S μ , σ u Q I S x ¯ + e U , σ u . The lower confidence limit can be defined as
e U = Z 0.5 1 α / 2 s χ 0.5 1 α / 2 ; n 1 2   σ U = n s χ 0.5 1 α / 2 ; n 1 2
L Q I S = U S L x ¯ + e U σ u
= q I S χ 0.5 1 α / 2 ; n 1 2 n Z 0.5 1 α / 2 n .
Similarly, the mathematical programming model for the upper confidence limit is denoted as:
U Q I S = M a x   Q I S μ , σ   s u b j e c t   t o μ , σ C R
For any μ , σ C R and σ σ l , Q I S μ , σ Q I S μ , σ l . Thus, the mathematical programming model can be rewritten as:
U Q I S = M a x   U S L μ / σ l   s u b j e c t   t o x ¯ e L μ x ¯ + e L ,
where U Q I S is the upper confidence limit of index Q I S and error item e L can be shown as follows:
e L = Z 0.5 1 α / 2 s χ 0.5 + 1 α / 2 ; n 1 2 .
Based on Equation (14), for any μ x ¯ e L ,   Q I S μ , σ l Q I S x ¯ e L , σ l . The upper confidence limit can be represented as:
U Q I S = U S L x ¯ e L σ l = q I S χ 0.5 + 1 α / 2 ; n 1 2 n + Z 0.5 1 α / 2 n .

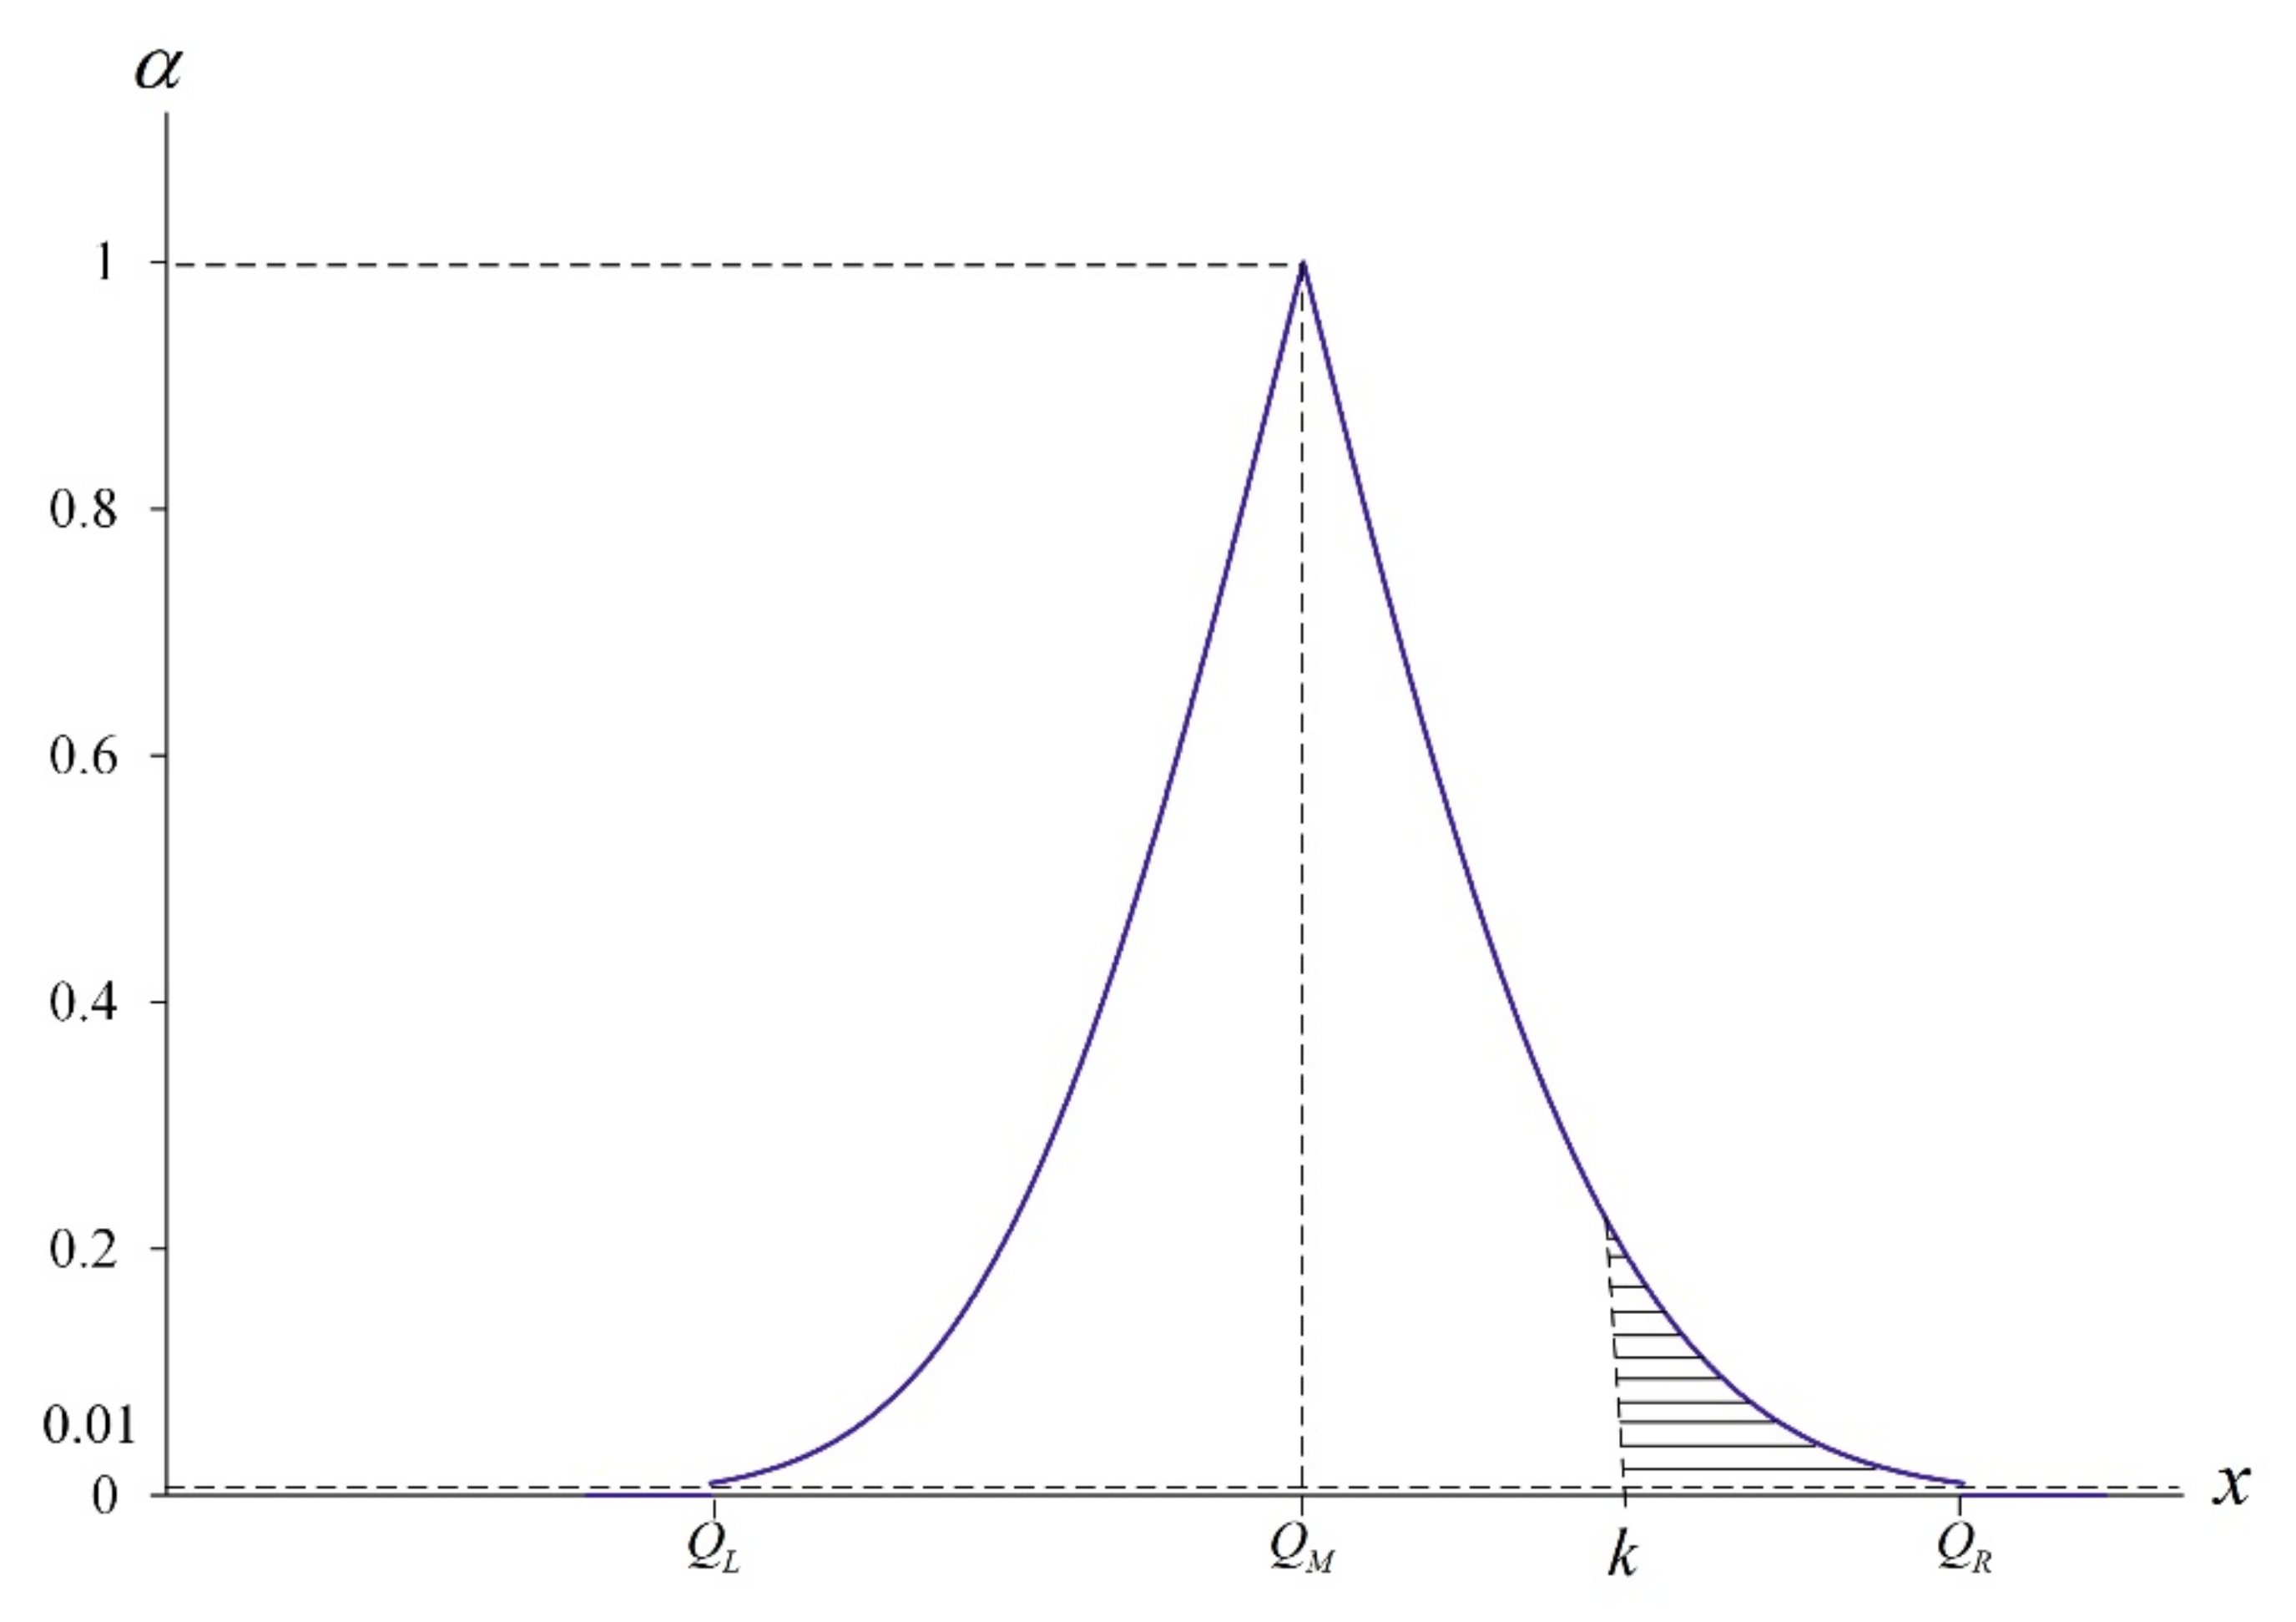
3. Developing a Fuzzy Evaluation Model

The fuzzy evaluation method based on confidence intervals is an effectual scheme that can help decide whether the process quality is acceptable or needs improvement [14,15,16,17,18,19]. If the customer requires the value of the quality index Q I S to be at least k ( Q I S k ), the null hypothesis H 0 : Q I S k will be contradictory to the alternative hypothesis H 1 : Q I S < k . As described by Chen [10], the α - cuts of the triangular-shaped fuzzy number Q ˜ I S is expressed as follows:
Q ˜ I S α = Q I S 1 α , Q I S 2 α ,   f o r   0.01 α 1 Q I S 1 0.01 , Q I S 2 0.01 ,   f o r   0 α 0.01 ,
where Q I S 1 α and Q I S 2 α in Equation (17) can be denoted as
Q I S 1 α = q I S χ 0.5 1 α / 2 ; n 1 2 n Z 0.5 1 α / 2 n ,
and
Q I S 2 α = q I S χ 0.5 + 1 α / 2 ; n 1 2 n + Z 0.5 1 α / 2 n .
Therefore, the triangular-shaped fuzzy number is Q ˜ I S = Δ Q L , Q M , Q R , where Q L = Q I S 1 0.01 , Q M = Q I S 1 1 = Q I S 2 1 , and Q R = Q I S 2 0.01 are expressed as follows:
Q L = q I S χ 0.0025 ; n 1 2 n Z 0.0025 n ,
Q M = q I S χ 0.5 ; n 1 2 n ,
and
Q R = q I S χ 0.9975 ; n 1 2 n + Z 0.0025 n .
Therefore, the membership function of the fuzzy number Q ˜ I S is
η x = 0 i f   x < Q L α 1 i f   Q L x < Q M 1 i f   x = Q M α 2 i f   Q M < x Q R 0 i f   x > Q R ,
where α 1 and α 2 are determined by
q I S χ 0.5 1 α 1 / 2 ; n 1 2 n Z 0.5 1 α 1 / 2 n = x ,   Q L x < Q M ,
and
q I S χ 0.5 + 1 α 2 / 2 ; n 1 2 n + Z 0.5 1 α 2 / 2 n = x ,   Q M < x Q R .
Before the fuzzy evaluation model was proposed, the statistical testing rules were first reviewed. They are listed below:
(1)
If U Q I S k , do not reject H 0 and assume that Q I S k .
(2)
If U Q I S < k , reject H 0 and assume that Q I S < k .
Next, we constructed a fuzzy evaluation model based on the above-mentioned statistical testing rules. Based on Yu et al. [1] and Huang et al. [20], let set A T be the area in the graph of η x and let A R be the area in the graph of η x but to the right of vertical line x = k . Figure 2 presents a diagram of the membership functions of η x with vertical line x = k .
Therefore, let
A T = x , α Q I S 1 α x Q I S 2 α , 0 α 1
and
A R = x , α k x Q I S 2 α , 0 α a ,
where Q I S 2 a = k . Let d T = Q R Q L and d R = Q R k . Then,
d R d T = q I S χ 0.9975 ; n 1 2 n + Z 0.0025 n k q I S χ 0.9975 ; n 1 2 n χ 0.0025 ; n 1 2 n + 2 Z 0.0025 n .
Note that we let 0 < ϕ 0.5, where the value of ϕ can be determined based on the past accumulated production data or expert experience [21,22,23,24].
Therefore, we let 0   <   ϕ 1 < ϕ 2 < 0.5 . As noted by Yu et al. [1] and Buckley [25], we may obtain the following fuzzy testing rules:
(1)
If d R / d T ϕ 1 , reject H 0 and assume that Q I S < k .
(2)
If ϕ 1 < d R / d T < ϕ 2 , do not make any decision on whether to reject H 0 or not.
(3)
If ϕ 2 d R / d T < 0.5, do not reject H 0 and assume that Q I S k .

4. A Practical Application

As mentioned earlier, many machined parts have multiple quality characteristics of unilateral STB tolerances. This paper takes the runout of an axle center as an example demonstrating the application of the fuzzy evaluation model presented in Section 3. The so-called runout of the axle center is the maximum allowable verticality of change when the axle center rotates around the reference axis [26]. This STB tolerance is 0 , U S L = (0, 0.05) and the process quality index Q I S can be expressed as follows:
Q I S = 0.05 μ σ .
Taiwan’s machine tool output value ranks seventh in the world and its export volume ranks fifth in the world. Taiwan’s machinery industry holds a significant position in global markets [27,28,29]. The central region not only connects parts of the processing and maintenance industries but also combines aerospace and intelligent machine industries to form a huge cluster for the machinery industry [9,30]. Generally speaking, the machining industry usually requires that the index value of the process capability be at least 1.33, equivalent to the requirement of Q I S 4 and then null hypothesis is expressed as H 0 : Q I S 4 versus the alternative hypothesis H 1 : Q I S < 4.
There are three random samples, namely ( x 1 , x 2 , , x 36 ) , ( x 1 , x 2 , , x 36 ) , and ( x 1 , x 2 , , x 36 ) with sample size n = 36 for the three cases. Then, various values of the three samples for three cases are shown respectively as follows:
Case 1 consists of:
x ¯ = 1 36 i = 1 36 x i = 0.041 , s = 1 36 i = 1 36 x i x ¯ 2 = 0.0031 , q I S = 0.05 0.041 0.0031 = 2.90 , Q L = q I S χ 0.0025 ; 35 2 36 + Z 0.0025 6 = 2.90 16.032 36 + 2.807 6 = 2.40 Q M = q I S χ 0.5 ; 35 2 36 = 2.90 34.336 36 = 2.83 , Q R = q I S χ 0.9975 ; 35 2 36 + Z 0.0025 6 = 2.90 63.076 36 + 2.807 6 = 4.31 .
Hence, the membership function of the fuzzy number Q ˜ I S is
η x = 0 i f   x < 2.40 α 1 i f   2.40 x < 2.83 1 i f   x = 2.83 α 2 i f   2.83 < x 4.31 0 i f   x > 4.31 ,
where α 1 and α 2 are determined by
2.90 χ 0.5 1 α 1 / 2 ; 35 2 36 Z 0.5 1 α 1 / 2 6 = x ,   2.40 x < 2.83 ,
and
2.90 χ 0.5 + 1 α 2 / 2 ; 35 2 36 + Z 0.5 1 α 2 / 2 6 = x ,   2.83 < x 4.31 .
Hence, we have
d R = Q R k = 4.31 4 = 0.31 ,
d T = Q R Q L = 4.31 2.40 = 1.91 ,
and
d R d T = 0.31 1.91 = 0.16 .
Case 2 consists of:
x ¯ = 1 36 i = 1 36 x i = 0.039 , s = 1 36 i = 1 36 x i x ¯ 2 = 0.0035 , q I S = 0.05 0.039 0.0035 = 3.14 , Q L = q I S χ 0.0025 ; 35 2 36 + Z 0.0025 6 = 3.14 16.032 36 + 2.807 6 = 2.56 Q M = q I S χ 0.5 ; 35 2 36 = 3.14 34.336 36 = 3.06 , Q R = q I S χ 0.9975 ; 35 2 36 + Z 0.0025 6 = 3.14 63.076 36 + 2.807 6 = 4.63 .
Hence, the membership function of the fuzzy number Q ˜ I S is
η x = 0 i f   x < 2.56 α 1 i f   2.56 x < 3.06 1 i f   x = 3.06 α 2 i f   3 . 06 < x 4.63 0 i f   x > 4.63 ,
where α 1 and α 2 are determined by
3.14 χ 0.5 1 α 1 / 2 ; 35 2 36 Z 0.5 1 α 1 / 2 6 = x ,   2.56 x < 3.06 ,
and
3.14 χ 0.5 + 1 α 2 / 2 ; 35 2 36 + Z 0.5 1 α 2 / 2 6 = x ,   3.06 < x 4.63 .
Hence, we have
d R = Q R k = 4.63 4 = 0.63 ,
d T = Q R Q L = 4.63 2.56 = 2.07 ,
and
d R d T = 0.63 2.07 = 0.30 .
Case 3 consists of:
x ¯ = 1 36 i = 1 36 x i = 0.037 , s = 1 36 i = 1 36 x i x ¯ 2 = 0.0037 , q I S = 0.05 0.041 0.0031 = 3.51 , Q L = q I S χ 0.0025 ; 35 2 36 + Z 0.0025 6 = 3.51 16.032 36 + 2.807 6 = 2.81 Q M = q I S χ 0.5 ; 35 2 36 = 3.51 34.336 36 = 3.43 , Q R = q I S χ 0.9975 ; 35 2 36 + Z 0.0025 6 = 3.51 63.076 36 + 2.807 6 = 5.10 .
Hence, the membership function of the fuzzy number Q ˜ I S is
η x = 0 i f   x < 2.81 α 1 i f   2.81 x < 3.43 1 i f   x = 3.43 α 2 i f   3 . 43 < x 5.10 0 i f   x > 5.10 ,
where α 1 and α 2 are determined by
2.9 χ 0.5 1 α 1 / 2 ; 35 2 36 Z 0.5 1 α 1 / 2 6 = x ,   2.81 x < 3.43 ,
and
2.9 χ 0.5 + 1 α 2 / 2 ; 35 2 36 + Z 0.5 1 α 2 / 2 6 = x ,   3.43 < x 5.10 .
Hence, we have
d R = Q R k = 5.10 4 = 1.10 ,
d T = Q R Q L = 5.10 2.81 = 2.29 ,
and
d R d T = 1.10 2.29 = 0.48 .
As noted by Chen et al. [12], in practice, the obtained value of ϕ 1 is equal to 0.2 and the value of ϕ 2 is equal to 0.4. Based on the fuzzy testing rules, then
Case 1 is expressed as d R / d T = 0.16 < ϕ 1 : reject H 0 and assume that Q I S < 4;
Case 2 is express as ϕ 1 < d R / d T = 0.30 < ϕ 2 : do not make any decision and require re-evaluation; and
Case 3 is expressed as ϕ 2 d R / d T < 0.5: do not reject H 0 and assume that Q I S 4.
For case 1, given that the upper confidence limit is U Q I S = Q R = 4.31 > k = 4, Q I S 4 is inferred based on the statistical testing rules. However, the value of the process quality index is q I S = 2.90, far less than 4. Obviously, the fuzzy evaluation model in this paper is more practical than the traditional statistical testing model. The small sample size (n = 36) can lead to big sampling errors, which should be the main reason for the model. The comparison of the statistical testing method and fuzzy testing method is presented in Table 1.

5. Conclusions and Discussion

This paper proposed a fuzzy quality evaluation model with a process quality index aimed at the STB quality characteristics and used it as the basis of decision-making for improvement. The process quality index can reflect the process quality level and process yield. With the advent of the Industry 4.0 era, companies demand rapid responses, thus they must frequently use small samples to make decisions. The fuzzy evaluation method suggested in this paper was built on the basis of confidence intervals. Therefore, not only can it reduce the risk of misjudgment caused by sampling errors but it also can improve the accuracy of evaluation. In addition, the mathematical programming method was employed to discover the confidence interval of the process quality index. Finally, an application example was presented in Section 4 to demonstrate the applicability of the recommended approach. The value of the process quality index is q I S = 2.9. This value is far less than 4. Obviously, the fuzzy evaluation model in this paper is more reasonable than the traditional statistical testing one. Furthermore, the advantage of this method is that it simply requires common software, such as Excel and SAS, instead of complicated programs, which is very convenient for the industry to use.
Numerous performance evaluations of industrial processes or business workflows all belong to the STB-type quality characteristics, such as machinery, computers, mobile phones, home appliances, and the time interval of customers’ arrival at a store. Nevertheless, the commonly used or seen evaluation indicators or models are based on the NTB-type quality characteristics. In addition, with the popularity of the environment of the Internet of Things (IoT) and the rapid development of big data analysis technology, companies seek to respond quickly to situations in which small sample sizes are generated, thus a novel evaluation model must be developed to cope with this. The evaluation index adopted by this study not only has a one-to-one mathematical relationship with the process yield but it also reflects the process quality level. The evaluation model is based on the confidence interval, thus the risk of the misjudgment caused by sampling errors can be reduced. Moreover, the fuzzy evaluation model can be integrated into the accumulated professional experience of the past production data. As a result, the accuracy of the evaluation can be maintained in the case of small sample sizes to ensure that it can both meet the needs of enterprises’ pursuit of quick responses and help the industry move towards the goal of smart manufacturing.

6. Limitations

The fuzzy evaluation model of the STB-type quality characteristics proposed by this study is applicable to normal process distribution, such as regarding the STB-type quality characteristics of machinery, computers, mobile phones, and home appliances. In contrast, this model is not applicable to abnormal distributions, such as regarding the time interval of customers’ arrival at a certain store. Abnormal distributions of STB-type quality characteristics that cannot be included in this research study can be considered for future research.

Author Contributions

Conceptualization, K.-S.C. and T.-H.H.; methodology, K.-S.C.; software, T.-H.H.; validation, T.-H.H.; formal analysis, K.-S.C. and T.-H.H.; data curation, T.-H.H.; writing—original draft preparation, K.-S.C. and T.-H.H.; writing—review and editing, K.-S.C. and T.-H.H.; visualization, T.-H.H.; supervision, K.-S.C.; project administration, T.-H.H. All authors have read and agreed to the published version of the manuscript.

Funding

This research study received no external funding.

Institutional Review Board Statement

Not applicable.

Informed Consent Statement

Not applicable for studies not involving humans.

Conflicts of Interest

The authors declare no conflict of interest.

Nomenclature

Tthe target value
μ process mean
U S L upper specification limit
σ process standard deviation
Q I S process quality index
Y i e l d % process yield
Φ · the cumulative function of the standard normal distribution
Zthe standard normal distribution
Xa random sample
nsample size
σ 2 variance
MLEthe maximum likelihood estimators
X ¯ the maximum likelihood estimators of the process mean
Sthe maximum likelihood estimators of the process standard deviation
Q I S the estimator of process quality index Q I S
χ n 1 2 chi-square indicates distribution with n−1 degree of freedom
x 1 , x 2 , , x n the observed value of X 1 , X 2 , , X n
x ¯ the observed values of X ¯
s the observed values of S
C R the confidence region of μ , σ
σ l the lower limit of σ
σ u the upper limit of σ
L Q I S the lower confidence limit of index Q I S
e U error item of the lower confidence limit of index Q I S
U Q I S the upper confidence limit of index Q I S
e L error item of the higher confidence limit of index Q I S
kthe value of the required level
H 0 null hypothesis
H 1 alternative hypothesis
Q ˜ I S α the α - cuts of the triangular-shaped fuzzy number Q ˜ I S
Δ Q L , Q M , Q R the triangular-shaped fuzzy number
η x the membership function of the fuzzy number Q ˜ I S
A T the area in the graph of η x
A R the area in the graph of η x but to the right of vertical line x = k
d T Q R Q L
d R Q R k

References

  1. Yu, C.-M.; Chen, K.-S.; Lai, K.-K.; Hsu, C.-H. Fuzzy supplier selection method based on smaller-the-better quality characteristic. Appl. Sci. 2020, 10, 3635. [Google Scholar] [CrossRef]
  2. Chang, T.-C.; Chen, K.-S.; Yu, C.-M. Process quality assessment model of hand tools: A case study on the handle of ratchet torque wrench. Int. J. Reliab. Qual. Saf. Eng. 2016, 23, 1650017. [Google Scholar] [CrossRef]
  3. Chen, K.-S. Two-tailed Buckley fuzzy testing for operating performance index. J. Comput. Appl. Math. 2019, 361, 55–63. [Google Scholar] [CrossRef]
  4. Chen, K.-S.; Chen, H.-T.; Chang, T.-C. The construction and application of Six Sigma quality indices. Int. J. Prod. Res. 2017, 55, 2365–2384. [Google Scholar] [CrossRef]
  5. Prahalad, C.K.; Hamel, G. The core competence of the corporation. Harv. Bus. Rev. 1990, 68, 79–91. [Google Scholar]
  6. Grossman, G.M.; Helpman, E. Integration versus outsourcing in industry equilibrium. Q. J. Econ. 2002, 117, 85–120. [Google Scholar] [CrossRef]
  7. Awasthi, A. Supplier quality evaluation using a fuzzy multi criteria decision making approach. Smart Tech. Smarter Planet 2014, 319, 195–219. [Google Scholar] [CrossRef]
  8. Chang, K.-H.; Sun, Y.-J.; Lai, C.-A.; Chen, L.-D.; Wang, C.-H.; Chen, C.-J.; Lin, C.-M. Big data analytics energy-saving strategies for air compressors in the semiconductor industry—An empirical study. Int. J. Prod. Res. 2021, 1–13. [Google Scholar] [CrossRef]
  9. Lin, K.-P.; Yu, C.-M.; Chen, K.-S. Production data analysis system using novel process capability indices-based circular economy. Ind. Manag. Data Syst. 2019, 119, 1655–1668. [Google Scholar] [CrossRef]
  10. Chen, K.-S.; Wang, C.-H.; Tan, K.-H. Developing a fuzzy green supplier selection model using six sigma quality indices. Int. J. Prod. Econ. 2019, 212, 1–7. [Google Scholar] [CrossRef]
  11. Chen, K.-S.; Yu, C.-M. Fuzzy test model for performance evaluation matrix of service operating systems. Comput. Ind. Eng. 2020, 140, 106240. [Google Scholar] [CrossRef]
  12. Lin, Z.; Ayed, H.; Bouallegue, B.; Tomaskova, H.; Ghoushchi, S.J.; Haseli, G. An integrated mathematical attitude utilizing fully fuzzy bwm and fuzzy waspas for risk evaluation in a SOFC. Mathematics 2021, 9, 2328. [Google Scholar] [CrossRef]
  13. Ribeiro-Navarrete, S.; Saura, J.R.; Palacios-Marqués, D. Towards a new era of mass data collection: Assessing pandemic sur-veillance technologies to preserve user privacy. Technol. Forecast. Soc. Chang. 2021, 167, 120681. [Google Scholar] [CrossRef]
  14. Adjenughwure, K.; Papadopoulos, B. Fuzzy-statistical prediction intervals from crisp regression models. Evol. Syst. 2019, 11, 201–213. [Google Scholar] [CrossRef]
  15. Liu, G.; Xiao, F.; Lin, C.-T.; Cao, Z. A Fuzzy interval time-series energy and financial forecasting model using network-based multiple time-frequency spaces and the induced-ordered weighted averaging aggregation operation. IEEE Trans. Fuzzy Syst. 2020, 28, 2677–2690. [Google Scholar] [CrossRef]
  16. Hesamian, G.; Akbari, M.G.; Yaghoobpoor, R. Quality control process based on fuzzy random variables. IEEE Trans. Fuzzy Syst. 2018, 27, 671–685. [Google Scholar] [CrossRef]
  17. Kaplan Göztok, K.; Uçurum, M.; Özdemir, A. Development of a fuzzy exponentially weighted moving average control chart with an α-level cut for monitoring a production process. Arab. J. Sci. Eng. 2021, 46, 1911–1924. [Google Scholar] [CrossRef]
  18. Lee, T.-S.; Wang, C.-H.; Yu, C.-M. Fuzzy evaluation model for enhancing e-learning systems. Mathematics 2019, 7, 918. [Google Scholar] [CrossRef] [Green Version]
  19. Abbasi Ganji, Z.; Sadeghpour Gildeh, B. Assessing process performance with incapability index based on fuzzy critical value. Iran. J. Fuzzy. Syst. 2016, 13, 21–34. [Google Scholar]
  20. Huang, C.-C.; Chang, T.-C.; Chen, B.-L. Fuzzy assessment model to judge quality level of machining processes involving bilateral tolerance using crisp data. J. Chin. Inst. Eng. 2021, 44, 1–10. [Google Scholar] [CrossRef]
  21. Liou, J.J.; Chang, M.-H.; Lo, H.-W.; Hsu, M.-H. Application of an MCDM model with data mining techniques for green supplier evaluation and selection. Appl. Soft Comput. 2021, 109, 107534. [Google Scholar] [CrossRef]
  22. Winanda, L.A.R.; Aeifin, A.; Adi, T.W.; Arrofiqi, F.; Anwar, N. Development of fuzzy decision support system for accident prevention based on worker conditions and project environments. J. Theor. Appl. Inf. Technol. 2020, 98, 4044–4060. [Google Scholar]
  23. Sabbaghi, A.; Keyvanpour, M.R.; Parsa, S. FCCI: A fuzzy expert system for identifying coincidental correct test cases. J. Syst. Softw. 2020, 168, 110635. [Google Scholar] [CrossRef]
  24. Salmi, K.; Magrez, H.; Ziyyat, A. A Novel expert evaluation methodology based on fuzzy logic. Int. J. Emerg. Technol. Learn. (iJET) 2019, 14, 160–173. [Google Scholar] [CrossRef] [Green Version]
  25. Buckley, J.J. Fuzzy statistics: Hypothesis testing. Soft Comput. 2004, 9, 512–518. [Google Scholar] [CrossRef]
  26. Chen, K.-S.; Chang, T.-C.; Guo, Y.-Y. Selecting an optimal contractor for production outsourcing: A case study of gear grinding. J. Chin. Inst. Eng. 2020, 43, 415–424. [Google Scholar] [CrossRef]
  27. Lu, C.-C.; Dan, W.; Chen, X.; Tseng, C.-K.; Chou, K.-W. Evaluation of the operating performance of Taiwanese machine tool industry with the dynamic network DEA model. Enterp. Inf. Syst. 2021, 15, 87–104. [Google Scholar] [CrossRef]
  28. Oh, E.T.; Chen, K.M.; Wang, L.M.; Liu, R.J. Value creation in regional innovation systems: The case of Taiwan’s machine tool enterprises. Technol. Forecast. Soc. Chang. 2015, 100, 118–129. [Google Scholar] [CrossRef]
  29. Wu, M.-F.; Chen, H.-Y.; Chang, T.-C.; Wu, C.-F. Quality evaluation of internal cylindrical grinding process with multiple quality characteristics for gear products. Int. J. Prod. Res. 2019, 57, 6687–6701. [Google Scholar] [CrossRef]
  30. Chien, C.-F.; Hong, T.-Y.; Guo, H.-Z. An empirical study for smart production for TFT-LCD to empower Industry 3.5. J. Chin. Inst. Eng. 2017, 40, 552–561. [Google Scholar] [CrossRef]
Figure 1. Flowchart of fuzzy evaluation model.
Mathematics 09 02513 g001
Figure 2. Membership functions of η ( x ) with x = k .
Mathematics 09 02513 g002
Table 1. The comparison of the statistical testing method and fuzzy testing method.
Statistical Testing MethodFuzzy Testing Method
  • The statistical testing method can reduce the risk of misjudgment caused by sampling errors.
  • The small sample size can lead to big sampling errors.
  • Is unable to integrate the expert experience or accumulated past data.
  • This method needs a bigger sample size.
  • The fuzzy testing method not only reduces the risk of misjudgment caused by sampling errors but also can improve the accuracy of evaluation.
  • Makes decisions based on expert experience and accumulated past data to improve the accuracy of cases with small sample sizes.
  • This method does not need a bigger sample size.
  • This method is more practical than the traditional statistical testing model.
Publisher’s Note: MDPI stays neutral with regard to jurisdictional claims in published maps and institutional affiliations.

