Article

Fuzzy Evaluation Model of Bank APP Performance Based on Circular Economy Thinking

1
School of Economics and Management, Dongguan University of Technology, Dongguan 523808, China
2
School of Management, University of Science and Technology of China, Hefei 230026, China
3
Department of Industrial Engineering and Management, National Chin-Yi University of Technology, Taichung 41170, Taiwan
4
Department of Business Administration, Chaoyang University of Technology, Taichung 41349, Taiwan
5
Institute of Innovation and Circular Economy, Asia University, Taichung 41354, Taiwan
6
Department of Finance, National Taichung University of Science and Technology, Taichung 40401, Taiwan
*
Authors to whom correspondence should be addressed.
Mathematics 2021, 9(21), 2761; https://doi.org/10.3390/math9212761
Submission received: 24 September 2021 / Revised: 8 October 2021 / Accepted: 28 October 2021 / Published: 30 October 2021
(This article belongs to the Special Issue Fuzzy Applications in Industrial Engineering)

Abstract

:
As the environment of the Internet of Things (IoT) gradually becomes common and mature, various smart application (APP) platforms have sprung up, making what we are doing more convenient, more economical and more efficient. Then, this paper used a bank APP as the research background to discuss issues related to smart APPs. Obviously, through the bank APPs, customers can complete their transfer and payment for various expenses at home, eliminating the inconvenience of going out, which not only can alleviate traffic congestion as well as reduce carbon emissions but also can save the manpower expenditure costs for banks. Consequently, improving APP performance and increasing the number of users of an APP is a very important issue. Therefore, this paper proposed an APP performance index to evaluate the performance of a bank APP. This APP performance index is to evaluate the performance of the APP through the time interval of customers’ access to the APP. The shorter the time interval is, the greater the number of users within a unit time is. In addition, based on cost considerations and effectiveness, the sample size n is usually not too large in practice, in order to make decisions quickly and accurately in a short time. Since the fuzzy testing model based on the confidence interval can be integrated with the past accumulated experience of data experts, the testing accuracy can be leveled up under the condition of small-sized samples. Accordingly, a fuzzy evaluation model was proposed to evaluate whether the performance of the bank APP can reach the required level, and this model was also regarded as a basis for decision-making to determine whether to improve the bank APP. At the same time, we can grasp the opportunities for improvement, achieve the effect of cost reduction, energy saving and carbon reduction, and further move towards the goal of innovative and intelligent management.

1. Introduction

Many studies have pointed out that in the face of increasingly serious global warming issues, circular economy (CE) thinking is attracting more and more attention from companies and governments [1,2,3,4,5]. Based on the concept of circular economy, a lot of scholars have been engaged in research on related topics, such as product design and manufacturing, supplier selection, and service operation management [6,7,8]. Lin et al. [9] indicated that with the gradual popularity and maturity of the environment of the Internet of Things (IoT), various smart APPs have sprung up, making what we are doing more convenient, economical and efficient. Numerous scholars have suggested that the cloud platform built by the IoT can collect customers’ data and come up with various data analysis models to improve the performance of APPs, so as to increase customers’ willingness to use the APPs [10,11,12,13]. The effective data analysis and application can accelerate the development of smart APPs as well as move towards the goal of innovative and smart management [14,15,16].
Next, this paper will take a bank APP as an example to further illustrate the application of smart APPs. Apparently, customers can transfer money and pay various fees at home through the APP built by the bank, eliminating the inconvenience of going out. Not only can the APP ease traffic jams and reduce carbon emissions, but it also can save labor costs for the bank. As mentioned earlier, a good-quality APP can increase customers’ willingness to use the APP platform. This paper will establish an APP performance evaluation model so as to improve the service performance of the APP, and at the same time to raise customers’ satisfaction with the use of the APP as well as increase the number of APP users. According to Ross [17] and Kim et al. [18], the number of customers entering the APP was a Poisson process. Chen and Yang [19] considered that the time between two customers entering the APP was distributed as the exponential distribution. Thus, an operating performance index was proposed. Li et al. [20] revised the operating performance index as a more concise ratio operating performance index according to the concept that the index is a simple and unitless management tool. Therefore, based on the concept of Li et al. [20], this paper defines an APP performance index as an evaluation tool for the APP performance.
Plenty of studies have revealed that gathering the time interval of customers’ access to the APP is more effective than the number of customers’ arrivals within the time unit [19,21,22]. Hence, this paper evaluates the APP performance through the time intervals of customers’ entering the APP. The shorter the time interval is, the higher the number of users within the time unit is. As mentioned above, this approach can reach effects, including convenience, cost reduction, energy saving and carbon reduction. In addition, based on cost considerations and effectiveness, in order to make decisions quickly and accurately in a short time, the sample size n is usually not too large in practice; consequently, the accuracy of statistical inference will be affected [23,24]. Since the fuzzy testing model based on the confidence interval can be incorporated into the past accumulated experience of data experts [25,26], the testing accuracy can be improved under the condition of small-sized samples. Therefore, this paper will derive the confidence interval of the App performance index to construe a fuzzy number and a membership function of the APP performance index. Next, a fuzzy evaluation model is proposed to evaluate whether the performance of the bank APP can reach the required level and regarded as a basis of determining whether the bank APP needs to improve.
In summary, the purpose of this research is to propose a fuzzy evaluation model that can take into account both timeliness and accuracy. It can not only evaluate the performance of the bank APP but also grasp the opportunities for improvement at the same time, in order to achieve the effect of cost reduction, energy saving and carbon reduction and then move towards the goal of innovative and intelligent management. Finally, to facilitate the application of readers and the industry, we use an application example to illustrate the application of the fuzzy testing method proposed in this paper.
The rest of the article is arranged as follows: Section 2 defines the App performance index. Section 3 shows the statistical hypothesis testing model based on the confidence interval. Section 4 proposes a fuzzy evaluation model for the performance index. Section 5 presents an application example demonstrating the applicability of the proposed approach. Section 6 provides conclusions. Last but not least, Section 7 describes limitations and possible future research directions.

2. APP Performance Index

According to Chen and Yang [18] and Li et al. [19], the number of customers ( N t ) entering the APP is a Poisson distribution with rate λ , denoted by N t ~ P o i s s o n λ t . Then, the probability density function (p.d.f.) is given by:
p N t = n = e λ t λ t n n ! ,   n = 0 ,   1 ,   2 ,   3 ,
Let T j denote the elapsed time from the ( j 1 ) s t customer entering the APP until the occurrence of the j t h customer. The sequence T 1 , , T j ,       , T n ,       is called the sequence of interval times. Therefore:
F T j t = 1 p T j > t = 1 e x p λ t
and:
f T j t = F T j t t = λ × e x p λ t .
Let τ = 1 / λ be the mean time between two customers continuously entering the APP, then:
f T j t = 1 τ × e x p t τ ,   t 0 .
In this case, the sequence of interval time T j is independent and an identically distributed exponential random variable with mean τ . If at least N 0 customers are required to enter the APP for operation within a time unit, then it is equivalent to request T j U , where U = 1 / N 0 denotes the maximum expected interval times of two customers continuously entering the APP. On this basis, the sequence of interval time T j belongs to the smaller-the-better performance characteristic. Based on Li et al. [19], the APP performance index A P I can defined as:
A P I = U τ .
Let q = p T j > U represent the rate of non-compliance with performance requirements, then:
q = p T j > U = e x p A P I .
Obviously, the performance index A P I and the rate of non-compliance with performance requirements q have a one-to-one mathematical relationship. In fact, the partial differentiation for q is negative. Therefore, q is the monotonically decreasing function of A P I and shown in Figure 1.

3. Statistical Hypothesis Testing Based on Confidence Interval

Suppose the required performance value of the index A P I is A 0 , then we consider the problem of the hypothesis tests, the null hypothesis H 0 : A P I = A 0 against the alternative hypothesis H 1 : A P I   A 0 , at a desired level of significance level α . Let T 1 , , T j , , T n be random variables of an independent identity distribution (i.i.d.) with the exponential distribution. Then, we propose an unbiased estimator of A P I as follows:
A P I = U τ ,
where τ = n 1 1 j = 1 n T j is the estimator of mean τ . Furthermore, let:
W = n 1 A P I A P I ,
then is distributed as G ( n , 1 ) , and the probability density function of W is displayed as follows:
f W w = 1 Γ ( n ) × w n 1 × e x p w ,   w 0 .
Obviously:
p G α / 2 ( n , 1 ) W G 1 α / 2 ( n , 1 ) = 1 α
p G α / 2 ( n , 1 ) n 1 A P I A P I G 1 α / 2 ( n , 1 ) = 1 α
p G α / 2 ( n , 1 ) n 1 A P I A P I G 1 α / 2 ( n , 1 ) n 1 A P I = 1 α ,
where G α / 2 ( n , 1 ) is the lower α / 2 quintile of G ( n , 1 ) , and G 1 α / 2 ( n , 1 ) is the lower 1 α / 2 quintile of G ( n , 1 ) . Therefore, the lower confidence limit of A P I can be expressed as follows:
L A P I = G α / 2 ( n , 1 ) n 1 A P I
Similarly, the upper confidence limit of A P I can be represented as follows:
U A P I = G 1 α / 2 ( n , 1 ) n 1 A P I .
Let t 1 , , t j , , t n be the observed value of T 1 , , T j , , T n , then the observed value of A P I is expressed as follows:
A P I 0 = U τ 0 ,
where τ 0 = n 1 1 j = 1 n t j is the observed value of τ . Therefore, the observed value of L A P I and U A P I can be demonstrated separately as follows:
L A P I 0 = G α / 2 ( n , 1 ) n 1 A P I 0 ;
U A P I 0 = G 1 α / 2 ( n , 1 ) n 1 A P I 0 .
As noted above, the statistical testing rules with significance level α can be listed as follows:
(1)
If U A P I 0 < A 0 , then reject H 0 and conclude that A P I < A 0 .
(2)
If L A P I 0 > A 0 , then reject H 0 and conclude that A P I > A 0 .
(3)
If L A P I 0 A 0 U A P I 0 , then do not reject H 0 and conclude that A P I = A 0 .

4. Fuzzy Evaluate Model for Performance Index A P I

With the gradual maturity and stability of the IoT environment and big data analytics technology, fast and accurate analysis and decision-making models have been developed via data, which seems to be the trend of business development. Not only can the models meet the needs of enterprises to pursue rapid response, but they also can help the industry move towards the goal of intelligent and innovative management. Nevertheless, under such a situation, the sample size is usually relatively small, which often leads to a decrease in the accuracy of evaluations. Various studies have pointed out that the fuzzy test based on the confidence interval can be derived from the accumulated data in the past, so the accuracy of evaluations can be improved in the state of small samples. Hence, this paper will apply the confidence interval derived in Section 2 to develop the fuzzy evaluation model of performance index A P I .
Based on Li et al. [20], the α - c u t s of triangular shaped fuzzy number A ˜ P I can be obtained below:
A ˜ P I α = A P I 1 ( α ) , A P I 2 ( α ) , 0.01 α 1 A P I 1 ( 0.01 ) , A P I 2 ( 0.01 ) , 0 α 0.01 ,
where:
A P I 1 ( α ) = G α / 2 ( n , 1 ) n 1 A P I 0 ;
A P I 2 ( α ) = G 1 α / 2 ( n , 1 ) n 1 A P I 0 .
Thus, the triangular shaped fuzzy number of A P I is A ˜ P I =   A L ,   A M , A R , where:
A L = G 0.005 ( n , 1 ) n 1 A P I 0 ;
A M = G 0.5 ( n , 1 ) n 1 A P I 0 ;
A R = G 0.995 ( n , 1 ) n 1 A P I 0 .
Furthermore, the membership function of A ˜ P I is:
η ( x ) = 0 i f   x < A L α i f   A L x < A M 1 i f   x = A M α i f   A M < x A R 0 i f   A R < x ,
where α′ and α″ are determined by:
G α / 2 ( n , 1 ) = n 1 x / A P I 0
and:
G 1 α / 2 ( n , 1 ) = n 1 x / A P I 0 .
According to Equation (22), we can construct a graph containing membership function η ( x ) with vertical line x = A 0 as illustrated in Figure 2.
In Figure 2, the y-axis is α and x-axis is x, where x = G α / 2 ( n , 1 ) / n 1 A P I 0 for x A M and x = G 1 α / 2 ( n , 1 ) / n 1 A P I 0 for x > A M .
Let set A T be the area in the graph of η ( x ) , such that:
A T = x , α A P I 1 ( α ) x A P I 2 ( α ) , 0 α 1 .
Since the calculation of A T is complicated, this study uses d T to replace A T for practical application according to the method proposed by Chen [21]. As d T is the length of the bottom of A T , then d T = A R A L can be expressed as follows:
d T = G 0.995 ( n , 1 ) n 1 G 0.005 ( n , 1 ) n 1 A P I 0
On the other hand, let set A S be the area in the graph of η ( x ) but to the right of the vertical line x = A 0 , then:
A S = x , α A 0 x A P I 2 ( α ) , 0 α a 0 ,
where:
A 0 = A P I 1 ( a 0 )   i f   A 0 A M A P I 2 ( a 0 )   i f   A 0 > A M .
Similarly, when d S is the length of the bottom of A S , then d S = A R A 0 can be calculated as follows:
d S = 0   i f   A 0 > U A P I 0 G 0.995 ( n , 1 ) n 1 A P I 0 A 0   i f   L A P I 0 A 0 U A P I 0 1   i f   A 0 < L A P I 0 .
Thus, the value of d S / d T can be calculated as follows:
d S / d T = 0   i f   A 0 > U A P I 0 G 0.995 ( n , 1 ) A P I 0 n 1 A 0 G 0.995 ( n , 1 ) G 0.005 ( n , 1 ) A P I 0   i f   L A P I 0 A 0 U A P I 0 1   i f   A 0 < L A P I 0 .
Next, according to Lee et al. [27] let 0 <   ϕ < 0.5 and revise the method of Li et al. [19] to formulate the fuzzy evaluation rules as follows:
(1)
If d S / d T < ϕ , then reject H 0 and conclude that A P I < A 0 .
(2)
If  d S / d T > 1 ϕ , then reject H 0 and conclude that A P I > A 0 .
(3)
If ϕ d S / d T 1 ϕ , then do not reject H 0 and conclude that A P I = A 0 .

5. Application Example

In this section, we use an application example to demonstrate the fuzzy evaluation method for the bank APP proposed in Section 4. Suppose that a bank APP evaluates its performance with a goal set at the A P I = 5 ( A 0 = 5) against the alternative hypothesis H 1 : A P I 5. This Is equivalent to the following hypotheses:
Null Hypothesis H 0 : A P I = 5
versus
Alternative Hypothesis H 1 : A P I 5.
Let T 1 , , T j , , T 225 be random variables of an i.i.d. with the exponential distribution. Based on the observed value t 1 , , t j , , t 225 and set U = 10, then we have:
τ 0 = n 1 1 j = 1 n t j = 225 1 1 j = 1 225 t j = 2.33
A P I 0 = U τ 0 = 10 2.33 = 4.29 .
In fact, we have G 0.005 250 , 1 = 188.24, G 0.5 250 , 1 = 224.67, and G 0.995 250 , 1 265.51. Therefore, the observed values of A L , A M , and A R can be individually calculated as follows:
A L = G 0.005 ( n , 1 ) n 1 A P I 0 = 188.24 224 × 4.29 = 3.60 ;
A M = G 0.5 ( n , 1 ) n 1 A P I 0 = 224.67 224 × 4.29 = 4.30 ;
A R = G 0.995 ( n , 1 ) n 1 A P I 0 = 265.51 224 × 4.29 = 5.08 .
Therefore, the triangular shaped fuzzy number of A P I is A ˜ P I = 3.61 ,   4 . 30 ,   5.08 and the membership function of A ˜ P I can be exhibited as follows:
η ( x ) = 0 i f   x < 3.61 α i f   3.61 x < 4.30 1 i f   x = 4.30 α i f   4.30 < x 5.08 0 i f   5.08 < x
where α′ and α″ are determined by:
G α / 2 ( 225 , 1 ) = 52.21 x
and:
G 1 α / 2 ( 225 , 1 ) = 52.21 x .
Thus, the graph of membership function η ( x ) with vertical line x = 5 is presented in Figure 3. In Figure 3, the y-axis is α and x-axis is x, where x = G α / 2 ( 225 , 1 ) × 4.29 / 224 for x 4.30 and x = G 1 α / 2 ( 225 , 1 ) × 4.29 / 224 for x > 4.30 .
According to the above-mentioned, the values of dT = ARAL and dS = ARA0 can be calculated as follows:
d T = G 0.995 ( 225 , 1 ) 224 G 0.005 ( 225 , 1 ) 224 A P I 0 = 265.51 224 188.24 224 × 4.29 = 1.48 ;
d S = G 0.995 ( 225 , 1 ) 224 A P I 0 A 0 = 265.51 224 × 4.29 5 = 0.08 .
Thus, the value of d S / d T can be calculated as follows:
d S / d T = 0.08 1.48 = 0.05 .
Based on Li et al. [20], take ϕ = 0.2, and since d S / d T = 0.05 < ϕ , then reject and conclude that A P I < 5. According to the statistical test, the upper limit of index A P I is U A P I 0 = 5.08 > A 0 = 5, so H 0 is not rejected, and A P I > A 0 = 5 is concluded. As a matter of fact, the value of A P I 0 is only 4.29 ( A P I 0   = 4.29), which is far less than 5. Based on the above-stated, it is obvious that the fuzzy test is more reasonable than the statistical test.

6. Conclusions

In this paper, we proposed an APP performance index to evaluate the performance of a bank APP. This performance index and the rate of non-compliance with performance requirements q have a one-to-one mathematical relationship. The rate of non-compliance with performance q is the monotonically decreasing function because the partial differentiation for q is negative. In order to solve the problem that small samples easily increase the evaluation errors, we proposed a fuzzy evaluation method using the APP performance index as a decision-making basis of improvement. Obviously, this approach is a conventional measurement method which can be used during the confidence interval of the APP performance index and then can be used to construct a fuzzy membership function for a fuzzy evaluation. Furthermore, the advantage of this approach is not only to lower the risk of misjudgment caused by sampling errors but also to enhance the accuracy of the evaluation. In addition, this study presented a simple calculation model to obtain the approximate values of d S and d T , which makes a valuable contribution in practice. We further took an application example to illustrate the proposed fuzzy evaluation method. This example demonstrated that from a practical perspective the proposed approach derived more reasonable results than the statistical method. Based on the above-mentioned, the method proposed in this paper can not only meet the needs of enterprises to pursue rapid response but also help the industry achieve the effects of cost reduction, energy saving and carbon reduction, and then it moves towards the goal of innovative and intelligent management. In addition, the aspects in which the fuzzy evaluation method is superior to the statistical testing method include: (1) it can be integrated into the expert experience of the past accumulated data, and the accuracy of the evaluation can be maintained when the sample size is small; (2) the applied small samples can answer the enterprises’ need for quick response.

7. Limitations and Future Research

The fuzzy evaluation model of the bank App performance proposed by this study is applicable to exponential process distribution and belongs to the smaller-the-better performance characteristic. In contrast, this model is not applicable to other distributions, such as normal distributions. Normal distributions of the smaller-the-better performance characteristic characteristics that cannot be included in this research could be a topic for future research.

Author Contributions

Conceptualization, T.C. and K.-S.C.; methodology, T.C. and K.-S.C.; software, T.-H.H.; validation, C.-M.Y.; formal analysis, T.C. and K.-S.C.; resources, T.C. and C.-M.Y.; data curation, C.-M.Y. and T.-H.H.; writing—original draft preparation, T.C., C.-M.Y., K.-S.C. and T.-H.H.; writing—review and editing, T.C. and K.-S.C.; visualization, T.-H.H.; supervision, K.-S.C.; project administration, T.C. and T.-H.H. All authors have read and agreed to the published version of the manuscript.

Funding

This work was financially supported by Foundation of College’s Key Research base on Humanities and Social Science in Guangdong Province, China: Pearl River Delta Industrial Ecology Research Center under Grant No.2016WZJD005 and Quality and Brand Development Research Center in Dongguan University of Technology under Grant No. GB200101.

Institutional Review Board Statement

Not applicable.

Informed Consent Statement

Not applicable for studies not involving humans.

Conflicts of Interest

The authors declare no conflict of interest.

Nomenclature

N t The number of customers entering the APP
λ The rate of Poisson distribution
T j The elapsed time from the ( j 1 ) s t customer entering the APP until the occurrence of the j t h customer
T 1 , , T j ,       , T n ,       The sequence of interval times
τ The mean time between two customers continuously entering the APP
N 0 at least customers number are required to enter the APP for operation within a time unit
U 1 / N 0
A P I 
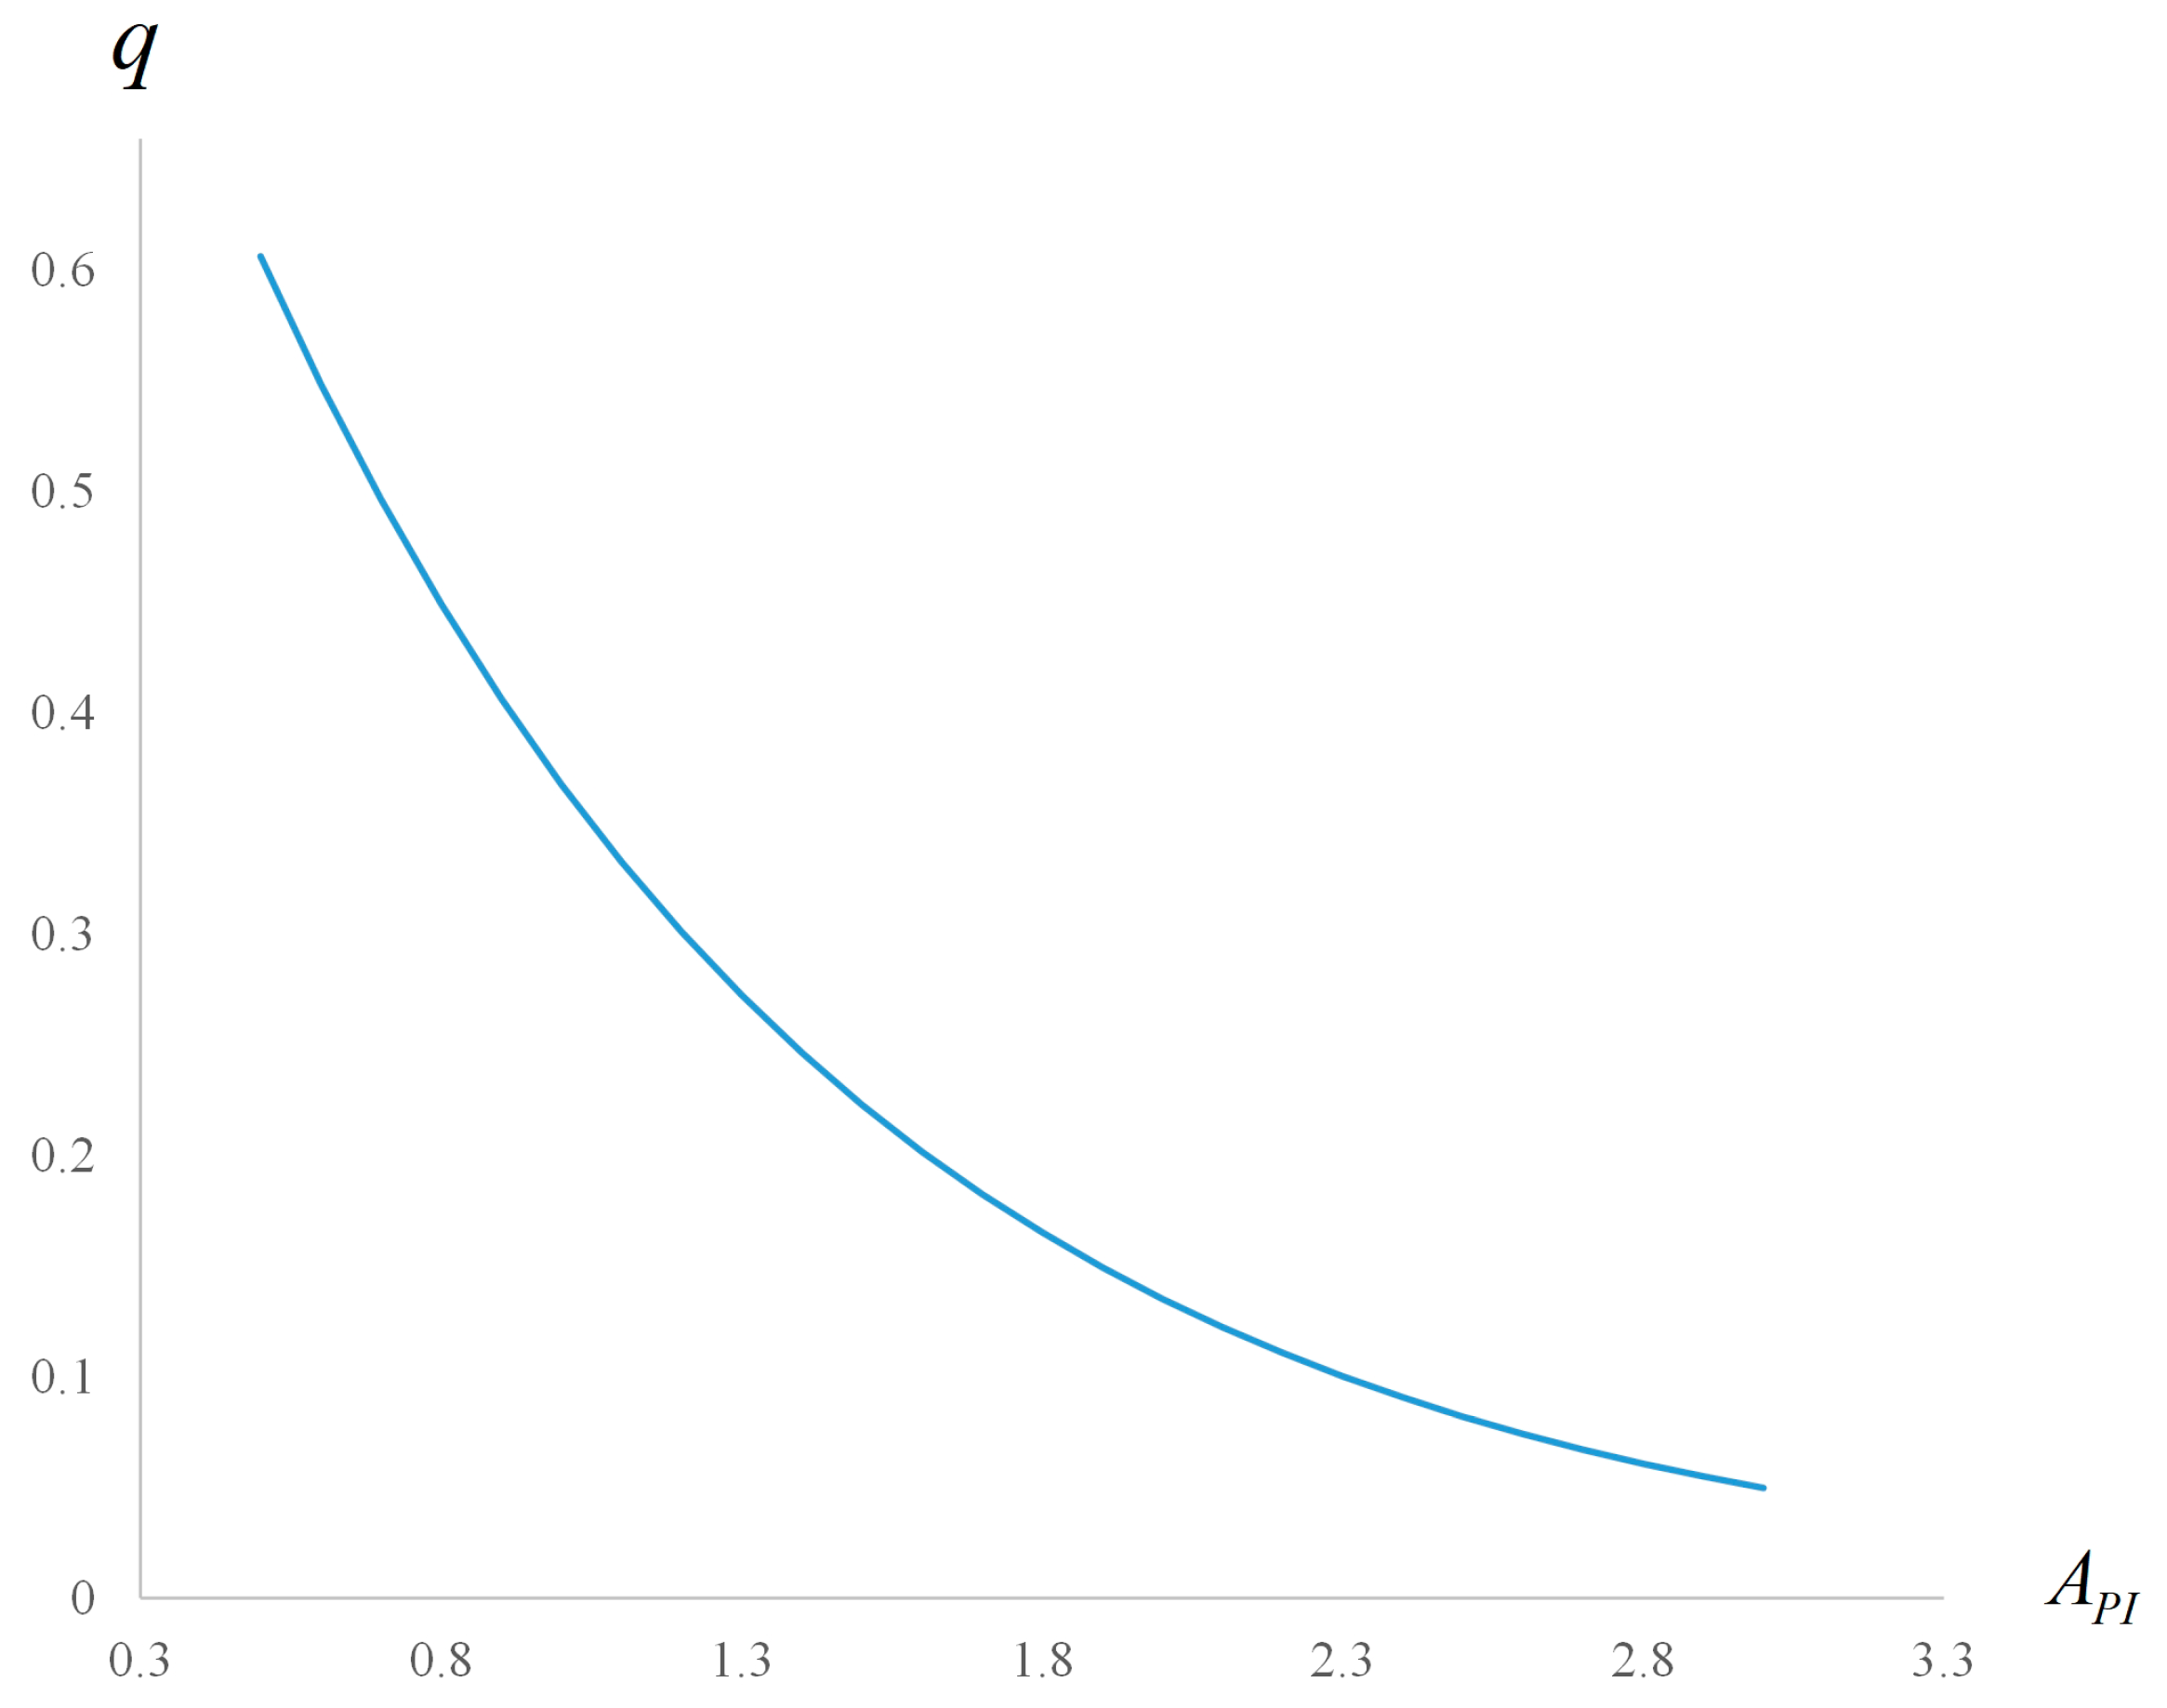
The APP performance index
qThe rate of non-compliance with performance requirements
A 0 The required performance value of the index A P I
H 0 Null hypothesis
H 1 Alternative hypothesis
α Significance level
A P I An unbiased estimator of A P I
τ The estimator of mean τ
f W w The probability density function of W
L A P I The lower confidence limit of A P I
U A P I The upper confidence limit of A P I
t 1 , , t j , , t n The observed value of T 1 , , T j , , T n
A P I 0 The observed value of A P I
τ 0 The observed value of τ
L A P I 0 The observed value of L A P I
U A P I 0 The observed value of U A P I
A ˜ P I α 
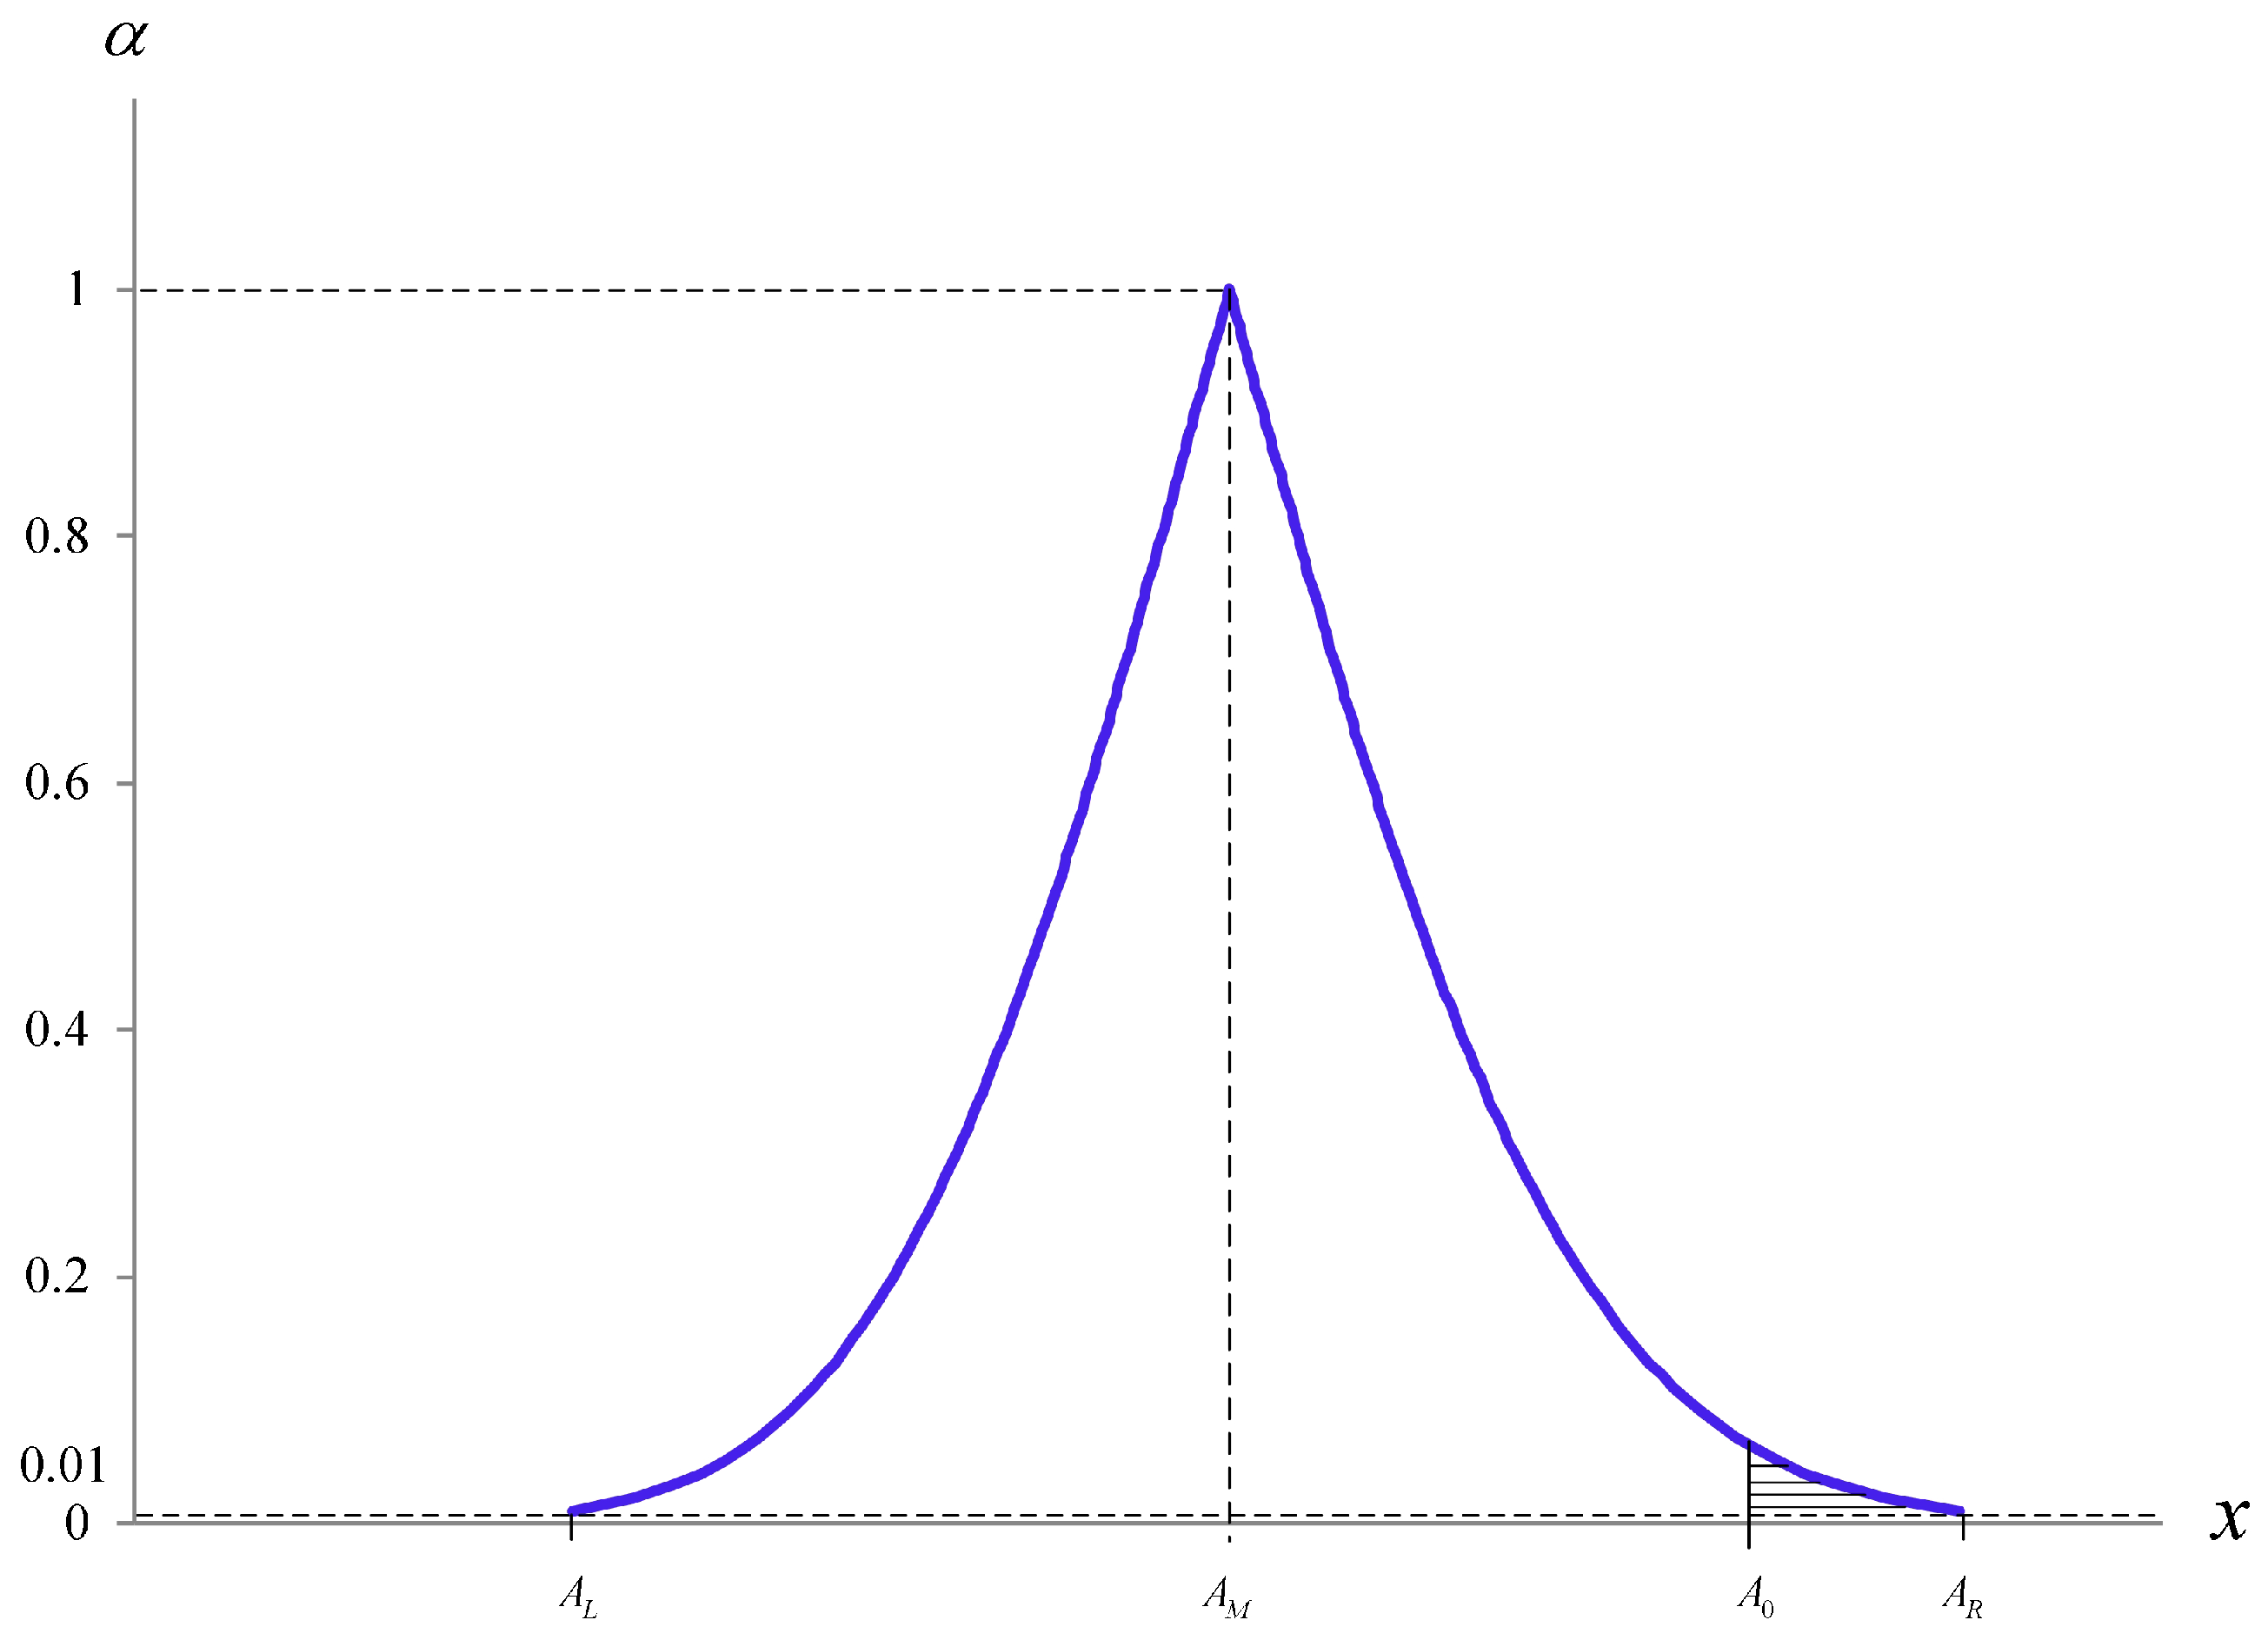
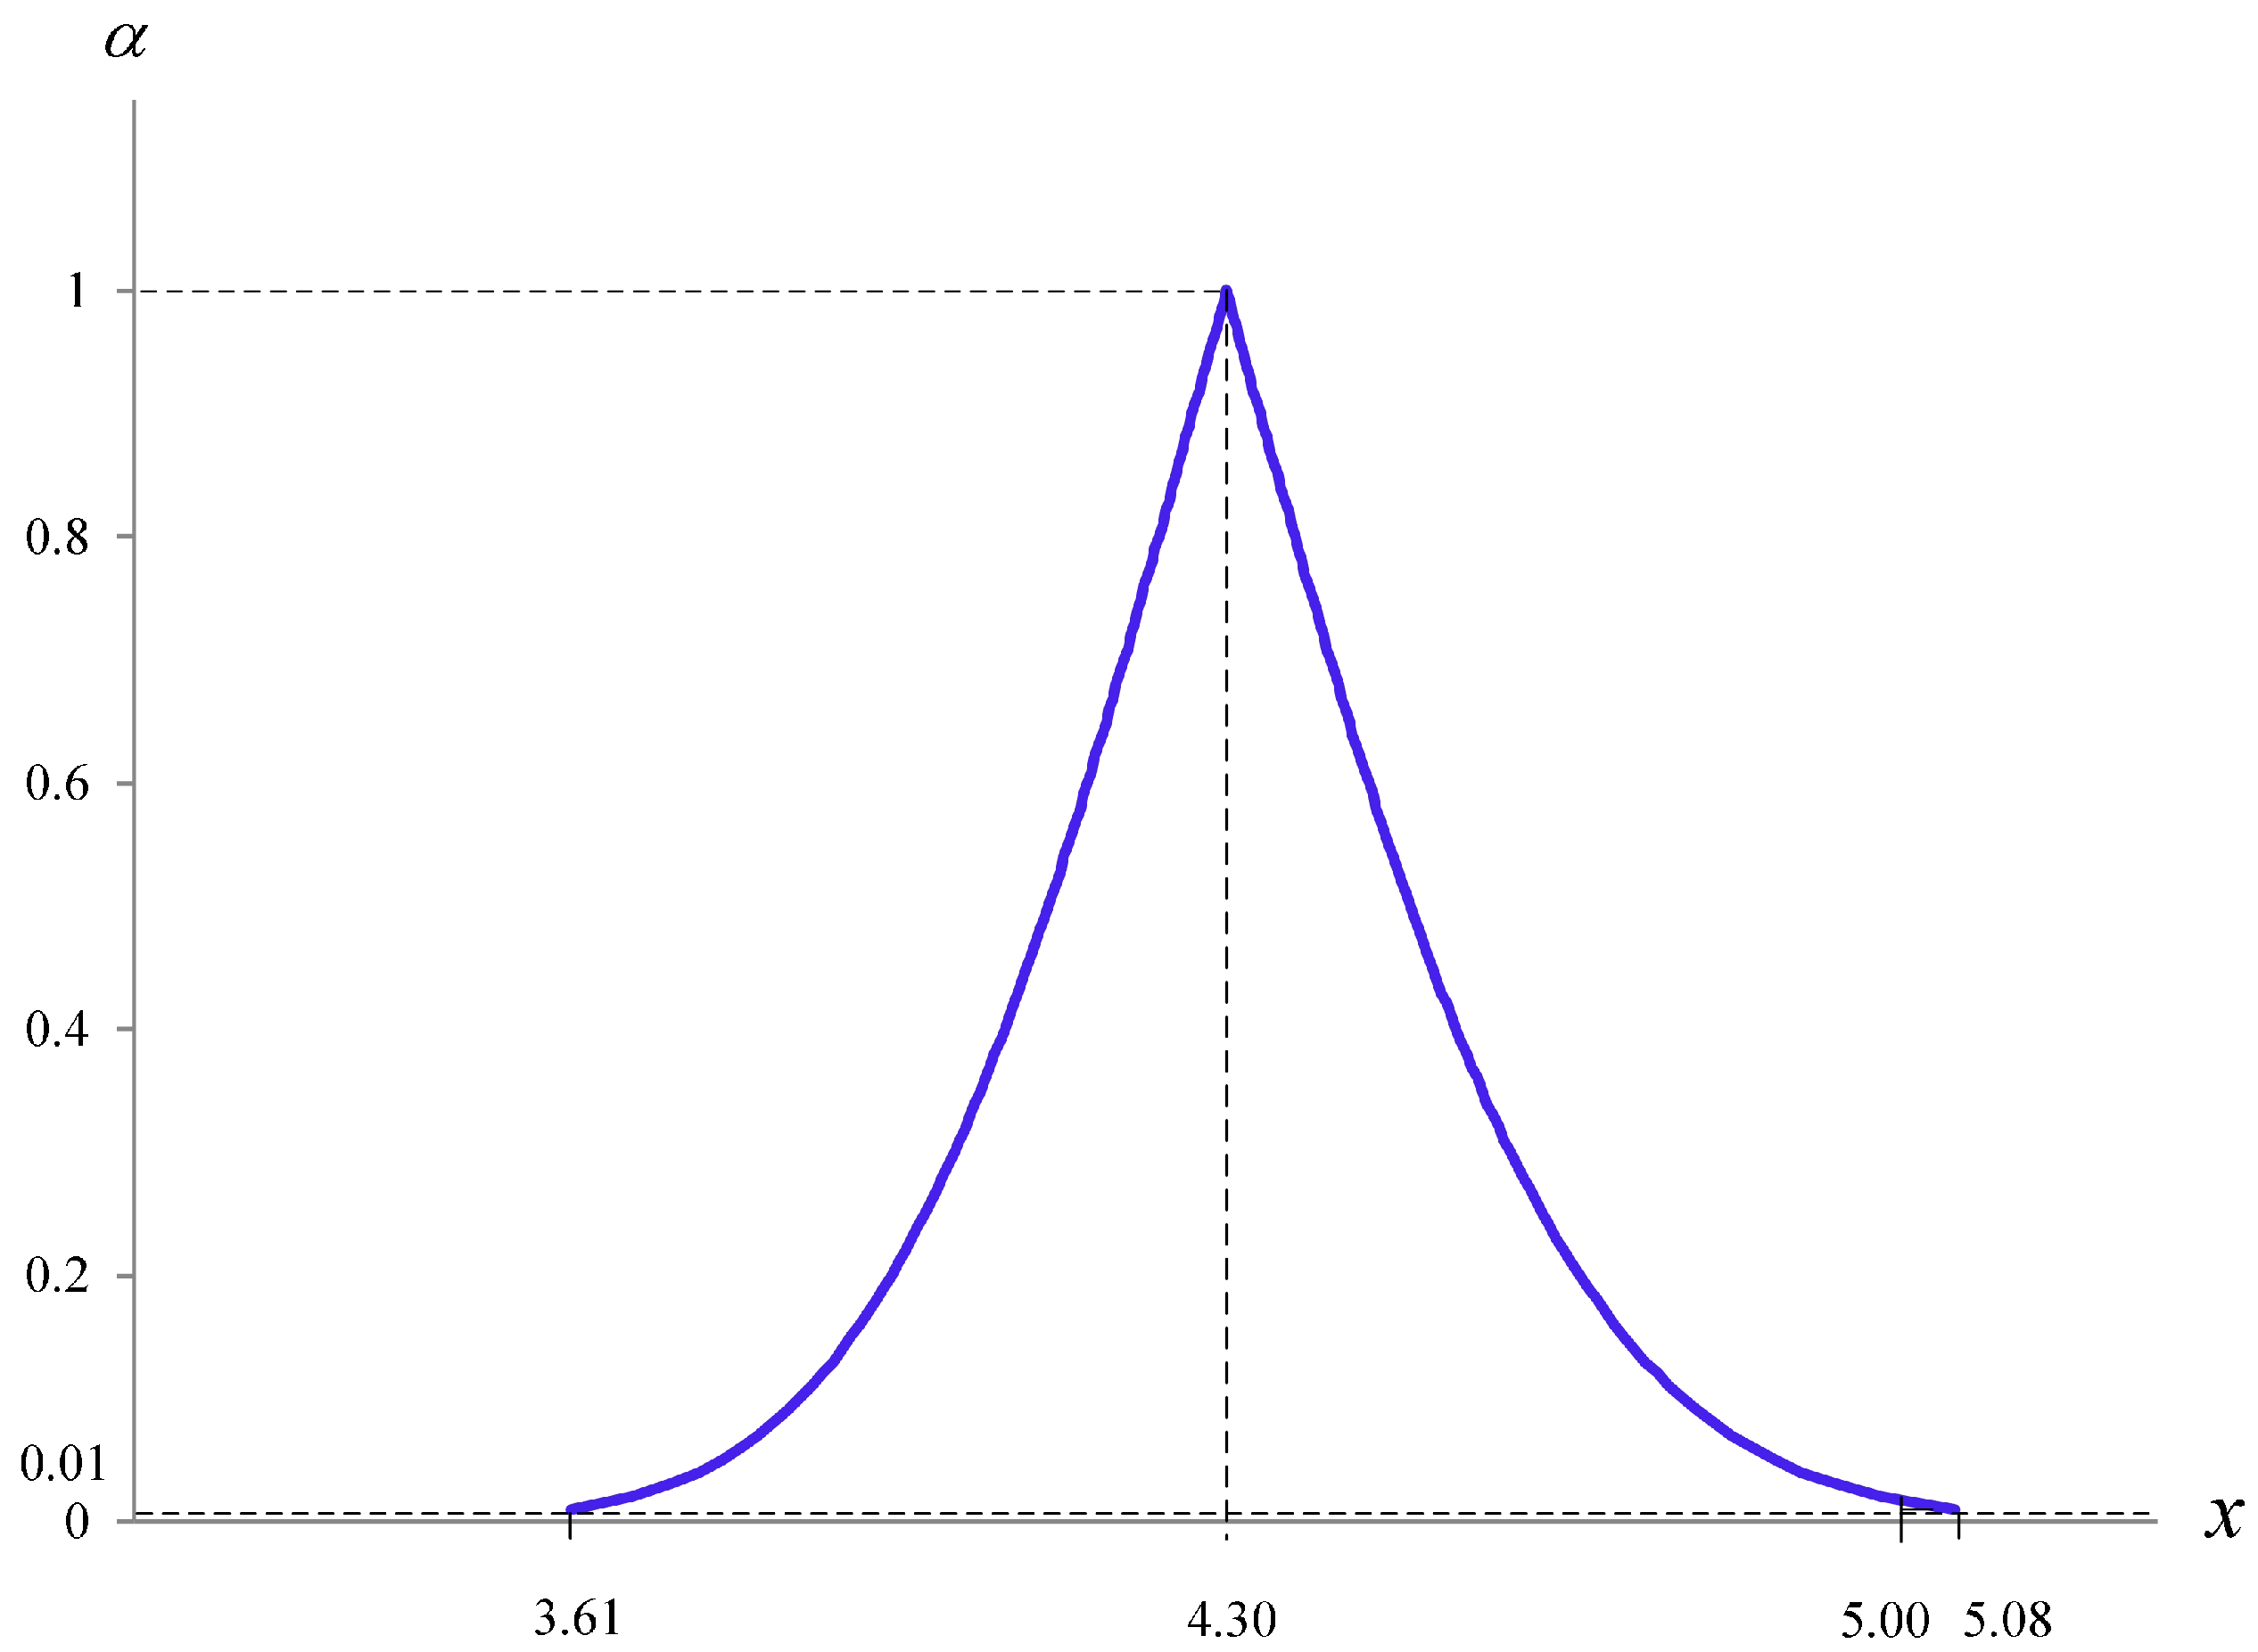
The α-cuts of the triangular shaped fuzzy number A ˜ P I
A ˜ P I The triangular shaped fuzzy number of A P I
η ( x ) The membership function of A ˜ P I
A T The area in the graph of η ( x )
A S The area in the graph of η ( x ) but to the right of the vertical line x = A 0
d T A R A L
d S A R A 0

References

  1. Vătămănescu, E.M.; Dabija, D.C.; Gazzola, P.; Cegarro-Navarro, J.G.; Buzzi, T. Before and after the outbreak of covid-19: Linking fashion companies’ corporate social responsibility approach to consumers’ demand for sustainable products. J. Clean. Prod. 2021, 321, 128945. [Google Scholar] [CrossRef]
  2. Zerbino, P.; Stefanini, A.; Aloini, D.; Dulmin, R.; Mininno, V. Curling linearity into circularity: The benefits of formal scavenging in closed-loop settings. Int. J. Prod. Econ. 2021, 240, 108246. [Google Scholar] [CrossRef]
  3. Suzanne, E.; Absi, N.; Borodin, V.; van den Heuvel, W. Lot-sizing for industrial symbiosis. Comput. Ind. Eng. 2021, 160, 107464. [Google Scholar] [CrossRef]
  4. Karayılan, S.; Yılmaz, Ö.; Uysal, Ç.; Naneci, S. Prospective evaluation of circular economy practices within plastic packaging value chain through optimization of life cycle impacts and circularity. Resour. Conserv. Recycl. 2021, 173, 105691. [Google Scholar] [CrossRef]
  5. Mayerová, Š. The effects of entrepreneurs’ characteristics on internationalisation of gazelle firms: A case of Lithuania. Econ. Res.-Ekon. Istraz. 2019, 32, 2864–2881. [Google Scholar]
  6. Ahmad, S.; Wong, K.Y.; Tseng, M.L.; Wong, W.P. Sustainable product design and development: A review of tools, applications and research prospects. Resour. Conserv. Recycl. 2018, 132, 49–61. [Google Scholar] [CrossRef]
  7. Amindoust, A.; Ahmed, S.; Saghafinia, A.; Bahreininejad, A. Sustainable supplier selection: A ranking model based on fuzzy inference system. Appl. Soft Comput. 2012, 12, 1668–1677. [Google Scholar] [CrossRef]
  8. Awasthi, A.; Govindan, K.; Gold, S. Multi-tier sustainable global supplier selection using a fuzzy AHP-VIKOR based approach. Int. J. Prod. Econ. 2018, 195, 106–117. [Google Scholar] [CrossRef] [Green Version]
  9. Lin, K.P.; Yu, C.M.; Chen, K.S. Production data analysis system using novel process capability indices-based circular economy. Ind. Manag. Data Syst. 2019, 119, 1655–1668. [Google Scholar] [CrossRef]
  10. Kala Kamdjoug, J.R.; Wamba-Taguimdje, S.L.; Wamba, S.F.; Kake, I.B. Determining factors and impacts of the intention to adopt mobile banking app in cameroon: Case of SARA by afriland first bank. J. Retail. Consum. Serv. 2021, 61, 102509. [Google Scholar] [CrossRef]
  11. Vărzaru, A.A.; Bocean, C.G.; Rotea, C.C.; Budică-Iacob, A.F. Assessing antecedents of behavioral intention to use mobile technologies in e-commerce. Electronics 2021, 10, 2231. [Google Scholar] [CrossRef]
  12. Ngubelanga, A.; Duffett, R. Modeling mobile commerce applications’ antecedents of customer satisfaction among millennials: An extended tam perspective. Sustainability 2021, 13, 5973. [Google Scholar] [CrossRef]
  13. Shankar, A.; Tiwari, A.K.; Gupta, M. Sustainable mobile banking application: A text mining approach to explore critical success factors. J. Enterp. Inf. Manag. 2021. [Google Scholar] [CrossRef]
  14. Cáceres-Flórez, C.A.; Rosário, J.M.; Amaya, D. Smart management of telemedicine rooms in an e-hospital emergency department. Stud. Fuzziness Soft Comput. 2021, 410, 65–97. [Google Scholar]
  15. Elahi, H.; Castiglione, A.; Wang, G.; Geman, O. A human-centered artificial intelligence approach for privacy protection of elderly app users in smart cities. Neurocomputing 2021, 444, 189–202. [Google Scholar] [CrossRef]
  16. Meshram, C.; Ibrahim, R.W.; Deng, L.; Shende, S.W.; Meshram, S.G.; Barve, S.K. A robust smart card and remote user password-based authentication protocol using extended chaotic maps under smart cities environment. Soft Comput. 2021, 25, 10037–10051. [Google Scholar] [CrossRef]
  17. Ross, S.M. Introduction to Probability Models, 4th ed.; Academic Press: San Diego, CA, USA, 1989. [Google Scholar]
  18. Kim, B.; Kim, J.; Bueker, O. Non-preemptive priority M/M/m queue with servers’ vacations. Comput. Ind. Eng. 2021, 160, 107390. [Google Scholar] [CrossRef]
  19. Chen, K.S.; Yang, C.M. Developing a performance index with a Poisson process and an exponential distribution for operations management and continuous improvement. J. Comput. Appl. Math. 2018, 343, 737–747. [Google Scholar] [CrossRef]
  20. Li, M.; Chen, K.S.; Yu, C.M.; Yang, C.M. A Fuzzy Evaluation Decision Model for the Ratio Operating Performance Index. Mathematics 2021, 9, 262. [Google Scholar] [CrossRef]
  21. Chen, K.S. Fuzzy testing of operating performance index based on confidence intervals. Ann. Oper. Res. 2019. [Google Scholar] [CrossRef]
  22. Galankashi, M.R.; Fallahiarezoudar, E.; Moazzami, A.; Helmi, S.A.; Rohani, J.M.; Yusof, N.M. An efficient integrated simulation–Taguchi approach for sales rate evaluation of a petrol station. Neural Comput. Appl. 2018, 29, 1073–1085. [Google Scholar] [CrossRef]
  23. Wu, C.H.; Hsu, Y.C.; Pearn, W.L. An improved measure of quality loss for notching processes. Qual. Reliab. Eng. Int. 2021, 37, 108–122. [Google Scholar] [CrossRef]
  24. Yu, C.M.; Lai, K.K.; Chen, K.S.; Chang, T.C. Process-quality evaluation for wire bonding with multiple gold wires. IEEE Access 2020, 8, 106075–106082. [Google Scholar] [CrossRef]
  25. Luo, W.J.; Chen, K.S.; Yu, C.M.; Hsu, T.H. The fuzzy process quality evaluation model for the stb quality characteristic of machining. Appl. Sci. 2020, 8272, 1–11. [Google Scholar]
  26. Maturo, F. A subjective approach to fuzzy events and their coherent probability assessment for decision making under uncertainty. J. Interdiscip. Math. 2018, 21, 1427–1445. [Google Scholar] [CrossRef]
  27. Lee, T.S.; Wang, C.H.; Yu, C.M. Fuzzy Evaluation Model for Enhancing E-Learning Systems. Mathematics 2019, 7, 918. [Google Scholar] [CrossRef] [Green Version]
Figure 1. Various values of performance index A P I and their corresponding values of q.
Mathematics 09 02761 g001
Figure 2. The membership function η ( x ) with vertical line x = A 0 .
Mathematics 09 02761 g002
Figure 3. The membership function η ( x ) with vertical line x = 5 .
Mathematics 09 02761 g003
Publisher’s Note: MDPI stays neutral with regard to jurisdictional claims in published maps and institutional affiliations.

