
A Comprehensive Review on Seismocardiogram: Current Advancements on Acquisition, Annotation, and Applications

 , , , , and
Abstract
:1. Introduction
2. Data Acquisition
2.1. Contact-Based Acquisition from Patients at Rest
2.2. Contact-Based Acquisition from Ambulatory Patients
2.3. Noncontact Based Acquisition from Single Point
2.4. Noncontact-Based Acquisition from Multipoint
3. Data Preprocessing and Noise Reduction
4. Annotation of Signal Feature Points
4.1. Temporal Envelope-Based with ECG as Reference
4.2. Temporal Envelope-Based without ECG as Reference
4.3. Machine Learning-Based Approach
4.4. Visual Inspection and Comparison-Based Approach
5. Recent Works
6. Experimental Analysis Using SCG
7. Applications
7.1. Extraction of CTI for Cardiac Health Monitoring
7.1.1. Extraction of Systolic Time Interval
7.1.2. Extraction of Diastolic Time Information
7.2. Atrial Fibrillation
7.3. Cardiac Computing Tomography Gating Based on Quiescence Prediction
7.4. Heart Rate and Heart Rate Variability Index
7.5. Myocardial Ischemia
7.6. Myocardial Contractility
7.7. Pulse Transit Time (PTT)
7.8. Respiratory Information
7.9. Fetal Surveillance
7.10. Cardiac Stress Monitoring
7.11. Cardiac Hemorrhage
7.12. Other Applications
8. Summary and Open Issues for Future Research
- Few studies focused on using a robust documentation of the relationship between feature points and their physiological sources. It would be useful to investigate the relationship between SCG waves and cardiac activities.
- SCG variability is affected by several factors including respiratory phases, gender, age, sensor location, health conditions, cardiac contractility, heart rhythm, and postural positions. A deeper study of these factors will the enhance understanding of SCG signals and can guide to achieve better groupings of similar SCG events to reduce variability and noise. It may also lead to a more accurate definition of SCG features points.
- Existing data acquisition is mostly based on contact sensors attached to the skin, which is irritable and produces skin coupling. Therefore, efficient contactless SCG detection techniques would be needed.
- Continuous monitoring might help in the early detection of serious cardiac conditions and potentially reduce cardiac health care costs. Currently, very few systems are available for at-home and continuous monitoring. An efficient at-home data acquisition system could be developed for regular monitoring.
- Assessment of day-to-day cardiac mechanical variability may help in the development of a robust SCG analysis system.
- Studies show that the SCG signal is mostly contaminated by motion-artifacts. Techniques for removing noises in ambulatory settings need to be developed.
- Several machine learning approaches were applied for determining feature points. Nevertheless, it may be applied for other different purposes in SCG studies, including classification into different phases of the respiratory cycle, calculation of cardiac time intervals, and classification of patients into high-, low-, and normal-risk.
- Fetal surveillance is a new area where SCG can be applied for monitoring HR and respiratory phases.
- SCG can be applied for monitoring the cardiac health of patients with epilepsy.
9. Conclusions
Author Contributions
Funding
Institutional Review Board Statement
Informed Consent Statement
Data Availability Statement
Conflicts of Interest
References
- Quaglini, S.; Stefanelli, M.; Boiocchi, L.; Campari, F.; Cavallini, A.; Micieli, G. Cardiovascular risk calculators: Understanding differences and realising economic implications. Int. J. Med. Inform. 2005, 74, 191–199. [Google Scholar] [CrossRef]
- Benjamin, E.J.; Muntner, P.; Bittencourt, M.S. Heart disease and stroke statistics-2019 update: A report from the American Heart Association. Circulation 2019, 139, e56–e528. [Google Scholar] [CrossRef] [PubMed]
- Neubeck, L.; Coorey, G.; Peiris, D.; Mulley, J.; Heeley, E.; Hersch, F.; Redfern, J. Development of an integrated e-health tool for people with, or at high risk of, cardiovascular disease: The Consumer Navigation of Electronic Cardiovascular Tools (CONNECT) web application. Int. J. Med. Inform. 2016, 96, 24–37. [Google Scholar] [CrossRef] [PubMed]
- Blecker, S.; Austrian, J.S.; Horwitz, L.I.; Kuperman, G.; Shelley, D.; Ferrauiola, M.; Katz, S.D. Interrupting providers with clinical decision support to improve care for heart failure. Int. J. Med. Inform. 2019, 131, 103956. [Google Scholar] [CrossRef]
- Tison, G.H.; Chamberlain, A.M.; Pletcher, M.J.; Dunlay, S.M.; Weston, S.A.; Killian, J.M.; Olgin, J.E.; Roger, V.L. Identifying heart failure using EMR-based algorithms. Int. J. Med. Inform. 2018, 120, 1–7. [Google Scholar] [CrossRef] [PubMed]
- Yanicelli, L.M.; Vegetti, M.; Goy, C.B.; Martínez, E.C.; Herrera, M.C. SiTe iC: A telemonitoring system for heart failure patients. Int. J. Med. Inform. 2020, 141, 104204. [Google Scholar] [CrossRef]
- Lukkarinen, S. Phonocardiography: Development of a Clinical System and Its Application to Screening for Paediatric Heart Murmurs. Ph.D. Thesis, Aalto University, Espoo, Finland, 2012. [Google Scholar]
- Einthoven, W. The string galvanometer and the human electrocardiogram. Knaw Proc. 1903, 6, 107–115. [Google Scholar]
- Jekova, I.; Vassilev, P.; Stoyanov, T.; Pencheva, T. InterCriteria Analysis: Application for ECG Data Analysis. Mathematics 2021, 9, 854. [Google Scholar] [CrossRef]
- Starr, I.; Rawson, A.; Schroeder, H.; Joseph, N. Studies on the estimation of cardiac ouptut in man, and of abnormalities in cardiac function, from the heart’s recoil and the blood’s impacts; the ballistocardiogram. Am. J. Physiol.-Leg. Content 1939, 127, 1–28. [Google Scholar] [CrossRef]
- Bour, J.; Kellett, J. Impedance cardiography—A rapid and cost-effective screening tool for cardiac disease. Eur. J. Intern. Med. 2008, 19, 399–405. [Google Scholar] [CrossRef]
- Edler, I.; Lindström, K. The history of echocardiography. Ultrasound Med. Biol. 2004, 30, 1565–1644. [Google Scholar] [CrossRef]
- Mounsey, P. Praecordial ballistocardiography. Br. Heart J. 1957, 19, 259. [Google Scholar] [CrossRef] [Green Version]
- Dilsizian, V.; Taillefer, R. Journey in Evolution of Nuclear Cardiology: Will There Be Another Quantum Leap With the F-18–Labeled Myocardial Perfusion Tracers? JACC Cardiovasc. Imaging 2012, 5, 1269–1284. [Google Scholar] [CrossRef] [Green Version]
- Pauwels, E.; Van Loo, D.; Cornillie, P.; Brabant, L.; Van Hoorebeke, L. An exploratory study of contrast agents for soft tissue visualization by means of high resolution X-ray computed tomography imaging. J. Microsc. 2013, 250, 21–31. [Google Scholar] [CrossRef]
- White, J.A.; Patel, M.R. The role of cardiovascular MRI in heart failure and the cardiomyopathies. Magn. Reson. Imaging Clin. N. Am. 2007, 15, 541–564. [Google Scholar] [CrossRef] [PubMed]
- Tadi, M.J.; Lehtonen, E.; Pankäälä, M.; Saraste, A.; Vasankari, T.; Terás, M.; Koivisto, T. Gyrocardiography: A new non-invasive approach in the study of mechanical motions of the heart. Concept, method and initial observations. In Proceedings of the 2016 38th Annual International Conference of the IEEE Engineering in Medicine and Biology Society (EMBC), Orlando, FL, USA, 16–20 August 2016; pp. 2034–2037. [Google Scholar]
- Meriheinä, U.; Juppo, M.; Koivisto, T.; Pänäälä, M.; Sairanen, K.; Grönholm, M. Heart Monitoring System. U.S. Patent 10,178,964, 1 January 2019. [Google Scholar]
- Salerno, D.M. Seismocardiography: A new technique for recording cardiac vibrations. concept, method, and initial observations. J. Cardiovasc. Technol. 1990, 9, 111–118. [Google Scholar]
- Agress, C.M.; Fields, L.G. New method for analyzing heart vibrations: I. Low frequency vibrations. Am. J. Cardiol. 1959, 4, 184–190. [Google Scholar] [CrossRef]
- Salerno, D.M.; Zanetti, J. Seismocardiography for monitoring changes in left ventricular function during ischemia. Chest 1991, 100, 991–993. [Google Scholar] [CrossRef] [Green Version]
- Crow, R.S.; Hannan, P.; Jacobs, D.; Hedquist, L.; Salerno, D.M. Relationship between seismocardiogram and echocardiogram for events in the cardiac cycle. Am. J. Noninvasive Cardiol. 1994, 8, 39–46. [Google Scholar] [CrossRef]
- Akhbardeh, A.; Tavakolian, K.; Gurev, V.; Lee, T.; New, W.; Kaminska, B.; Trayanova, N. Comparative analysis of three different modalities for characterization of the seismocardiogram. In Proceedings of the 2009 Annual International Conference of the IEEE Engineering in Medicine and Biology Society, Minneapolis, MN, USA, 3–6 September 2009; pp. 2899–2903. [Google Scholar] [CrossRef] [Green Version]
- Ngai, B.; Tavakolian, K.; Akhbardeh, A.; Blaber, A.P.; Kaminska, B.; Noordergraaf, A. Comparative analysis of seismocardiogram waves with the ultra-low frequency ballistocardiogram. In Proceedings of the 2009 Annual International Conference of the IEEE Engineering in Medicine and Biology Society, Minneapolis, MN, USA, 3–6 September 2009; pp. 2851–2854. [Google Scholar]
- Inan, O.T.; Migeotte, P.F.; Park, K.S.; Etemadi, M.; Tavakolian, K.; Casanella, R.; Zanetti, J.; Tank, J.; Funtova, I.; Prisk, G.K.; et al. Ballistocardiography and seismocardiography: A review of recent advances. IEEE J. Biomed. Health Inform. 2014, 19, 1414–1427. [Google Scholar] [CrossRef] [PubMed] [Green Version]
- Taebi, A.; Solar, B.E.; Bomar, A.J.; Sandler, R.H.; Mansy, H.A. Recent advances in seismocardiography. Vibration 2019, 2, 5. [Google Scholar] [CrossRef] [PubMed] [Green Version]
- Feigen, L.P. Physical characteristics of sound and hearing. Am. J. Cardiol. 1971, 28, 130–133. [Google Scholar] [CrossRef]
- Yang, C.; Tavassolian, N. Combined seismo and gyro cardiography: A more comprehensive evaluation of heart-induced chest vibrations. IEEE J. Biomed. Health Inform. 2017, 22, 1466–1475. [Google Scholar] [CrossRef] [PubMed]
- Leitão, F.; Moreira, E.; Alves, F.; Lourenço, M.; Azevedo, O.; Gaspar, J.; Rocha, L. High-Resolution Seismocardiogram Acquisition and Analysis System. Sensors 2018, 18, 3441. [Google Scholar] [CrossRef] [Green Version]
- Sahoo, P.; Thakkar, H.; Lee, M.Y. A cardiac early warning system with multichannel SCG and ECG monitoring for mobile health. Sensors 2017, 17, 711. [Google Scholar] [CrossRef] [PubMed]
- Ha, T.; Tran, J.; Liu, S.; Jang, H.; Jeong, H.; Mitbander, R.; Huh, H.; Qiu, Y.; Duong, J.; Wang, R.L.; et al. A Chest-Laminated Ultrathin and Stretchable E-Tattoo for the Measurement of Electrocardiogram, Seismocardiogram, and Cardiac Time Intervals. Adv. Sci. 2019, 6, 1900290. [Google Scholar] [CrossRef] [Green Version]
- Mitra, U.; Emken, B.A.; Lee, S.; Li, M.; Rozgic, V.; Thatte, G.; Vathsangam, H.; Zois, D.S.; Annavaram, M.; Narayanan, S.; et al. KNOWME: A case study in wireless body area sensor network design. IEEE Commun. Mag. 2012, 50, 116–125. [Google Scholar] [CrossRef]
- Sahoo, P.; Thakkar, H.; Lin, W.Y.; Chang, P.C.; Lee, M.Y. On the design of an efficient cardiac health monitoring system through combined analysis of ecg and scg signals. Sensors 2018, 18, 379. [Google Scholar] [CrossRef] [Green Version]
- Javaid, A.Q.; Ashouri, H.; Dorier, A.; Etemadi, M.; Heller, J.A.; Roy, S.; Inan, O.T. Quantifying and reducing motion artifacts in wearable seismocardiogram measurements during walking to assess left ventricular health. IEEE Trans. Biomed. Eng. 2016, 64, 1277–1286. [Google Scholar] [CrossRef]
- Etemadi, M.; Inan, O.T.; Heller, J.A.; Hersek, S.; Klein, L.; Roy, S. A Wearable Patch to Enable Long-Term Monitoring of Environmental, Activity and Hemodynamics Variables. IEEE Trans. Biomed. Circuits Syst. 2016, 10, 280–288. [Google Scholar] [CrossRef] [Green Version]
- Morbiducci, U.; Scalise, L.; De Melis, M.; Grigioni, M. Optical vibrocardiography: A novel tool for the optical monitoring of cardiac activity. Ann. Biomed. Eng. 2007, 35, 45–58. [Google Scholar] [CrossRef] [PubMed]
- Xia, Z.; Shandhi, M.M.H.; Inan, O.T.; Zhang, Y. Interference and Removal of Respiration Harmonics on Noncontact Seismo-cardiogram Signals. Struct. Health Monit. 2017, 2017. [Google Scholar] [CrossRef]
- Xia, Z.; Shandhi, M.M.H.; Inan, O.T.; Zhang, Y. Non-Contact Sensing of Seismocardiogram Signals Using Microwave Doppler Radar. IEEE Sens. J. 2018, 18, 5956–5964. [Google Scholar] [CrossRef]
- Shirkovskiy, P.; Laurin, A.; Chapelle, D.; Fink, M.; Ing, R. Contactless mapping of thoracic and abdominal motion: Applications for seismocardiography. In Proceedings of the 2017 Computing in Cardiology (CinC), Rennes, France, 24–27 September 2017; pp. 1–4. [Google Scholar]
- Yang, C.; Tang, S.; Tavassolian, N. Utilizing gyroscopes towards the automatic annotation of seismocardiograms. IEEE Sens. J. 2017, 17, 2129–2136. [Google Scholar] [CrossRef]
- Yang, C.; Tavassolian, N. Pulse transit time measurement using seismocardiogram, photoplethysmogram, and acoustic recordings: Evaluation and comparison. IEEE J. Biomed. Health Inform. 2017, 22, 733–740. [Google Scholar] [CrossRef] [PubMed]
- Paukkunen, M.; Parkkila, P.; Hurnanen, T.; Pänkäälä, M.; Koivisto, T.; Nieminen, T.; Kettunen, R.; Sepponen, R. Beat-by-beat quantification of cardiac cycle events detected from three-dimensional precordial acceleration signals. IEEE J. Biomed. Health Inform. 2015, 20, 435–439. [Google Scholar] [CrossRef] [PubMed] [Green Version]
- Lee, J.; McManus, D.D.; Merchant, S.; Chon, K.H. Automatic motion and noise artifact detection in Holter ECG data using empirical mode decomposition and statistical approaches. IEEE Trans. Biomed. Eng. 2011, 59, 1499–1506. [Google Scholar]
- Wu, Z.; Huang, N.E. A study of the characteristics of white noise using the empirical mode decomposition method. Proc. R. Soc. London. Ser. A Math. Phys. Eng. Sci. 2004, 460, 1597–1611. [Google Scholar] [CrossRef]
- Taebi, A.; Mansy, H. Noise cancellation from vibrocardiographic signals based on the ensemble empirical mode decomposition. J. Biotechnol. Bioeng. 2017, 2, 00024. [Google Scholar] [CrossRef] [Green Version]
- Chang, K.M.; Liu, S.H. Gaussian noise filtering from ECG by Wiener filter and ensemble empirical mode decomposition. J. Signal Process. Syst. 2011, 64, 249–264. [Google Scholar] [CrossRef]
- Luu, L.; Dinh, A. Artifact Noise Removal Techniques on Seismocardiogram Using Two Tri-Axial Accelerometers. Sensors 2018, 18, 1067. [Google Scholar] [CrossRef] [PubMed] [Green Version]
- Khosrow-Khavar, F.; Tavakolian, K.; Blaber, A.P.; Zanetti, J.M.; Fazel-Rezai, R.; Menon, C. Automatic annotation of seismocardiogram with high-frequency precordial accelerations. IEEE J. Biomed. Health Inform. 2014, 19, 1428–1434. [Google Scholar] [CrossRef] [PubMed]
- Shafiq, G.; Tatinati, S.; Veluvolu, K.C. Automatic annotation of peaks in seismocardiogram for systolic time intervals. In Proceedings of the 2016 38th Annual International Conference of the IEEE Engineering in Medicine and Biology Society (EMBC), Orlando, FL, USA, 16–20 August 2016; pp. 2672–2675. [Google Scholar]
- Choudhary, T.; Sharma, L.; Bhuyan, M.K. Automatic Detection of Aortic Valve Opening using Seismocardiography in Healthy Individuals. IEEE J. Biomed. Health Inform. 2018, 23, 1032–1040. [Google Scholar] [CrossRef] [PubMed]
- Sharma, L.; Dandapat, S.; Mahanta, A. ECG signal denoising using higher order statistics in Wavelet subbands. Biomed. Signal Process. Control 2010, 5, 214–222. [Google Scholar] [CrossRef]
- Pouymiro, I.R.; Cordova, E.V.; Perez, F.E.V. Robust detection of AO and IM points in the seismocardiogram using CWT. IEEE Lat. Am. Trans. 2016, 14, 4468–4473. [Google Scholar]
- Khosrow-Khavar, F.; Tavakolian, K.; Blaber, A.; Menon, C. Automatic and robust delineation of the fiducial points of the seismocardiogram signal for noninvasive estimation of cardiac time intervals. IEEE Trans. Biomed. Eng. 2016, 64, 1701–1710. [Google Scholar] [CrossRef]
- Thakkar, H.K.; Sahoo, P.K. Towards Automatic and Fast Annotation of Seismocardiogram Signals Using Machine Learning. IEEE Sens. J. 2020, 20, 2578–2589. [Google Scholar] [CrossRef]
- Lin, W.Y.; Chou, W.C.; Chang, P.C.; Chou, C.C.; Wen, M.S.; Ho, M.Y.; Lee, W.C.; Hsieh, M.J.; Lin, C.C.; Tsai, T.H.; et al. Identification of location specific feature points in a cardiac cycle using a novel seismocardiogram spectrum system. IEEE J. Biomed. Health Inform. 2016, 22, 442–449. [Google Scholar] [CrossRef]
- Sorensen, K.; Schmidt, S.E.; Jensen, A.S.; Sogaard, P.; Struijk, J.J. Definition of Fiducial Points in the Normal Seismocardiogram. Sci. Rep. 2018, 8, 15455. [Google Scholar] [CrossRef] [Green Version]
- Fadil, R.; Aarotale, P.; Hoffmann, B.; Khosrow-Khavar, F.; Xiao, Z.G.; Akhbardeh, A.; Tavakolian, K. Temporal Changes of Fiducial Seismocardiogram Points Due to Different Sensor Placements on the Chest. In Proceedings of the 2020 Computing in Cardiology, Rimini, Italy, 13–16 September 2020; pp. 1–4. [Google Scholar] [CrossRef]
- Jähne-Raden, N.; Gütschleg, H.; Wolf, M.C.; Sigg, S.; Kulau, U. Seismocardiography on Infants and Kids. In Proceedings of the 2020 Computing in Cardiology, Rimini, Italy, 13–16 September 2020; pp. 1–4. [Google Scholar] [CrossRef]
- Chen, C.H.; Lin, W.Y.; Lee, M.Y. The Applications of K-means Clustering and Dynamic Time Warping Average in Seismocardiography Template Generation. In Proceedings of the 2020 IEEE International Conference on Systems, Man, and Cybernetics (SMC), Toronto, ON, Canada, 11–14 October 2020; pp. 1000–1007. [Google Scholar] [CrossRef]
- Sørensen, K.; Poulsen, M.K.; Karbing, D.S.; Søgaard, P.; Struijk, J.J.; Schmidt, S.E. A Clinical Method for Estimation of VO2max Using Seismocardiography. Int. J. Sport. Med. 2020, 41, 661–668. [Google Scholar] [CrossRef]
- Yu, S.; Liu, S. A novel adaptive recursive least squares filter to remove the motion artifact in seismocardiography. Sensors 2020, 20, 1596. [Google Scholar] [CrossRef] [Green Version]
- Morra, S.; Gauthey, A.; Hossein, A.; Rabineau, J.; Racape, J.; Gorlier, D.; Migeotte, P.F.; Le Polain De Waroux, J.B.; Van De Borne, P. Influence of sympathetic activation on myocardial contractility measured with ballistocardiography and seismocardiography during sustained end-expiratory apnea. Am. J. Physiol.-Regul. Integr. Comp. Physiol. 2020, 319, R497–R506. [Google Scholar] [CrossRef]
- Shandhi, M.M.H.; Fan, J.; Heller, J.A.; Etemadi, M.; Inan, O.; Klein, L. Non-invasive seismocardiography can accurately track changes in pulmonary artery pressures during vasodilator challenge at the time of right heart catheterization. J. Am. Coll. Cardiol. 2020, 75, 2075. [Google Scholar] [CrossRef]
- Zia, J.; Kimball, J.; Hersek, S.; Shandhi, M.M.H.; Semiz, B.; Inan, O.T. A Unified Framework for Quality Indexing and Classification of Seismocardiogram Signals. IEEE J. Biomed. Health Inform. 2020, 24, 1080–1092. [Google Scholar] [CrossRef] [PubMed]
- Hersek, S.; Semiz, B.; Shandhi, M.M.H.; Orlandic, L.; Inan, O.T. A Globalized Model for Mapping Wearable Seismocardiogram Signals to Whole-Body Ballistocardiogram Signals Based on Deep Learning. IEEE J. Biomed. Health Inform. 2020, 24, 1296–1309. [Google Scholar] [CrossRef]
- Cocconcelli, F.; Mora, N.; Matrella, G.; Ciampolini, P. High-Accuracy, Unsupervised Annotation of Seismocardiogram Traces for Heart Rate Monitoring. IEEE Trans. Instrum. Meas. 2020, 69, 6372–6380. [Google Scholar] [CrossRef]
- Ha, U.; Assana, S.; Adib, F. Contactless Seismocardiography via Deep Learning Radars. In Proceedings of the 26th Annual International Conference on Mobile Computing and Networking. Association for Computing Machinery, MobiCom’20, London, UK, 21–25 September 2020. [Google Scholar] [CrossRef]
- Newman, N.; Gilman, S.; Burdumy, M.; Yimen, M.; Lattouf, O. A Novel Tool for Patient Data Management in the ICU—Ensuring Timely and Accurate Vital Data Exchange Among ICU Team Members. Int. J. Med. Inform. 2020, 144, 104291. [Google Scholar] [CrossRef] [PubMed]
- Xia, Z.; Shandhi, M.M.H.; Li, Y.; Inan, O.; Zhang, Y. The delineation of fiducial points for non-contact radar seismocardiogram signals without concurrent ecg. IEEE J. Biomed. Health Inform. 2020, 25, 1031–1040. [Google Scholar] [CrossRef] [PubMed]
- Choudhary, T.; Bhuyan, M.K.; Sharma, L.N. Delineation and Analysis of Seismocardiographic Systole and Diastole Profiles. IEEE Trans. Instrum. Meas. 2021, 70, 1–8. [Google Scholar] [CrossRef]
- Lin, D.J.; Kimball, J.; Zia, J.S.; Ganti, V.G.; Inan, O. Reducing the Impact of External Vibrations on Fiducial Point Detection in Seismocardiogram Signals. IEEE Trans. Biomed. Eng. 2021. [Google Scholar] [CrossRef]
- Choudhary, T.; Das, M.; Sharma, L.; Bhuyan, M. Analyzing seismocardiographic approach for heart rate variability measurement. Biomed. Signal Process. Control 2021, 68, 102793. [Google Scholar] [CrossRef]
- Hossein, A.; Rabineau, J.; Gorlier, D.; Del Rio, J.I.J.; van de Borne, P.; Migeotte, P.F.; Nonclercq, A. Kinocardiography Derived from Ballistocardiography and Seismocardiography Shows High Repeatability in Healthy Subjects. Sensors 2021, 21, 815. [Google Scholar] [CrossRef] [PubMed]
- Morra, S.; Pitisci, L.; Su, F.; Hossein, A.; Rabineau, J.; Racape, J.; Gorlier, D.; Herpain, A.; Migeotte, P.F.; Creteur, J.; et al. Quantification of Cardiac Kinetic Energy and Its Changes During Transmural Myocardial Infarction Assessed by Multi-Dimensional Seismocardiography. Front. Cardiovasc. Med. 2021, 8, 120. [Google Scholar] [CrossRef]
- Morra, S.; Hossein, A.; Rabineau, J.; Gorlier, D.; Racape, J.; Migeotte, P.F.; Van De Borne, P. Assessment of left ventricular twist by 3D ballistocardiography and seismocardiography compared with 2D STI echocardiography in a context of enhanced inotropism in healthy subjects. Sci. Rep. 2021, 11, 683. [Google Scholar] [CrossRef] [PubMed]
- Eyvazi Hesar, M.; Khan, D.; Seyedsadrkhani, N.S.; Ingebrandt, S. Contactless, Battery-free, and Stretchable Wearable for Continuous Recording of Seismocardiograms. ACS Appl. Electron. Mater. 2021, 3, 11–20. [Google Scholar] [CrossRef]
- Maiorana, E.; Massaroni, C. Biometric Recognition based on Heart-Induced Chest Vibrations. In Proceedings of the 2021 IEEE International Workshop on Biometrics and Forensics (IWBF), Rome, Italy, 6–7 May 2021; pp. 1–6. [Google Scholar] [CrossRef]
- Inan, O.T.; Baran Pouyan, M.; Javaid, A.Q.; Dowling, S.; Etemadi, M.; Dorier, A.; Heller, J.A.; Bicen, A.O.; Roy, S.; De Marco, T.; et al. Novel wearable seismocardiography and machine learning algorithms can assess clinical status of heart failure patients. Circ. Heart Fail. 2018, 11, e004313. [Google Scholar] [CrossRef] [PubMed]
- Shandhi, M.M.H.; Fan, J.; Heller, J.A.; Etemadi, M.; Inan, O.T.; Klein, L. Seismocardiography and machine learning algorithms to assess clinical status of patients with heart failure in cardiopulmonary exercise testing. J. Card. Fail. 2019, 25, S64–S65. [Google Scholar] [CrossRef]
- Malcangi, M.; Quan, H.; Vaini, E.; Lombardi, P.; Di Rienzo, M. Evolving fuzzy-neural paradigm applied to the recognition and removal of artefactual beats in continuous seismocardiogram recordings. Evol. Syst. 2020, 11, 443–452. [Google Scholar] [CrossRef]
- Mora, N.; Cocconcelli, F.; Matrella, G.; Ciampolini, P. Fully Automated Annotation of Seismocardiogram for Noninvasive Vital Sign Measurements. IEEE Trans. Instrum. Meas. 2020, 69, 1241–1250. [Google Scholar] [CrossRef]
- D’Mello, Y.; Skoric, J.; Xu, S.; Roche, P.J.; Lortie, M.; Gagnon, S.; Plant, D.V. Real-Time Cardiac Beat Detection and Heart Rate Monitoring from Combined Seismocardiography and Gyrocardiography. Sensors 2019, 19, 3472. [Google Scholar] [CrossRef] [Green Version]
- Rai, D.; Thakkar, H.K.; Rajput, S.S. Performance Characterization of Binary Classifiers for Automatic Annotation of Aortic Valve Opening in Seismocardiogram Signals. In Proceedings of the 2020 9th International Conference on Bioinformatics and Biomedical Science, ICBBS ’20, Xiamen, China, 16–18 October 2020; pp. 77–82. [Google Scholar] [CrossRef]
- Rai, D.; Thakkar, H.K.; Singh, D.; Bathala, H.V. Machine Learning Assisted Automatic Annotation of Isovolumic Movement and Aortic Valve Closure using Seismocardiogram Signals. In Proceedings of the 2020 IEEE 17th India Council International Conference (INDICON), New Delhi, India, 10–13 December 2020; pp. 1–6. [Google Scholar] [CrossRef]
- Zheng, Y.L.; Ding, X.R.; Poon, C.C.Y.; Lo, B.P.L.; Zhang, H.; Zhou, X.L.; Yang, G.Z.; Zhao, N.; Zhang, Y.T. Unobtrusive sensing and wearable devices for health informatics. IEEE Trans. Biomed. Eng. 2014, 61, 1538–1554. [Google Scholar] [CrossRef]
- Weissler, A.M.; Harris, W.S.; Schoenfeld, C.D. Systolic time intervals in heart failure in man. Circulation 1968, 37, 149–159. [Google Scholar] [CrossRef] [PubMed] [Green Version]
- Paiva, R.; Carvalho, P.; Couceiro, R.; Henriques, J.; Antunes, M.; Quintal, I.; Muehlsteff, J. Beat-to-beat systolic time-interval measurement from heart sounds and ECG. Physiol. Meas. 2012, 33, 177. [Google Scholar] [CrossRef] [PubMed]
- Javaid, A.Q.; Fesmire, N.F.; Weitnauer, M.A.; Inan, O.T. Towards robust estimation of systolic time intervals using head-to-foot and dorso-ventral components of sternal acceleration signals. In Proceedings of the 2015 IEEE 12th international conference on wearable and implantable body sensor networks (BSN), Cambridge, MA, USA, 9–12 June 2015; pp. 1–5. [Google Scholar]
- Kh Dehkordi, P.; Khosrow-Khavar, F.; Di Rienzo, M.; Inan, O.T.; Schmidt, S.E.; Blaber, A.; Sørensen, K.; Struijk, J.J.; Zakeri, V.; Lombardi, P.; et al. Comparison of Different Methods for Estimating Cardiac Timings: A Comprehensive Multimodal Echocardiography Investigation. Front. Physiol. 2019, 10, 1057. [Google Scholar] [CrossRef] [PubMed]
- Korzeniowska-Kubacka, I.; Kuśmierczyk-Droszcz, B.; Bilińska, M.; Dobraszkiewicz-Wasilewska, B.; Mazurek, K.; Piotrowicz, R. Seismocardiography-a non-invasive method of assessing systolic and diastolic left ventricular function in ischaemic heart disease. Cardiol. J. 2006, 13, 319–325. [Google Scholar]
- Tavakolian, K.; Khosrow-Khavar, F.; Kajbafzadeh, B.; Marzencki, M.; Rohani, S.; Kaminska, B.; Menon, C. Seismocardiographic adjustment of diastolic timed vibrations. In Proceedings of the 2012 Annual International Conference of the IEEE Engineering in Medicine and Biology Society, San Diego, CA, USA, 28 August–1 September 2012; pp. 3797–3800. [Google Scholar]
- Ashouri, H.; Hersek, S.; Inan, O.T. Universal pre ejection period estimation using seismocardiography: Quantifying the effects of sensor placement and regression algorithms. IEEE Sens. J. 2017, 18, 1665–1674. [Google Scholar] [CrossRef]
- Shandhi, M.M.H.; Semiz, B.; Hersek, S.; Goller, N.; Ayazi, F.; Inan, O. Performance Analysis of Gyroscope and Accelerometer Sensors for Seismocardiography-Based Wearable Pre-Ejection Period Estimation. IEEE J. Biomed. Health Inform. 2019, 23, 2365–2374. [Google Scholar] [CrossRef] [PubMed]
- Tadi, M.J.; Koivisto, T.; Pänkäälä, M.; Paasio, A.; Knuutila, T.; Teräs, M.; Hänninen, P. A new algorithm for segmentation of cardiac quiescent phases and cardiac time intervals using seismocardiography, Proceedings of the Sixth International Conference on Graphic and Image Processing (ICGIP 2014); International Society for Optics and Photonics: Bellingham, WA, USA, 2015; Volume 9443. [Google Scholar]
- Rivas-Gotz, C.; Khoury, D.S.; Manolios, M.; Rao, L.; Kopelen, H.A.; Nagueh, S.F. Time interval between onset of mitral inflow and onset of early diastolic velocity by tissue Doppler: A novel index of left ventricular relaxation: experimental studies and clinical application. J. Am. Coll. Cardiol. 2003, 42, 1463–1470. [Google Scholar] [CrossRef] [Green Version]
- Garrod, A.H. On some points connected with the circulation of the blood, arrived at from a study of the sphygmograph-trace. Proc. R. Soc. Lond. 1875, 23, 140–151. [Google Scholar]
- Chapman, P.M. Abstract of the Goulstonian Lectures on the Physics of the Circulation: Delivered before the Royal College of Physicians. Br. Med. J. 1894, 1, 511. [Google Scholar] [CrossRef] [Green Version]
- Bowen, W.P. Changes in heart-rate, blood-pressure, and duration of systole resulting from bicycling. Am. J. Physiol.-Leg. Content 1904, 11, 59–77. [Google Scholar] [CrossRef]
- Bruser, C.; Diesel, J.; Zink, M.D.; Winter, S.; Schauerte, P.; Leonhardt, S. Automatic detection of atrial fibrillation in cardiac vibration signals. IEEE J. Biomed. Health Inform. 2012, 17, 162–171. [Google Scholar] [CrossRef]
- Hurnanen, T.; Lehtonen, E.; Tadi, M.J.; Kuusela, T.; Kiviniemi, T.; Saraste, A.; Vasankari, T.; Airaksinen, J.; Koivisto, T.; Pänkäälä, M. Automated detection of atrial fibrillation based on time–frequency analysis of seismocardiograms. IEEE J. Biomed. Health Inform. 2016, 21, 1233–1241. [Google Scholar] [CrossRef]
- Lahdenoja, O.; Hurnanen, T.; Iftikhar, Z.; Nieminen, S.; Knuutila, T.; Saraste, A.; Kiviniemi, T.; Vasankari, T.; Airaksinen, J.; Pänkäälä, M.; et al. Atrial fibrillation detection via accelerometer and gyroscope of a smartphone. IEEE J. Biomed. Health Inform. 2017, 22, 108–118. [Google Scholar] [CrossRef] [PubMed]
- Tadi, M.J.; Mehrang, S.; Kaisti, M.; Lahdenoja, O.; Hurnanen, T.; Jaakkola, J.; Jaakkola, S.; Vasankari, T.; Kiviniemi, T.; Airaksinen, J.; et al. Comprehensive analysis of cardiogenic vibrations for automated detection of atrial fibrillation using smartphone mechanocardiograms. IEEE Sens. J. 2018, 19, 2230–2242. [Google Scholar] [CrossRef]
- Elliott, J.; Belen, M.K.; Mainardi, L.; Rodriguez Matas, J.F. A Comparison of Regional Classification Strategies Implemented for the Population Based Approach to Modelling Atrial Fibrillation. Mathematics 2021, 9, 1686. [Google Scholar] [CrossRef]
- Cervigón, R.; Moreno, J.; Millet, J.; Pérez-Villacastín, J.; Castells, F. Pulmonary Vein Activity Organization to Determine Atrial Fibrillation Recurrence: Preliminary Data from a Pilot Study. Mathematics 2020, 8, 1813. [Google Scholar] [CrossRef]
- Yao, J.; Tridandapani, S.; Wick, C.A.; Bhatti, P.T. Seismocardiography-based cardiac computed tomography gating using patient-specific template identification and detection. IEEE J. Transl. Eng. Health Med. 2017, 5, 1–14. [Google Scholar] [CrossRef]
- Yao, J.; Tridandapani, S.; Auffermann, W.; Wick, C.; Bhatti, P. An adaptive seismocardiography (SCG)-ECG multimodal framework for cardiac gating using artificial neural networks. IEEE J. Transl. Eng. Health Med. 2018, 6, 1–11. [Google Scholar] [CrossRef]
- Wick, C.A.; Su, J.J.; McClellan, J.H.; Brand, O.; Bhatti, P.T.; Buice, A.L.; Stillman, A.E.; Tang, X.; Tridandapani, S. A system for seismocardiography-based identification of quiescent heart phases: Implications for cardiac imaging. IEEE Trans. Inf. Technol. Biomed. 2012, 16, 869–877. [Google Scholar] [CrossRef]
- Wick, C.A.; Inan, O.T.; McClellan, J.H.; Tridandapani, S. Seismocardiography-based detection of cardiac quiescence. IEEE Trans. Biomed. Eng. 2015, 62, 2025–2032. [Google Scholar] [CrossRef] [PubMed]
- Tadi, M.J.; Lehtonen, E.; Hurnanen, T.; Koskinen, J.; Eriksson, J.; Pänkäälä, M.; Teräs, M.; Koivisto, T. A real-time approach for heart rate monitoring using a Hilbert transform in seismocardiograms. Physiol. Meas. 2016, 37, 1885. [Google Scholar] [CrossRef]
- Wahlstrom, J.; Skog, I.; Handel, P.; Khosrow-Khavar, F.; Tavakolian, K.; Stein, P.K.; Nehorai, A. A hidden markov model for seismocardiography. IEEE Trans. Biomed. Eng. 2017, 64, 2361–2372. [Google Scholar] [CrossRef]
- Taebi, A.; Bomar, A.J.; Sandler, R.H.; Mansy, H.A. Heart Rate Monitoring During Different Lung Volume Phases Using Seismocardiography. In Proceedings of the SoutheastCon 2018, St. Petersburg, FL, USA, 19–22 April 2018; pp. 1–5. [Google Scholar]
- Lee, H.; Lee, H.; Whang, M. An enhanced method to estimate heart rate from seismocardiography via ensemble averaging of body movements at six degrees of freedom. Sensors 2018, 18, 238. [Google Scholar] [CrossRef] [PubMed] [Green Version]
- Siecinski, S.; Tkacz, E.J.; Kostka, P.S. Comparison of HRV indices obtained from ECG and SCG signals from CEBS database. Biomed. Eng. Online 2019, 18, 69. [Google Scholar] [CrossRef] [PubMed] [Green Version]
- Charlier, P.; Cabon, M.; Herman, C.; Benouna, F.; Logier, R.; Houfflin-Debarge, V.; Jeanne, M.; De Jonckheere, J. Comparison of multiple cardiac signal acquisition technologies for heart rate variability analysis. J. Clin. Monit. Comput. 2019, 34, 743–752. [Google Scholar] [CrossRef]
- Mora, N.; Cocconcelli, F.; Matrella, G.; Ciampolini, P. Detection and Analysis of Heartbeats in Seismocardiogram Signals. Sensors 2020, 20, 1670. [Google Scholar] [CrossRef] [PubMed] [Green Version]
- Lin, Y.D.; Jhou, Y.F. Estimation of heart rate and respiratory rate from the seismocardiogram under resting state. Biomed. Signal Process. Control 2020, 57, 101779. [Google Scholar] [CrossRef]
- Sieciński, S.; Kostka, P.S.; Tkacz, E.J. Heart Rate Variability Analysis on Electrocardiograms, Seismocardiograms and Gyrocardiograms on Healthy Volunteers. Sensors 2020, 20, 4522. [Google Scholar] [CrossRef]
- Korzeniowska-Kubacka, I.; Bilińska, M.; Piotrowicz, R. Usefulness of seismocardiography for the diagnosis of ischemia in patients with coronary artery disease. Ann. Noninvasive Electrocardiol. 2005, 10, 281–287. [Google Scholar] [CrossRef]
- Becker, M.; Roehl, A.; Siekmann, U.; Koch, A.; de la Fuente, M.; Roissant, R.; Radermacher, K.; Marx, N.; Hein, M. Simplified detection of myocardial ischemia by seismocardiography. Herz 2014, 39, 586–592. [Google Scholar] [CrossRef]
- Zanetti, J.M.; Salerno, D.M. Seismocardiography: A technique for recording precordial acceleration. In Proceedings of the Computer-Based Medical Systems Proceedings of the Fourth Annual IEEE Symposium, Baltimore, MD, USA, 12–14 May 1991; pp. 4–9. [Google Scholar]
- Koch, A.; McCormack, P.; Schwanecke, A.; Schnoor, P.; Buslaps, C.; Tetzlaff, K.; Rieckert, H. Noninvasive myocardial contractility monitoring with seismocardiography during simulated dives. Undersea Hyperb. Med. 2003, 30, 19–28. [Google Scholar] [PubMed]
- Tavakolian, K.; Portacio, G.; Tamddondoust, N.R.; Jahns, G.; Ngai, B.; Dumont, G.A.; Blaber, A.P. Myocardial contractility: A seismocardiography approach. In Proceedings of the 2012 Annual International Conference of the IEEE Engineering in Medicine and Biology Society, San Diego, CA, USA, 28 August–1 September 2012; pp. 3801–3804. [Google Scholar]
- Verma, A.K.; Fazel-Rezai, R.; Blaber, A.; Tavakolian, K. Pulse transit time extraction from seismocardiogram and its relationship with pulse pressure. In Proceedings of the 2015 Computing in Cardiology Conference (CinC), Nice, France, 6–9 September 2015; pp. 37–40. [Google Scholar]
- Yang, C.; Tavassolian, N. Pulse transit time measurement using seismocardiogram and in-ear acoustic sensor. In Proceedings of the 2016 IEEE Biomedical Circuits and Systems Conference (BioCAS), Shanghai, China, 17–19 October 2016; pp. 188–191. [Google Scholar]
- Pandia, K.; Inan, O.T.; Kovacs, G.T.; Giovangrandi, L. Extracting respiratory information from seismocardiogram signals acquired on the chest using a miniature accelerometer. Physiol. Meas. 2012, 33, 1643. [Google Scholar] [CrossRef]
- Pandia, K.; Inan, O.T.; Kovacs, G.T. A frequency domain analysis of respiratory variations in the seismocardiogram signal. In Proceedings of the 2013 35th Annual International Conference of the IEEE Engineering in Medicine and Biology Society (EMBC), Osaka, Japan, 3–7 July 2013; pp. 6881–6884. [Google Scholar]
- Zakeri, V.; Akhbardeh, A.; Alamdari, N.; Fazel-Rezai, R.; Paukkunen, M.; Tavakolian, K. Analyzing seismocardiogram cycles to identify the respiratory phases. IEEE Trans. Biomed. Eng. 2016, 64, 1786–1792. [Google Scholar] [CrossRef] [PubMed]
- Yang, C.; Antoine, C.; Young, B.K.; Tavassolian, N. A Pilot Study on Fetal Heart Rate Extraction from Wearable Abdominal Inertial Sensors. IEEE Sens. J. 2019, 19, 10773–10781. [Google Scholar] [CrossRef]
- Smith, V.; Arunthavanathan, S.; Nair, A.; Ansermet, D.; da Silva Costa, F.; Wallace, E.M. A systematic review of cardiac time intervals utilising non-invasive fetal electrocardiogram in normal fetuses. BMC Pregnancy Childbirth 2018, 18, 370. [Google Scholar] [CrossRef] [PubMed]
- Landreani, F.; Faini, A.; Martin-Yebra, A.; Morri, M.; Parati, G.; Caiani, E.G. Assessment of Ultra-Short Heart Variability Indices Derived by Smartphone Accelerometers for Stress Detection. Sensors 2019, 19, 3729. [Google Scholar] [CrossRef] [Green Version]
- Jerosch-Herold, M.; Zanetti, J.; Merkle, H.; Poliac, L.; Huang, H.; Mansoor, A.; Zhao, F.; Wilke, N. The seismocardiogram as magnetic-field-compatible alternative to the electrocardiogram for cardiac stress monitoring. Int. J. Card. Imaging 1999, 15, 523–531. [Google Scholar] [CrossRef]
- Tavakolian, K.; Dumont, G.A.; Houlton, G.; Blaber, A.P. Precordial vibrations provide noninvasive detection of early-stage hemorrhage. Shock 2014, 41, 91–96. [Google Scholar] [CrossRef]
- Johnson, E.M.; Heller, J.A.; Vicente, F.G.; Sarnari, R.; Gordon, D.; McCarthy, P.M.; Barker, A.J.; Etemadi, M.; Markl, M. Detecting Aortic Valve-Induced Abnormal Flow with Seismocardiography and Cardiac MRI. Ann. Biomed. Eng. 2020, 48, 1779–1792. [Google Scholar] [CrossRef]
- Suresh, P.; Narayanan, N.; Pranav, C.V.; Vijayaraghavan, V. End-to-End Deep Learning for Reliable Cardiac Activity Monitoring using Seismocardiograms. arXiv 2020, arXiv:2010.05662. [Google Scholar]
- Shandhi, M.M.H.; Aras, M.; Wynn, S.; Fan, J.; Heller, J.A.; Etemadi, M.; Klein, L.; Inan, O.T. Cardiac Function Monitoring for Patients Undergoing Cancer Treatments Using Wearable Seismocardiography: A Proof-of-Concept Study. In Proceedings of the 2020 42nd Annual International Conference of the IEEE Engineering in Medicine & Biology Society (EMBC), Montreal, QC, Canada, 20–24 July 2020; pp. 4075–4078. [Google Scholar]
- Pravdin, S.; Konovalov, P.; Dierckx, H.; Solovyova, O.; Panfilov, A.V. Drift of Scroll Waves in a Mathematical Model of a Heterogeneous Human Heart Left Ventricle. Mathematics 2020, 8, 776. [Google Scholar] [CrossRef]
- Ramírez, W.A.; Gizzi, A.; Sack, K.L.; Filippi, S.; Guccione, J.M.; Hurtado, D.E. On the Role of Ionic Modeling on the Signature of Cardiac Arrhythmias for Healthy and Diseased Hearts. Mathematics 2020, 8, 2242. [Google Scholar] [CrossRef]
- Yanase, J.; Triantaphyllou, E. The seven key challenges for the future of computer-aided diagnosis in medicine. Int. J. Med. Inform. 2019, 129, 413–422. [Google Scholar] [CrossRef] [PubMed]


| Type | Subject Position | Methodology | Acquisition Device | Sampling Rate | Location of Device | Details of Subjects | Limitation |
|---|---|---|---|---|---|---|---|
| Contact based | Siting | Gyroscope was used in parallel with accelerometer for recording rotational component of the cardiac signal [28]. | 3-axis accelerometer (Kionix KXRB5-2042) and 3-axis gyroscope (Invensense MPU9150) | 256 Hz | Near to 3rd rib on sternum | 5 (3 male + 2 female), all healthy | Proposed method is not feasible for a large number of subjects, including elderly and unhealthy subjects. |
| Supine | High resolution time based accelerometer was used [29]. | MEMS accelerometer | 248 Hz | Near to heart on sternum | 22 (16 male + 6 female), 5 healthy, 17 CVD patient | Proposed method is not validated against any standard benchmark signal. | |
| Supine | Multichannel acquisition of signal was done by placing sensors at 4 different valvular asculation positions [30]. | Accelerometer (ST Microelectronics LIS331DLH | 400 Hz | At tricuspid, mitral, pulmonary, and aortic valve | 50 (25 male + 25 female), 20 healthy, 30 unhealthy | Proposed method is not feasible in real life as it did not work for subjects with psychological factors like nervousness, excitement etc. | |
| Supine | Sensor placed only at tricuspid valve because inter ventricular septum is located beneath it which provide more clear signal [33] | Accelerometer (ST Microelectronics LIS331DLH) | 1000 Hz | At tricuspid valve | 20 (10 male + 10 female), 12 healthy, 8 unhealthy | Only basic features are considered. One lead ECG signal was used. | |
| Walking | Used wearable patch for acquiring from ambulatory subjects [34]. | Accelerometer (Bosch Sensortec BMA280) fitted in a patch | 1000 Hz | On sternum | 17 (11 male + 6 female), All healthy | Proposed technique is not suitable for elderly and CVD-affected subjects. It does also not work in real-life, as for majority of the time, the walking surface for any subject is not smooth and level. | |
| Noncontact-based | Supine | Optical recording of the movements of the chest wall was done by means of laser doppler vibrometry [36]. | Laser vibrometer | N/A | Laser head placed at 1.5 m from the subject chest wall | 10 (5 male + 5 female), All healthy | Proposed technique is very expensive because of laser vibrometer. |
| Siting | Microwave radar based technique used for recording accelerations [38]. | Microwave signal generator, horn antennas and I/Q frequency down converter | N/A | 50 cm from the subject | 8 (all male), All healthy | Proposed setup is not able to cover any specific location on the torso area of the subject. Only the area under radar antenna is covered. | |
| Siting | 3D SCG images with high frequency frame rate obtained using ultrasonic imaging technique [37]. | 3D airborne noncontact ultrasound vibrometer and camera | N/A | In front of subject at 72 cm distance | 8 (all male), All healthy | Proposed method assumes that the sternum moves as a single solid object. |
| Feature Point | Physiological Event | Location Identifier on SCG Signal with Reference to ECG |
|---|---|---|
| AS | Peak of Atrial Systole | 2nd positive peak occurring after ECG P-wave on SCG. |
| PAI | Peak Atrial Inflow | Point on 1st positive slope after AS on SCG. |
| MC | Mitral-valve (MV) Closure | Beginning of the sharp downslope on SCG after onset of ECG QRS complex. |
| IM | Isovolumic Movement | Lowest point of the downslope beginning at MC on SCG. |
| AO | Aortic-valve (AV) Opening | Peak of the upsloping segment starting at IM on SCG. |
| PSI | Peak Systolic Inflow | Point on the 2nd positive slope after AO on SCG. |
| IC | Isotonic Contraction | Lowest point of the downslope beginning at AO on SCG. |
| RE | Peak of Rapid systolic Ejection | Peak of the rounded positive wave after IC on SCG. |
| AC | AV Closure | Sharp down-going slope change on SCG near the end of ECG T-wave. |
| MO | MV Opening | 2nd lowest point on the downslope after AC on SCG. |
| EVF | Early Ventricular Filling | Point on 1st positive slope after MO on SCG. |
| RF | Peak of Rapid diastolic Filling | 2nd rounded peak of the SCG after MO. |
| LCV | Left ventricular lateral wall contraction peak velocity | Identified by matching the MV trace of SCG with tissue doppler echocardiographic images of LV lateral wall. |
| SCV | Septal wall contraction peak velocity | Identified by matching the TV trace of SCG with tissue doppler echocardiographic images of interventricular septal wall. |
| AF | Transaortic valvular peak flow | Identified by matching the AV trace of SCG with pulse-wave doppler echocardiographic images of AV. |
| PF | Transpulmonary peak flow | Identified by matching the pulmonary valve (PV) trace of SCG with pulse-wave doppler echocardiographic images of PV. |
| MF | Transmitral atrial contraction peak flow | Identified by matching the MV trace of SCG with pulse-wave doppler echocardiographic images. |
| MF | Transmitral ventricular relaxation peak flow | Identified by matching the MV trace of SCG with pulse-wave doppler echocardiographic images. |
| Type | Methodology | Reference Signal | Feature Points Identified | Characteristics of Patients | Limitations |
|---|---|---|---|---|---|
| Envelope-based | Four different envelope calculation methods, namely, CSCW, shannon, absolute, and hilbert, were used and compared [48]. | ECG | AC, IM | 67 (35 male + 32 female), All healthy; 18(15 male + 3 female), Increased Heart Rate | The proposed technique only considers the high frequency components of the signal. |
| Moving average sliding template with initial condition for AO (maxima in interval Q + 45 ms and Q + 125 ms ), for AC (maxima in interval AO + 240 ms and AO + 350 ms) [49]. | ECG | AO, AC | Four (all male), All healthy | The proposed technique is not feasible in real-life as it only works for the stationary patients. It did not consider the distortion due to motion artifacts. | |
| Continuous wavelet transform was used with certain decision rules [52]. | N/A | AO, IM | 20 (12 male + 8 female), All healthy | The proposed method only works with elderly patients. | |
| Method based on multiscale kurtosis and central frequency using wavelet was used [50]. | N/A | AO | 20 (12 male + 8 female), All healthy | The proposed method only works for healthy patients. | |
| Both machine learning- and envelope-based | Probabilistic-based machine learning method was used for discarding low-quality signals and finding peaks of envelopes [53]. | With and Without ECG | AO, AC, IM | 65, Healthy young; 15, Healthy old; 48 (32 male + 16 female), Increased Heart Rate; 25 (13 male + 12 female), Unhealthy CVD Patient | The proposed technique did not produce a good result for elderly or unhealthy patients. |
| Machine learning-based | Three different binary classifiers were used namely naive bayes, logistic regression, and support vector machine [54]. | N/A | AS, MC, IM, AO, IC, RE, AC, MO, RF | 20 (12 male + 8 female), All healthy | The proposed method relies on ECG to help annotate the SCG peaks. |
| Visual inspection and | Multichannel SCG and ECG was used [55]. | Echo-cardio images | LCV, SCV, AF, PF, MF(A), MF(E) | 25 (13 male + 12 female), All healthy | The proposed method only considers the signal acquired from single point on the chest. |
| Comparison based | Pearson linear correlation coefficient was used for finding the relation [56]. | Ultrasound images | AS, PAI, MC, AO, PSI, AC, MO, EVF | 42 (20 male + 22 female), All healthy | The proposed method uses very low temporal resolution images. Only 2–4 consecutive cardiac beats were considered at a time. |
| Experiment | #Sub | #CC and #DP | FP | Mean_Prec | Mean_Sens |
|---|---|---|---|---|---|
| Experiment 1 [30] | 5 | CC: 100, DP: 35609 | AS, MC, IM, AO, IC, RE, AC, MO, RF | 63.8 | 82.8 |
| Experiment 2 [33] | 5 | CC: 3243, DP: 30102 | AS, MC, IM, AO, IC, RE, AC, MO, RF | 87.6 | 93.4 |
| Experiment 3 [50] | 20 | CC: 20, DP: 4585 | AO | 90.1 | 93.8 |
| Experiment 4 [81] | 15 | CC: 3375, DP: – | MC, IM, AO, AC, MO | 88.7 | 98.8 |
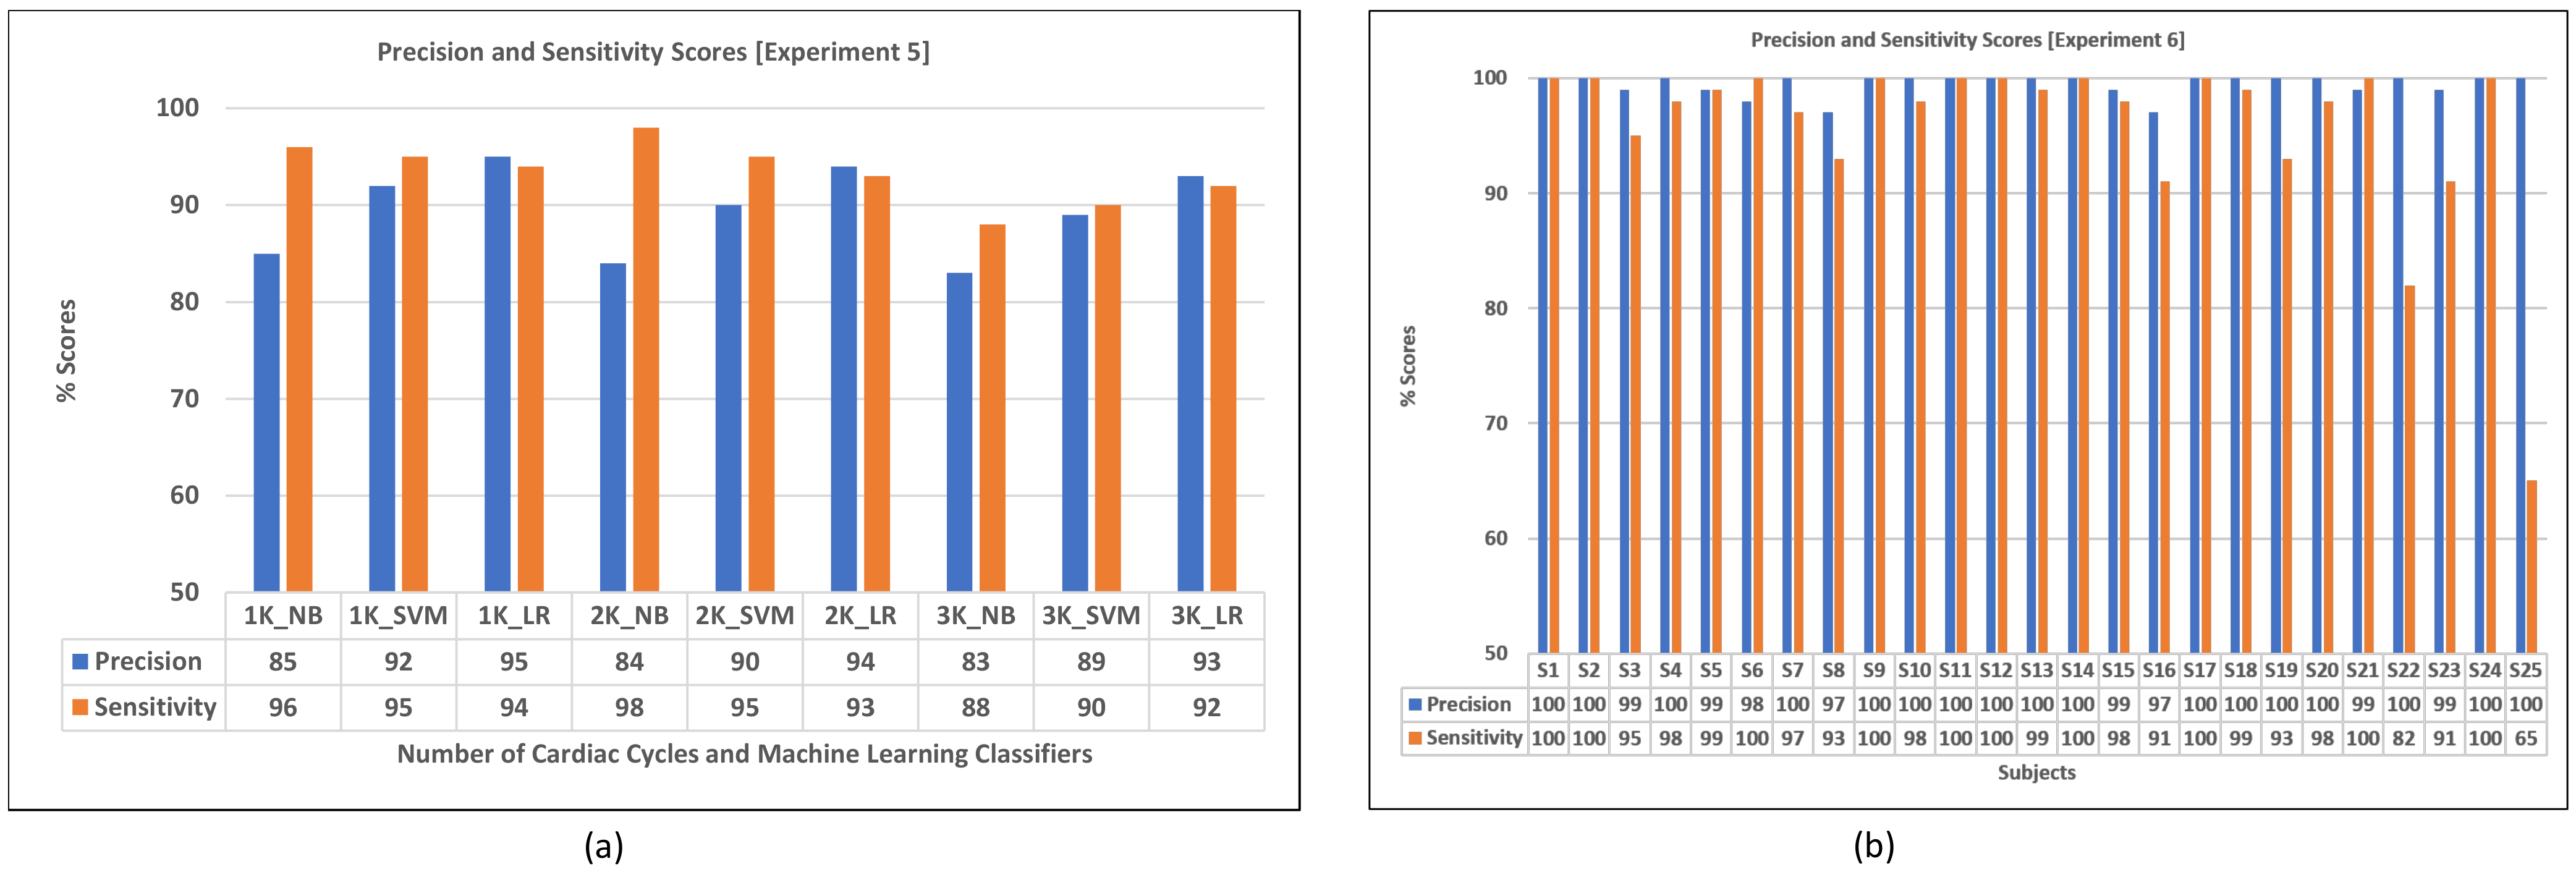
| Experiment 5 [54] | 20 | CC: 9000, DP: – | AS, MC, IM, AO, IC, RE, AC, MO, RF | 89.4 | 93.4 |
| Experiment 6 [82] | 25 | CC: 50, DP: 23984 | AO | 99.4 | 95.8 |
| Experiment 7 [70] | 8 | CC: 16, DP: 6854 | IM, AO, IC, AC, MO | 96.0 | 94.9 |
| Experiment 8 [83] | 6 | CC: 1800, DP: 3985 | AO | 93.5 | 92.0 |
| Experiment 9 [84] | 3 | CC: 948, DP: 5678 | IM, AC | 74.4 | 67.8 |
| Cardiac Phase | Parameter Extracted | Physiological Event | Interval/Ratio | Methodologies Used for Extraction |
|---|---|---|---|---|
| Systolic | SS | First and second heart sound | MC − AC | (i) Comparison and combined analysis of different cardiac parameters and signals such as ECG, PCG, ICG, etc. [86,87,88,89,90,91]. (ii) Regression model [92,93,94]. (iii) Tissue doppler imaging method [95]. |
| QS | Total systole interval | Q − AC | ||
| Q−I | Interval from onset of QRS to S | Q − MC | ||
| PEP | Pre-ejection period | Q − AO | ||
| LVET | Left ventricular ejection time | AO − AC | ||
| IVCT | Isovolumetric contraction time | MC − AO | ||
| PEP/LVET | Contractility coefficient | (Q − AO)/(AO − AC) | ||
| Diastolic | LVFT | Left-ventricular filling time | MO − MC | |
| RVFT | Rapid ventricular filling time | MO − RF | ||
| IVRT | Isovolumetric relaxation time | AC − MO | ||
| Global | MPI | Myocardial performance index | (IVCT + IVRT)/LVET |
Publisher’s Note: MDPI stays neutral with regard to jurisdictional claims in published maps and institutional affiliations. |
© 2021 by the authors. Licensee MDPI, Basel, Switzerland. This article is an open access article distributed under the terms and conditions of the Creative Commons Attribution (CC BY) license (https://creativecommons.org/licenses/by/4.0/).
Share and Cite
Rai, D.; Thakkar, H.K.; Rajput, S.S.; Santamaria, J.; Bhatt, C.; Roca, F. A Comprehensive Review on Seismocardiogram: Current Advancements on Acquisition, Annotation, and Applications. Mathematics 2021, 9, 2243. https://doi.org/10.3390/math9182243
Rai D, Thakkar HK, Rajput SS, Santamaria J, Bhatt C, Roca F. A Comprehensive Review on Seismocardiogram: Current Advancements on Acquisition, Annotation, and Applications. Mathematics. 2021; 9(18):2243. https://doi.org/10.3390/math9182243
Chicago/Turabian StyleRai, Deepak, Hiren Kumar Thakkar, Shyam Singh Rajput, Jose Santamaria, Chintan Bhatt, and Francisco Roca. 2021. "A Comprehensive Review on Seismocardiogram: Current Advancements on Acquisition, Annotation, and Applications" Mathematics 9, no. 18: 2243. https://doi.org/10.3390/math9182243