Article

Greening the Financial System in USA, Canada and Brazil: A Panel Data Analysis

1
Faculty of Economics and Business Administration, Babes-Bolyai University, 58-60 Teodor Mihali Street, 400591 Cluj-Napoca, Romania
2
Faculty of Business, Babes-Bolyai University, 7 Horea Street, 400174 Cluj-Napoca, Romania
3
National Institute for Research-Development in Construction, Urbanism and Sustainable Territorial Development “URBAN INCERC”, 117 Calea Floresti, 400524 Cluj-Napoca, Romania
*
Author to whom correspondence should be addressed.
Mathematics 2020, 8(12), 2217; https://doi.org/10.3390/math8122217
Submission received: 29 October 2020 / Revised: 8 December 2020 / Accepted: 10 December 2020 / Published: 14 December 2020
(This article belongs to the Special Issue Computational Statistical Methods and Extreme Value Theory)

Abstract

:
Each country designs its own scheme to achieve green financing and, in general, credit is considered to be a fundamental source of greening financial systems. The novelty of this study resides in that we examined green financing initiatives in USA, Canada and Brazil by focusing on major components of the financial systems before, during and after the 2008 world financial crisis. By means of panel data analysis conducted on observations ranging across the period 1970–2018, we investigated variables such as domestic credit from banks, domestic credit from the financial sector, GDP, N2O emissions, CO2 emissions and the value added from agriculture, forest and fishing activities. According to our findings, domestic credit from banks was insufficient to achieve green financing. Namely, in order to increase economic growth while reducing global warming and climate change, the financial sector should assume a bigger role in funding green investments. Moreover, our results showed that domestic credit from the financial sector contributed to green financing, while CO2 emissions remained a challenge in capping global warming at the 1.5 °C level. Our empirical study supports the idea that economic growth together with policies targeting climate change and global warming can contribute to green financing. Over and above that, governments should strive to design sustainable fiscal and monetary policies that promote green financing.

1. Introduction

The phenomena of climate change and global warming challenge economies around the world to implement major shifts in the way they achieve economic performance. Therefore, sustainable development seems to be a relevant tool to be used for this purpose. Nevertheless, achieving sustainable development has also become demanding in economies nowadays because of inherent contradictions between development and environment. For starters, there is no economic development without environmental degradation. On the one hand, agricultural production improves food security and reduces hunger. On the other hand, intense agriculture production results in more greenhouse gas effect, which in turn increases global warming. According to one of the 17 Sustainable Development Goals adopted by the United Nations organization, ending world hunger should be achieved by 2030. Yet, the world population fighting hunger reached 821 million by 2017, with one in nine people struggling for basic nutrition [1]. Moreover, climate change has been severely affecting agricultural production during recent years.
The United Nations Environment Programme (UNEP) has been supporting the idea of creating a sustainable financial system since 2014 with a purpose of mobilizing capital for sustainable development and achieving a green and inclusive economy [2]. One strategy that has been singled out is green finance. The level of national financial development shapes and boosts green finance through different capital sources and financial institutions. According to the UNEP, three areas of major importance for green finance would be: preventing illicit practices; expanding opportunities of green investments; and discovering solutions and trade-offs.
At the global level, developing economies face serious challenges in mobilizing capital related to green investments. For this category of countries, one source of external capital flow is represented by foreign direct investments (FDI), which generally target projects related to energy, waste, water and agricultural development, and should (ideally) be focused on the long term. In addition to FDI, other sources of external capital flow are concessional loans from international financial institutions, long-term commercial debts, aid and remittances. Another area of challenge for developing countries, which usually have an underdeveloped financial system, is the provision of green investments for infrastructure projects and the provision of credit and insurance with which large- and small-scale economic entities manage risks.
The aim of issuing green bonds is to raise financial resources for climate change initiatives. These fixed-income instruments generally favor climate-friendly activities. The performance of green bonds issued in US dollars and euros has been superior to the one of non-green bonds [3]. In 2019, the green finance market grew considerably in the Latin America and Caribbean region. For that matter, Brazil has the biggest green bond market in the region worth $5.13 billion [4]. Multilateral development banks initiated the issuance of green bonds in the period 2007–2008 with the aim of investing in climate-related projects. Moreover, non-financial corporations play a key role in green finance. Brazil has registered 19 bonds issued by 13 companies amounting to $5.1 billion [4], with a few green bonds targeting agriculture and forestry projects. According to estimates, countries from Latin America and the Caribbean would need funds amounting to $23 trillion by 2030 [5]. In this sense, the Inter-American Development Bank [3] assists the Brazilian government with simplifying the procedures of developing regulations for the issuance of green bonds. There are three public sector entities (i.e., Electrobras, Caixa Econômica Federal and Banco do Basil) that are leading green bond issuers in Brazil, while 67% of green bonds are issued by non-financial corporations.
The covered bond market has a long history of growth and development. From a historical perspective, Prussia issued covered bonds in 1769 and allowed banks to raise funds for housing and land. In 1900, covered bonds were incorporated in the German Mortgage Bank Law and such instruments were issued to finance post-war reconstruction and reunification infrastructure [6]. Covered bonds are collateralized as mortgage loans or public sector loans and the pool value of loans does not exceed 90%. These instruments offer an easy access to capital markets and investors have preferential rights over others in case of bankruptcy.
Based on IMF rankings, Canada was one of the top economies in 2007 and 2016 [7,8]. Among the top 10 climate-aligned bond countries, USA and Canada are ranked as second and fifth. In the USA, Special Purpose Entities (SPE) or Special Purpose Vehicles issue covered bonds. Furthermore, investments in sustainable projects increased from $8.7 trillion in 2016 to $12 trillion in 2018. In Canada, such investments increased from $1.5 trillion in 2016 to $2.1 trillion in 2018 [9].
Nevertheless, a global and comprehensive climate financing strategy is missing even though in 2009 and 2010 the United Nations Framework on Climate Change (UNFCCC) decided to mobilize $100 billion annually by 2020 and established the Green Climate Fund in 2012 [10].
In the context of global warming and climate change, greenhouse gas (GHG) emissions from fossil fuels have been intensively investigated but there are still no reliable data on GHG emissions from agriculture, forestry and other land use [11,12]. GHG emissions result from the burning of crop residues, which consist of methane (CH4) and nitrous oxide (N2O). The largest emitters of GHG come from Asia (50%), America (26%), Africa and Europe (each with 11%) [13].
The importance of our research study stems from the need for investigation of factors such as GDP, domestic credit from banks (DCB) and domestic credit from the financial sector (DCF), three of the most frequent challenges for greening financial systems, especially after the 2008 financial crisis. The novelty of our study consists in that we investigated green financing by focusing on major components of the financial system before, during and after the 2008 crisis. By means of a panel data analysis, along with the abovementioned variables, we also considered the N2O and CO2 emissions and the value added from agriculture, forest and fishing (AFF) activities. The rapidly increasing level of N2O emissions is among the most important triggers of climate change. For that matter, nitrous oxide is considered to be the third long-lived greenhouse gas released in the atmosphere. Nitrous oxide has increased by 10% at the global level in the periods 2000–2005 and 2010–2015, exceeding the estimates of the Intergovernmental Panel on Climate Change.
The main goal of our research investigation, which revolves around the greening of financial systems, is to analyze the relationships between GDP, domestic credits from banks and from the financial sector, CO2 emissions, N2O emissions and the value added from agriculture, forest and fishing, based on data provided by the World Bank. For this purpose, we focused on a country sample including the United States, Canada and Brazil during the period 1970–2018. We used econometric modelling to investigate the significance of the relationships between our variables of interest.
The article is structured as follows. Section 2 surveys the relevant literature on the topic of greening the financial system. Section 3 introduces the estimated econometric models and the results of our study. Section 4 delves into the discussion of the empirical results. Section 5 highlights the main outcomes and addresses policy implications of future studies.

2. Literature Review

The majority of developing countries face the challenge of burning crop residues in agricultural fields. As a case in point, every year during the months of September and October, in the Indian states of Punjab and Haryana crop residues are burned before a second crop based on a rotation system, taking into account the overall cultivation cycle. Hence, the residues become soil fertilizers. Nevertheless, it is challenging to establish a balance between environmental improvements and lucrative economic opportunities [14].
Methane (CH4) and nitrous oxide (N2O) are non-CO2 gases released through bacterial decomposition processes across cropland and grassland soils because of fermentation, management of natural and synthetic fertilizers, rice cultivation, residues burning or decay, organic cultivation technologies, etc. Authors such as Tubiello et al. [15] have analyzed global and regional greenhouse gas data retrieved from the US Food and Agriculture Organization for the period 1961–2010 and found that the ratio between agriculture emissions and fossil fuel emissions has decreased from 17.2% to 13.7%. Moreover, they also have observed the following two aspects: the proportion of net deforestation into the overall amount of fossil fuel emissions has decreased from 19.15% to 10.1%, and, in the period 2000–2010, agricultural emissions produced by developing countries have exceeded those of developed countries.
The literature reports a multitude of studies concluding that the phenomena of global warming and climate change have been amplified by greenhouse gas emissions [16,17]. Nevertheless, according to Alshubiri and Elhehhad [18], economic growth produces more CO2 emissions during the first stages of economic development but subsequently it manages to gradually improve the quality of the environment. This latter result is in accordance with general expectations, since countries with a higher level of development are capable of deploying considerable financial resources to control the effects of such phenomena and implement green technologies.
Within this context, the green finance approach comprises each and every new financial instrument and policy related to green central banks, commercial banks and bonds, fiscal regulations, carbon market mechanisms, community-based green funds, etc. [19] that aim to support sustainable economic activities. Due to its long-term orientation, which benefits society as a whole, green finance is essential for economic development [20] since economic growth and energy consumption are strongly connected [21,22,23,24,25].
In recent years, the topic of green finance has been gaining an increased attention among policy-makers, regional organizations, international bodies, professionals, researchers and the general public [26,27,28]. The rationale for such a growing interest is straightforward. The interplay between extreme weather phenomena triggered by greenhouse gas emissions, the rapidly growing world population, the increased dependency on fossil fuel energy, the interconnectedness of markets and the prospect of jeopardizing the living conditions of future generations calls for a shift towards a sustainable economy. Green finance, through its emphasis on granting investments for green technologies on behalf of financial systems, appears to be a sensible approach. In fact, Falcone [29] stresses that green finance may actually facilitate this transition from a traditional to a more green and sustainable economy. In the same train of thought, Cui et al. [30] advance an evolutionary game model showing that green financial systems foster sustainable development and cleaner manufacturing processes. Moreover, Wang and Zhi [31] address the topic of green finance from the perspective of achieving an ecological balance.
For the purpose of our study, the sample was considered due to the role played by the selected countries on international markets. Hence, the US is a developed country and one of the largest economies according to its GDP. Nevertheless, the US has a major contribution to the rapid increase of the global warming phenomenon. At the same time, Brazil hosts the most extensive forest worldwide (56.5% of its surface) and the sixth largest population in the world. Despite these important geographical and demographic advantages, the massive deforestation trend that has been registered in Brazil during the last years has led to a substantial increase in CO2 emissions. Canada is the second largest country in the world by area and 49.24% of its surface is covered by forests. Out of these three countries, in 2016 the US produced 16% of the world’s CO2, Canada was responsible for about 2%, while Brazil contributed to 1% of the world’s CO2.
Figure 1 shows that, during the selected period, Brazil has registered the largest GDP growth, followed by USA and Canada. On the other hand, the GDP growth is explained by the evolution of CO2 and N2O (Figure 2).
As can be seen from Figure 2, in the case of Brazil, the GDP growth has largely been generated by an increase in the CO2 level, whereas for USA and Canada this factor has played a smaller role on the GDP evolution.
In the case of our countries (Figure 3), the evolution of this indicator is ascending throughout the entire period.

3. Materials and Methods

3.1. Analysis of Key Statistical Indicators of Central Tendency and Variation

In the following, we present the descriptive statistics of our data by estimating the central tendency of the distribution via the mean and the median values for the variables of interest: gross domestic product (GDP); domestic credit from banks (DCB); domestic credit from the financial sector (DCF); carbon dioxide emissions (CO2); nitrous oxide (N2O); and the value added from agriculture, forestry and fishing (AFF). Table 1 indicates the mean, median and standard deviation of these variables for the period 1970–2018.
Standard deviation values indicate fluctuations of the time series, with DCF having the largest volatility, followed by DCB, while GDP had the smallest volatility. The positive skewness values show that five variables have a right-skewed distribution, while the distribution of CO2 is skewed to the left. The skewness of the GDP distribution is 0.38 (below 3). The kurtosis values for GDP, DCB and AFF are above 3, thus indicating that these distributions are leptokurtic. Since the kurtosis values of DCF, N2O and CO2 are below 3, their distributions are platykurtic.
The Jarque–Bera test checks whether data are normally distributed. Namely, the test measures the difference between the asymmetry coefficient and the kurtosis of the analyzed distribution and those of the normal distribution. The test has the following null hypothesis: the series is normally distributed. Thus, if the probability associated with the test is higher than the chosen significance level (1%, 5% or 10%), the null hypothesis is accepted. In our case, the Jarque–Bera test shows that these six variables are significantly non-normally distributed at 1%, 5% and 10%.

3.2. Analysis of Correlation

In our study, we employed panel data regression to identify relationships between six variables on our sample of three countries from the American continent. Prior to estimating regression coefficients, we ran correlations between our variables to rule out any multicollinearity issue. Table 2 indicates the Pearson correlation coefficients.
With few exceptions, we deem that our data showed no strong correlations between our variables of interest.

3.3. Econometric Models

We used the software EViews version 9.0 to estimate econometric models. Analyses are based on the Panel Least Squares method, which is specific for generating equations on time series data. We employed panel data analysis to investigate the relationships between GDP, CO2, N2O, AFF, DCB and DCF. As mentioned before, N2O causes a greenhouse gas effect, while CO2 is directly responsible for global warming. These two types of gases are generated by activities related to agriculture, forestry and fisheries, which add value to the GDP. The data corresponding to the period 1970–2018 were drawn from the World Development Indicators estimated by the World Bank. We formulated the following research hypotheses:
Hypothesis H1.
There is a linear relationship between GDP and N2O, CO2, DCB.
Hypothesis H2.
There is a linear relationship between GDP and N2O, CO2, DCF.
Hypothesis H3.
There is a linear relationship between DCB, GDP, N2O, CO2, DCF.
Hypothesis H4.
There is a linear relationship between DCF, GDP, N2O, CO2, DCB.
Hypothesis H5.
There is a linear relationship between AFF, GDP, N2O and CO2.
The econometric model had the following general form:
Yit = a0 + a1X1it + a2X2it + a3X3it + a4X4it + δi + θt + εit
where a0 denotes the intercept; ai denotes the coefficient of the variable; X denotes the independent variable; i denotes the country; t indicates the years analyzed (1970–2018); δi indicates the fixed effects controlling for country-specific factors, irrespective of the time; θt indicates the fixed effects controlling for common shocks (i.e., 2008 financial crisis); and εit indicates the error term.
Since common shocks influence dependent variables, we estimated our models with and without fixed effects. Table 3 presents the results of our econometric models.

4. Discussion

According to the first econometric model, the independent variables N2O, C2O and DCB explain 61% of the variance in GDP. The robust t-statistic of −2.89 for CO2 reached statistical significance at the 1% level. Hence, it can be stated that a 1-unit increase in the level of CO2 triggered a 0.421 decrease in the GDP (of almost 50%).
The second econometric model indicated that independent variables explained 62.64% of the changes in GDP, while variables outside the model explained the remaining 37.36%. Estimations revealed the existence of a negative relationship between GDP and CO2, namely that a 1-unit augmentation in CO2 reduced the GDP by 0.464 units. Again, the impact of CO2 was quite substantial.
In the third econometric model, according to the coefficient of determination, 83.15% of the total variance in the outcome variable DCB was explained by the four predictors in question. Results thus indicated a positive relationship between DCB and the independent variables N2O, CO2 and DCF. Namely, for every unit change in N2O, there was a 2.055-unit rise in DCB. At the same time, CO2 and DCF significantly impacted on DCB.
According to the fourth econometric model, predictors accounted for 88.48% of the change in DCF. As indicated by the regression estimates, there was a positive connection between DCF and the variable DCB. There was also a negative connection between the dependent variable and N2O, CO2, GDP. Namely, a growth of 1 unit in DCB led to an improvement of 0.899 in DCF. In addition, a 1-unit growth in CO2 determined a 5.918-unit decrease in DCF.
Last but not least, the fifth econometric model showed that 97.30% of the variance in AFF was due to the chosen independent variables. Hence, results indicated that N2O, CO2 and GDP positively influenced AFF. Namely, an increase of 1 unit in N2O led to an improvement of 0.42 in AFF. Moreover, for every unit change in CO2 and GDP, there was an increase of 3.63 and 0.927 units in AFF.
Hence, all the econometric models that we have estimated for the panel data analysis were significant and our variables of interest established cointegration relationships both in the short run and the long run. For that matter, in line with Ghouali et al. [32], we reported a cointegration relationship between CO2 emissions and the economic variables. According to our results, the variable CO2 emissions had a negative impact on the level of GDP, thus ultimately affecting the greening of economies. In addition, we found that the level of domestic credits granted by banks was insufficient in order to support green finance projects. In the light of these results, one could state that financial sectors play a fundamental role in achieving goals with respect to green finance, which will be discussed in the following paragraphs.
Financial systems around the world represent constant sources of information in terms of the progress registered by the green finance movement. For a case in point, the US-based investment bank Morgan Stanley carried out a study on the performance of 11,000 mutual funds in the USA during 2004–2018 and concluded the following: (1) no financial trade-off exists between the returns of sustainable funds and traditional funds; (2) sustainable funds are associated with lower market risks as compared to traditional funds; (3) sustainable funds offer a layer of stability during volatile markets [33]. The results from our study are in line with the abovementioned findings in that domestic credits granted by players from the financial sector promote green finance.
As a general rule, financial institutions have the propensity to support projects using fossil fuel rather than green projects because the latter have a lower rate of return and because of the risks associated with new technologies of green investments [19]. Our findings also follow the direction of this study. Moreover, the levels of domestic credit offered by banks were insufficient to cover the expenditures entailed by green finance projects. For that matter, development banks have generally allotted 17% of their credit portfolio to green finance investments, while spending 22% of their funds on conventional energy and conventional infrastructure projects during the period 2007–2016.
Moreover, international organizations have pointed out that the level of CO2 emissions increases together with the level of economic growth [34]. Based on the recommendations formulated in line with the Paris Agreement regarding climate change [35], worldwide governments should strive to attain the following three important goals:
(1)
capping global warming at 1.5 °C;
(2)
improving the capacity of adaptation to extreme weather conditions triggered by climate change;
(3)
directing financial flows towards projects that efficiently mitigate greenhouse gas emissions and support climate-resilient development.
Overall, the G20 nations have been committed to implementing the so-called nationally determined contributions in accordance with the Paris Agreement regarding climate change. The global temperature is expected to increase by 3.2 °C since the G20 nations have triggered the highest level of CO2 emissions (56%) in the period 1990–2014, as 82% of the energy used was obtained from fossil fuels. Within this particular context, Brazil has suffered the largest loss in terms of deforestation (i.e., 10%). Moreover, G20 nations offer more subsidies on fossil fuel energy instead of opting for the use of carbon pricing. Brazil provides subsidies worth $16 billion, followed by Canada with $3.7 billion and the USA with $2.1 billion. In the light of this reality, countries must reduce their greenhouse gas emissions by 45% until 2030 and reach zero emissions until 2070 in order to keep climate change at a steady 1.5 °C level. Furthermore, an ambitious goal for G20 nations should be to reduce their energy production from fossil fuels down to the 67% level by 2030 and to 33% by 2050.
Among the G20 countries, India is in a class of its own by trying to implement a Climate Action Plan. Namely, India has invested 40% of its nationally determined contributions into projects regarding non-fossil energy and aims to achieve 80% energy-efficient cities by 2030. In terms of these nationally determined contributions, the countries from our sample have not registered relevant progress as compared to India. For example, Brazil has cut 95% of its climate change budget and most probably it will not attain a sufficient level of nationally determined contributions by 2030. The USA has also failed to achieve this level as a result of the withdrawal from the Paris Agreement and the rollback of its existing climate policy [33].
Overall, G20 nations are focused on three major national green finance strategies, which are: climate-related financial risks; green investment; brown investments. In this sense, Brazil, South Africa and France implement the climate-related financial risk assessments, Canada and Indonesia use voluntary and mandatory climate-related risk assessments, while China, India and Japan follow capital and liquidity demands to promote green loans and investments. In addition, Brazil, Canada and the USA impose restrictions on development agencies and banks in order to finance coal energy. The majority of G20 countries have carbon-pricing schemes such as emission trading systems and carbon taxes. Taxation can be used as a useful tool in the process of capping global warming, which is often worsened by underground economic activities and extensive corruption acts that deprive public budgets from much needed funds [36]. Provided that national governments are trustworthy and efficiently monitor tax systems, individual and corporate taxpayers comply with national policies, pay their fare shares and follow governmental regulations concerning air and land pollution levels [37,38,39,40,41].
Climate change has a negative impact on societies nowadays [42]. At a worldwide level, the volatility of extreme weather conditions has led to the death of 526,000 people and the loss of $3.47 trillion in the period 1998–2017. The rising global temperature causes severe tropical cyclones. In this sense, the US ranked 12th according to the 2017 Climate Rank Index (CRI). Climate change also causes heavy landslides and floods. According to the CRI on heavy rainfalls and floods, Nepal (4th), Bangladesh (9th) and India (14th) suffered heavily in 2017, as these countries registered the loss of 1200 people and the displacement of another 40 million people. Puerto Rico (1st), Honduras (2nd) and Myanmar (3rd) have been the worst affected countries by climate change in the last 20 years (1998–2017) because these nations have lost 4061, 4215 and 14,392 people per 100,000 inhabitants and about 4.2%, 1.8% and 0.6% of their GDP, respectively. As can be noticed, the toll that climate change takes on societies is extensive both in terms of human casualties and economic losses.
In the process of promoting green finance, Brazil relies more on its financial sector than banks. In this sense, the country has registered 38 bonds released by seven issuers for green finance projects, and out of each, 8 bonds worth $3.6 billion target renewable energy projects. With respect to low-carbon transport, Brazil has registered 19 bonds released by four issuers, out of which 5 bonds are worth $1.8 billion. Moreover, USA has ranked first in the number of green bonds issued at a global level with 1213 bonds worth $58 billion. In addition, Canada has also issued four green bonds worth $5 billion [43].

5. Conclusions and Policy Implications

At the global level, there is a fundamental need for appropriate strategies that strongly support greening the financial system through specific actions such as mobilizing and accelerating financial flows from private economic entities into key areas of clean growth and environmental sectors [44]. The extant literature reports studies on determining carbon risks of financial assets (e.g., stocks, corporate bonds) in order to assess investor confidence [45]. Based on the level of carbon risks, companies are usually classified into green firms and brown firms. Nevertheless, at the present moment it is difficult to estimate future returns on sustainable versus non-sustainable financial assets.
For governmental authorities around the world it is very important to support green finance by means of international capital markets, thus following the example of countries such as Brazil and India, which make use of the Green Infrastructure Investment Coalition to engage with foreign investors. Other instruments available for attracting international funds towards green finance projects are the Sustainable Banking Network, the UNEP Finance Initiative and the Sustainable Insurance Policy Forum [2].
In the present study, we have tackled the importance of reducing greenhouse gas (GHG) emissions, but there is still no substantial progress in this direction at global level [46]. In this regard, financial sectors should be consistently stimulated to promote green finance as bank credits are rather insufficient. In terms of the banking sector, policy changes should be enacted to strongly promote green finance [47]. Moreover, for ensuring an efficient financial sector, governments around the world need to develop appropriate fiscal policies as suggested by various United Nations discussion forums. As Burniaux et al. [48] reported, a reduction of subsidies for fossil fuels and electricity in 20 non-OECD countries would decrease global CO2 emission levels by 13% and greenhouse gases by 10% until 2050. In addition, the Kyoto Protocol negotiations and the Rio+20 Conference declarations have represented important steps towards the reduction of subsidies for fossil fuels, but so far these efforts have not yielded the expected results [49,50,51,52,53,54].
All in all, credits offered by the banking system are insufficient for achieving green financing. Therefore the financial sector needs to play a much bigger role in increasing the level of green investments aimed at supporting economic growth and mitigating global warming. Moreover, green financing must be promoted through suitable fiscal and monetary policies. At the same time, we deem that the ultimate goals of economic growth and climate change policies can be concurrent.

Author Contributions

Conceptualization, I.B.; methodology, I.B.; software, H.T.; validation, M.M.R.; formal analysis, M.M.R.; resources, G.F.; data curation, M.-I.R.; writing—original draft preparation, M.M.R.; writing—review and editing, L.B.; visualization, H.T.; supervision, M.-I.R.; project administration, I.B. All authors have read and agreed to the published version of the manuscript.

Funding

This research received no external funding.

Acknowledgments

Authors would like to thank three anonymous reviewers for their helpful comments in improving the quality of this article.

Conflicts of Interest

The authors declare no conflict of interest.

References

  1. FAO; IFAD; UNICEF; WFP; WHO. State of Food Security and Nutrition in the World 2018. Building Climate Resilience for Food Security and Nutrition; FAO: Rome, Italy, 2018. [Google Scholar]
  2. UNEP. Green Finance for Developing Countries: Needs, Concerns and Innovations; UNEP: Geneva, Switzerland, 2016. [Google Scholar]
  3. Inter-American Development Bank. Transforming Green Bond Markets; Inter-American Development Bank: Washington, DC, USA, 2017. [Google Scholar]
  4. Climate Bonds Initiative. Latin America & Caribbean: Green Finance State of the Market; Climate Bonds Initiative: London, UK, 2019. [Google Scholar]
  5. IFC. Climate Investment Opportunities in Emerging Markets: An IFC Analysis; IFC: Washington, DC, USA, 2016. [Google Scholar]
  6. Damerow, F.; Kidney, S.; Clanaghan, S. How Covered Bond Markets Can be Adapted for Renewable Energy Finance and How This Could Catalyze Innovation in Low Carbon Capital Markets; Climate Bonds Initiative: London, UK, 2012. [Google Scholar]
  7. IMF. IMF Annual Report; International Monetary Fund: Washington, DC, USA, 2007. [Google Scholar]
  8. IMF. IMF Annual Report; International Monetary Fund: Washington, DC, USA, 2016. [Google Scholar]
  9. Global Sustainable Investment Alliance. Global Sustainable Investment Review 2018; Global Sustainable Investment Alliance: Washington, DC, USA, 2018. [Google Scholar]
  10. Climate & Development Knowledge Network. Policy Brief Report; Climate & Development Knowledge Network: London, UK, 2013. [Google Scholar]
  11. FAO. Linking Sustainability and Climate Financing: Implications for Agriculture; FAO: Rome, Italy, 2011. [Google Scholar]
  12. IEA. Redrawing the Energy-Climate Map; World Energy Outlook Special Report; IEA: Paris, France, 2013. [Google Scholar]
  13. FAO. Agriculture, Forestry and Other Land Use Emissions by Sources and Removals by Sinks; FAO Statistics Division Working Paper Series; FAO: Rome, Italy, 2014. [Google Scholar]
  14. Shyamsundar, P.; Springer, N.; Tallis, P.; Polasky, S.; Jat, M.L.; Sidhu, H.S.; Krishnapriya, P.P. Fields on fire: Alternatives to crop residue burning in India. Science 2019, 365, 536–538. [Google Scholar] [CrossRef] [PubMed]
  15. Tubiello, F.N.; Salvatore, M.; Rossi, S.; Ferrara, A.; Fitton, N.; Smith, P. The FAOSTAT database of greenhouse gas emissions from agriculture. Environ. Res. Lett. 2013, 8, 015009. [Google Scholar] [CrossRef]
  16. Kasman, A.; Duman, Y.S. CO2 emissions, economic growth, energy consumption, trade and urbanization in new EU member and candidate countries: A panel data analysis. Econ. Model. 2015, 44, 97–103. [Google Scholar] [CrossRef]
  17. Uddin, G.A.; Salahuddin, M.; Alarm, K.; Gow, I. Ecological footprint and real income: Panel data evidence from the 27 emitting countries. Ecol. Indic. 2017, 77, 166–175. [Google Scholar] [CrossRef]
  18. Alshubiri, F.; Elhehhad, M. Foreign finance, economic growth and CO2 emissions nexus in OECD countries. Int. J. Clim. Change Strateg. Manag. 2020, 12, 161–181. [Google Scholar] [CrossRef]
  19. ADBI. Why is Green Finance Important? ADBI Working Paper Series; No. 917; ADBI: Tokyo, Japan, 2019. [Google Scholar]
  20. Chowdhury, T.M.; Datta, R.; Mojahan, H. Green finance is essential for economic development and sustainability. Int. J. Res. Commer. Econ. Manag. 2013, 3, 104–108. [Google Scholar]
  21. Akinlo, A.E. Energy consumption and economic growth: Evidence from 11 African countries. Energ. Econ. 2008, 30, 2391–2400. [Google Scholar] [CrossRef]
  22. Lee, C.C.; Chang, C.P.; Chen, P.F. Energy-income causality in OECD countries revisited: The key role of capital stock. Energ. Econ. 2008, 30, 2359–2373. [Google Scholar] [CrossRef]
  23. Narayan, P.K.; Smyth, R. Energy consumption and GDP in G7 countries: New evidence from panel co-integration with structural banks. Energ. Econ. 2008, 30, 2331–2341. [Google Scholar] [CrossRef]
  24. Squalli, J. Electricity consumption and economic growth bounds and causality analyses for OPEC members. Energ. Econ. 2007, 29, 1192–1205. [Google Scholar] [CrossRef]
  25. Wolde-Rufael, Y. Energy consumption and economic growth: The experience of African economies revisited. Energ. Econ. 2009, 31, 217–224. [Google Scholar] [CrossRef]
  26. Kahlenborn, W.; Cochu, A.; Georgiev, I.; Eisinger, F.; Hogg, D. Defining “Green” in the Context of Green Finance. Final Report; European Commision: Luxemburg, 2017. [Google Scholar]
  27. Zhang, D.; Zhang, Z.; Managi, S. A bibliometric analysis in green finance: Current status, development, and future directions. Financ. Res. Lett. 2019, 29, 425–430. [Google Scholar] [CrossRef]
  28. Zhou, X.; Tang, X.; Zhang, R. Impact of green finance on economic development and environmental quality: A study based on provincial panel data from China. Environ. Sci. Pollut. R. 2020, 27, 19915–19932. [Google Scholar] [CrossRef] [PubMed]
  29. Falcone, P.M. Environmental regulation and green investments: The role of green finance. Int. J. Green Econ. 2020, 14, 159–173. [Google Scholar] [CrossRef]
  30. Cui, H.; Wang, R.; Wang, H. An evolutionary analysis of green finance sustainability based on multi-agent game. J. Clean. Prod. 2020, 269, 121799. [Google Scholar] [CrossRef]
  31. Wang, Y.; Zhi, Q. The role of green finance in environmental protection: Two aspects of market mechanism and policies. Energy Procedia 2016, 104, 311–316. [Google Scholar] [CrossRef]
  32. Ghouali, Y.Z.; Belmokaddem, M.; Sahraoui, M.A.; Guelli, M.S. Factors affecting CO2 emissions in the BRICS countries: A panel data analysis. Procedia Econ. Fin. 2015, 26, 114–125. [Google Scholar]
  33. Morgan Stanley. Sustainable Reality: Analyzing Risk and Returns of Sustainable Funds; Morgan Stanley: New York, NY, USA, 2019. [Google Scholar]
  34. Climate Transparency. Brown to Green Report: The G20 Transition towards a Net-Zero Emissions Economy; Climate Transparency: Berlin, Germany, 2019. [Google Scholar]
  35. Climate Transparency. Brown to Green Report: The G20 Transition to a Low-Carbon Economy; Climate Transparency: Berlin, Germany, 2018. [Google Scholar]
  36. Batrancea, L.; Nichita, A.; Batrancea, I.; Gaban, L. The strength of the relationship between shadow economy and corruption: Evidence from a worldwide country-sample. Soc. Indic. Res. 2018, 138, 1119–1143. [Google Scholar] [CrossRef]
  37. Batrancea, L.M.; Nichita, R.A.; Batrancea, I.; Moldovan, B.A. Tax compliance models: From economic to behavioral approaches. Transylv. Rev. Adm. Sci. 2012, 36E, 13–26. [Google Scholar]
  38. Batrancea, L.; Nichita, A.; Olsen, J.; Kogler, C.; Kirchler, E.; Hoelzl, E.; Weiss, A.; Torgler, B.; Fooken, J.; Fuller, J.; et al. Trust and power as determinants of tax compliance across 44 nations. J. Econ. Psych. 2019, 74, 102191. [Google Scholar] [CrossRef]
  39. Kogler, C.; Batrancea, L.; Nichita, A.; Pantya, J.; Belianin, A.; Kirchler, E. Trust and power as determinants of tax compliance: Testing the assumptions of the slippery slope framework in Austria, Hungary, Romanian and Russia. J. Econ. Psychol. 2013, 34, 169–180. [Google Scholar] [CrossRef]
  40. Batrancea, L.; Nichita, A. Which is the best government? Colligating tax compliance and citizens’ insights regarding authorities’ actions. Transylv. Rev. Adm. Sci. 2015, 44E, 5–22. [Google Scholar]
  41. Nichita, A.; Batrancea, L.; Pop, C.M.; Batrancea, I.; Morar, I.D.; Masca, E.; Roux-Cesar, A.M.; Forte, D.; Formigoni, H.; da Silva, A.A. We learn not for school but for life: Empirical evidence of the impact of tax literacy on tax compliance. Eastern Eur. Econ. 2019, 57, 397–429. [Google Scholar] [CrossRef]
  42. Available online: www.preventionweb.net/news/view/62408 (accessed on 20 July 2020).
  43. Climate Bonds Initiative. Post-Issuance Reporting in the Green Bond Market; Climate Bonds Initiative: London, UK, 2019. [Google Scholar]
  44. HM Government. Green Finance Strategy: Transforming Finance for a Greener Future; HM Government: London, UK, 2019.
  45. CARIMA. Carbon Risks and Financed Emissions of Financial Assets and Portfolios: Measurement, Management and Reporting based on Capital Market Data; University of Augsburg: Augsburg, Germany, 2019. [Google Scholar]
  46. OECD. OECD Work in Support of Climate Action; OECD Publishing: Paris, France, 2018. [Google Scholar]
  47. Yujun, C. Analyzing Green Finance Incentives: An Empirical Study of the Chinese Banking Sector. Master’s Thesis, University of Waterloo, Waterloo, ON, Canada, 2017. [Google Scholar]
  48. Burniaux, J.M.; Chanteau, J.; Dellink, R.; Duval, R.; Jamet, S. The Economics of Climate Change Mitigation: How to Build the Necessary Global Action in a Cost-Effective Manner; OECD Working Papers, No. 701; OECD Publishing: Paris, France, 2009. [Google Scholar]
  49. IMF. Energy Subsidy Reform: Lessons and Implications; International Monetary Fund: Washington, DC, USA, 2013. [Google Scholar]
  50. Keen, M. Trends and Reform Options for Fossil Fuel Subsidies; UNEP-IMF-GIZ Workshop: Geneva, Switzerland, 2012. [Google Scholar]
  51. Batrancea, L.; Rathnaswamy, M.M.; Batrancea, I.; Nichita, A.; Rus, M.-I.; Tulai, H.; Fatacean, G.; Masca, E.S.; Morar, I.D. Adjusted net savings of CEE and Baltic nations in the context of sustainable economic growth: A panel data analysis. J. Risk Financial Manag. 2020, 13, 234. [Google Scholar] [CrossRef]
  52. Batrancea, I.; Rathnaswamy, M.K.; Batrancea, L.; Nichita, A.; Gaban, L.; Fatacean, G.; Tulai, H.; Bircea, I.; Rus, M.-I. A panel data analysis on sustainable economic growth in India, Brazil, and Romania. J. Risk Financial Manag. 2020, 13, 170. [Google Scholar] [CrossRef]
  53. UNEP. Energy Subsidies: Lessons Learnt in Assessing Their Impacts and Designing Policy Reforms; UNEP: Geneva, Switzerland, 2003. [Google Scholar]
  54. UNCSD. The Future We Want; UNCSD: Rio de Janeiro, Brazil, 2012. [Google Scholar]
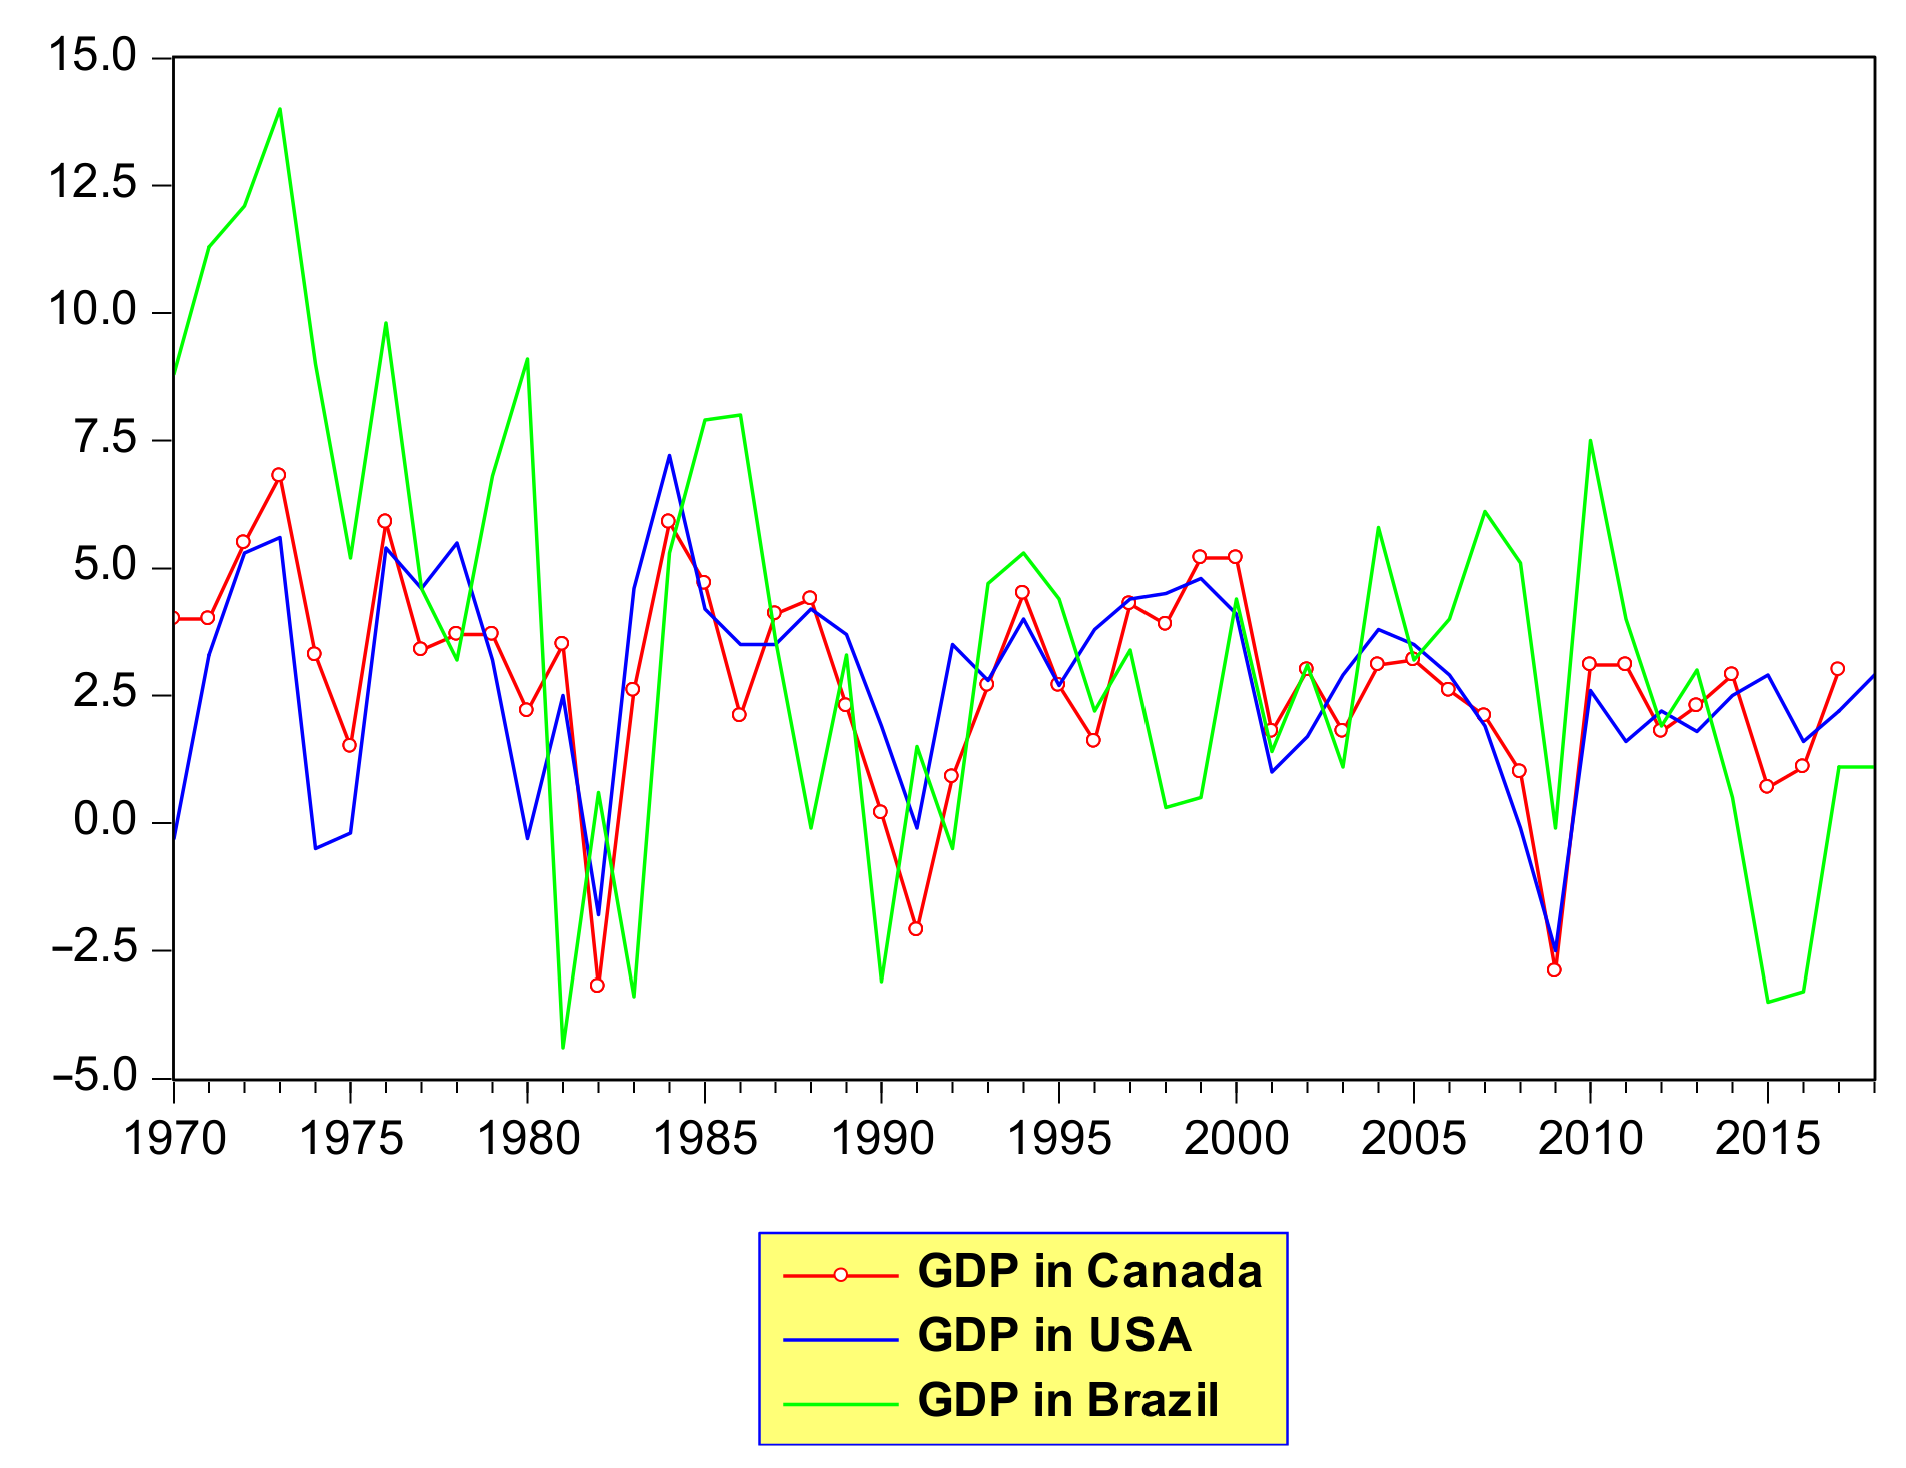
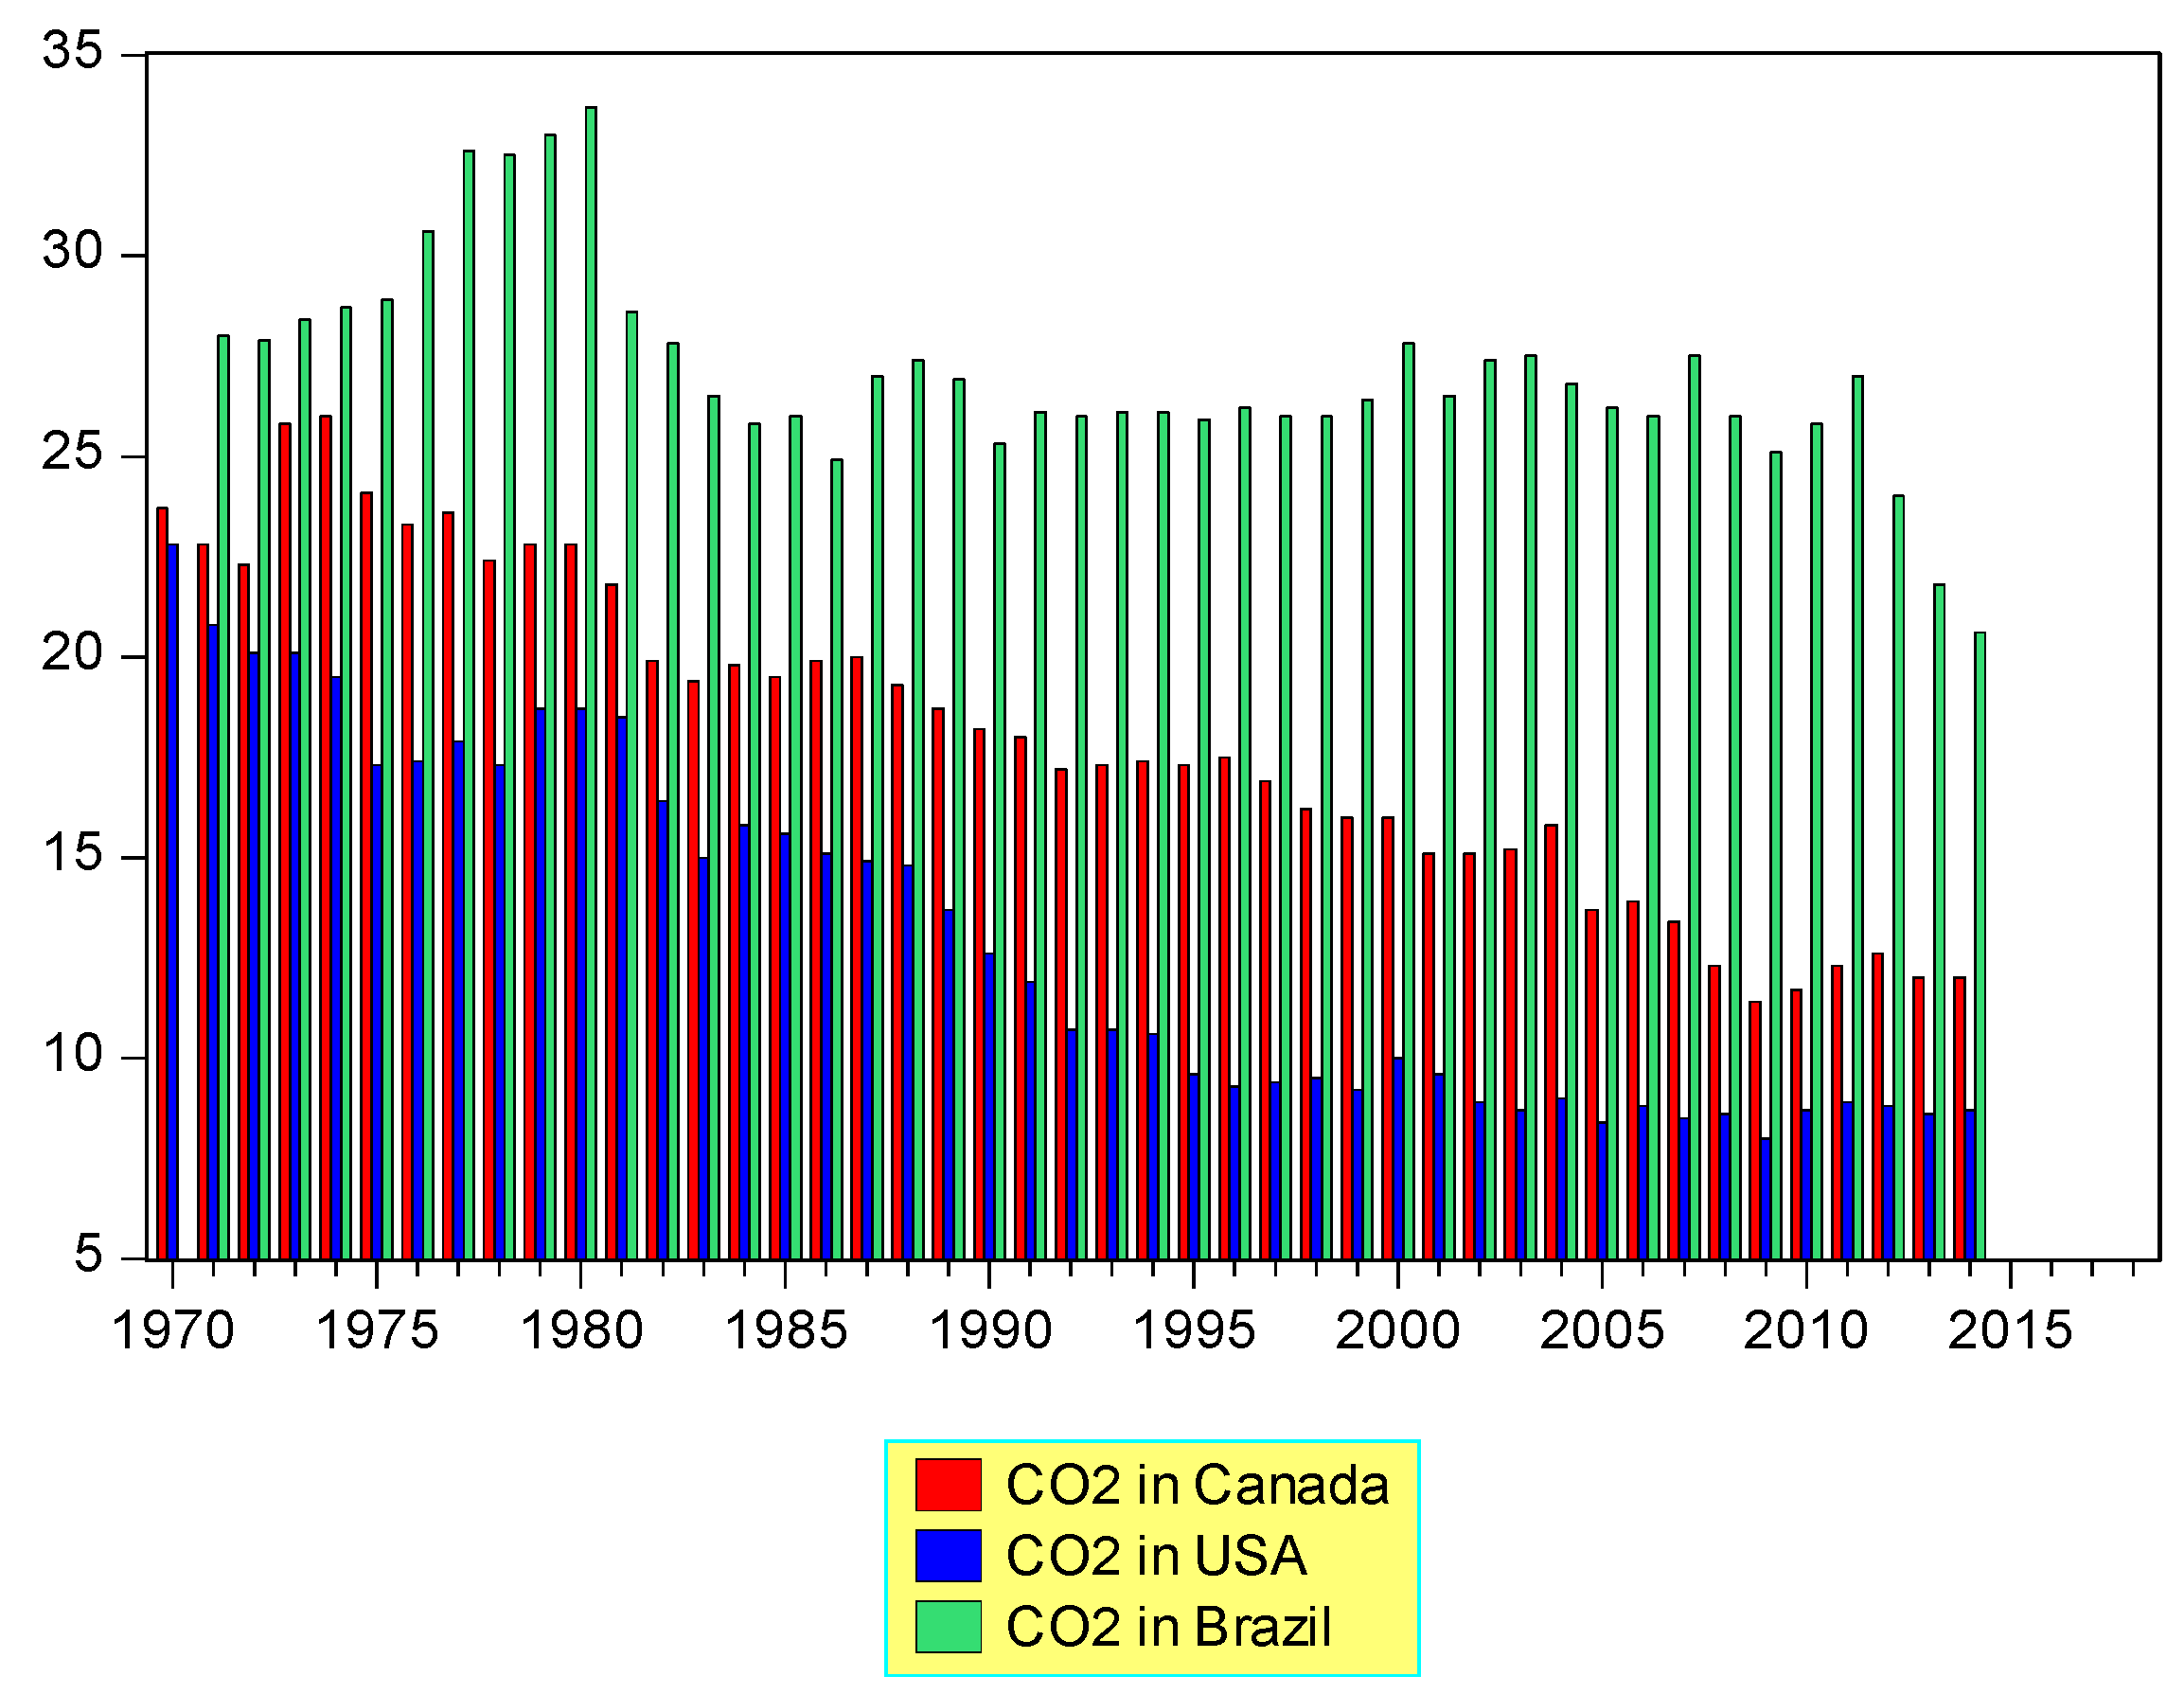
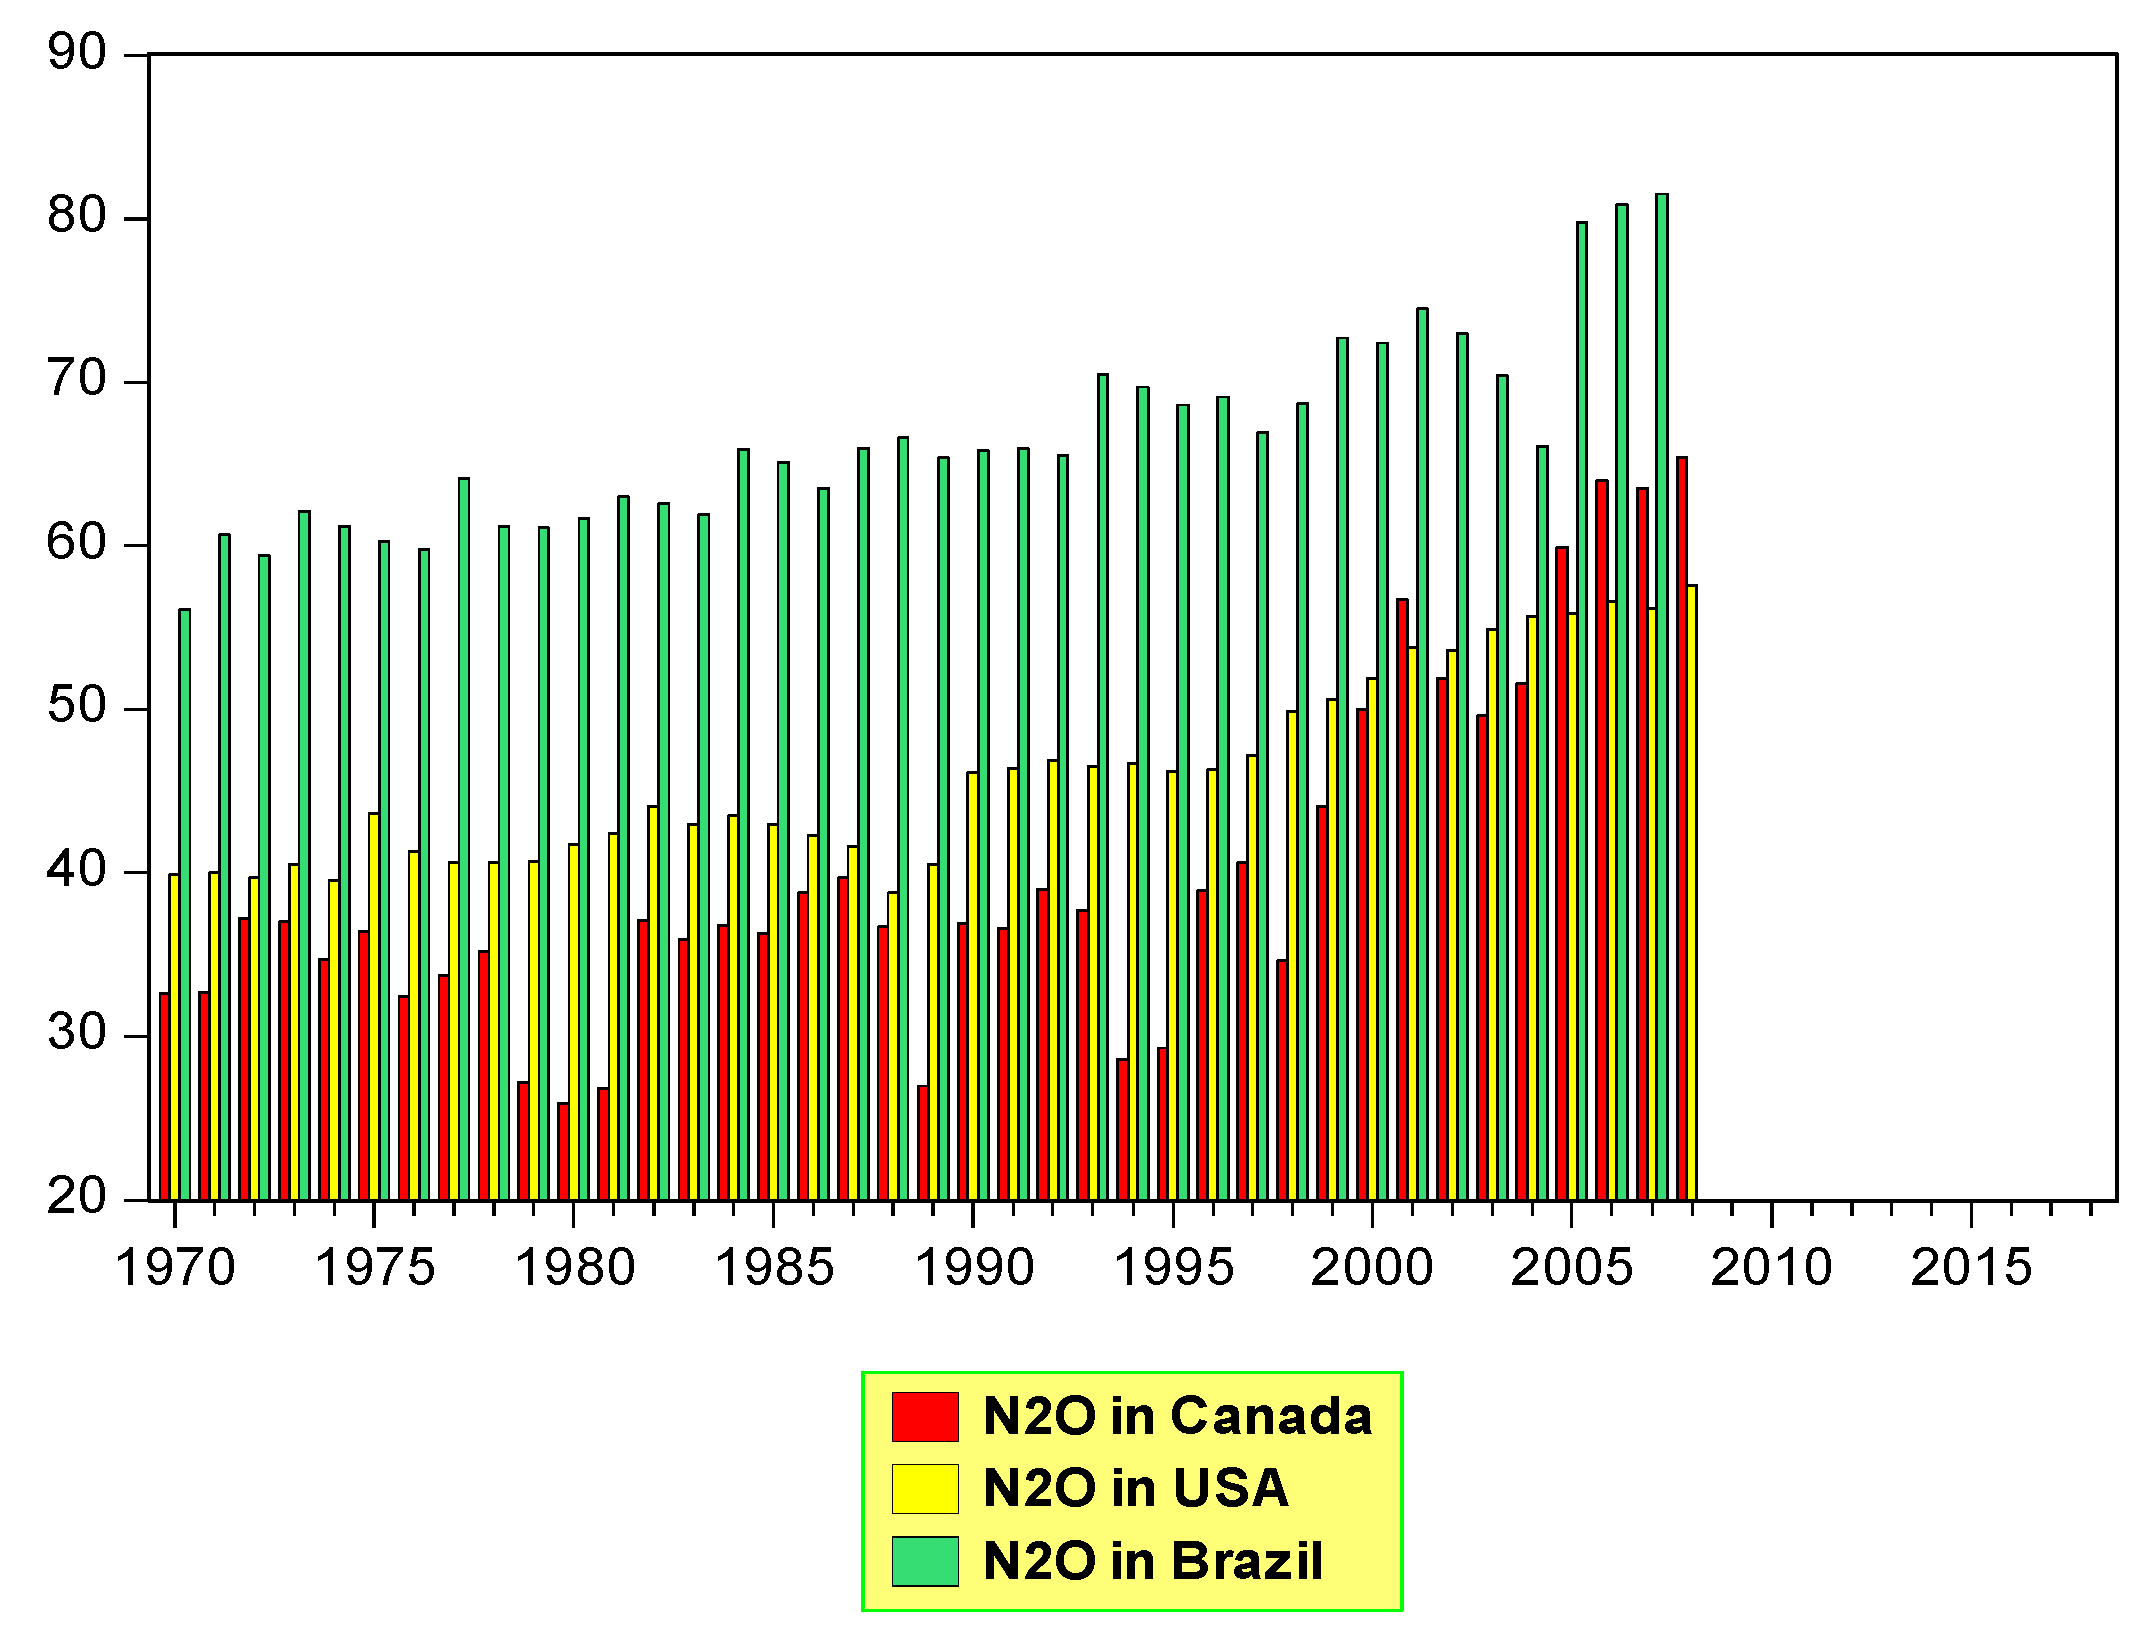
Figure 1. The evolution of GDP for USA, Canada and Brazil.
Mathematics 08 02217 g001
Figure 2. CO2 evolution in Canada, USA and Brazil.
Mathematics 08 02217 g002
Figure 3. The evolution of N2O in Canada, USA and Brazil.
Mathematics 08 02217 g003
Table 1. Descriptive statistics.
SpecificationsGDPDCBDCFN2OCO2AFF
Mean3.06849357.12555121.329150.7336219.326874.426596
Median3.10000052.50000111.450048.4000019.350001.750000
Maximum14.00000213.5000249.700081.5000033.7000037.20000
Minimum−4.40000014.0000036.8000025.900008.000000−8.000000
Std. dev.2.92479926.3244958.8528613.768026.9297898.013043
Skewness0.3885852.4139440.5926240.210890−0.0248782.918510
Kurtosis4.79019712.186622.2286161.9892731.86105611.74779
Jarque–Bera23.17019 ***614.8015 ***11.16580 ***5.797431 *7.256487 **433.1626 ***
Observations14613713411613494
Note: *, **, *** denotes significance at the 10%, 5% and 1% level, respectively.
Table 2. Correlation matrix for the variables of interest.
GDPDCBDCFN2OCO2AFF
GDP1
DCB−0.20191
DCF−0.29140.6255 **1
N2O−0.11084−0.07485−0.15831
CO20.2320−0.3986 *−0.8543 ***0.4103 *1
AFF0.1276–0.2328–0.3819 *–0.4984 *0.22031
Source: *** denotes significance at the 1% level; ** denotes significance at the 5% level; * denotes significance at the 10% level.
Table 3. Econometric models estimating the relationships between our variables of interest.
Model 1:Model 2:Model 3:Model 4:Model 5:
GDP = a0 + a1N2O + a2CO2 + a3DCBGDP = a0 + a1N2O + a2CO2 + a3DCFDCB = a0 + a1N2O + a2CO2 + a3GDP + a4DCFDCF = a0 + a1N2O + a2CO2 + a3GDP + a4DCBAFF = a0 + a1GDP + a2N2O + a3CO2
Constant14.253 ***
(2.815)
14.846 ***
(2.907)
−175.707 ***
(−4.946)
228.710 ***
(5.497)
−94.697 ***
(−5.995)
DCB−0.007
(−0.576)
-0.893 ***
(9.0002)
-
DCF −0.012
(−1.126)
0.613 ***
(9.0002)
-
-
N2O−0.040
(−0.496)
−0.018
(−0.251)
2.055 ***
(4.326)
−0.915
(−1.431)
0.421 **
(2.758)
CO2−0.421 ***
(−2.893)
−0.465 ***
(−2.885)
3.001 ***
(2.680)
−5.918 ***
(−4.827)
3.625 ***
(9.495)
AFF-----
GDP--0.292
(0.367)
−0.977
(−1.024)
−0.927 ***
(−2.895)
Prob.>F0.00020.00020.00000.00000.0000
Cross-section effectsFixedFixedFixedFixedFixed
Time fixed effectsYesYesYesYesYes
R20.6100.6260.8320.9310.973
Adjusted R-squared0.3740.3900.7210.8850.920
F statistic2.5812.6527.51620.39418.492
Observations11511211211266
Note: Robust t-statistics are displayed in parentheses; *, **, *** show statistical significance at the 10%, 5% and 1% levels, respectively. The probability of non-existing fixed effects is denoted by prob. > F. Multicollinearity was analyzed via the variance inflation test (VIF) across all models. VIF values were below 5, thus indicating a low risk of multicollinearity. The Glejser and ARCH tests rejected the null hypothesis of homoscedasticity.
Publisher’s Note: MDPI stays neutral with regard to jurisdictional claims in published maps and institutional affiliations.

