Article

Lattice Boltzmann Numerical Study on Mesoscopic Seepage Characteristics of Soil–Rock Mixture Considering Size Effect

College of Highway, Chang’an University, Xi’an 710064, China
*
Author to whom correspondence should be addressed.
Mathematics 2023, 11(8), 1968; https://doi.org/10.3390/math11081968
Submission received: 22 March 2023 / Revised: 18 April 2023 / Accepted: 19 April 2023 / Published: 21 April 2023
(This article belongs to the Special Issue Computational Methods and Applications for Numerical Analysis)

Abstract

:
One of the hot topics in the study of rock and soil hydraulics is the size effect of a soil–rock mixture’s (SRM) seepage characteristics. The seepage process of the SRM was simulated from the pore scale through the lattice Boltzmann method (LBM) in this paper to explore the internal influence mechanism of sample size effect on the SRM seepage characteristics. SRM samples were generated using the improved Monte Carlo method (IMCM), and through 342 simulation test conditions the influence of size feature parameters such as resolution (R), segmentation type, model feature size (S), feature length ratio (F), and soil/rock particle size feature ratio (P) was examined. The study demonstrated that as R increases, the permeability of the SRM gradually rises and tends to stabilize when R reaches 60 ppi. At the same S, the dispersion degree of model permeability obtained by the four segmentation types is in the order of center < random < equal < top. With an increase in S, the permeability (k) of the SRM gradually decreases, conforming to the dimensionless mathematical model, k = a 0 · S b 0 , and tends to stabilize at S = 80 mm. With an increase in F and an increase in S, the permeability of the SRM exhibits a linear “zonal” distribution that declines in order. When F is greater than 12, the dispersion of the permeability value distribution is especially small. With an increase in P, the permeability of the SRM decreases gradually before rising abruptly. P is crucial for the grading and structural makeup of the SRM. Overall, this paper concludes that the conditions of R = 60 ppi, center segmentation type, S = 80 mm, F ≥ 12, and P set by demand can be used to select and generate the size of the SRM optimal representative elementary volume (REV) numerical calculation model. The SRM can serve as a general reference for test and engineering construction as a common geotechnical engineering material.

Graphical Abstract

1. Introduction

A special type of geological material called a soil–rock mixture (SRM) exists between massive rock masses and fine-grained soil masses [1,2,3]. There is the existence of SRM and hydraulics involved from natural mountain landslides to artificial subgrade fill erosion [4,5]. According to the study’s findings [6], the hydraulic properties of the SRM have clear structural and size effects, which undoubtedly make it more challenging to determine the permeability parameters of the SRM. Therefore, it is crucial to understand how the size of the SRM influences the characteristics of seepage.
Currently, the size effect of seepage characteristics of rock and soil masses is mainly manifested as follows: the permeability of rock and soil mass changes correspondingly with the change in sample size or research scope. Researchers have conducted many studies to address the issue of the size effect of rock and soil permeability. The size effect (including particle and model size effect) and boundary effect are the most significant influencing factors in seepage research, according to Lin et al. [7], who also made some evaluations on the size effect in subsequent research. Research on rock mass permeability characteristics and representative elementary volume (REV) analysis were conducted by Rong et al. [8]. According to the simulation results, the jointed rock mass group number and spacing are more sensitive to the effects of REV, while the crack opening has the biggest impact on its permeability characteristics. According to the analysis by Chen et al. [9] about the causes of the pore size effect in low permeability clay seepage, a microscale seepage theory model of the pore size effect was proposed. Wang [10] examined the statistical characteristics and size effect of the permeability coefficient of samples with different rock content and tested the ratio of sample side length to the maximum particle size of block stone (millimeter scale) to determine the effect of rock content on the permeability coefficient and its REV. A rock mass seepage test was performed by Liu et al. [11] by using the boundary element method after nine two-dimensional (2D) rock mass networks of various sizes were built using the Monte Carlo method. The findings demonstrated that the permeability is in a fluctuating state when the sample size is less than 12 m and that until the model size is greater than 12 m, the curve gradually tends to be stable. The REV of the rock and soil mass and the corresponding characterization size were determined in the aforementioned research from various angles and fields, but the characterization size was determined using various methods, resulting in different results. Additionally, most of the aforementioned studies concentrate on the size effect of the permeability for a single mass of soil or rock, and the study of the size effect of the permeability of the SRM with unique building materials is infrequently included. It is still unclear how many size factors affect the seepage characteristics of the SRM because of the various research scales and objectives.
The study of the numerical method for determining the permeability of rock and soil mass is currently fairly advanced, but some areas still require improvement. While it is well known that the SRM belongs to discrete particles of a discontinuous medium [12], the numerical simulation method typically adopts the continuous medium assumption.
In light of this, the lattice Boltzmann method (LBM) was created. In the field of porous media seepage, it was first proposed by McNamara et al. [13] and quickly developed due to its advantage of easy implementation and parallel computing [14,15,16]. Many researchers have used LBM with better success to simulate and study the mesoscopic seepage characteristics of porous media [17,18,19,20]. The premise of the SRM’s permeability study is also the construction of the SRM model. At the moment, scanning electron microscopy (SEM) and random generation are the two techniques most frequently used. Additionally, by adjusting the pertinent key parameters, the random generation method can create the necessary SRM model. Its models have unique shapes that resemble the actual SRM [12]. To simulate the seepage process within the SRM, it can easily be combined with LBM.
Since different types of SRM samples are generated using the improved Monte Carlo method in this study, LBM is used to simulate the mesoscopic seepage process within the SRM from the pore scale. It is expected to reveal the internal influence mechanism of sample size effect on SRM seepage characteristics and provide a certain reference basis for further research. Finally, through 342 simulation test conditions, the influence of size characteristic parameters such as resolution (R), segmentation type, model feature size (S), feature length ratio (F), and soil/rock particle size feature ratio (P) on the seepage characteristics of SRMs is discussed in detail.

2. Materials and Methods

To verify the viability of the BGK-LBM model from flow velocity through the conventional theoretical value of the Poiseuille and the numerical value, the study first introduces the construction of the SRM model and the LBM numerical model. The influence of size effect on SRM seepage characteristics is then thoroughly discussed. The paper concludes by delving deeply into the selection of the SRM’s optimal representative elementary volume model size.

2.1. Discrete Models of Soil–Rock Mixture

The overall porosity of the model, the physical characteristics of the rocks (rock content, rock particle size, etc.), and the soil/rock ratio are all strongly correlated with the physical and mechanical characteristics of the SRM [19]. Additionally, in reference to the research that was conducted by other researchers on SRM seepage characteristics [17,21,22], it has been observed that employing 2D models to simulate SRM seepage characteristics also possesses a particular representativeness. As a result, the classical Monte Carlo method [23] is used to investigate how the aforementioned variables affect the SRM’s permeability. Considering this, the important parameter of the distance dd between particles is introduced, and the MATLAB program is put together to produce various kinds of 2D SRM models for further study. Following is the specific implementation procedure:
Step 1: Determine the SRM model with the size boundary l × b, the initial porosity (n0 = 1.0), particle size (the particle size here refers to the diameter, Dm = [d1, d2, …, dm]), and other important parameters.
Step 2: Using the primary parameters from Step 1, the MATLAB program’s rand function is used to generate the particle distribution position (xi, yj) in the delivery area at random. The position is then given the particle size di (i = 1, 2, …, m), meaning that a solid random particle m can be drawn from these parameters.
Step 3: The crucial parameter of the distance dd between particles is introduced to make it easier to adjust the position relationship between the particles. By repeating Step 2 based on this, a string of independent particles can be created. The generation of the SRM model is not complete until the porosity n satisfies Equation (1).
n = n 0 i = m π ( D m 2 ) 2 l b
Using the aforementioned technique, the porosity of the SRM is set within the range 0.36–0.51 and the particle size di is set to 4, 6, 10, 25, and 35 mm based on References [19,24] and combined with the focus of this study. Various types of SRM–1, SRM–2, and SRM–3 are generated at random (see Figure 1a–c), where the model’s size is l = 100 mm by b = 100 mm and the black area represents soil/rock particles and the white area represents pores. Calculate the direction frequency of particle distribution for various models concurrently to reflect the change in the particle distribution rule generated randomly by the SRM, as shown in Figure 1d–f. Figure 1d–f show how the distribution of soil/rock particles vary among the three models and is disordered, which is consistent with the anisotropic properties of the SRM [12]. In conclusion, the SRM model created by the random method described in this paper has a good effect on the distribution of soil/rock particles. Based on this, it is quick and convenient to study the influence of many factors on its seepage characteristics, so other models are generated using this method in the future.

2.2. Theoretical Part

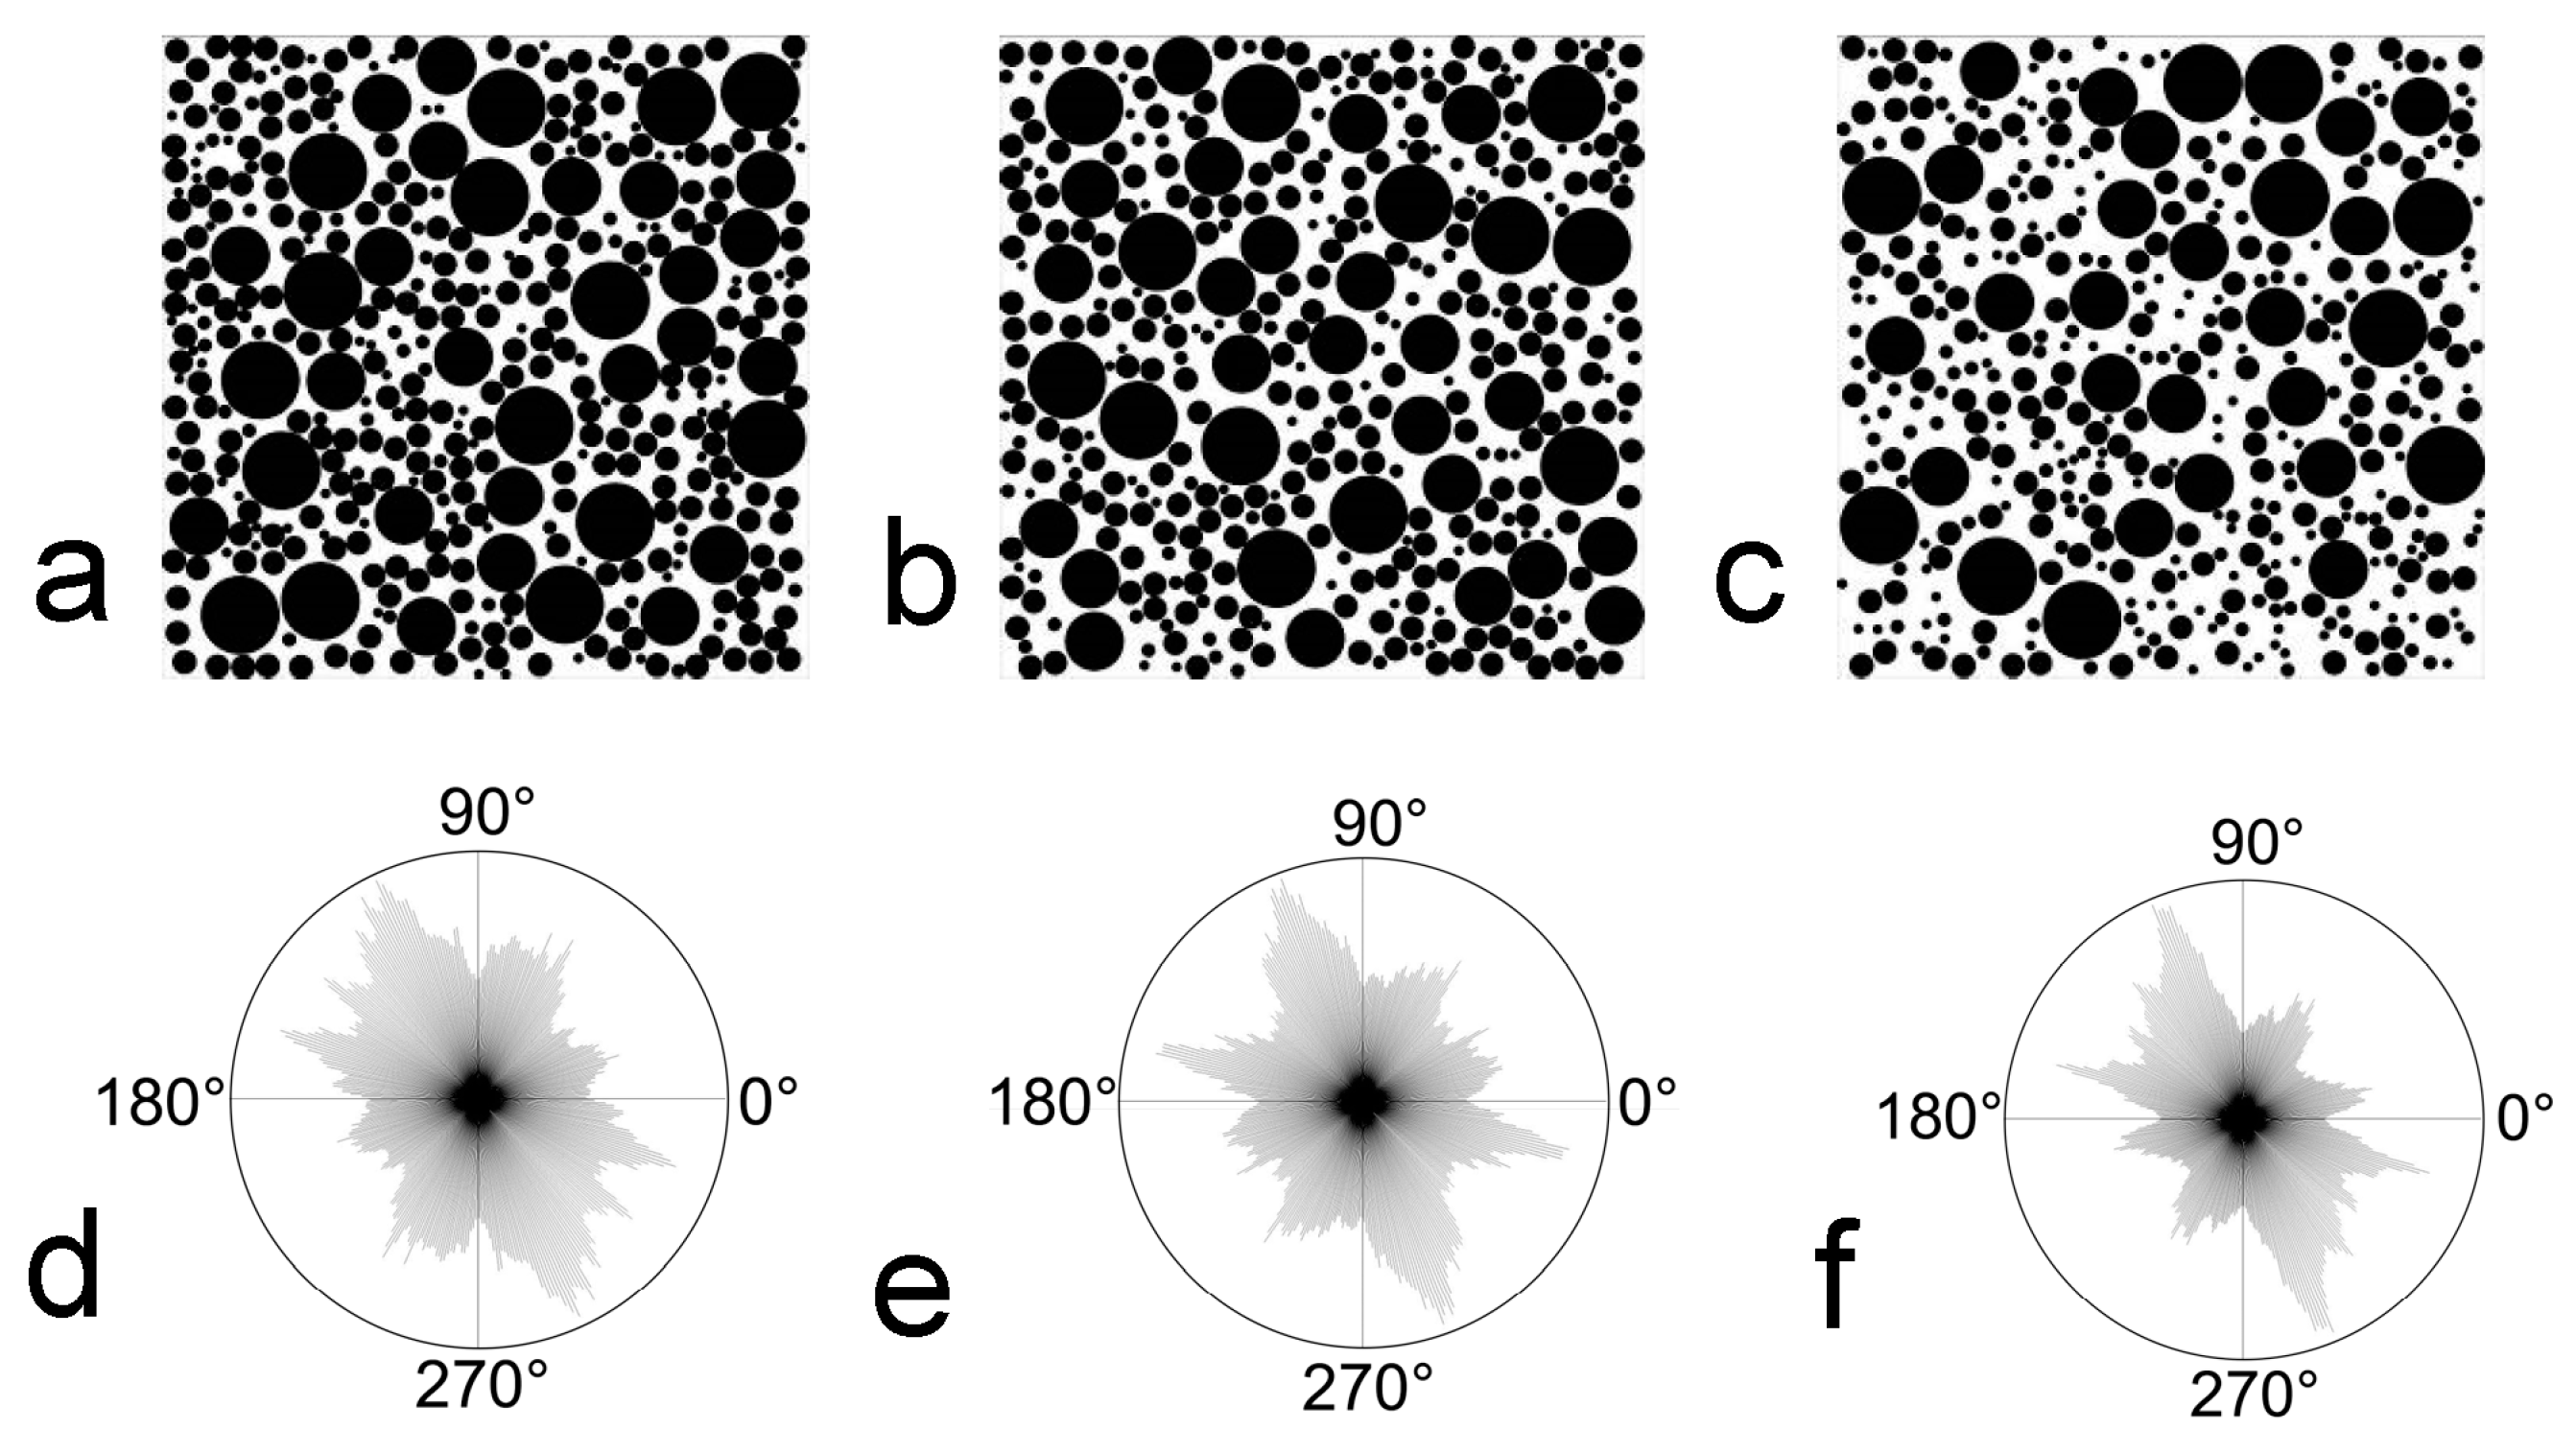
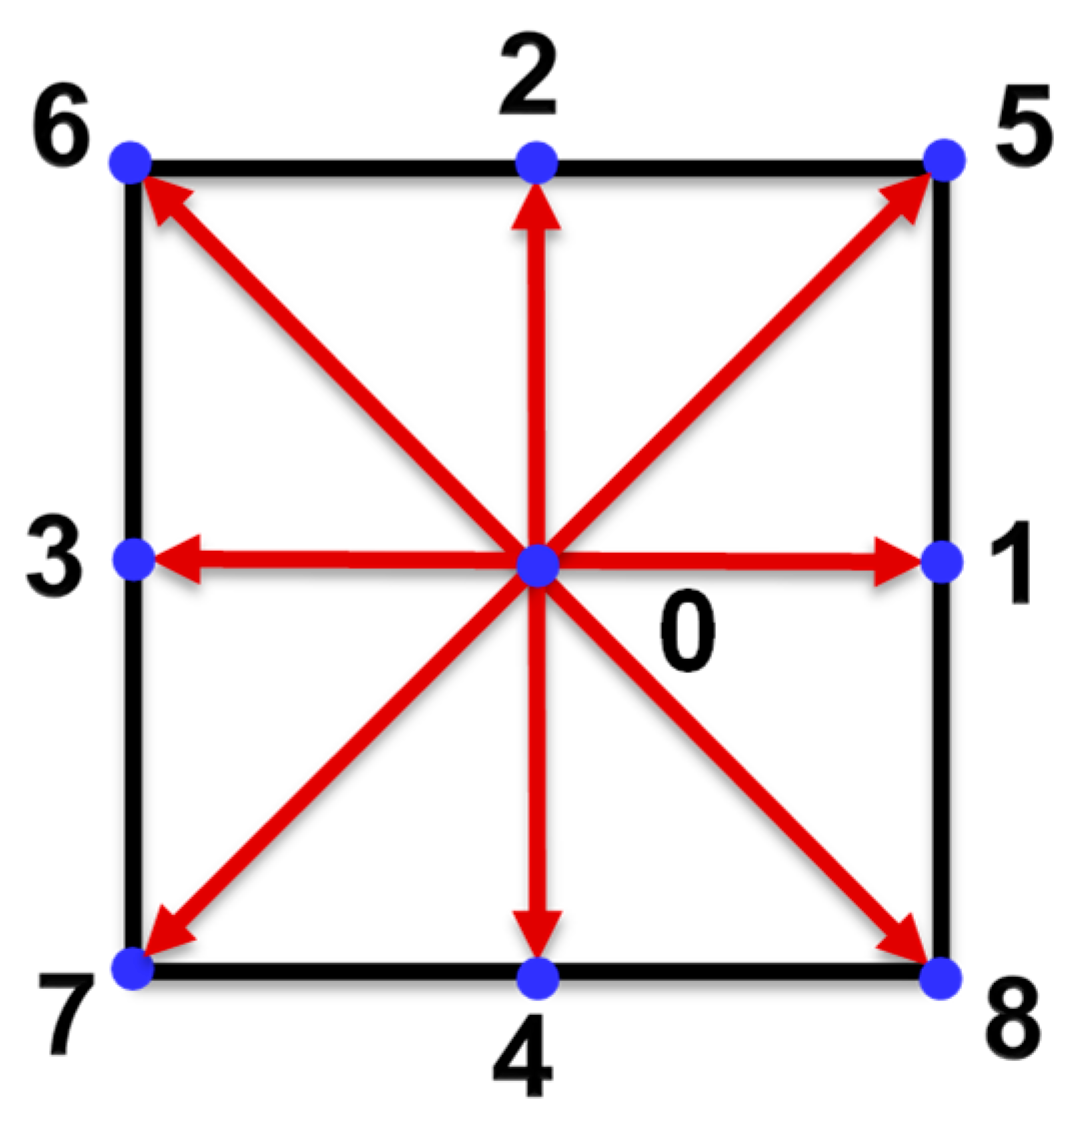
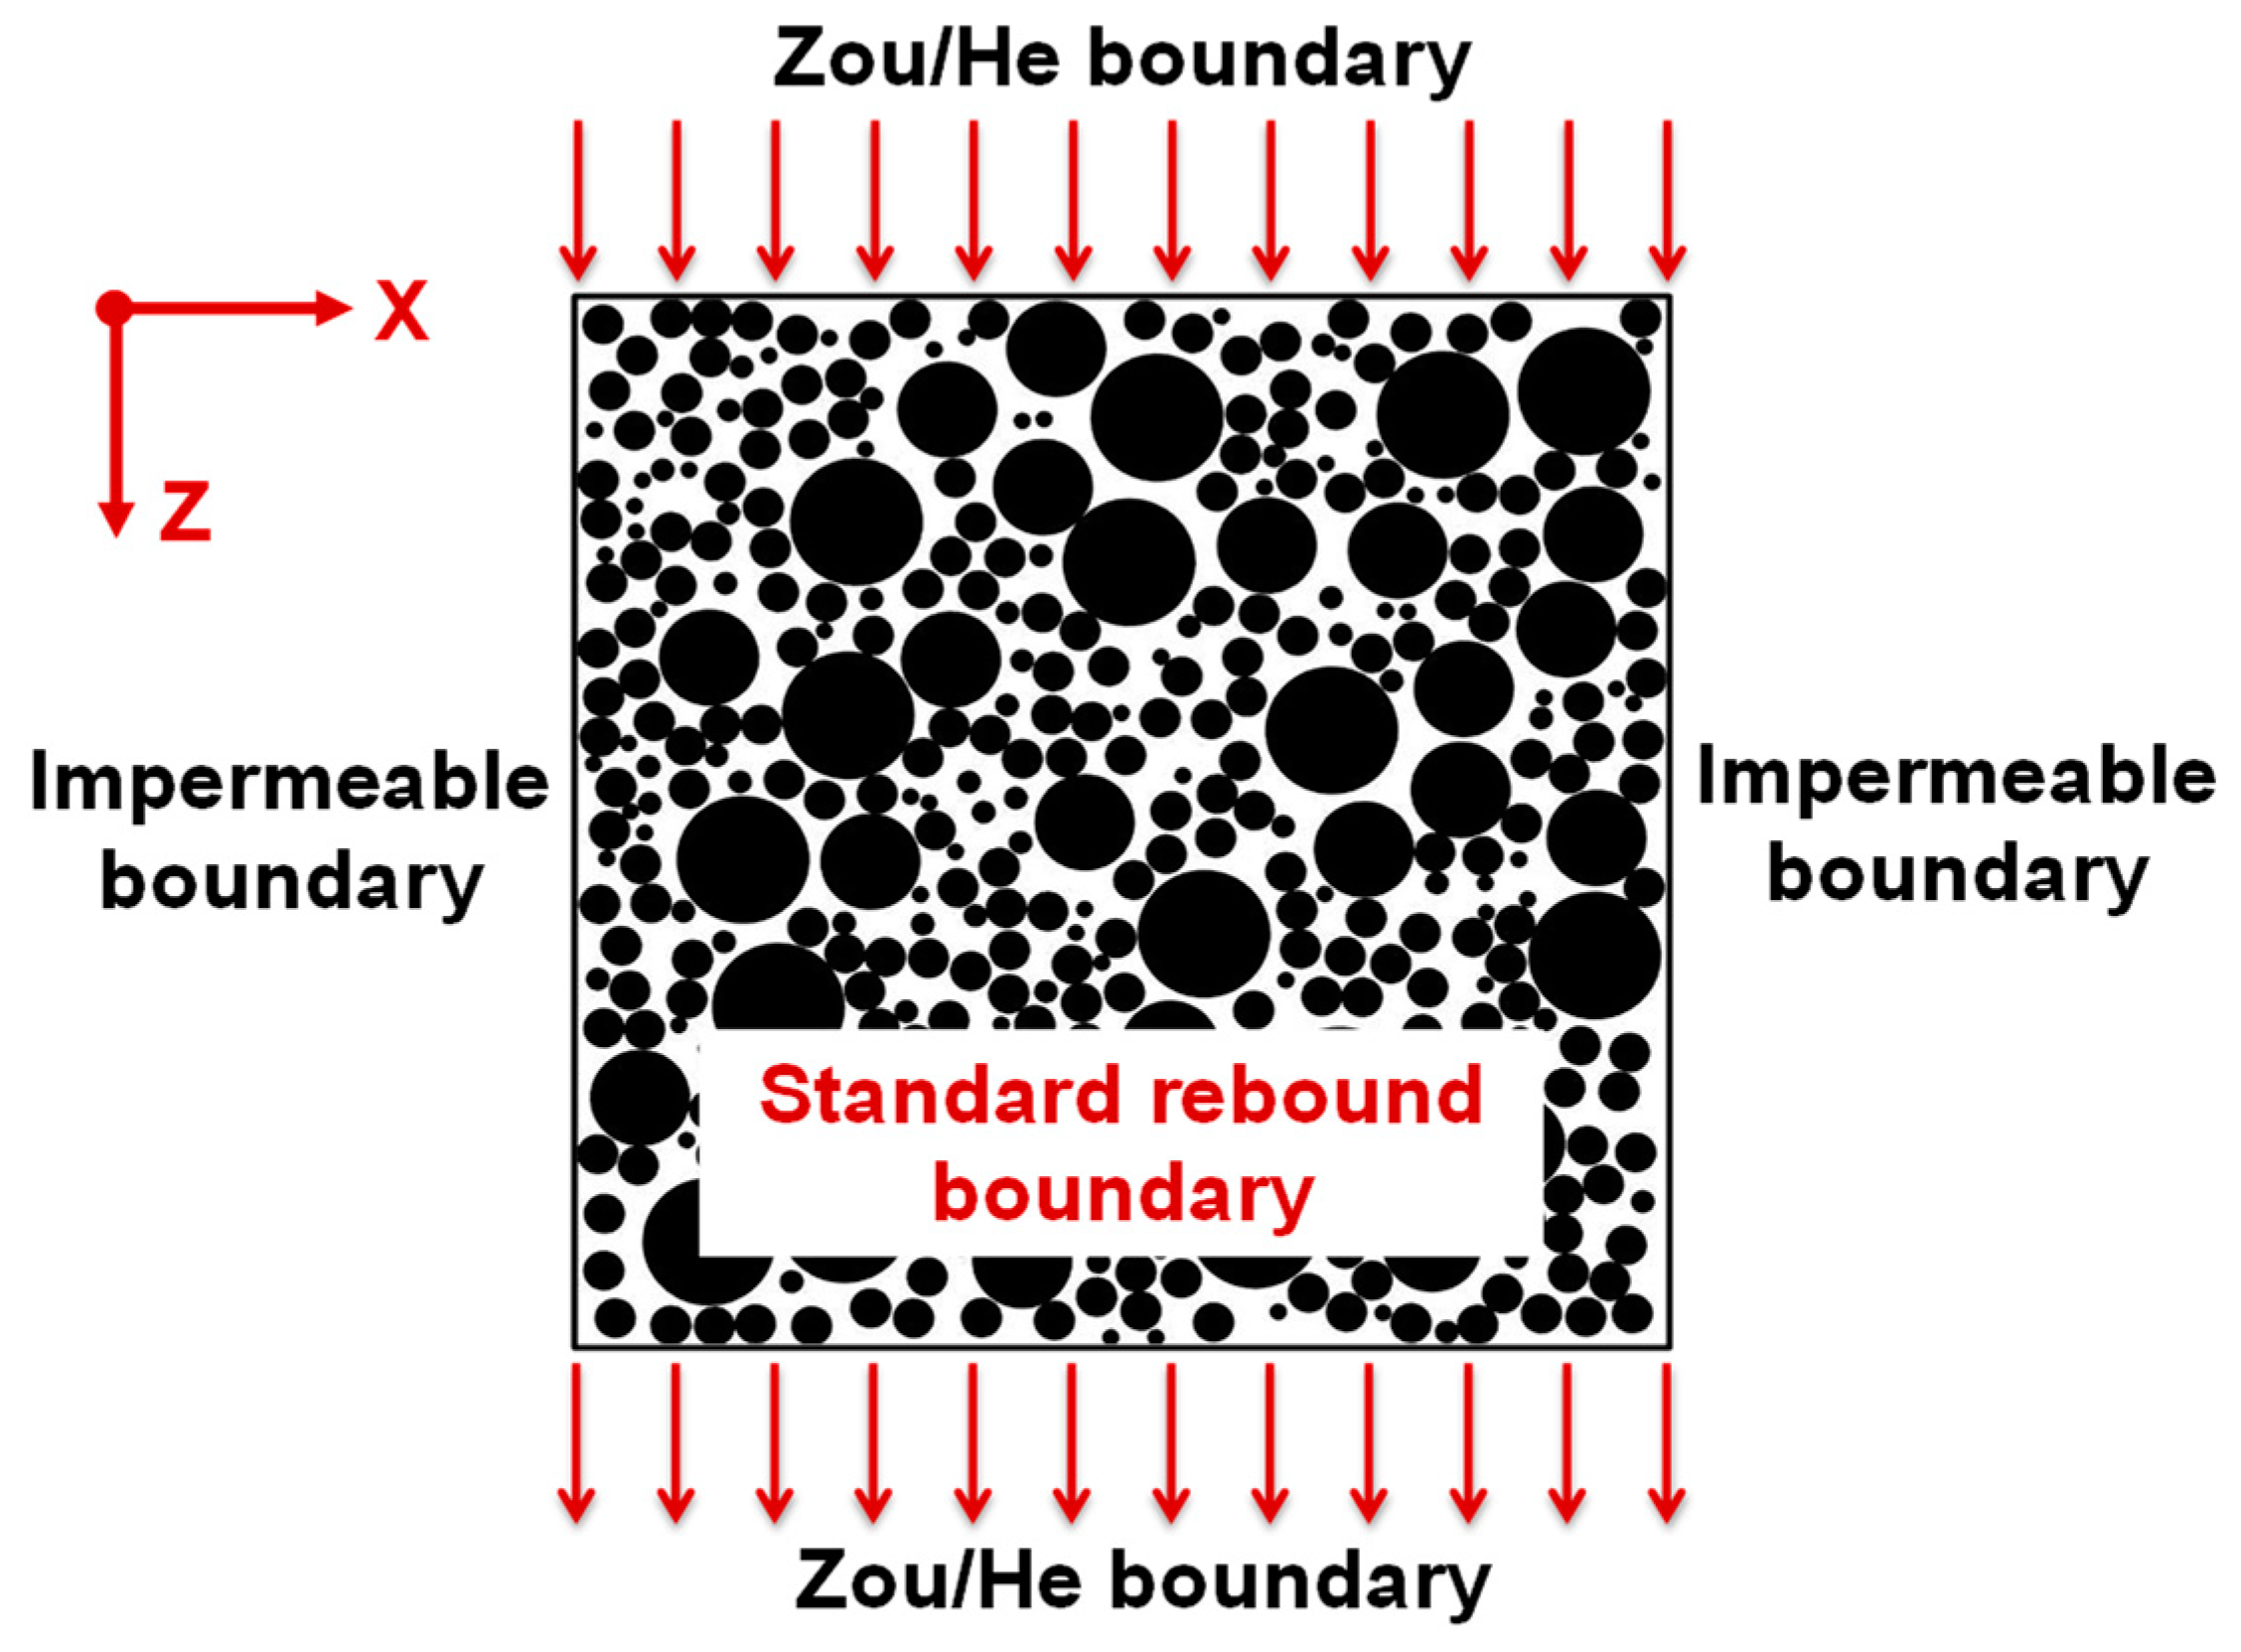
2.2.1. Lattice Boltzmann Theory and Boundary Conditions

In general, the discrete Boltzmann equation for F(ω,t) can be solved using the lattice Boltzmann method (LBM) to derive the Navier–Stokes (N–S) equation [16], which can then be used to simulate the laws of fluid flow from the mesoscale. The most commonly used BGK-LBM model [17,18,19], which can be represented by discrete LBE, is used in this paper:
F α ( ω + e α δ t , t + δ t ) = F α ( ω , t ) F α ( ω , t ) F α eq ( ω , t ) τ
where F(ω,t) is the particle distribution function along α at lattice point ω at moment t; eα is the discrete velocity; δt is the discrete time; τ is the dimensionless relaxation time; F α eq ( ω , t ) is the local equilibrium state distribution function in the discrete velocity space.
The classical D2Q9 model is used in the LBM discrete velocity model [17,18]. The model is depicted in Figure 2, and the following parameters describe its equilibrium distribution function:
F α eq = ρ ω α [ 1 + e α u c s 2 + ( e α u ) 2 2 c s 4 u 2 2 c s 2 ]
ω α = { 4 9 ,   α = 0 1 9 ,   α = 1 , 2 , 3 , 4 1 36 ,   α = 5 , 6 , 7 , 8
where ρ is the density; ωα is the weight coefficient; u is the macroscopic velocity; cs is the sound velocities in lattice units, cs2 takes the value of c2/3, and c is the lattice velocity.
The N–S equation in hydrodynamics that correspond to the fundamental LBE model was derived using the Chapman–Enskog expansion [16]. The relationship between the macroscopic density ρ, pressure p, velocity u, and kinematic viscosity coefficient of fluid υ and the dimensionless relaxation time τ of the model is given by:
ρ = α = 0 8 F α
p = ρ c s 2
u = 1 ρ α = 0 8 F α e α
υ = c s 2 ( τ 1 2 ) δ t
The Mach number (Ma) of the fluid flow must be low enough [19,25] to guarantee that the numerical solution of the LBM converges to the N-S equation for an incompressible fluid, and it should typically satisfy Ma < 0.1, which is defined as:
M a = u max c
where umax is the highest possible fluid flow rate.
In addition, LBM fluid flows along the Z-direction of the SRM in the study. The inlet and outlet pressure boundary and the fluid–solid boundary are addressed, respectively, using the Zou/He boundary [16] and standard rebound format [18]. In Figure 3, the precise settings are displayed. The model must be binarized (0–1) before boundary processing to identify and pinpoint the fluid and solid region (the region with pixel value 0 is the fluid domain, while the region with pixel value 1 is the solid domain).

2.2.2. Conversion of Lattice Unit and Physical Unit

The LBM unit conversion part is described with reference to the method in Succi [26]. Basic parameters in the model (lattice unit) are length l, density ρ, time t, pressure p, and kinematic viscosity coefficient υ. Corresponding parameters of the model (physical unit) are length l′, density ρ′, time t′, pressure p′ and kinematic viscosity coefficient is υ′. In order to realize the conversion between the above two parameters, it is necessary to introduce some reference quantities [16]: reference length lr, reference density ρr, and reference velocity ur, which are defined as:
l r = l l
ρ r = ρ ρ
u r = c s c s
where cs′ and cs are the sound velocities in physical units and lattice units, respectively.
For a specific problem, the l, ρ, cs, and υ are known. The actual physical quantity can also be obtained through the relevant equation. Therefore, ρr and ur can be determined, but l′ and lr cannot. In view of this, the following relationship is added:
l r u r = υ υ
In addition, the conversion between t, p, and t′, p′ can be solved based on the following equations:
l r u r = t t = t r
p = p t r 2 l r 2 ρ r
So far, the conversion between the grid and the actual physical unit is completed [16]. Generally, the following equations are suitable: δx = δy = 1, δt = 1, and cs2 = 1/3, and converted to physical units.
δ x = δ y = l r
δ t = l r u r
c s = u r 3

2.2.3. Soil/Rock Particle Size Threshold

The soil/rock threshold can be comprehensively determined by using the following equation, which is in accordance with the research findings of Xu and Medley et al. [12,27] on the threshold of soil/rock particle size in the SRM, and combined with the particle generation and distribution characteristics of the SRM model in this paper.
D S R T = 0.05 L p
where DSRT is the soil particle size threshold value, and Lp is the engineering feature size of the SRM, with the engineering feature size for the plane study area being equal to the arithmetic square root of the study area’s dimensions. So, Lp = 100 × 100 = 100   m m .
In this study, SRM–1, SRM–2, and SRM–3 were used, and their respective rock contents were 67.69%, 61.07%, and 52.96%. Wherein the rock content Cr is determined by dividing the total area of soil and rock in the SRM model by the area of rock.

2.2.4. Size Feature Parameters

In order to study the influence of the size effect on the seepage characteristics in the SRM model, this paper sets four size feature parameters: model resolution R, model feature size S, feature length ratio F, and soil/rock particle size feature ratio P.
(1)
Model resolution (R) is the term used to describe the amount of data stored in a model image, which is typically expressed as the pixel density per inch (ppi) [28]. The output quality of an image is determined by resolution. The size of the model is determined by the image resolution and image size combined. The more significant the value, the more precise the model and image are.
(2)
Model feature size (S) is defined as the arithmetic square root of the product of the numerical model’s length l and width b. S represents the average length of the numerical model size.
S = l b
(3)
The feature length ratio (F), which is defined as the ratio of the rock feature particle size ( D r = D r 1 D r 2 · · · D r m , D r m refers to the particle size of the m-th type of rock in the SRM) to S, characterizes the relationship between the rock particle size and the model size in the SRM model.
F = D r S
(4)
The soil/rock particle size feature ratio (P), which is defined as the ratio of the soil feature particle size ( D s = D s 1 D s 2 · · · D s m , D s m refers to the particle size of the m-th type of soil in the SRM) to Dr, characterizes the relationship between the soil/rock particle size feature in the SRM model.
P = D s D r

2.2.5. Permeability Calculation Theory

The penetrating quality of the SRM is generally described by the permeability, which can be calculated using Darcy’s law (Equation (23)) and the LBM seepage field simulation. It should be noted that a laminar flow state is required for Darcy’s law to hold. By examining whether the permeability of the SRM remains constant under a range of pressure differences, it can be determined whether the SRM is in a laminar flow state and can satisfy the requirements of Ma < 0.1 and laminar flow when the pressure difference Δp is less than 0.01 m.u.·l.u.−1·t.s.−2 (3.67 × 10⁻² Pa).
k = μ u ¯ Δ p = ρ υ u ¯ l Δ p
where k is the permeability; μ is the dynamic viscosity coefficient of the fluid; u is the average flow velocity; Δp is the seepage pressure difference; l is the length of seepage path.
The LBM calculation stops when the fluid reaches a stable state. The criterion for determining the stable state is that the standard deviation of the kinetic energy in the entire calculation domain within a certain number of time steps is less than 0.01% of the average kinetic energy [19]. Following the convergence of the calculation, Darcy’s law can be used to determine the model’s permeability.

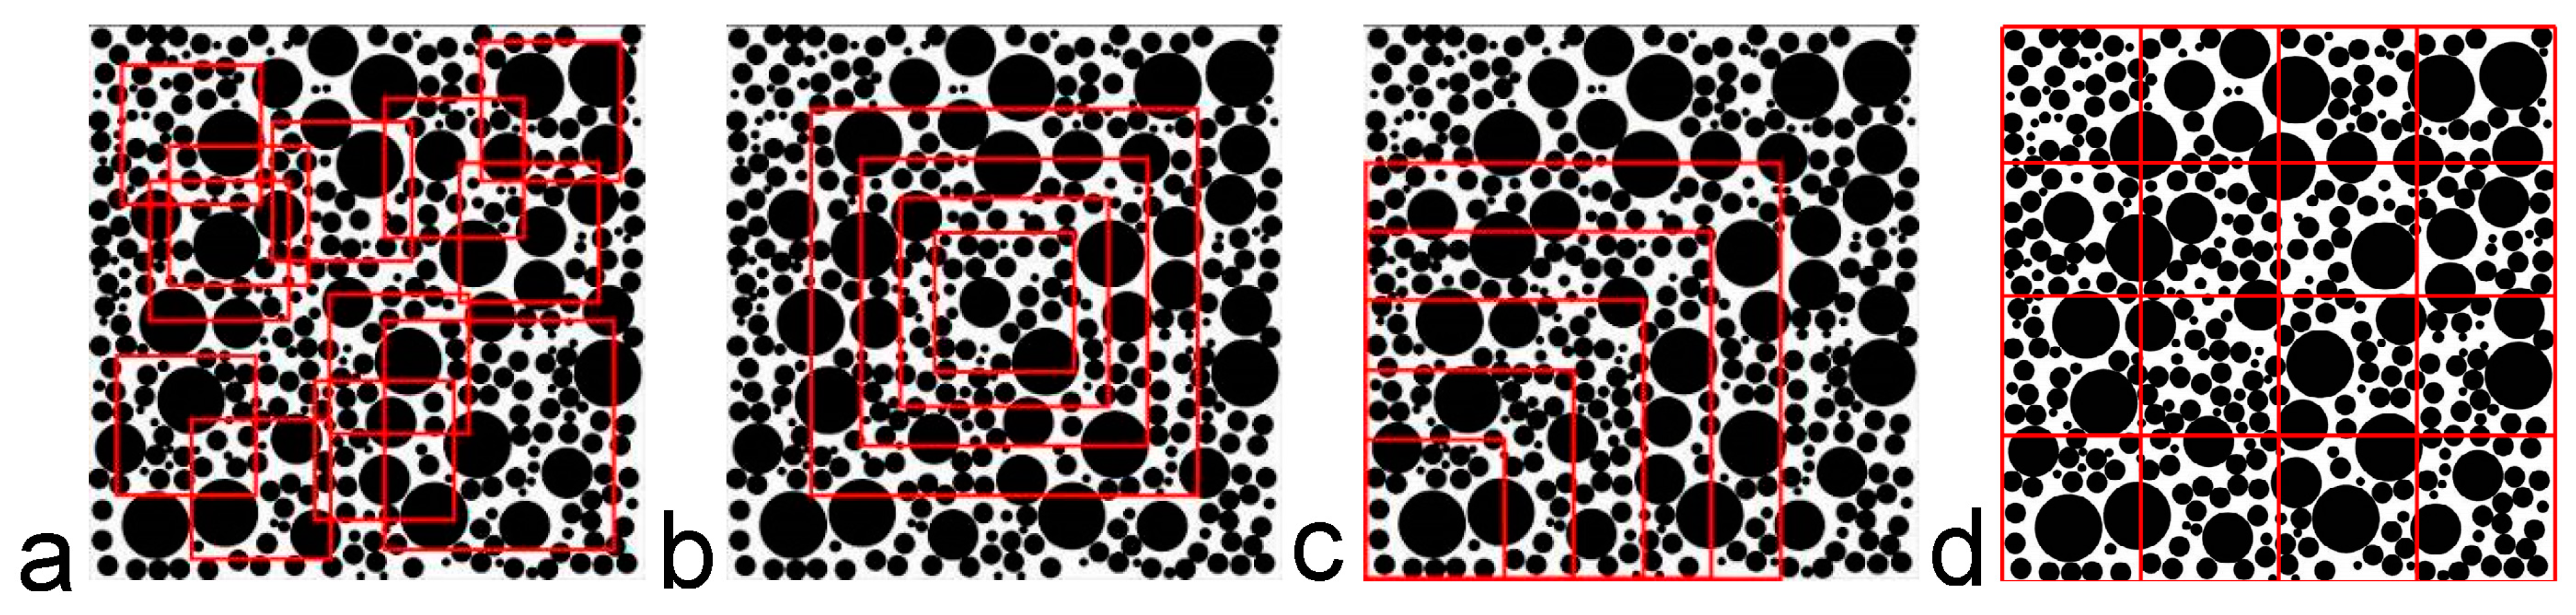
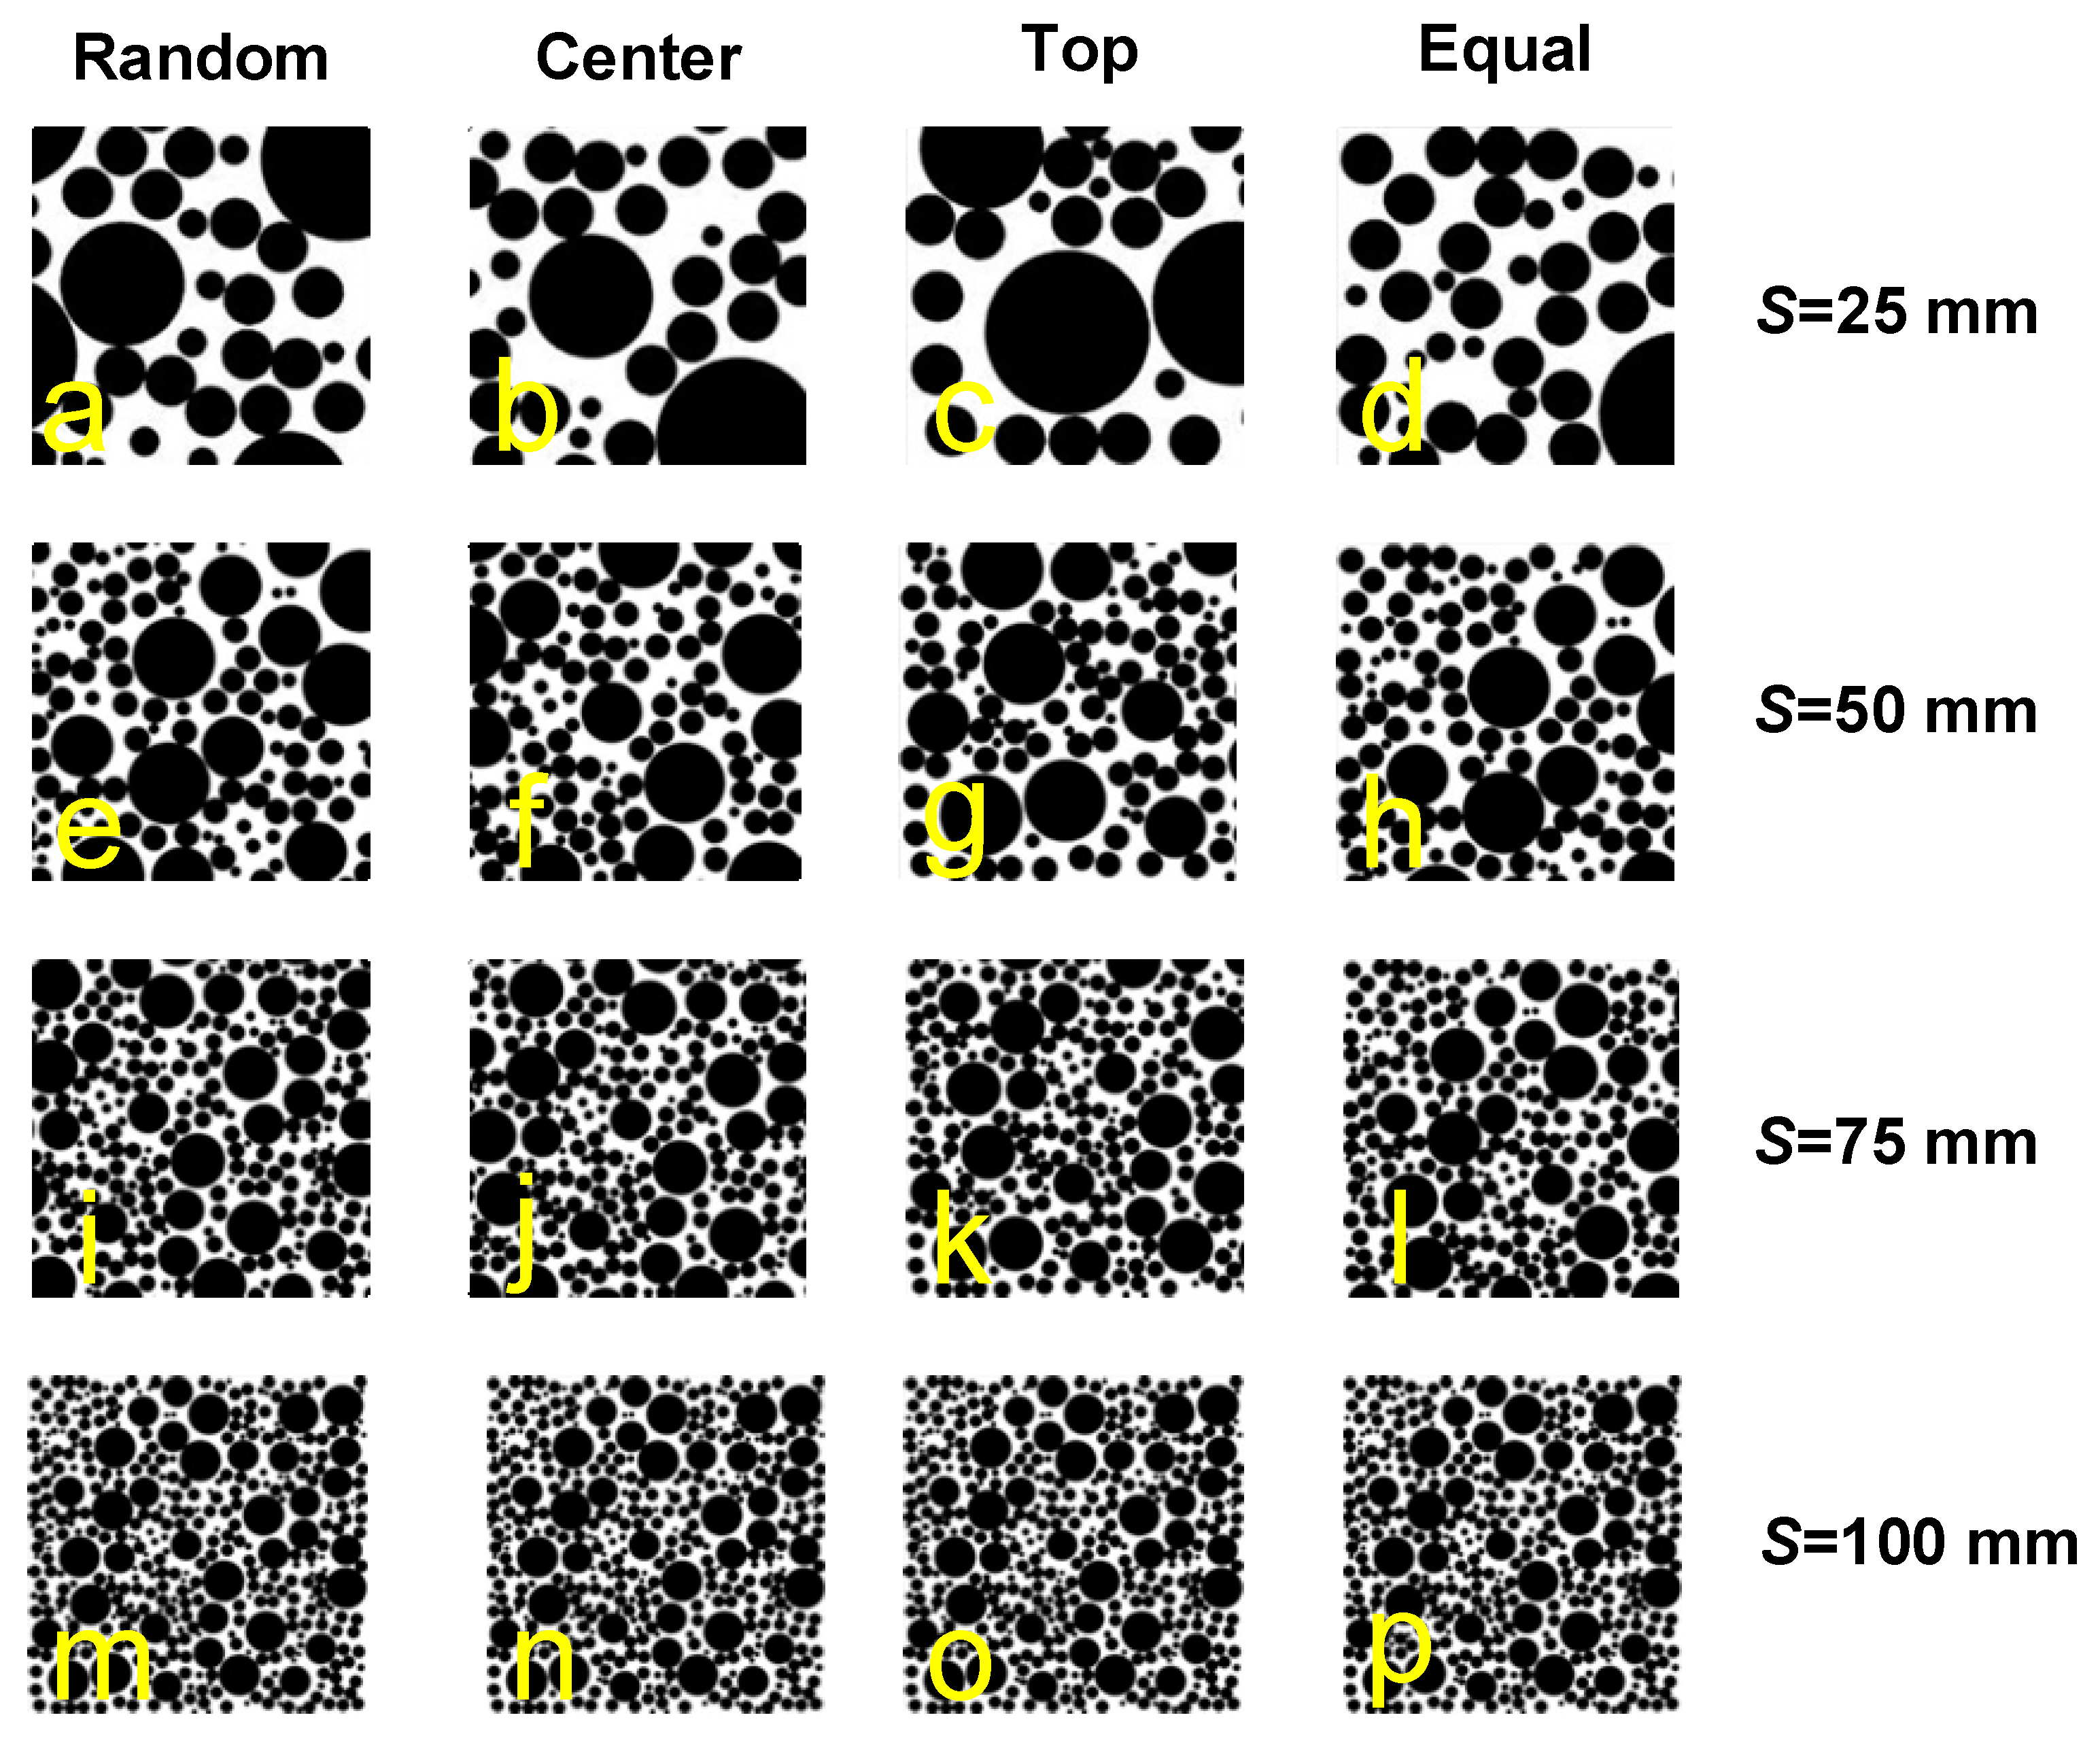
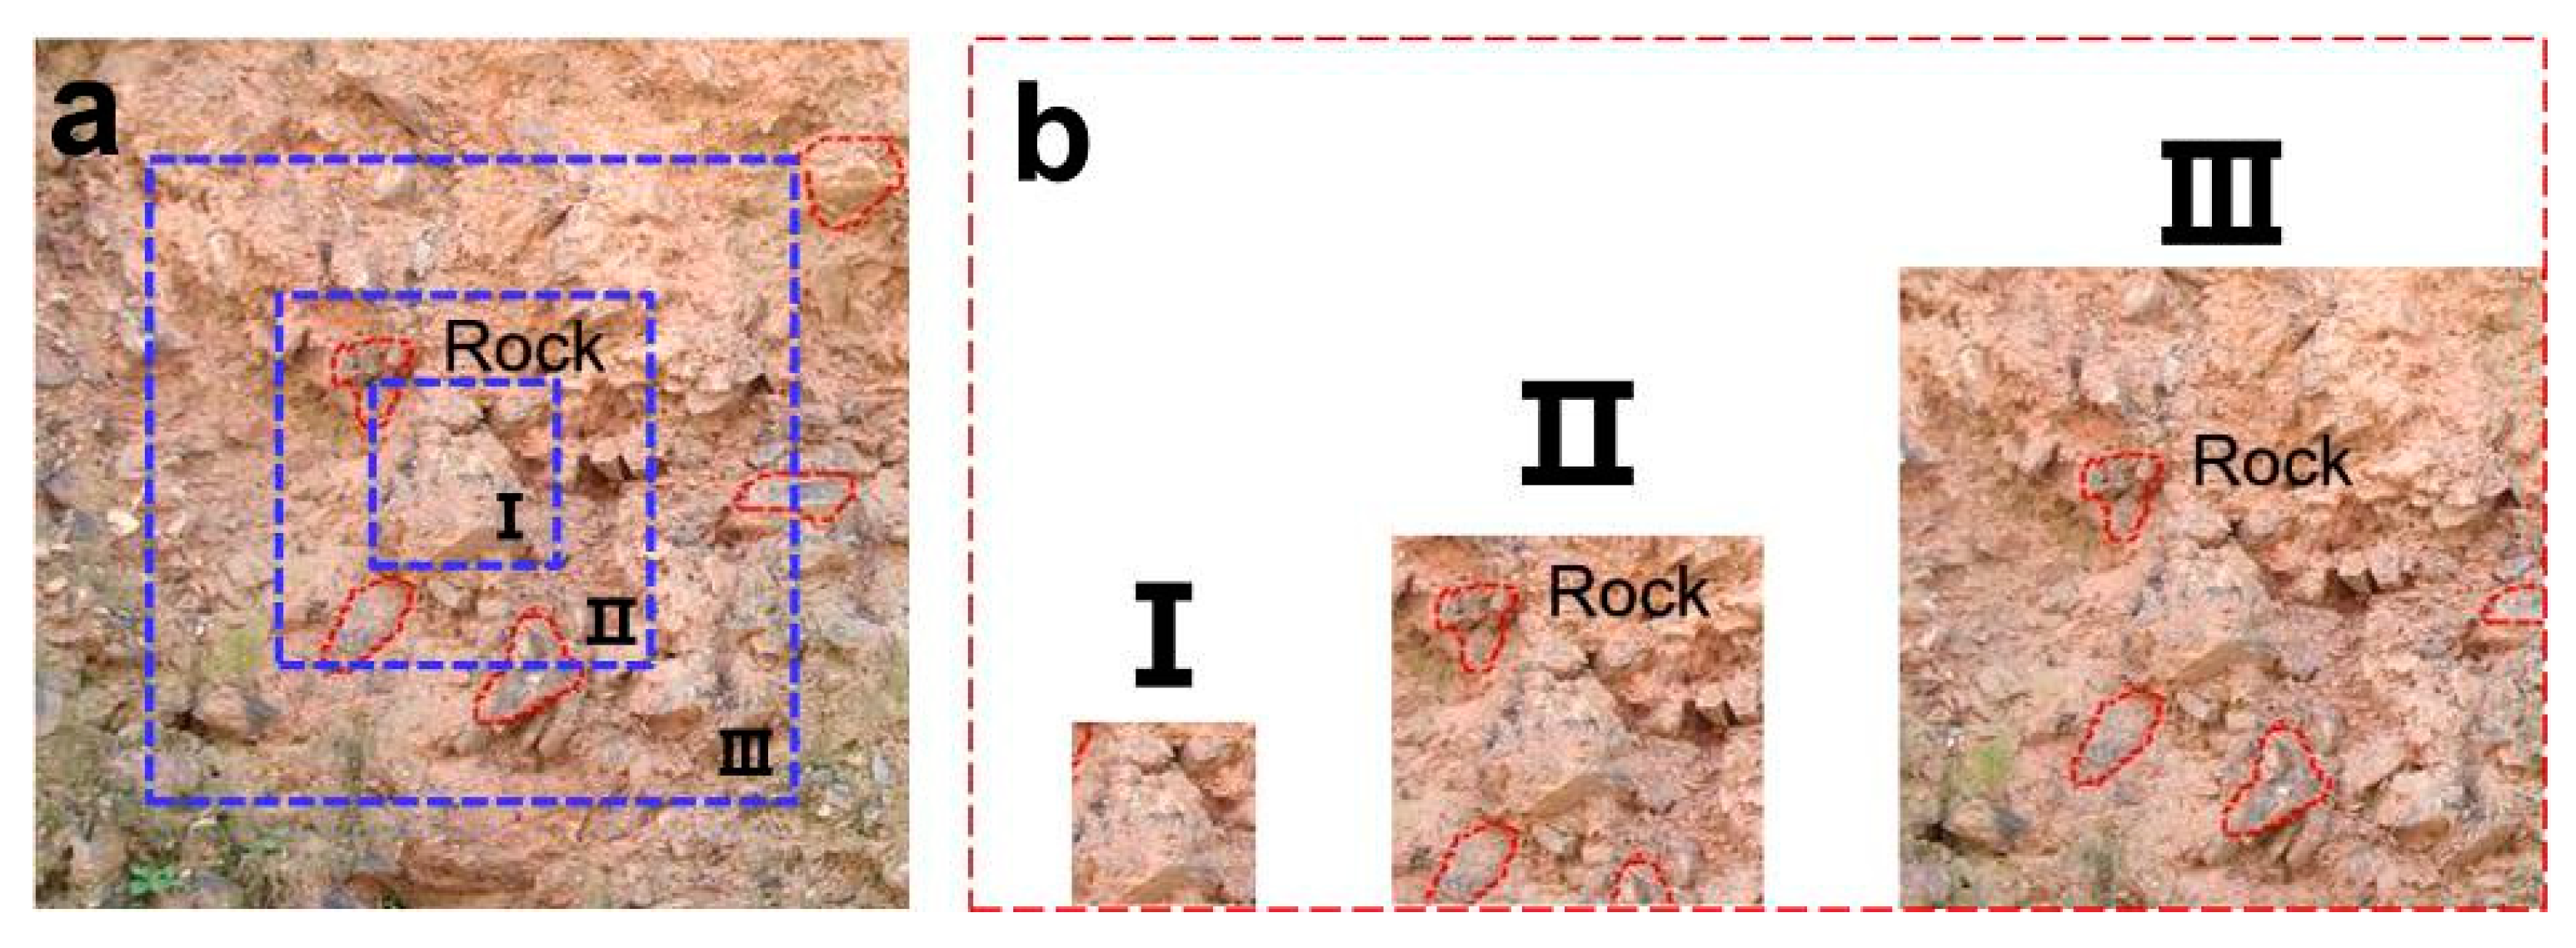
2.3. Model Size Segmentation

A number of small size model samples are taken directly from the large size samples to ensure consistency in sampling. In addition, taking into account the possibility of contingency in the selection of the SRM model, this paper uses four segmentation types, namely random, center, top, and equal segmentation, to segment the SRM model [9], as shown in Figure 4. Table 1 contains a list of the specific segmentation scheme for the various SRM models used in the research that follows. The segmented SRM sample’s seepage field is then calculated to investigate the influence of sample size on the permeability of the SRM. The dispersion of permeability under various test conditions is reflected in this paper using the coefficient of variation (cv). The cv is equal to the ratio of the standard deviation to the average value, which better illustrates the dispersion of the data compared to the standard deviation.

3. Results

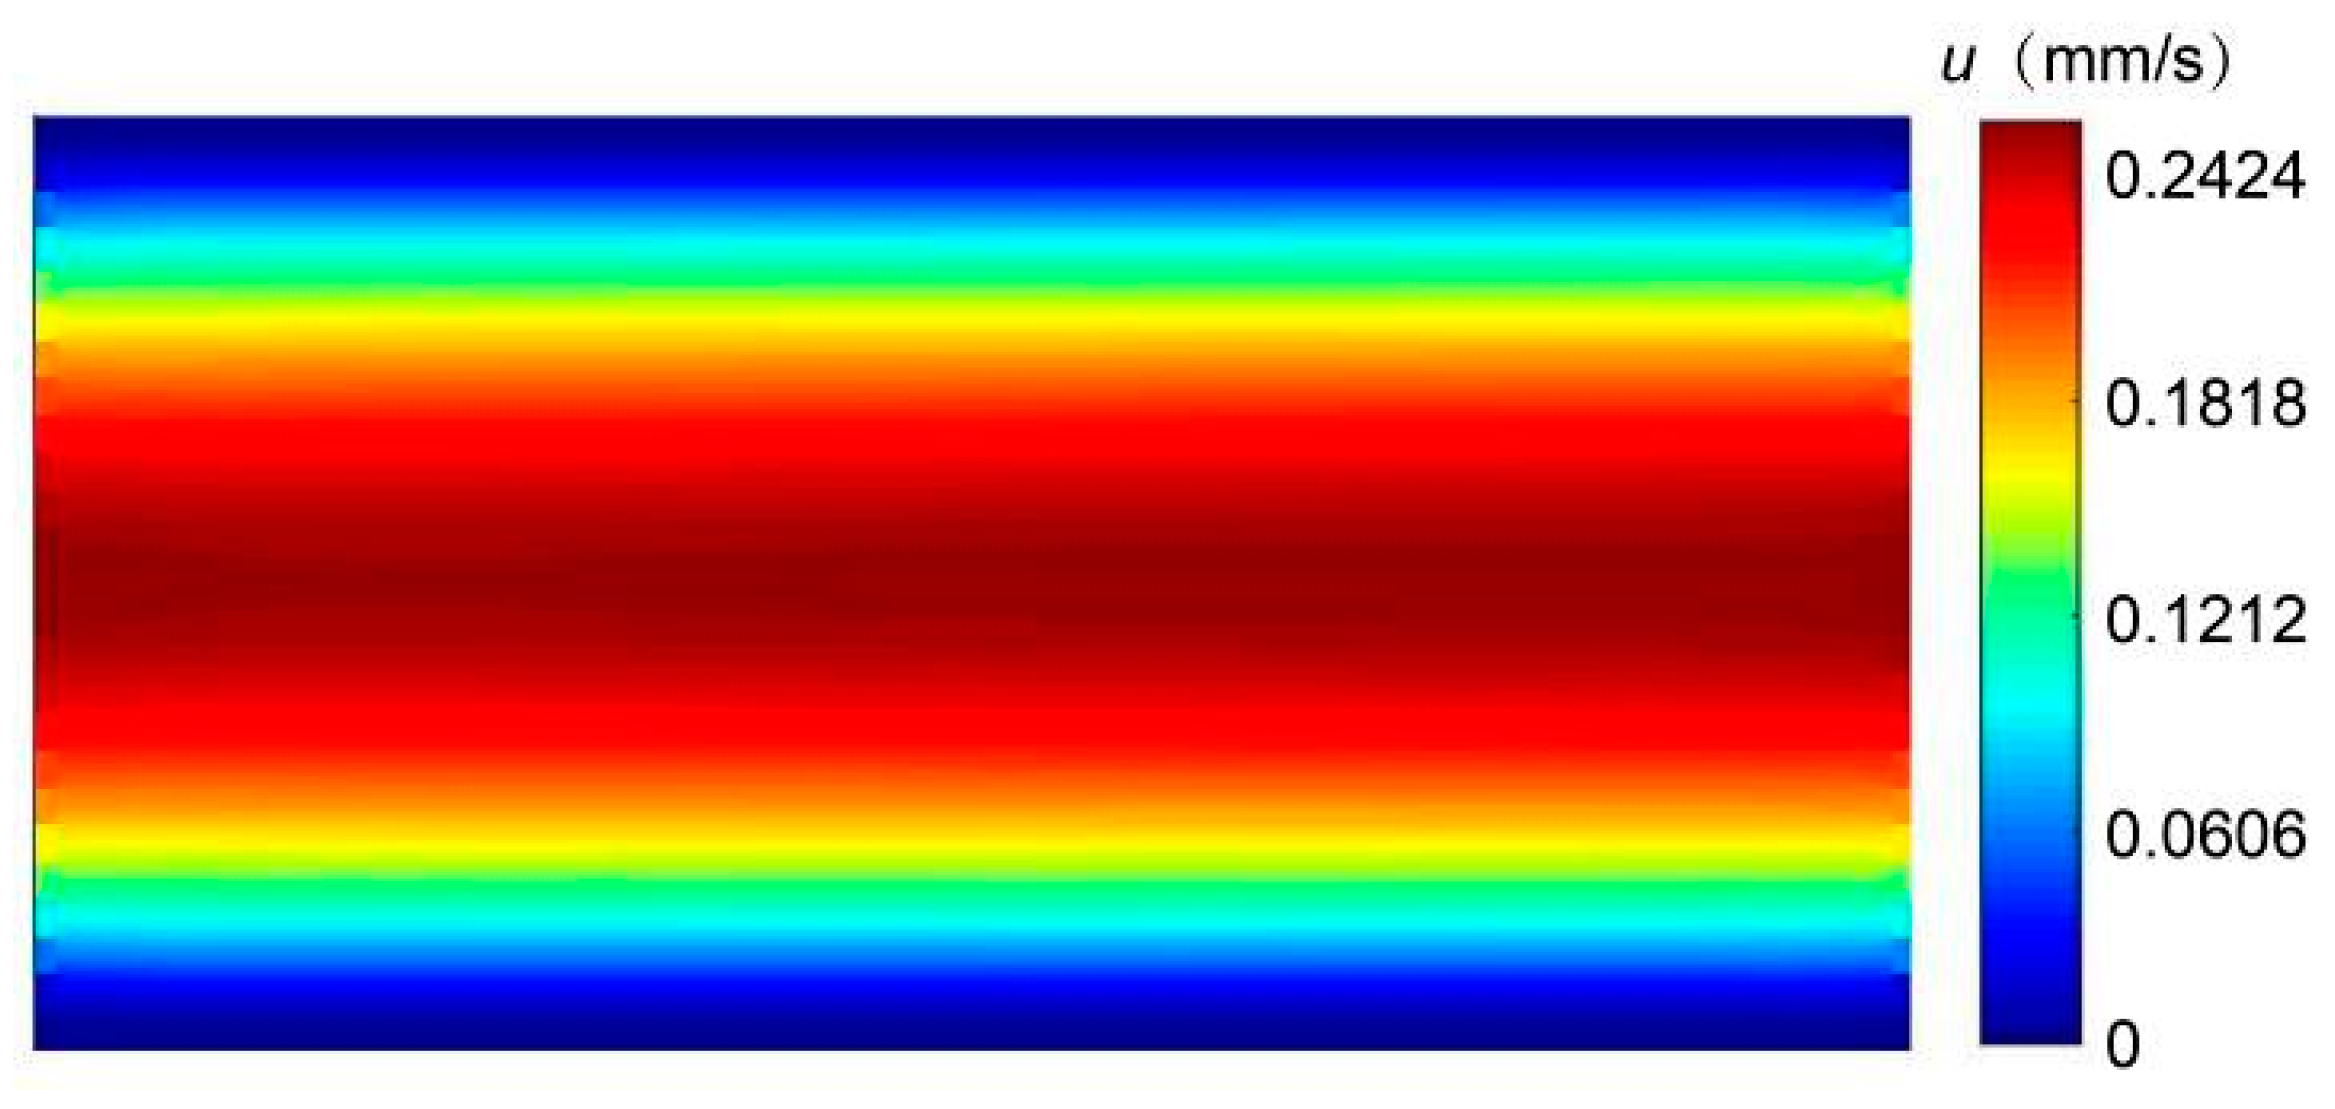
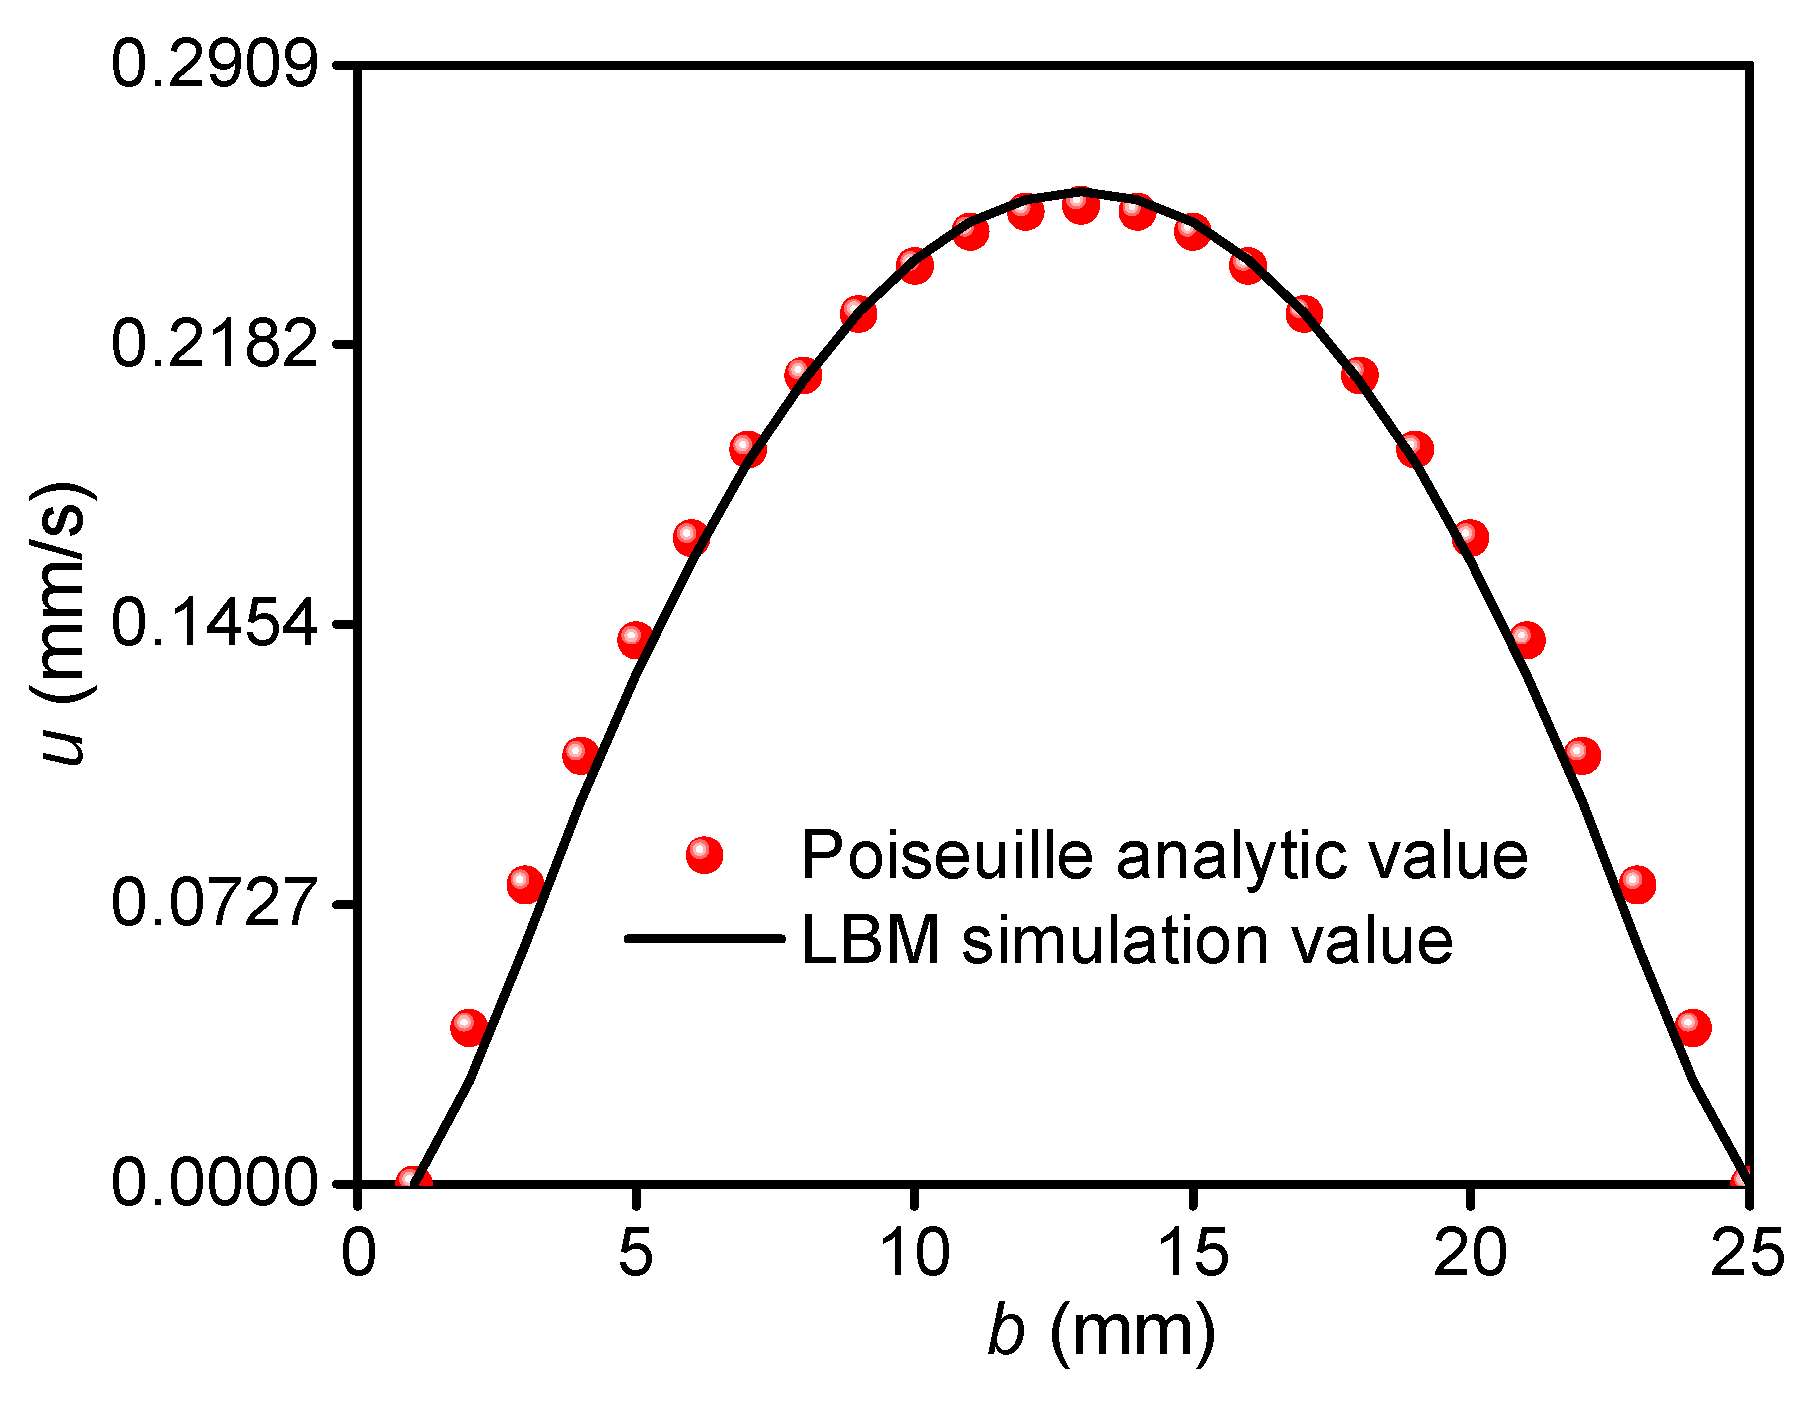
3.1. Numerical Model Validation

The self-programmed LBM program is validated using the classical Poiseuille flow [17,18], and the validation computational model area is chosen as a grid of 50 × 25 mm (500 × 250 l.u.) with the same boundary treatment as described in Section 2.2.1. Table 2 displays the specific computational parameters, where l and b are the length and width of the computational model, and Δp is the pressure difference between the inlet and outlet of the fluid.
The surface cloud of the velocity field calculated by the Poiseuille flow model using the LBM program is shown in Figure 5, and it is clear that the velocity decreases gradually from the middle to the two ends. The comparison results of the velocity of each grid point in the middle cross–section with the Poiseuille flow analytical value are shown in Figure 6. The highest error is merely 4.33%, demonstrating the precision of the self-programmed technique.

3.2. Influence of Size Effect on Permeability
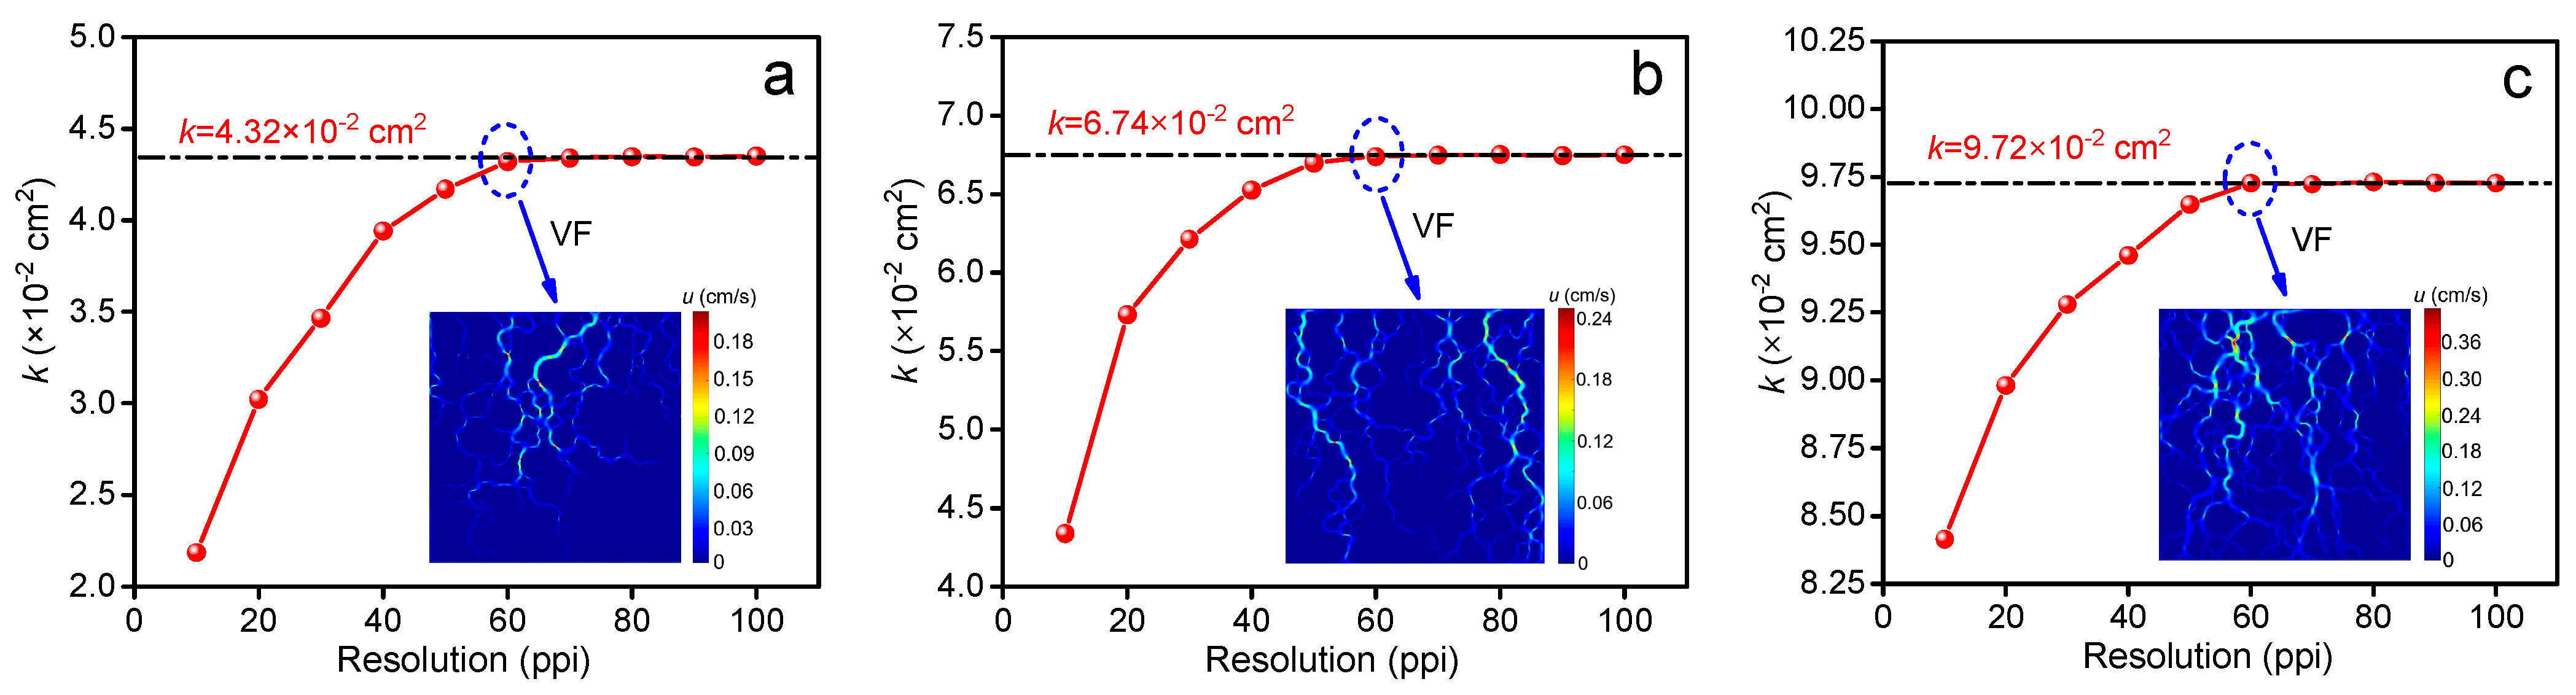
The seepage direction is set to follow the Z-direction of the SRM, and the flow is set to drive the model at a constant temperature (T = 20 °C) and pressure difference (Δp = 3.67 × 10⁻² Pa) to make the seepage simulation results more realistic. The specific boundary conditions used in the calculation model are shown in Figure 3. The additional pertinent settings and calculation criteria for the validation example given above apply here as well (Table 2). Additionally, refer to Section 2.3 and choose the typical dimensions of models between 10 and 100 mm (grid unit: 100–1000 l.u.) to simulate various SRM models. There are 342 different simulation test conditions in total (Table 1).

3.2.1. Resolution R

Model resolution significantly affects the efficacy and accuracy of the results of the permeability calculation in the LBM seepage field simulation [28,29]. SRM–1, SRM–2, and SRM–3 models created in Section 2.1 are imported into LBM for calculation to examine the influence of model resolution on permeability. The permeability of SRM samples with various resolutions is simulated under the same boundary conditions and pressure difference, with a total of 30 simulation test conditions (Table 1). The simulation results are displayed in Figure 7.
The permeability of the three models exhibits a trend in gradual improvement with the resolution and tends to be stable when the resolution reaches 60 ppi, as can be seen in Figure 7. Permeability dispersion degree cv values at this time are 0.00236, 0.00061, and 0.00028, respectively. Additionally, it is discovered that the porosity and rock content of the model has little bearing on the relationship between resolution and permeability (SRM–1, n = 0.3642, Cr = 67.69%; SRM–2, n = 0.4008, Cr = 61.07%; SRM–3, n = 0.5060, Cr = 52.96%) by comparing the velocity field cloud map (velocity field, VF) of the three models with a resolution of 60 ppi. The velocity field distribution in the models with various porosity and rock content exhibits a steady–state effect when the model resolution is 60 ppi. To guarantee the precision and effectiveness of the LBM permeability calculation, the resolution of the model sample is set to 60 ppi in the subsequent simulation reported in this paper.

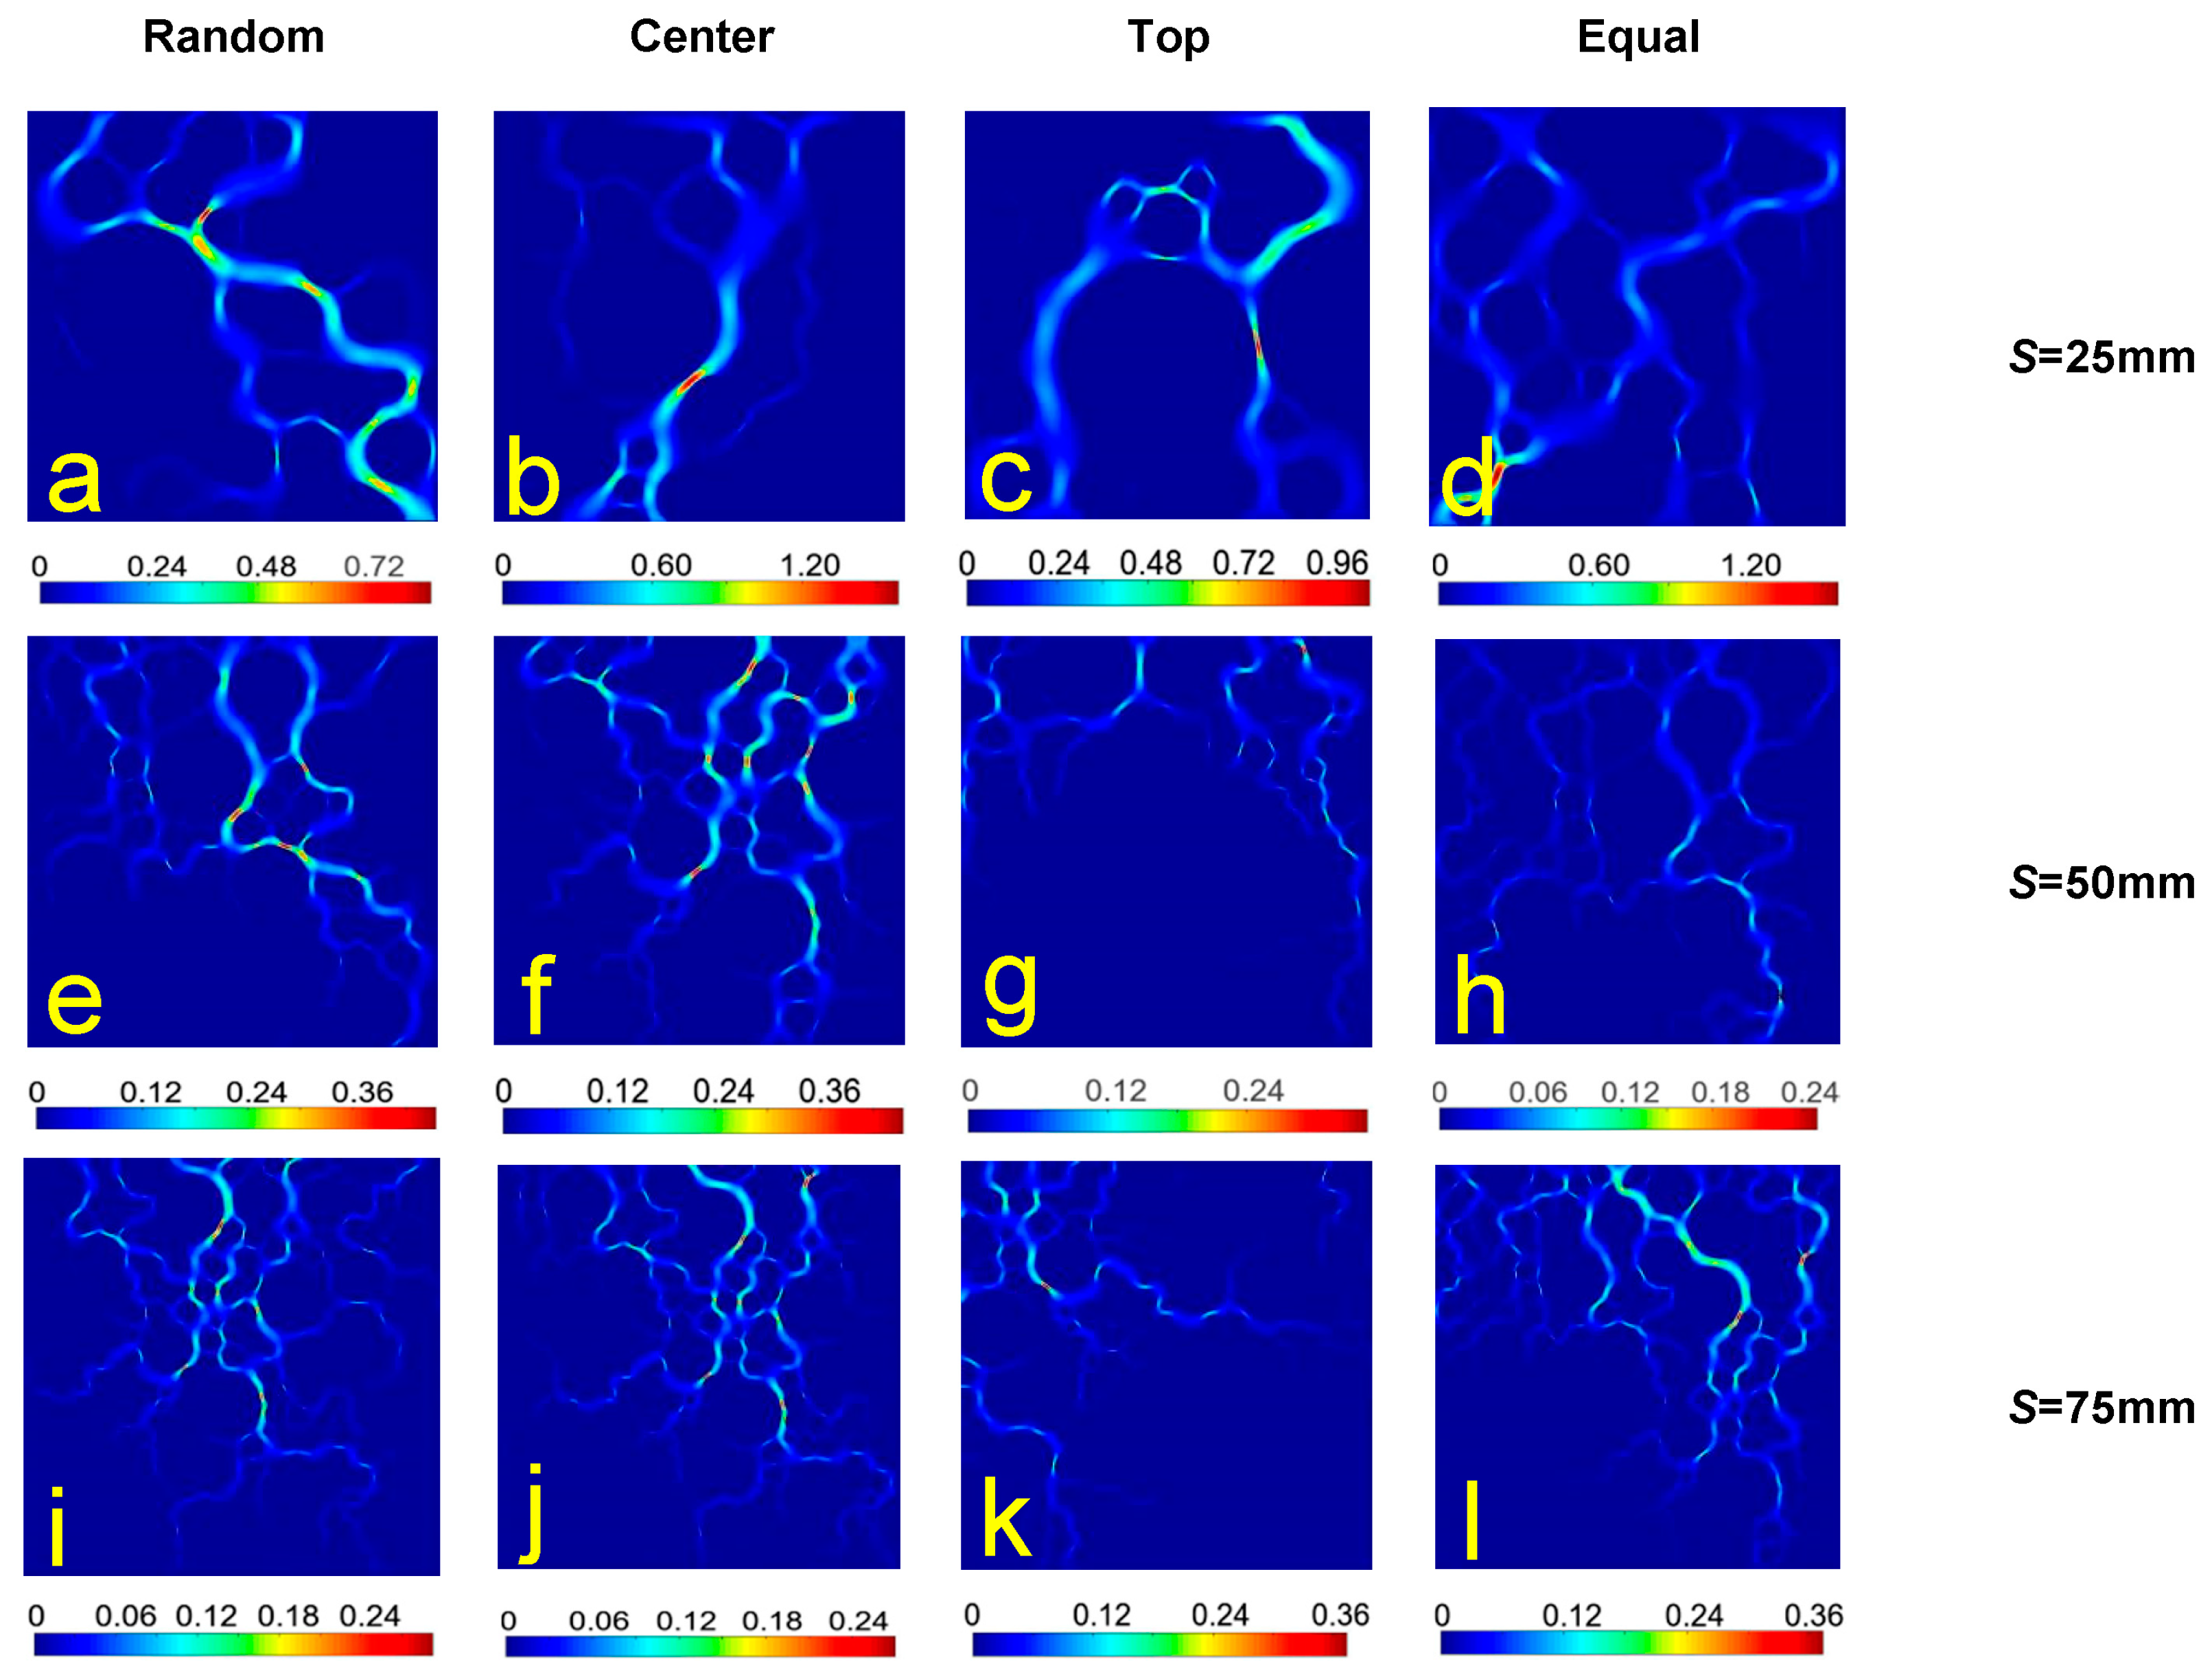
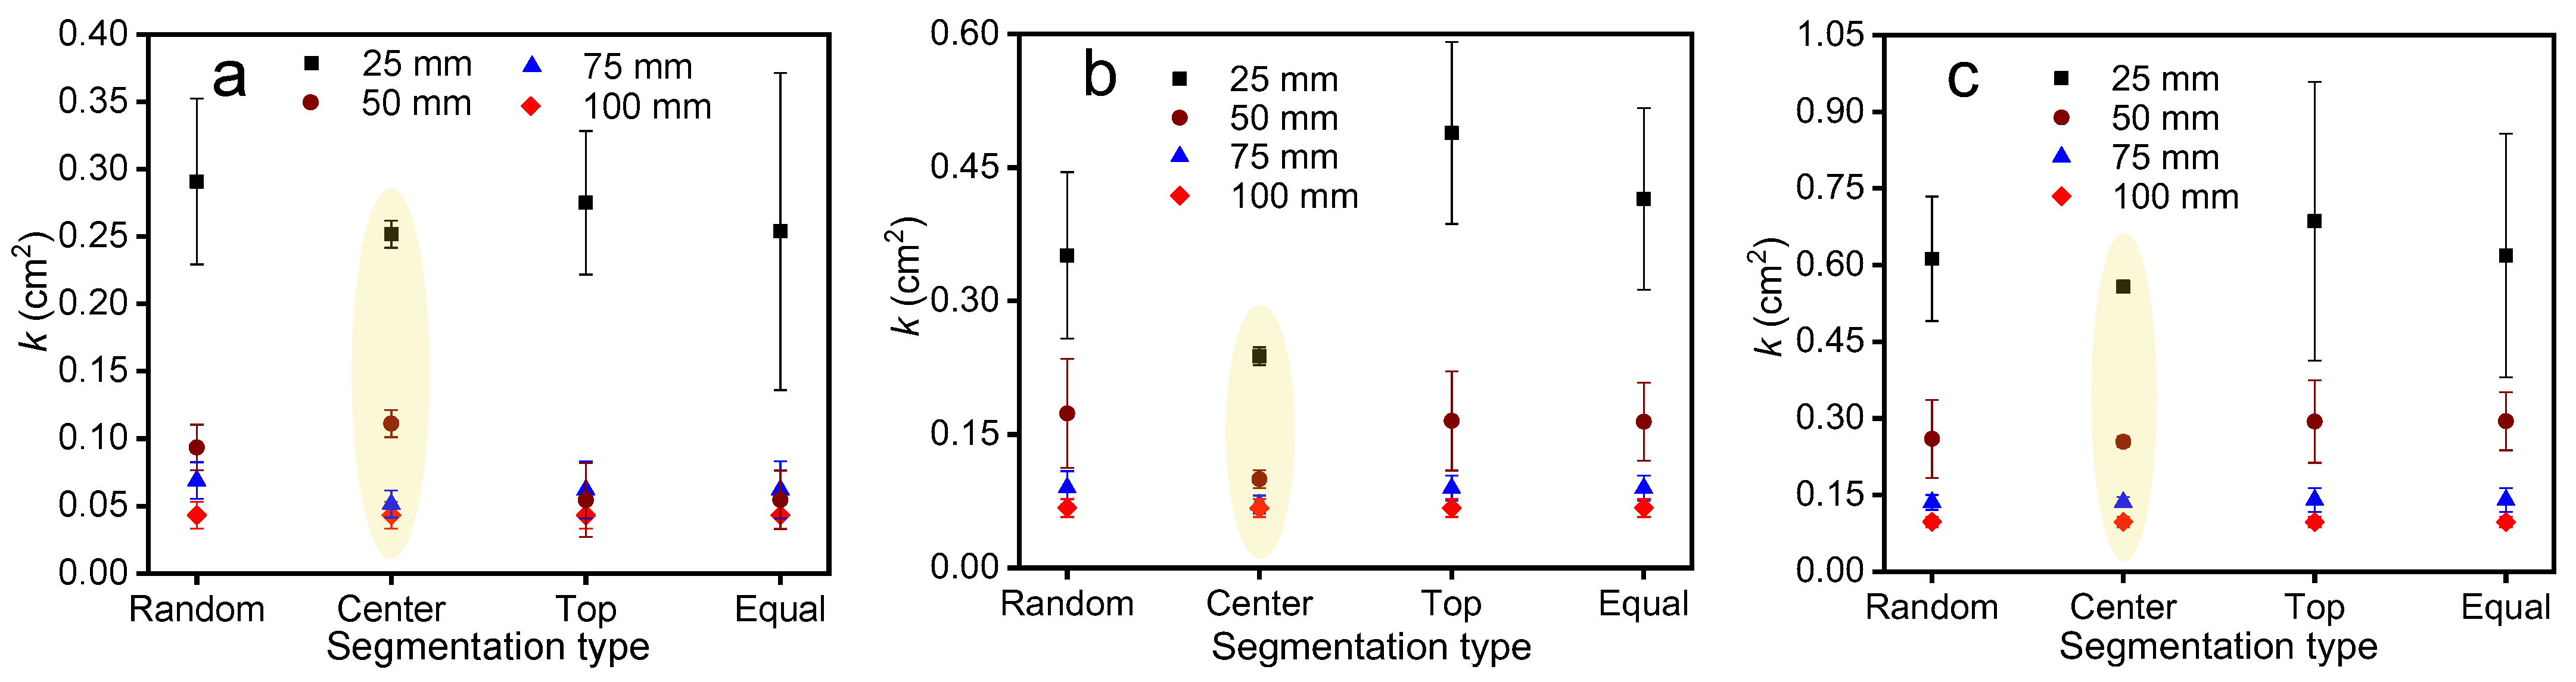
3.2.2. Segmentation Type

The SRM models are created with feature sizes S = 25, 50, 75, and 100 mm using the four segmentation types described in Section 2.3 (random, center, top, and equal segmentation), with a total of 225 simulation test conditions (Table 1). The particular simulation test conditions of the model for each S are as follows. The number of random segmentation modes is 16, 8, 4, and 1. The number of center segmentation modes is 1, 1, 1, and 1. The number of top segmentation modes is 4, 4, 4, and 1. The number of equal segmentation modes is 16, 8, 4, and 1. Among them, “number” refers to obtaining simulated test models of S based on a certain segmentation type in SRM–1 for simulation, and selecting one of them as a typical representative model for display, as shown in Figure 8. Figure 9 and Figure 10 show the distribution of the typical seepage velocity field under various segmentation types using SRM–1 as an example (the segmentation type is the same when the model feature size S = 100 mm, so it is not shown), and Figure 10 uses the average permeability value under the same S to show the dispersion degree under various segmentation types.
Figure 9 shows that the segmentation type has a greater impact on the permeability of the SRM with the same S. The random segmentation type and the center segmentation type have a more uniform seepage velocity field distribution than the top segmentation type and the equal segmentation type. The reason for this is that the models obtained by the top and equal segmentation type are mostly soil/rock particles in the SRM–1 model’s corner area. The probability of disconnected channels appearing in the corresponding segmentation model is higher, which also leads to a large dispersion of the permeability of the model intercepted by the top segmentation and equal segmentation types. This can also be indicated by the flow velocity cloud map in Figure 9.
Furthermore, the dispersion degree of model permeability obtained by the four segmentation types under the same S is in order: center < random < equal < top (using SRM–1, S = 50 mm as an example, cv-R = 0.1684, cv-C = 0, cv-T = 0.4365, and cv-E = 0.3729), which is consistent with other relevant research conclusions [10]. Although the random segmentation type has good stability under certain conditions and is used by many researchers, it inevitably has great uncertainty and requires a large number of model data as support to produce the most stable and accurate permeability results. Additionally, when compared to the central segmentation type, it requires a significant amount of time and computing memory. According to Figure 9 and Figure 10, the model’s permeability exhibits a high degree of anisotropism as the model feature size increases under the same segmentation type, with the permeability results obtained by the top and equal segmentation types being particularly significant.

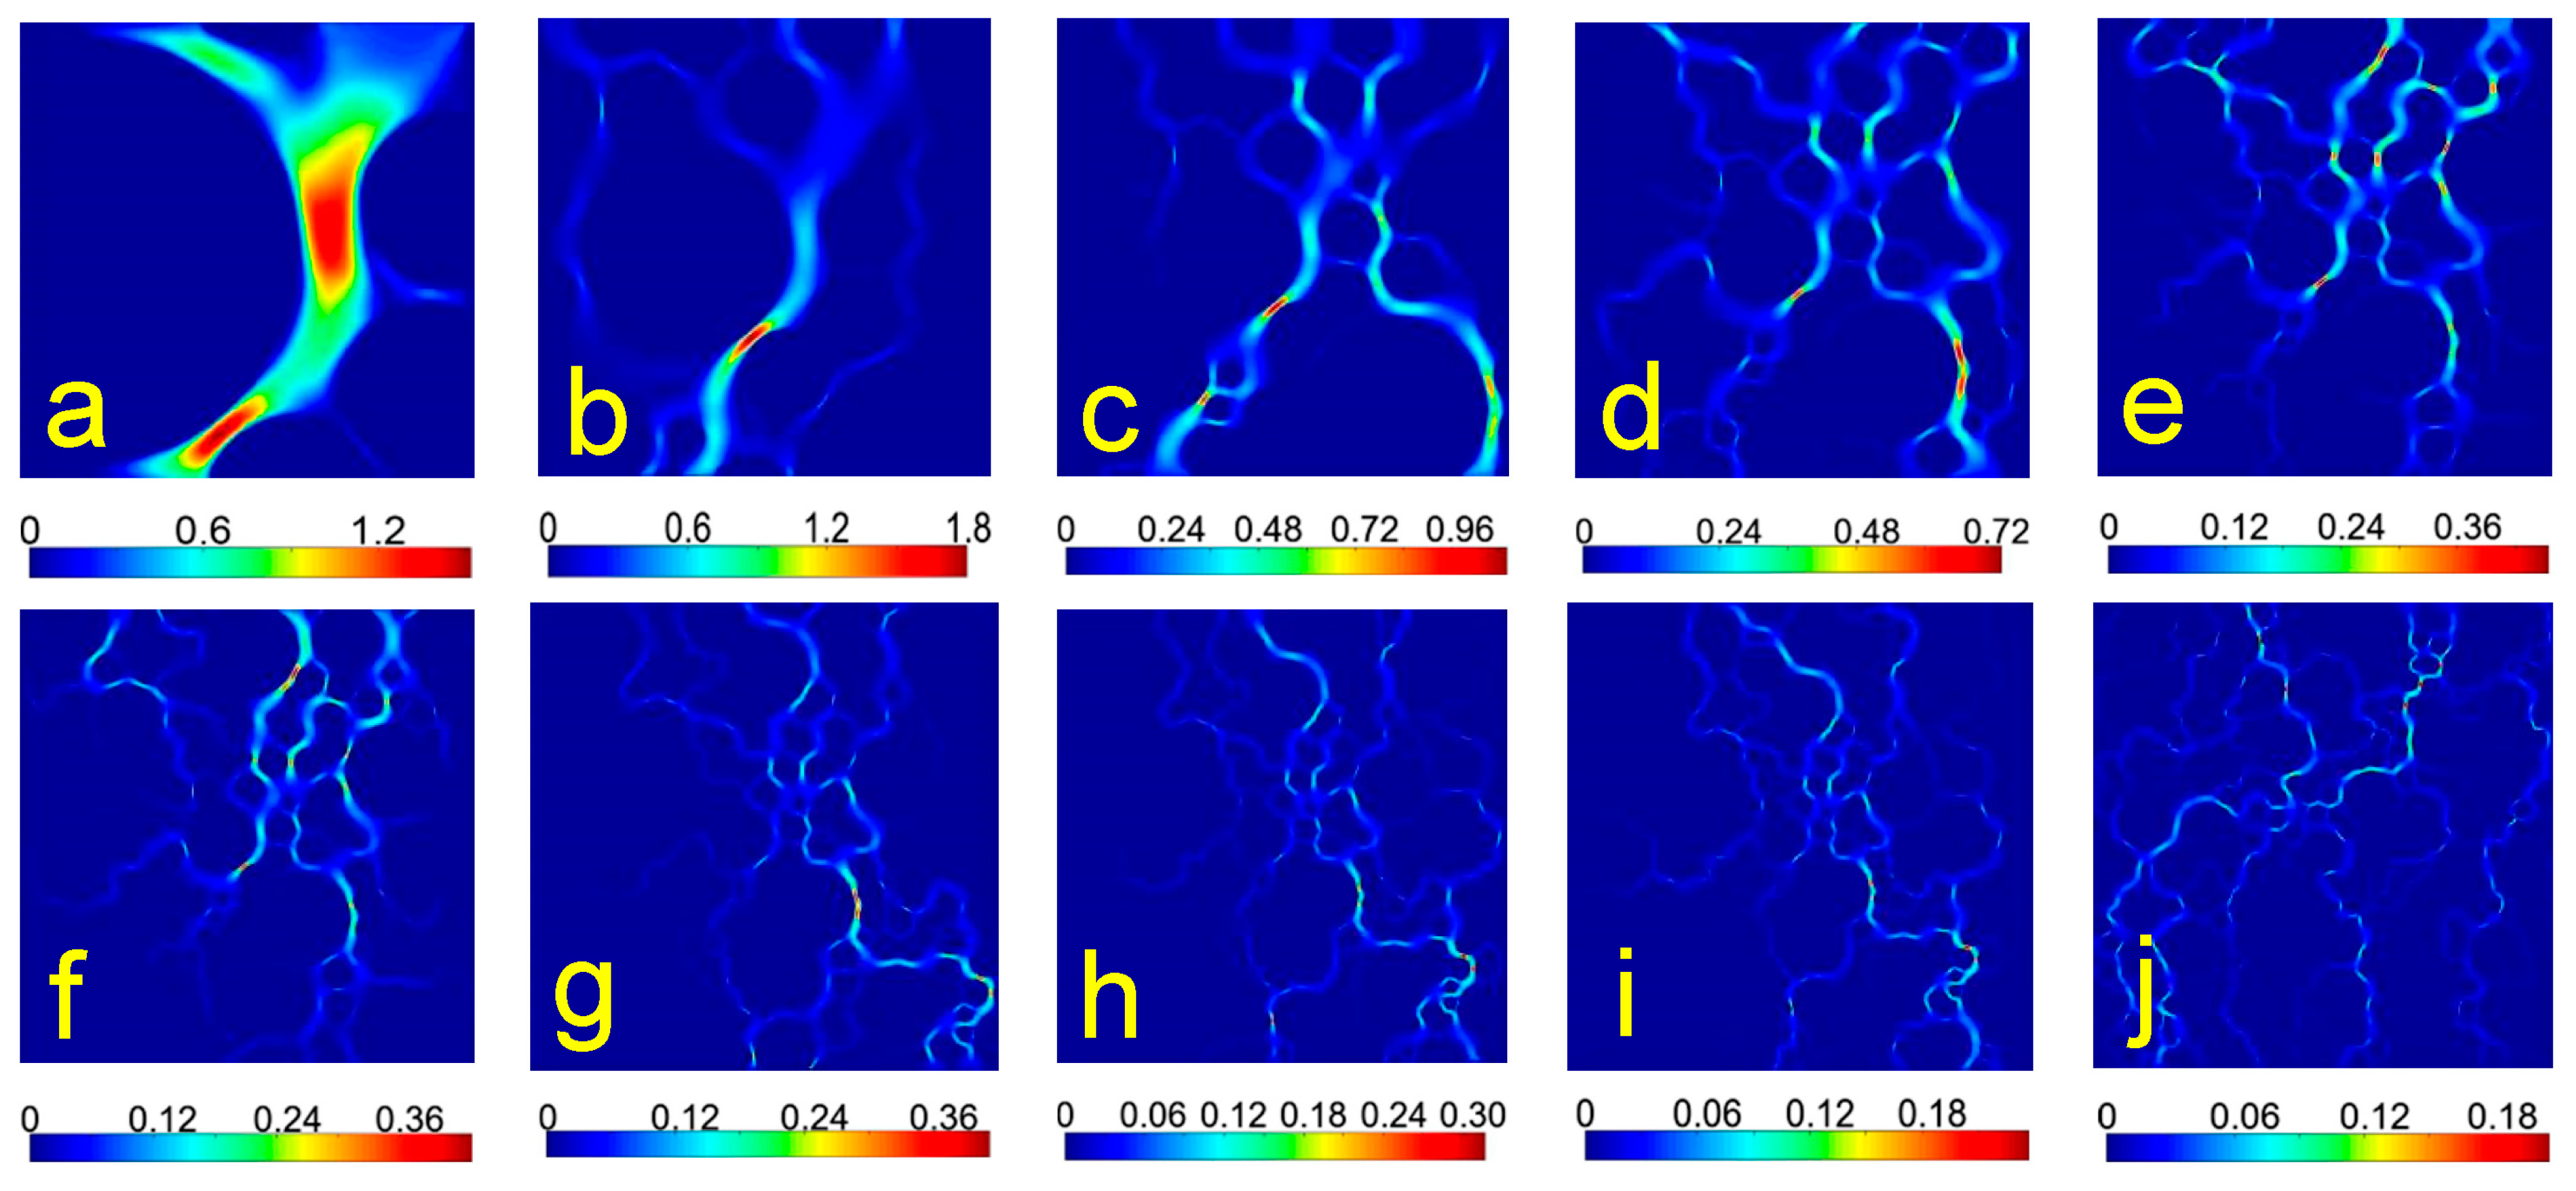
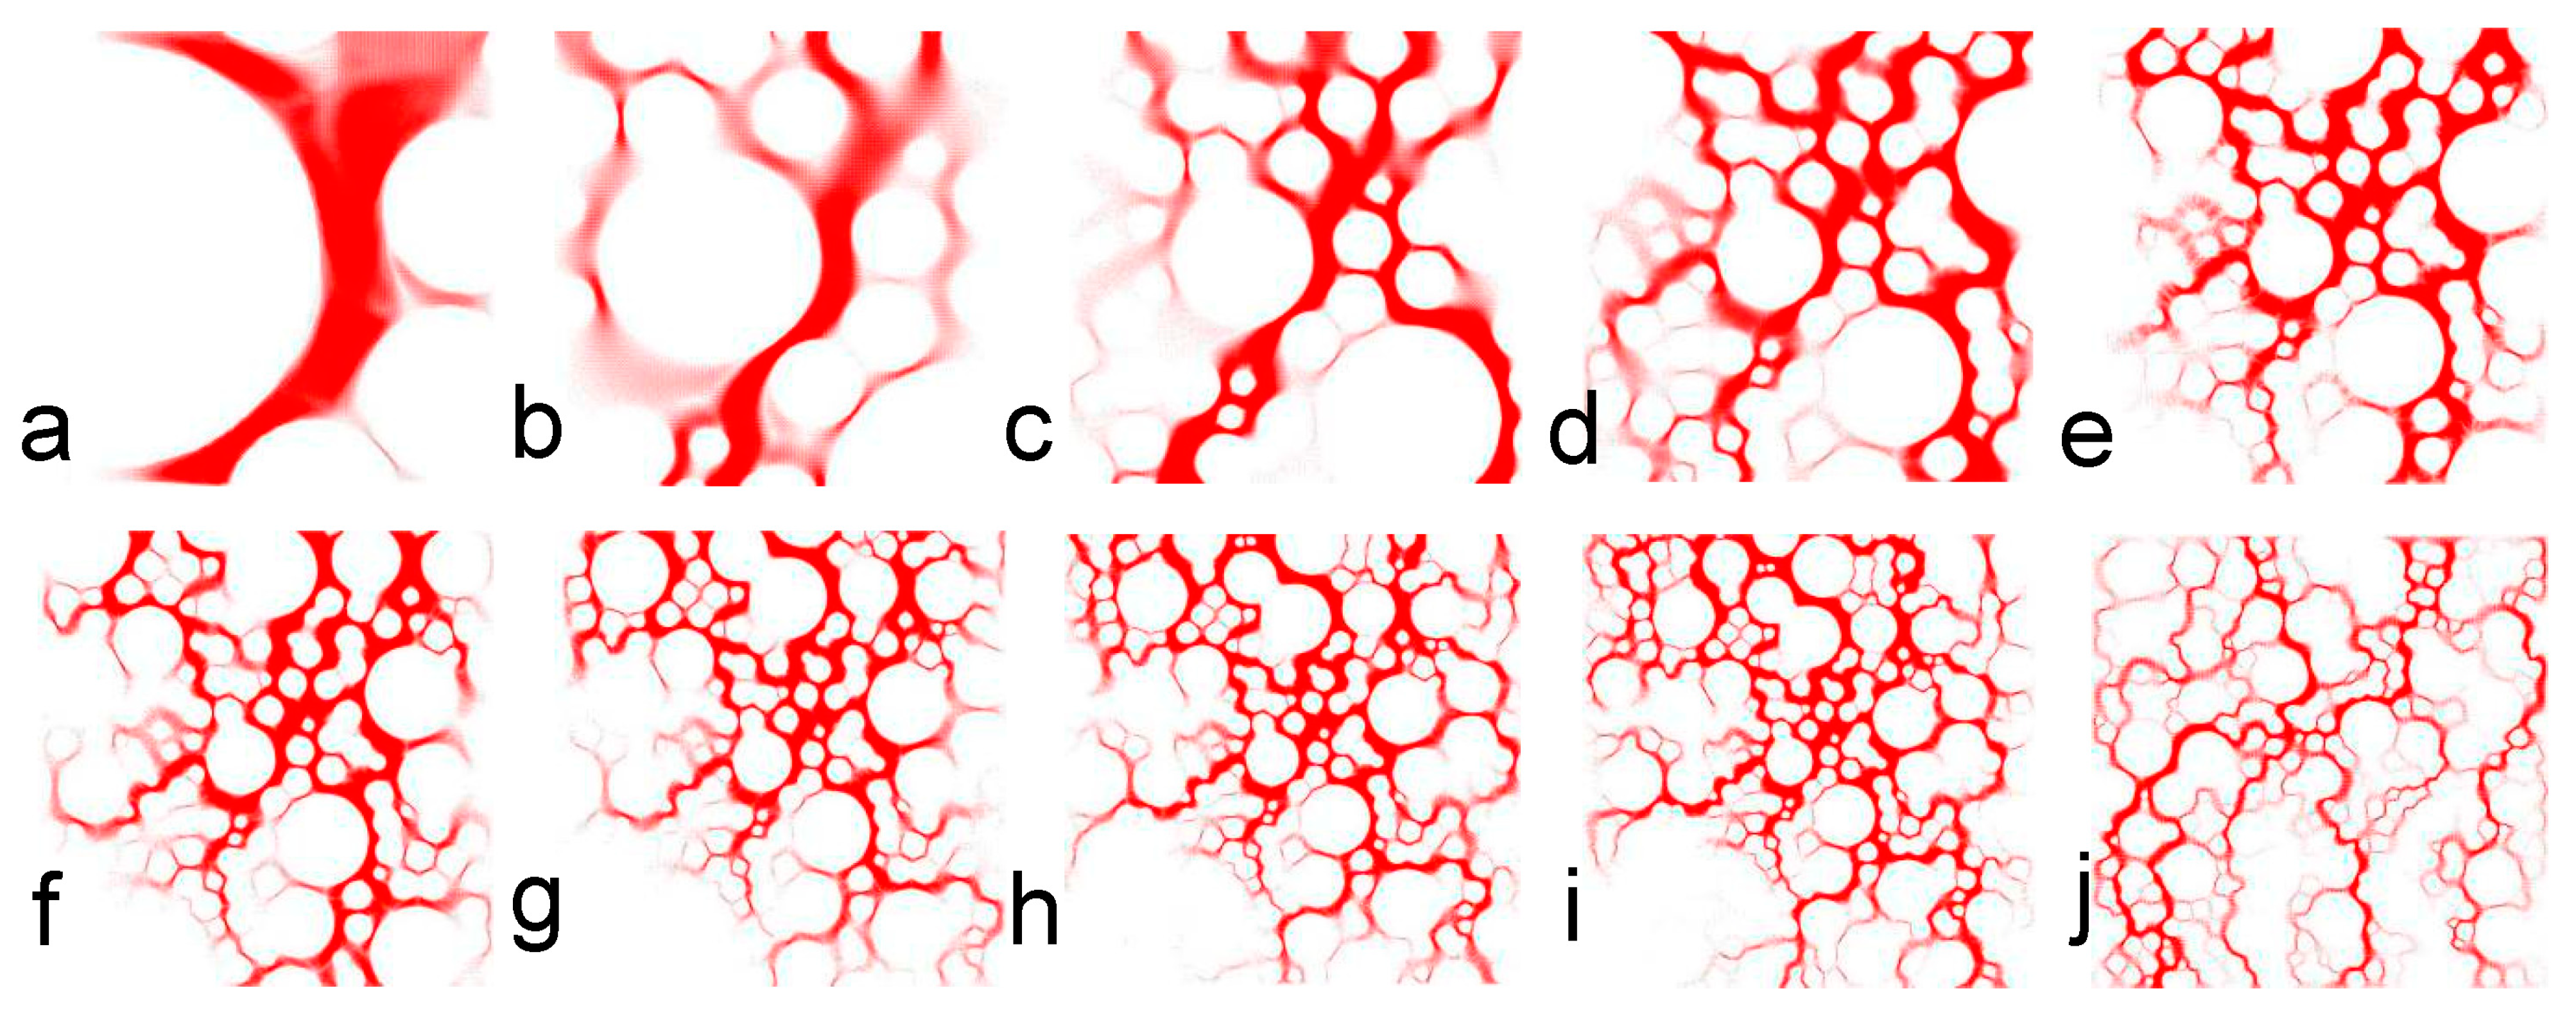
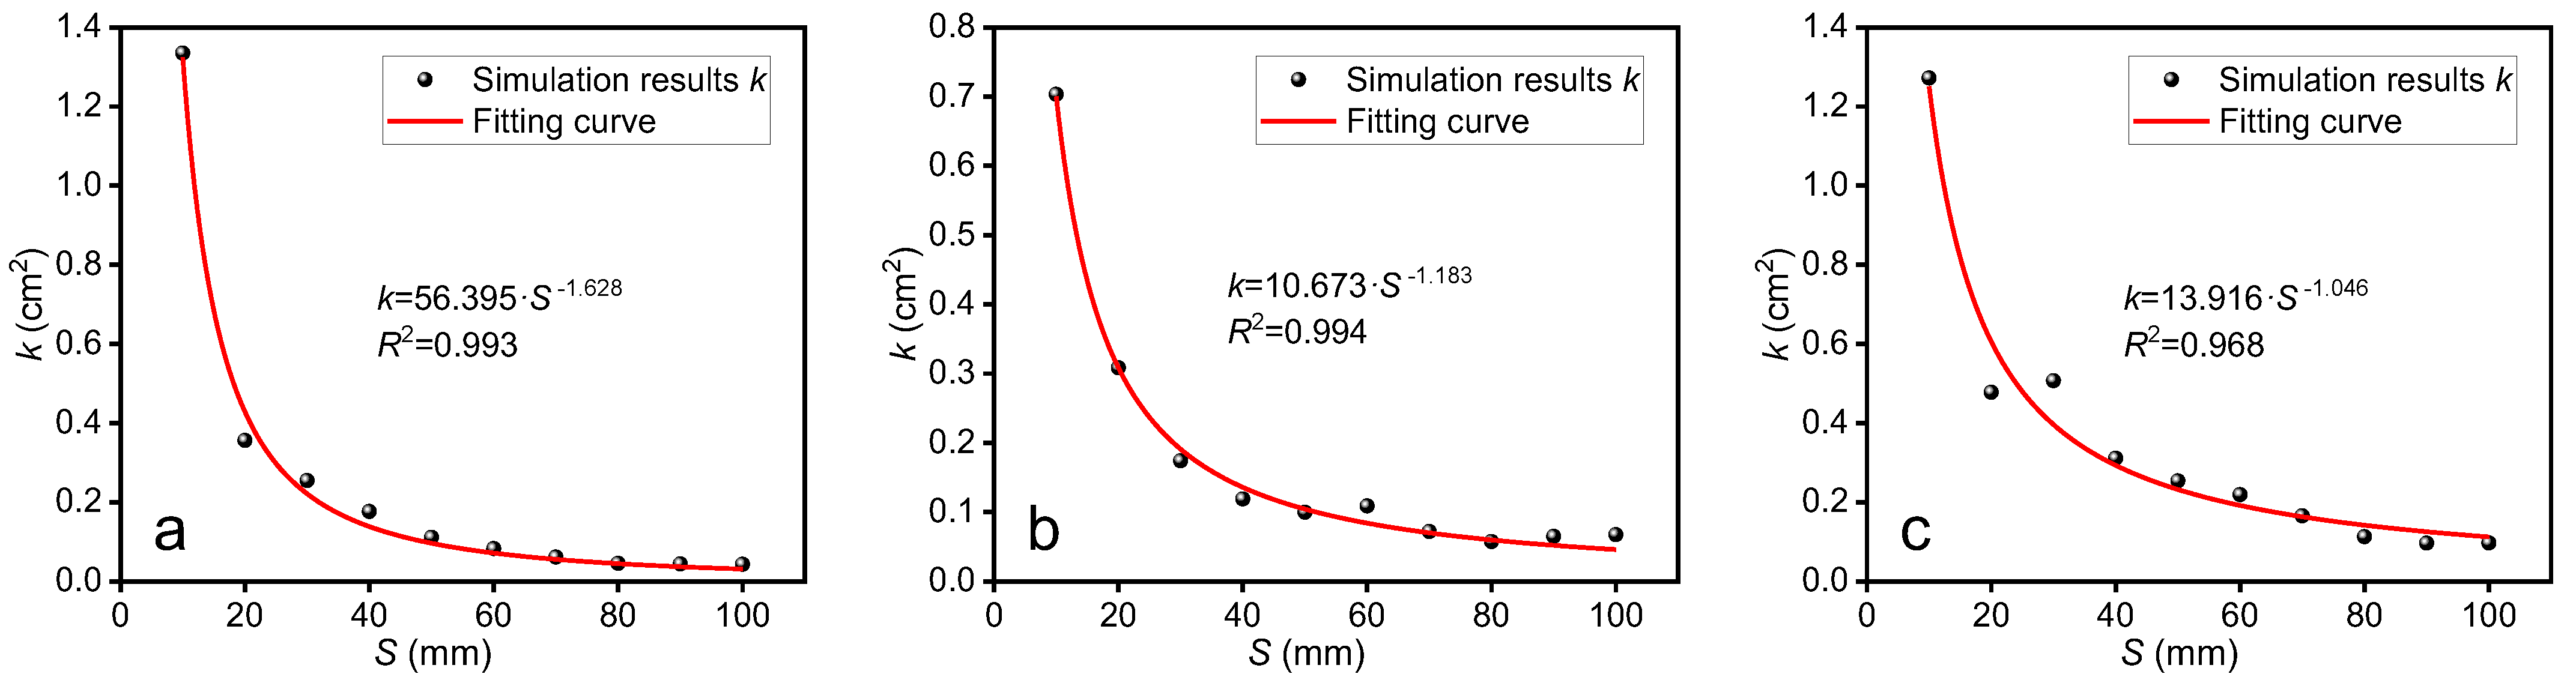
3.2.3. Model Feature Size S

To investigate the influence of the model’s feature size S on the seepage characteristics of the SRM model, this section synthesizes the preceding research and obtains the model with the resolution R = 60 ppi, S = 10, 20, 30, 40, 50, 60, 70, 80, 90, and 100 mm, respectively, by using the center segmentation type for the SRM–1, SRM–2, and SRM–3 models. Then, numerical simulation tests were conducted on the seepage field combined with LBM, with a total of 30 simulation test conditions (Table 1). Figure 11 and Figure 12 depict the simulated seepage velocity field and streamline distribution (limited to space, shown with SRM–1 as an example). Simultaneously, numerical fitting is used to examine the relationship between the permeability and the model feature size S, and the results are shown in Figure 13.
Figure 11 shows that the seepage velocity generally decreases as the feature size of the model increases. With increasing feature size of the model, the distribution characteristics of the seepage fluid in the channel gradually change from scattered distribution of a single channel to interactive distribution of multiple channels, and the average seepage velocity of the models with different feature sizes is u10 = 0.485 cm/s, u20 = 0.129 cm/s, u30 = 0.092 cm/s, u40 = 0.064 cm/s, u50 = 0.040 cm/s, u60 = 0.030 cm/s, u70 = 0.022 cm/s, u80 = 0.018 cm/s, u90 = 0.016 cm/s, and u100 = 0.015 cm/s. According to the streamline distribution diagram (Figure 12), the distribution of streamlines in the model pores first appears sparse, thick, and wide, and then the streamline gradually becomes dense and narrow as the model’s feature size increases. The reason for this is that the model’s feature size is small, the number of soil and rock particles in the model area is small, and the distribution is single, which cannot represent the overall model’s seepage characteristics. Simultaneously, when the velocity field and streamline distribution images of different feature sizes in SRM–1, SRM–2, and SRM–3 are combined, it can be seen that as the sample feature size S increases, the difference between the seepage velocity field and streamline distribution gradually decreases, indicating a relatively similar seepage trend. This demonstrates that selecting an appropriate model feature size has a significant impact on seepage characteristics. On the one hand, if the model feature size is too small, it is unable to represent the model’s basic characteristics. On the other hand, if the model feature size is too large, it results in resource abuse. As a result, it is critical to investigate the appropriate model feature size to characterize the model’s seepage characteristics.
Additionally, the permeability of SRM models with various structures gradually decreases with an increase in the feature size of the model, as shown by the fitting curve in Figure 13. In addition, it satisfies the dimensionless mathematical model k = a 0 · S b 0 (where a0 and b0 are numerical fitting parameters), and when S = 80 mm, it has a tendency to be nearly stable. With the increase of S (S = 80, 90, 100 mm), the degree of dispersion cv for the permeability of the three models (SRM–1, SRM–2 and SRM–3) is only cv-1 = 0.02281, cv-2 = 0.06631, and cv-3 = 0.07375. In conclusion, S = 80 mm can be regarded as the model for the representative numerical calculation unit of the SRM described in this paper.

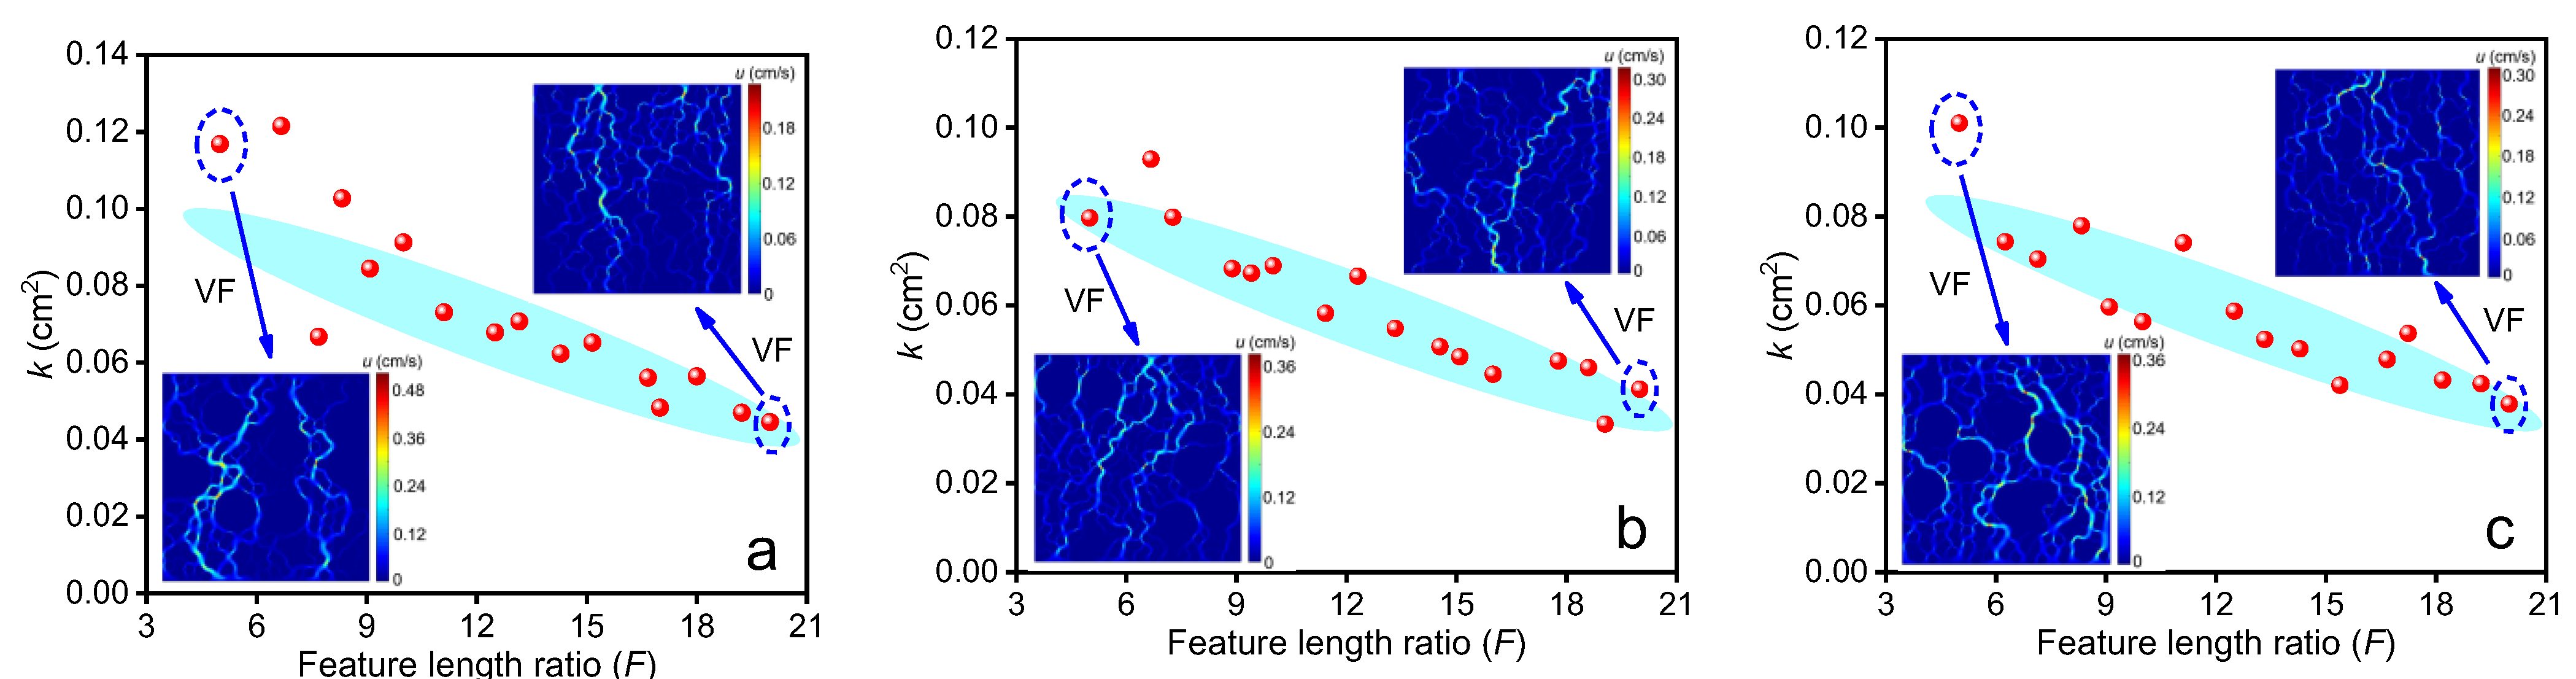
3.2.4. Feature Length Ratio F

Based on the above study, various SRM models (F = 5–20) are created using the method in Section 2.1 with the model porosity set to n = 0.50 to ensure that it has no effect on the results. This is used to study the influence of feature length ratio (F) on the permeability of SRMs in more detail (many studies show that porosity has a significant impact on permeability). For further information on the specific scheme, see Table 1. A total of 48 simulation test conditions are used to model the permeability of SRM samples under various F under the same boundary conditions and pressure differential. Figure 14 displays the simulation outcomes.
Figure 14 shows that the permeability of the SRM is roughly distributed along a linear “zonal” (blue area) with decreasing feature length ratio F and that as feature size S of the model increases, the dispersion of the permeability numerical distribution decreases. This finding is in line with the research findings in Section 3.2.3 regarding the relationship between feature size and permeability. In addition, it can be seen that the seepage channels of the F = 5 model are relatively wide but few in number, whereas the seepage channels of the F = 20 model are relatively narrow but numerous by comparing the seepage field velocity images of F = 5 and F = 20 under various model feature sizes. This is due to the fact that, given a constant feature size for the model, a larger feature length ratio results in a smaller maximum particle size for the rock and a smaller corresponding pore channel, which ultimately reduces the model’s permeability. In addition, it is important to take into account that the permeability distribution dispersion of the model with a low feature length ratio is more pronounced than that of the model with a high feature length ratio, and the dispersion is significantly reduced when F ≥ 12, which also suggests that the feature length ratio should not be too small when studying the permeability of the SRM model. Comprehensive comparison with other research or specific conclusions is more consistent [9,30]. The Standard for Soil Test Methods (GB/T 50123–2019) [30] states that when the sample size is 100 mm, the ratio of sample size to maximum particle size must be at least 10. The American Society for Testing and Materials Standard Yearbook [9] states that the diameter of the sample container must be 8–12 times the maximum particle size of the sample. Briefly describing the findings of relevant research, most of the time the sample size to particle size ratio is not less than 5 [31,32,33].

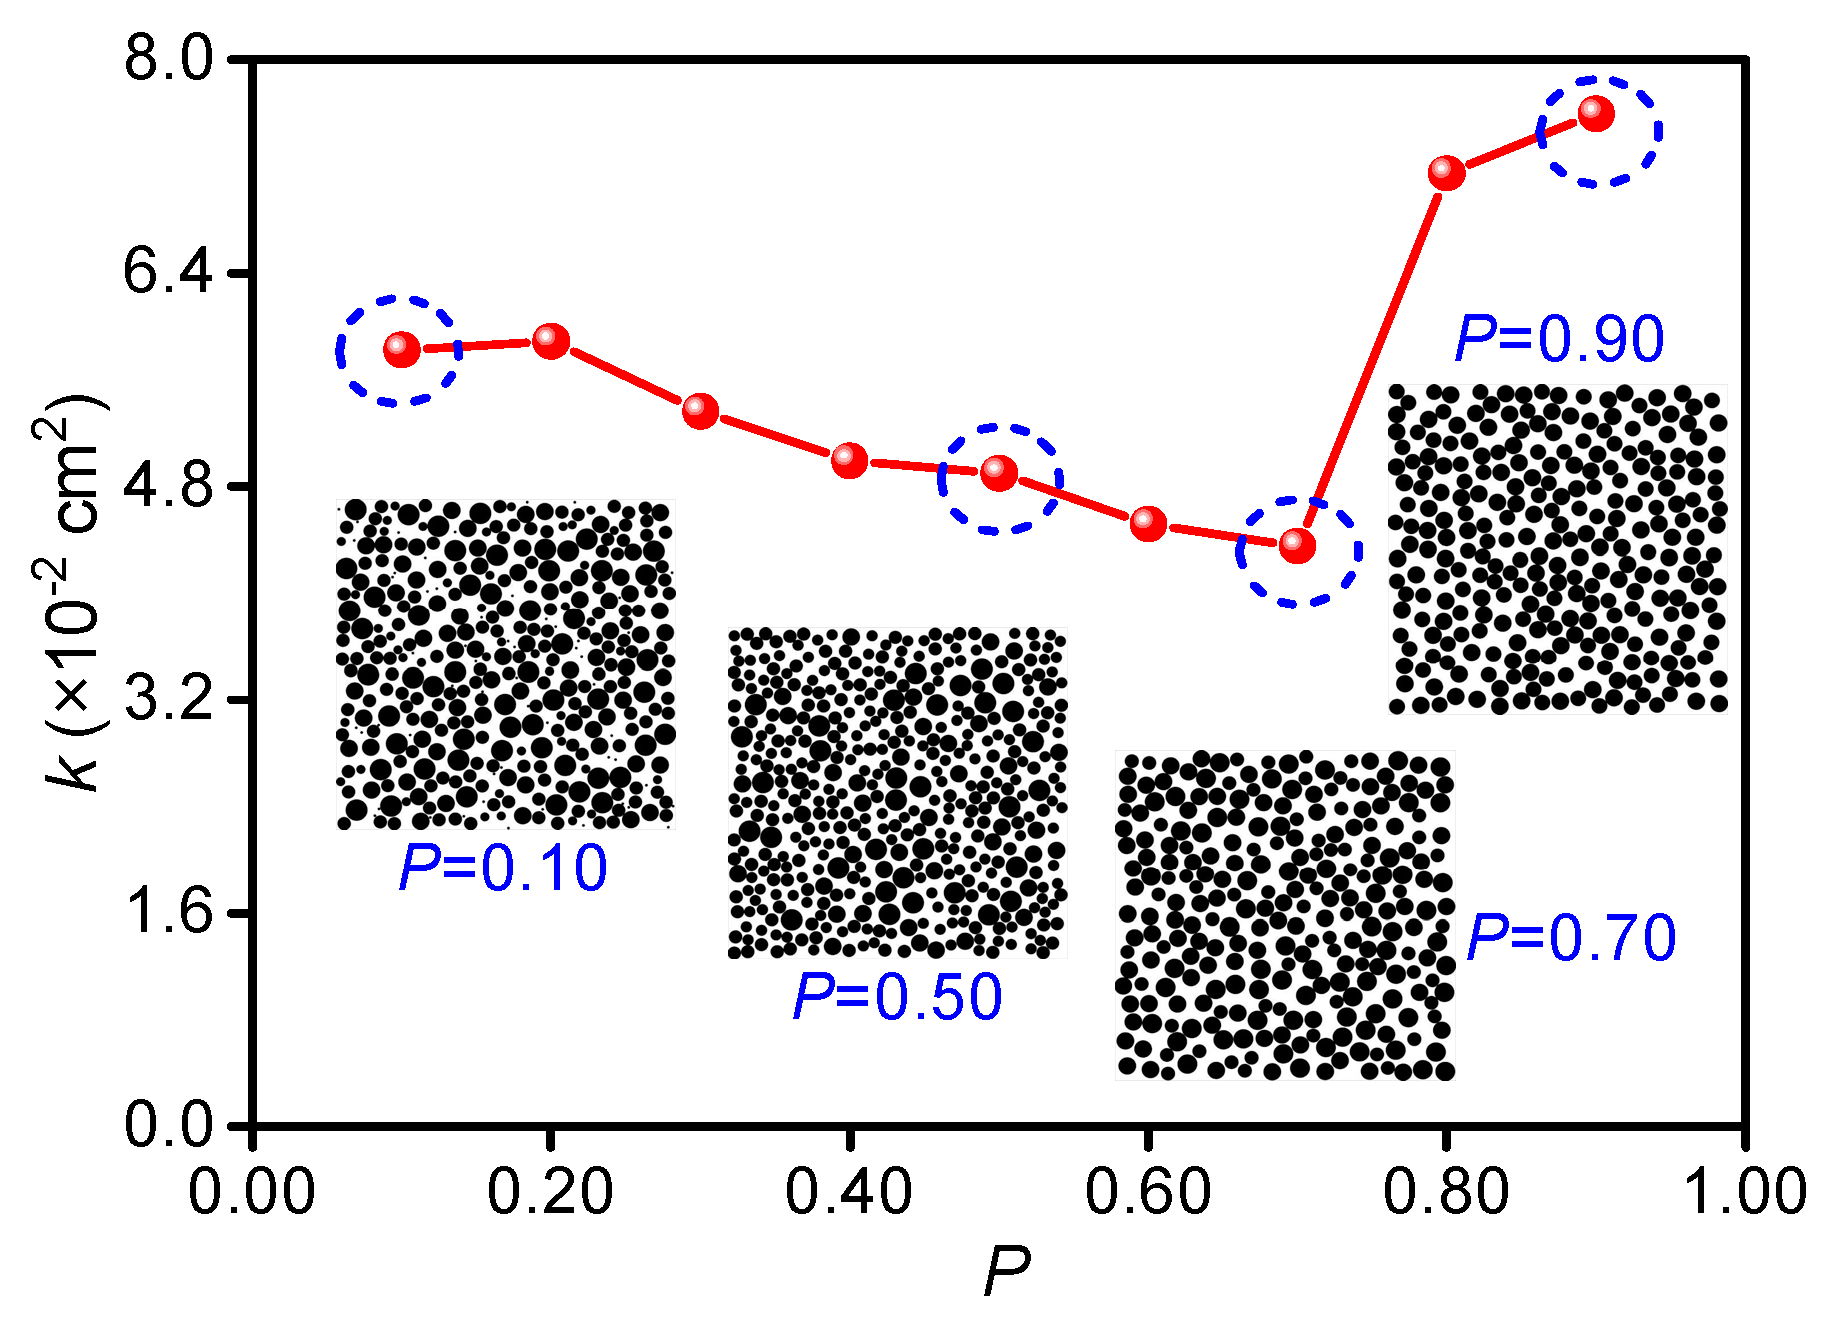
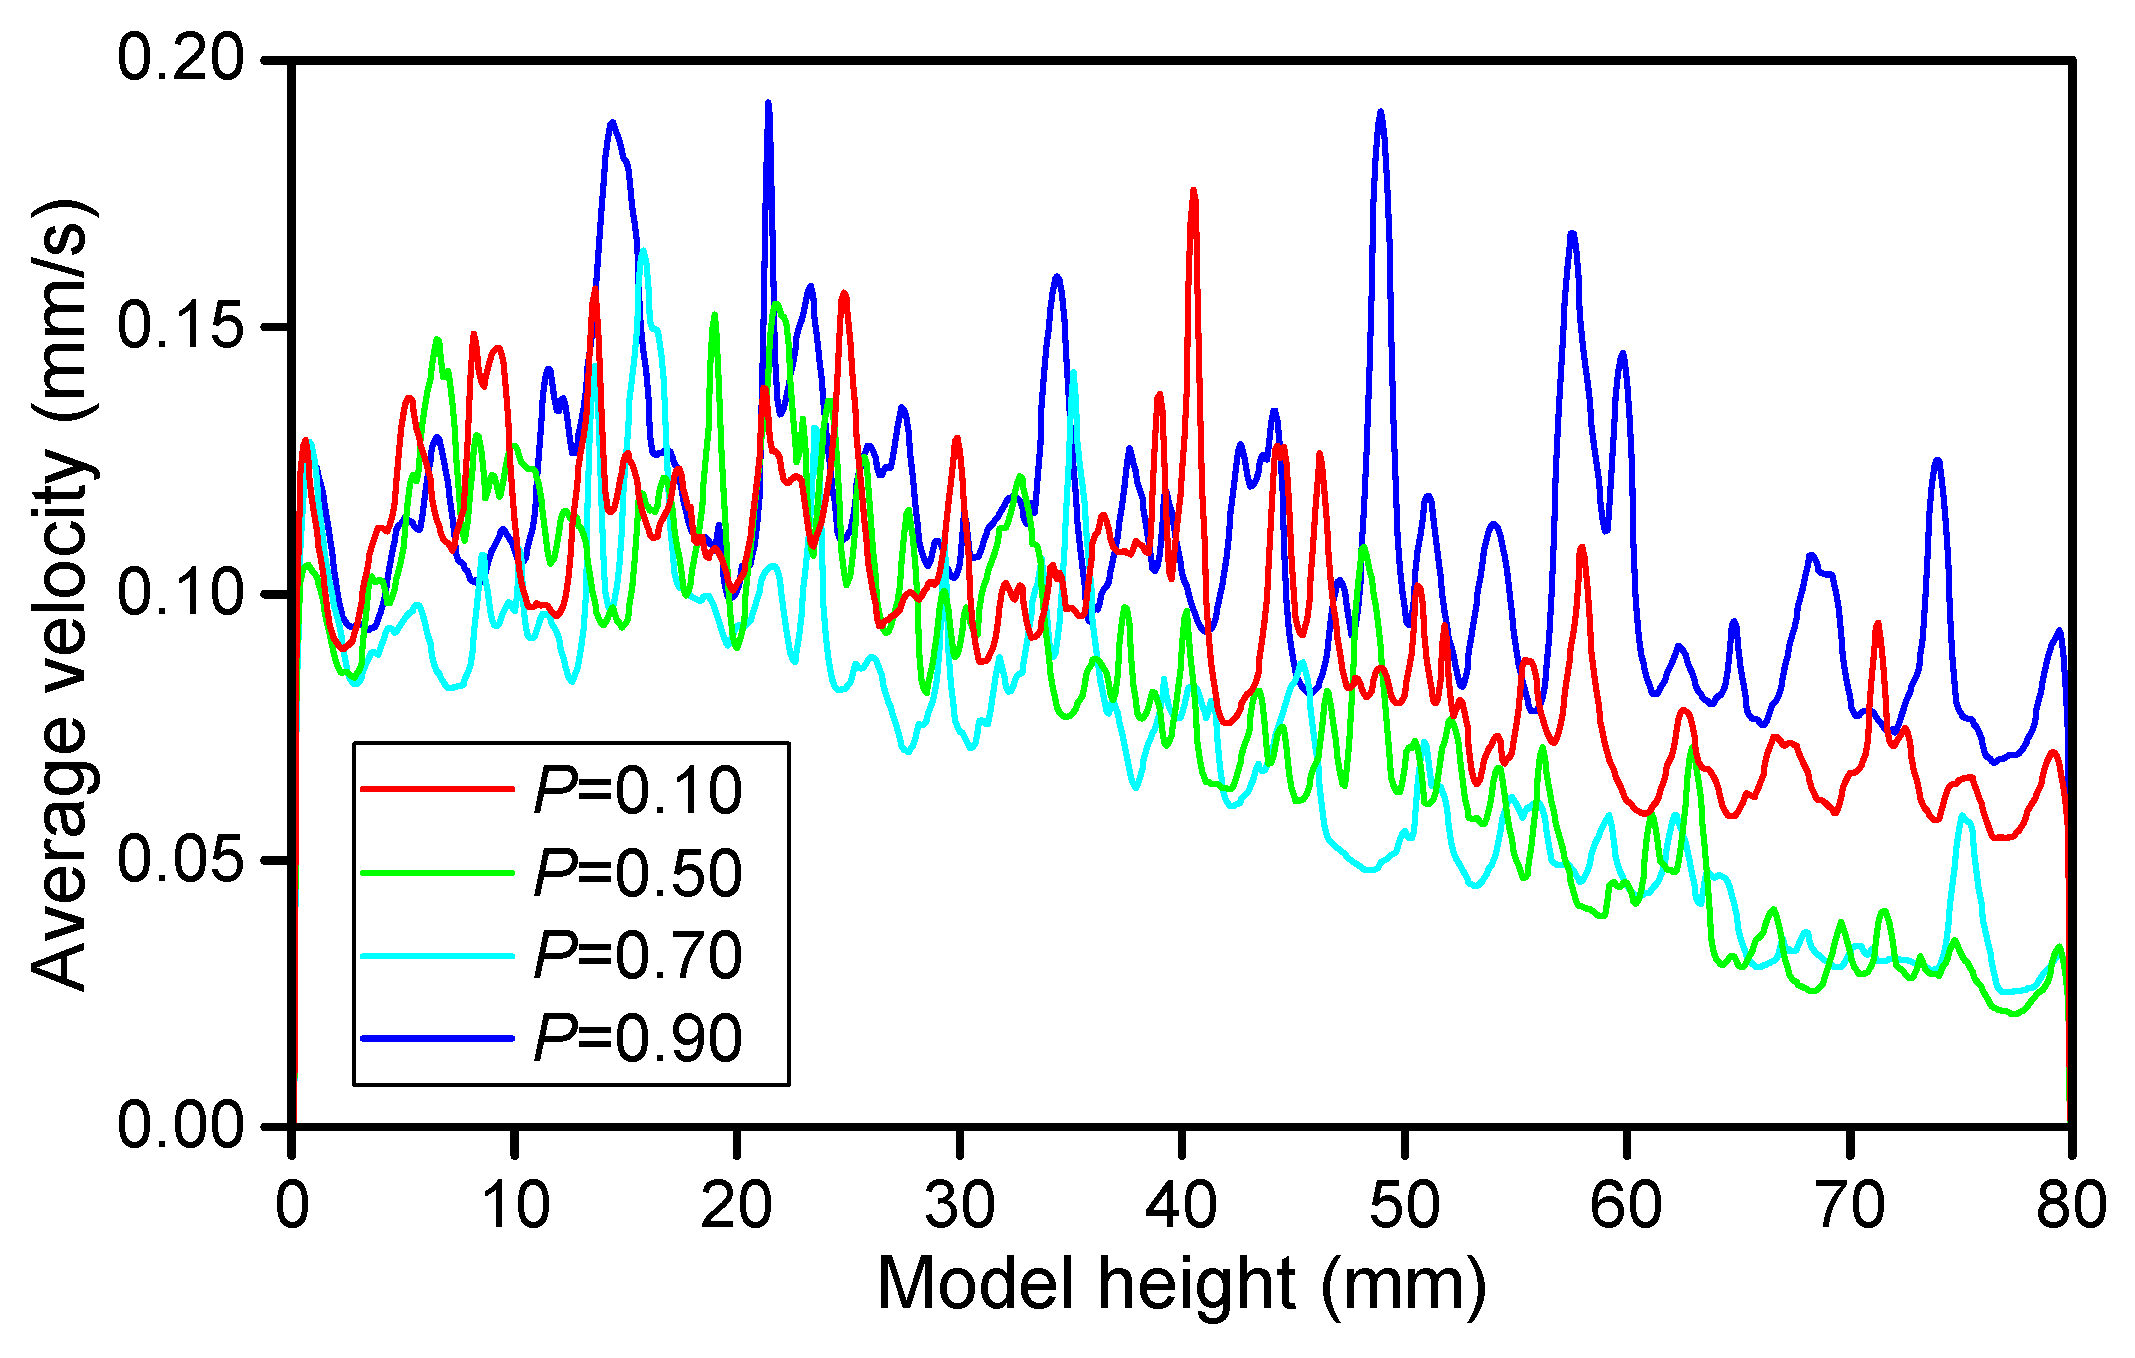
3.2.5. Soil/Rock Particle Size Feature Ratio P

The internal pore structure of the SRM is determined by its particle size distribution, which also affects its permeability. The soil/rock particle size feature ratio (P) can represent the composition of soil/rock particle size in the model sample of the SRM. Based on the previously mentioned study, this section utilizes samples of the SRM with various particle size feature ratios (P = 0.10–0.90) of S = 80 mm, R = 60 ppi, and n = 0.50 to explore the influence of P on the seepage characteristics of the SRM in more depth, with a total of nine simulation test conditions (Table 1). The simulation outcomes are displayed in Figure 15 and Figure 16.
Figure 15 illustrates how significantly the feature ratio of soil/rock particle size affects the seepage characteristics of the SRM. Overall, the permeability of the SRM shows a characteristic of first slowly decreasing and then sharply increased with the increase in P. When compared to the model samples at the critical soil/rock particle size feature ratio (P = 0.10, P = 0.20, P = 0.70, and P = 0.90), it can be seen that as P increases, the difference in soil/rock particle size in the model sample decreases, changing the sample’s pore structure from a multilevel distribution to almost a single–graded sample. At P > 0.70, the soil/rock particle size is nearly the same, almost becoming “rock”, forming a skeleton structure together, so its permeability increases suddenly.
It can also be seen that the average seepage velocity of the model sample is typically higher when P = 0.90, while the average seepage velocity of the model sample is the lowest when P = 0.70, which corresponds to the permeability value shown in Figure 15. This is in comparison to the average velocity distribution curve of the seepage field in Figure 16. The average seepage velocity curve’s shape also changes from multiple wave peaks and complex bending to a single wave peak and smooth characteristics with an increase in P value, which is closely related to the particle size distribution of soil and rock and also corresponds to the evolution characteristics. These findings come from examining the shapes of each average seepage velocity curve under various particle size feature ratios of soil and rock.
Compared with other researchers, it can be seen that References [22,34,35] focus on the influence of rock particle size on the SRM’s simulated permeability, but had not considered the influence of the mutual relationship between soil and rock particle size on the SRM’s simulated permeability. This study demonstrated that SRM’s reproduced permeability is significantly influenced by the soil/rock particle size feature ratio (Figure 15). Additionally, Reference [34] showed that the presence of a critical value of rock content causes an unexpected shift in the pattern of the influence of rock particle size on permeability. The influence of particle size on permeability was clearly linked to rock content in the conclusion of Reference [35]. Compared with Reference [34], this study found that the soil/rock particle size feature ratio extent similarly has a particular threshold, which can cause an unforeseen increase in simulated permeability, and the two had explicit similarities in this regard.

3.3. Discussion

The detailed influences of resolution, segmentation type, model feature size, feature length ratio, and soil/rock particle size feature ratio on the seepage characteristics of SRMs were explored in Section 3.2 using 342 simulation test conditions. Differentiated and other specialists’ preliminary focuses on the permeability of SRMs, it might be seen in References [12,36,37,38] that the permeability coefficient of SRMs obtained from the experiment has a large span (permeability and permeability coefficient can be converted from each other), ranging from 10−6 to 2.0 cm/s. This also indicates that the SRM’s permeability is not uniform and varies depending on factors such as the type of soil, particle size, inside pore structure, experimental model size, etc. The pattern of permeability coefficient changes with the increase in rock content described in Reference [36] supports the reliability of the mimicked estimation of penetrability noted in this paper. In any case, it is important to note that the permeability values derived from this paper’s mathematical calculations are significantly higher than those derived from experiments in References [22,36,37,38]. The reason is that the SRM used in the experiment has soil and rock particles that are mostly attached, whereas the SRM made by the mathematical model has sandy particles that do not have a bond, so the permeability is larger. Compared with the reenactment computation effects of SRM’s penetrability described in Reference [34], it is consistent with the calculation data reported in this paper.
In addition, this section also provides an extensive discussion on the selection of the optimal unit volume model size of SRMs based on the findings of the research. Bear [39] made the initial suggestion for the representative elementary volume (REV). The REV scale, which represents the critical scale for the change from unstable to stable mechanical properties of rock and soil mass, is an objective reflection of the size effect of the mechanical properties of the rock and soil mass [40]. Larger-particle rock components and small soil particles comprise the SRM. Figure 16 of the research area of the research group illustrates how the internal structure of the model changes with continuous changes in the model’s size [12]. Figure 17 shows that the REV–I region consists of single or partial block stones; the REV–II region has a certain amount of block stones and uses fine-grained soil as the filling material; the REV-III region contains a variety of block stones with different particle sizes in addition to the block stones that cannot be ignored in comparison to the REV–II region, which together forms a multilevel SRM. Additionally, the authors of References [41,42] used homogenization to create multiscale LBM models that successfully mimicked single–phase and two–phase flow simultaneously in pores of completely different length scales. This could be also applied to an SRM where the particle sizes and pores vary greatly. This demonstrates that the test and calculation results can only accurately reflect the pertinent properties of the SRM when the size range of the SRM studied is greater than or equal to its REV. The balance between numerical calculation accuracy and calculation efficiency should also be thoroughly taken into consideration on this basis for the numerical simulation of the size effect on SRM seepage characteristics.
Based on the aforementioned research, Section 3.2.1 first simulates 30 test conditions for SRM–1, SRM–2, and SRM–3 with various resolutions R = 0–100 ppi. It demonstrates that when the resolution reaches 60 ppi, cv is 0.00236, 0.00061, and 0.00028, respectively, and R = 60 ppi can be thought of as the optimal resolution. Secondly, in Section 3.2.2, 225 kinds of seepage test simulations were carried out for the SRM model under the four segmentation types, and it was found that the model permeability obtained by the center segmentation type under the same model feature size was the least discrete, which was also consistent with other relevant research conclusions [10]. Thirdly, center segmentation type was used in Section 3.2.3 to create a model with resolutions of R = 60 ppi and S = 100 mm. Dimensionless k = a 0 · S b 0 mathematical model fitting was used to analyze the results of 30 seepage test conditions. When S = 80 mm, it was discovered that the SRM’s permeability tended to be almost stable. At this time, cv was only cv-1 = 0.02281, cv-2 = 0.06631, and cv-3 = 0.07375. Then, using n = 0.50 and F = 5, Section 3.2.4 simulates 48 seepage test conditions for various SRM models. It demonstrates that as F increases, the distribution of the SRM’s permeability presents a decreasing “zonal” distribution, and that the dispersion of the permeability value distribution is significantly reduced when F ≥ 12. The SRM samples with S = 80 mm, R = 60 ppi, n = 0.50, and P = 0.10–0.90 were studied under 10 different penetration test conditions in Section 3.2.5, showing that P plays a significant and decisive role in the grading and structural composition of the SRM, but that there is no clear distinction between good and bad for the selection of size effect.
As a result, the following guidelines can be used to determine the optimal size for the SRM’s REV numerical calculation model reported in this paper: the center segmentation type is used, the model is R = 60 ppi, S = 80 mm, F ≥ 12, and P determined by specific needs.

4. Conclusions

Based on the lattice Boltzmann method (LBM), the seepage process for the soil–rock mixture (SRM) is simulated from the pore scale. The following conclusions are drawn after a detailed discussion of the effects of size feature parameters on the seepage characteristics of SRMs under 342 simulation test conditions, including resolution (R), segmentation type, model feature size (S), feature length ratio (F), and soil/rock particle size feature ratio (P); the following conclusions are obtained:
(1)
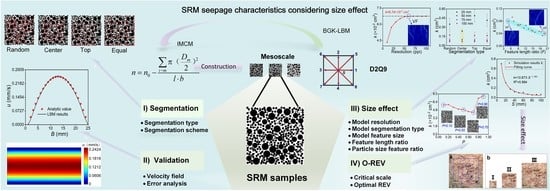
As R increases, the permeability of the SRM gradually rises and tends to stabilize when R reaches 60 ppi. The model’s porosity and rock content also have only a minor impact on the correlation between resolution and permeability.
(2)
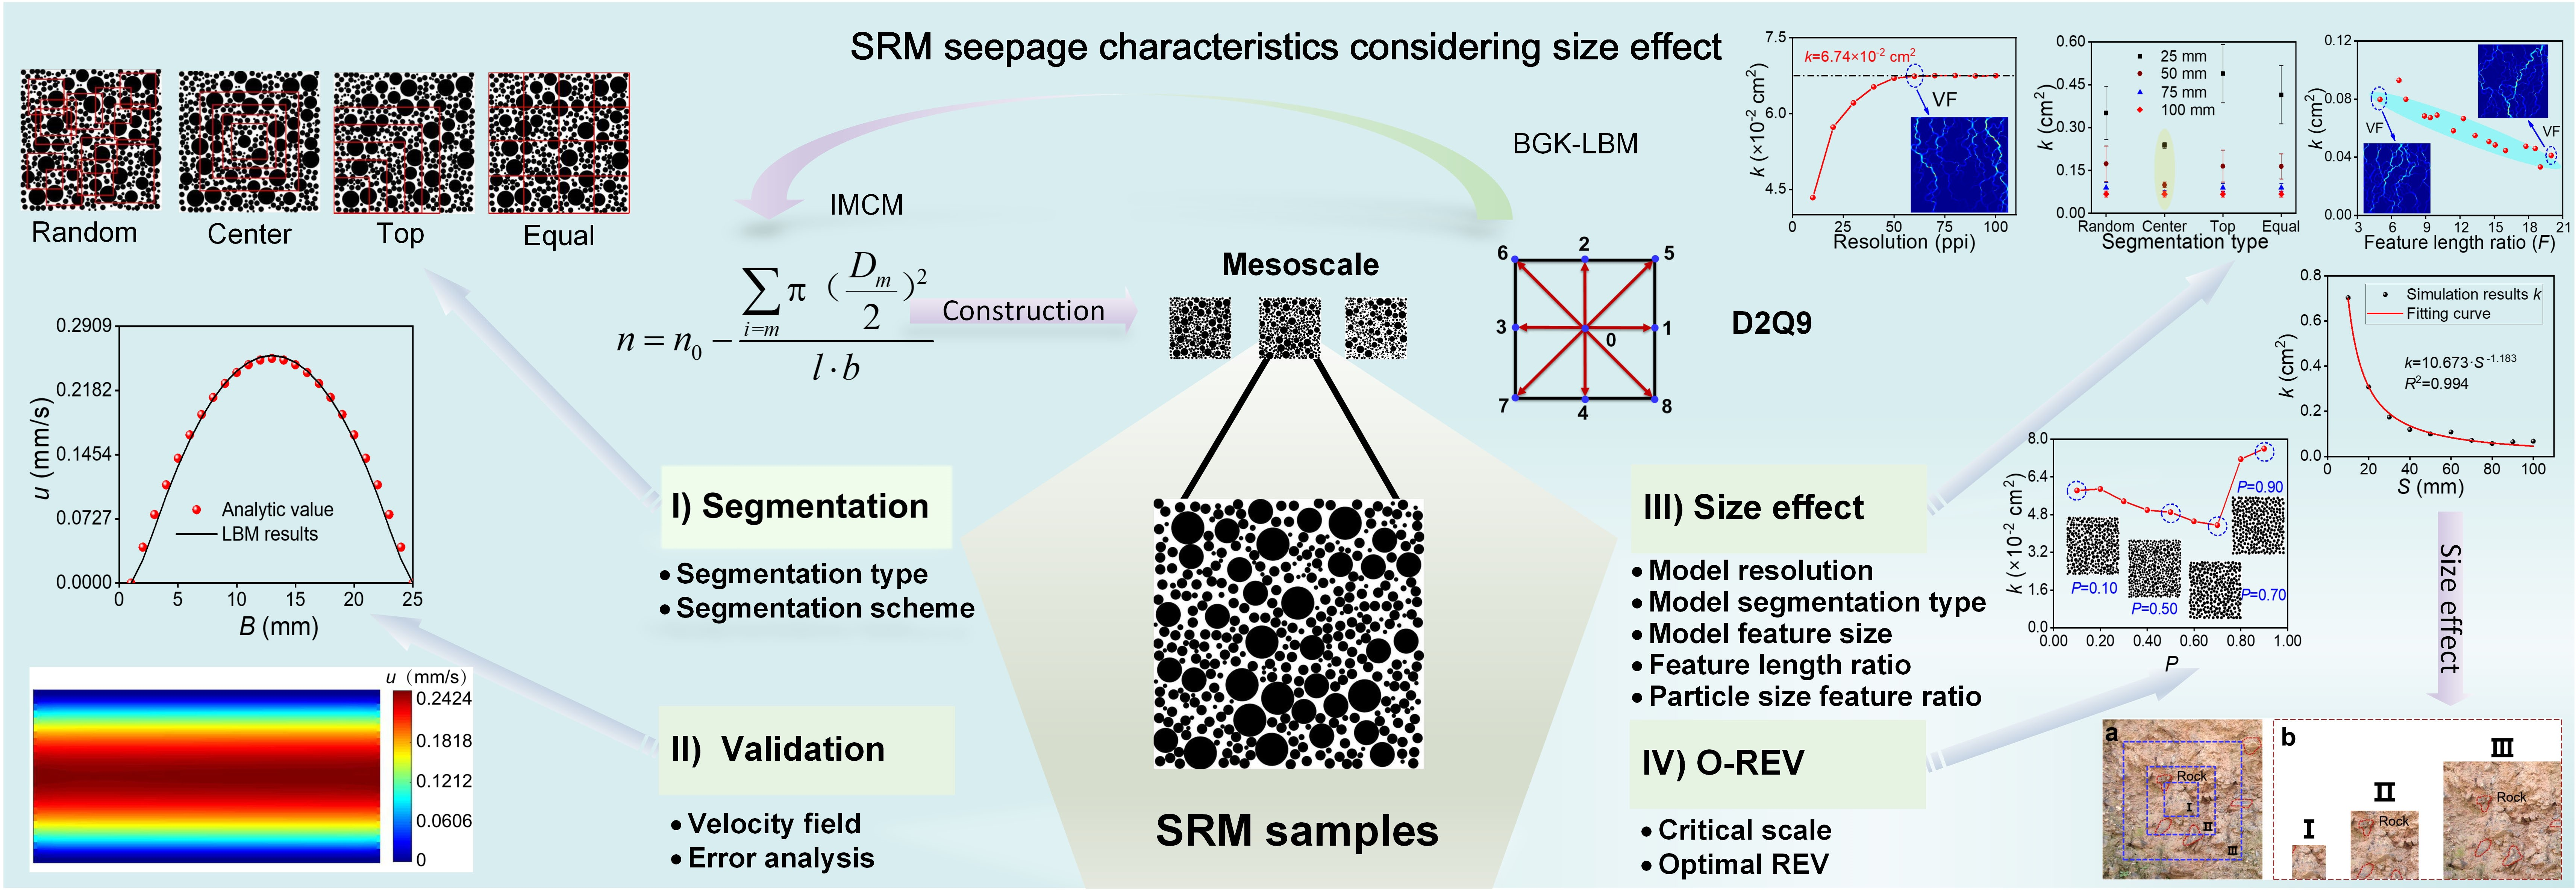
The four segmentation types–center segmentation, random segmentation, equal segmentation, and top segmentation–are in order of decreasing dispersion in the permeability of the model obtained under the same S. The permeability of the model increases with S when using the same segmentation type, exhibiting a high degree of mutual anisotropy. The results for permeability obtained using the top and equal segmentation types are particularly noteworthy.
(3)
The permeability of the SRM model decreases gradually as S increases, satisfying the dimensionless mathematical model k = a 0 · S b 0 and tending to be stable at S = 80 mm. The permeability of the SRM increases in a linear “zonal” distribution as F increases, and as S increases, the dispersion in the permeability value distribution decreases, particularly when F ≥ 12. The permeability of the SRM decreases gradually and then sharply as P increases, and it is important in the grading and structural composition of the SRM.
(4)
In the current study, the conditions of R = 60 ppi, center segmentation type, S = 80 mm, F ≥ 12, and P determined by specific need can be used to select and generate the optimal REV numerical calculation model size of the SRM.

Author Contributions

P.C.: analysis, writing—original draft, writing—review and editing; X.M.: supervision, resources, conventionalization, funding acquisition, writing—review and editing; K.L.: writing—review and editing, data curation; Z.Y.: analysis, data curation. All authors have read and agreed to the published version of the manuscript.

Funding

This research was funded by the National Natural Science Foundation of China (NSFC, Fund number: 51878064), the Grant Recipient is Xuesong Mao.

Data Availability Statement

The data that support the findings of this study are available upon request.

Acknowledgments

The authors gratefully acknowledge the support provided by the National Natural Science Foundation of China, fund number 51878064.

Conflicts of Interest

The authors had received research funding from National Natural Science Foundation of China.

References

  1. Tao, M.; Ren, Q.; Bian, H.; Cao, M.; Jia, Y. Mechanical Properties of Soil-Rock Mixture Filling in Fault Zone Based on Mesostructure. Comput. Model. Eng. Sci. 2022, 132, 681–705. [Google Scholar] [CrossRef]
  2. Gao, W.-W.; Gao, W.; Hu, R.-L.; Xu, P.-F.; Xia, J.-G. Microtremor survey and stability analysis of a soil-rock mixture landslide: A case study in Baidian town, China. Landslides 2018, 15, 1951–1961. [Google Scholar] [CrossRef]
  3. Liu, L.; Mao, X.; Xiao, Y.; Wang, T.; Nie, M. Influence of water and rock particle contents on the shear behaviour of a SRM. Transp. Saf. Environ. 2020, 2, 29–43. [Google Scholar] [CrossRef]
  4. Iqbal, J.; Thomasson, J.A.; Jenkins, J.N.; Owens, P.R.; Whisler, F.D. Spatial Variability Analysis of Soil Physical Properties of Alluvial Soils. Soil. Sci. Soc. Am. J. 2005, 69, 1338–1350. [Google Scholar] [CrossRef]
  5. Wang, Y.; Mao, X.; Wu, Q.; Dai, Z. Study on the Influence of Seepage Conditions with Different Rainfall Intensities on the Structural Evolution of Soil-Rock Mixture Filler. Geofluids 2022, 2022, 7694663. [Google Scholar] [CrossRef]
  6. Zhou, Y.; Sheng, G.; Qiao, S.; Zhou, L.; Cai, J.; Xu, H. A determination method for the shear strength of soil-rock mixture considering the size effect and its application. Front. Mater. 2022, 9, 1075310. [Google Scholar] [CrossRef]
  7. Ke, L.; Takahashi, A. Strength reduction of cohesionless soil due to internal erosion induced by one-dimensional upward seepage flow. Soils Found. 2012, 52, 698–711. [Google Scholar] [CrossRef]
  8. Rong, G.; Zhou, C.B.; Wang, E.Z. Preliminary study on permeability tensor calcution of fractured rock mass and its representative elementary volume. J. Rock Mech. Eng. 2007, 26, 740–746. [Google Scholar]
  9. Chen, J.; Fang, Y.; Gu, R.; Shu, H.; Ba, L.; Li, W. Study on pore size effect of low permeability clay seepage. Arab. J. Geosci. 2019, 12, 238. [Google Scholar] [CrossRef]
  10. Wang, L. Two-Dimensional Numerical Experiment Based on the Permeability of Soil-Rock Mixture Microstructure and Its Size Effect. Master’s Thesis, China Three Gorges University, Sanxia, China, 2020. [Google Scholar] [CrossRef]
  11. Liu, Q.; Li, H.; Zhang, Y.B. Scale effect in permeability characteristics of rock mass using boundary element method. J. Univ. Jinan 2015, 29, 210–215. [Google Scholar] [CrossRef]
  12. Xu, W.J. Study on Meso-Structural Mechanics of Soil-Rock Mixture and Its Slope Stability. Ph.D. Thesis, Institute of Geology and Geophysics, Chinese Academy of Sciences, Beijing, China, 2008. Available online: http://ir.iggcas.ac.cn/handle/132A11/11061 (accessed on 5 January 2023).
  13. McNamara, G.R.; Zanetti, G. Use of the Boltzmann Equation to Simulate Lattice-Gas Automata. Phys. Rev. Lett. 1988, 61, 2332–2335. [Google Scholar] [CrossRef] [PubMed]
  14. Zhou, D.; Tan, Z. On the Application of the Lattice Boltzmann Method to Predict Soil Meso Seepage Characteristics. Fluid. Dyn. Mater. Process. 2020, 16, 903–917. [Google Scholar] [CrossRef]
  15. Kim, P.; Kim, Y.G.; Paek, C.-H.; Ma, J. Lattice Boltzmann method for consolidation analysis of saturated clay. J. Ocean. Eng. Sci. 2019, 4, 193–202. [Google Scholar] [CrossRef]
  16. He, Y.L.; Wang, Y.; Li, Q. Lattice Boltzmann Method: Theory and Application; Science Press: Beijing, China, 2009; Available online: https://onlinetoolsland.com/books/3352346 (accessed on 9 April 2023).
  17. Li, J.J.; Jin, L.; Chen, T. Numerical Simulation of Mesoscopic Seepage Field of Soil-rock Mixture Based on Lattice Boltzmann Method. Sci. Technol. Eng. 2019, 19, 235–241. [Google Scholar]
  18. Cai, P.C.; Que, Y.; Jiang, Z.L.; Yang, P.F. Lattice Boltzmann meso-seepage research of reconstructed soil based on the quartet structure generation set. Hydrogeol. Eng. Geol. 2022, 49, 33–42. [Google Scholar] [CrossRef]
  19. Jin, L.; Zeng, Y.W.; Cheng, T.; Li, J.J. Seepage characteristics of soil-rock mixture based on lattice Boltzmann method. Chin. J. Geotech. Eng. 2022, 44, 669–677. [Google Scholar] [CrossRef]
  20. Gao, J.; Xing, H.; Tian, Z.; Muhlhaus, H. Lattice Boltzmann modeling and evaluation of fluid flow in heterogeneous porous media involving multiple matrix constituents. Comput. Geosci. 2014, 62, 198–207. [Google Scholar] [CrossRef]
  21. Chen, T.; Yang, Y.; Zheng, H.; Wu, Z. Numerical determination of the effective permeability coefficient of soil–rock mixtures using the numerical manifold method. Int. J. Numer. Anal. Methods Géoméch. 2018, 43, 381–414. [Google Scholar] [CrossRef]
  22. Wang, T.; Yan, C.; Zheng, Y.; Jiao, Y.-Y.; Zou, J. Numerical study on the effect of meso-structure on hydraulic conductivity of soil-rock mixtures. Comput. Geotech. 2022, 146, 104726. [Google Scholar] [CrossRef]
  23. You, X.H. Stochastic structural model of soil rock mixture and its application. Chin. J. Rock Mech. Eng. 2002, 11, 1748. Available online: https://www.cnki.com.cn/Article/CJFDTOTAL-YSLX200211040.htm (accessed on 7 January 2023).
  24. Ding, X.; Shi, X.; Zhou, W.; Luan, B. Experimental Study on the Permeability of a Soil-Rock Mixture Based on the Threshold Control Method. Adv. Civ. Eng. 2019, 2019, 8987052. [Google Scholar] [CrossRef]
  25. Feng, Y.T.; Han, K.; Owen, D.R.J. Coupled lattice Boltzmann method and discrete element modelling of particle transport in turbulent fluid flows: Computational issues. Int. J. Numer. Methods Eng. 2007, 72, 1111–1134. [Google Scholar] [CrossRef]
  26. Succi, S. Lattice Boltzmann Equation for Fluid Dynamics and Beyond; Clarendon Press: Oxford, UK, 2001. [Google Scholar]
  27. Medley, E. The Engineering Characterization of Melanges and Similar Block-In-Matrix Rocks (Bimrocks). Ph.D. Thesis, University of California at Berkeley, San Francisco, CA, USA, 1994. Available online: https://www.researchgate.net/publication/35292215 (accessed on 15 January 2023).
  28. Yin, P.; Song, H.; Ma, H.; Yang, W.; He, Z.; Zhu, X. The modification of the Kozeny-Carman equation through the lattice Boltzmann simulation and experimental verification. J. Hydrol. 2022, 609, 127738. [Google Scholar] [CrossRef]
  29. Hager, A.; Kloss, C.; Pirker, S.; Goniva, C. Parallel Resolved Open Source CFD-DEM: Method, Validation and Application. J. Comput. Multiph. Flows 2014, 6, 13–27. [Google Scholar] [CrossRef]
  30. GB/T 50123-2019; Standard for Geotechnical Testing Method. Ministry of Water Resources of the People’s Republic of China, Ministry of Housing and Urban-Rural Development of the People’s Republic of China, State Administration of Market Supervision and Administration: Beijing, China, 2019. Available online: https://www.gb-gbt.cn/PDF.aspx/GBT50123-2019 (accessed on 25 January 2023).
  31. Potyondy, D.O.; Cundall, P.A. A bonded-particle model for rock. Int. J. Rock. Mech. Min. Sci. 2004, 41, 1329–1364. [Google Scholar] [CrossRef]
  32. Yang, B.; Jiao, Y.; Lei, S. A study on the effects of microparameters on macroproperties for specimens created by bonded particles. Eng. Comput. 2006, 23, 607–631. [Google Scholar] [CrossRef]
  33. Schöpfer, M.P.; Abe, S.; Childs, C.; Walsh, J.J. The impact of porosity and crack density on the elasticity, strength and friction of cohesive granular materials: Insights from DEM modelling. Int. J. Rock. Mech. Min. Sci. 2008, 46, 250–261. [Google Scholar] [CrossRef]
  34. Jin, L.; Cheng, T.; Zhang, Y.; Li, J. Three-dimensional lattice Boltzmann simulation of the permeability of soil-rock mixtures and comparison with other prediction models. Int. J. Numer. Anal. Methods Géoméch. 2021, 45, 1067–1090. [Google Scholar] [CrossRef]
  35. Sheikh, B.; Pak, A. Numerical investigation of the effects of porosity and tortuosity on soil permeability using coupled three-dimensional discrete-element method and lattice Boltzmann method. Phys. Rev. E 2015, 91, 053301. [Google Scholar] [CrossRef]
  36. Wang, P.F.; Li, C.H.; Ma, X.W.; Li, Z.J.; Liu, J.J.; Wu, Y.F. Experimental study of seepage characteristics of soil-rock mixture with different rock contents in fault zone. Rock Soil Mech. 2018, 39, 53–61. [Google Scholar] [CrossRef]
  37. Chen, Z.H.; Chen, S.J.; Chen, J.; Sheng, Q.; Min, H.; Hu, W. In-situ Double-Ring Infiltration Test of Soil-Rock Mixture. J. Yangtze River Sci. Res. Inst. 2012, 29, 52–56. Available online: http://119.78.100.198/handle/2S6PX9GI/14025 (accessed on 8 April 2023).
  38. Zhou, Z.; Fu, H.L.; Liu, B.C.; Tan, H.H.; Long, W.X. Orthogonal tests on permeability of soil-rock-mixture. Chin. J. Geotech. Eng. 2006, 28, 1134–1138. [Google Scholar]
  39. Bear, J. Dynamics of Fluids in Porous Media; Elsevier: New York, NY, USA, 1972. [Google Scholar] [CrossRef]
  40. Zhou, Z.; Sun, J.; Lai, Y.; Wei, C.; Hou, J.; Bai, S.; Huang, X.; Liu, H.; Xiong, K.; Cheng, S. Study on size effect of jointed rock mass and influencing factors of the REV size based on the SRM method. Tunn. Undergr. Space Technol. 2022, 127, 104613. [Google Scholar] [CrossRef]
  41. Walsh, S.D.; Burwinkle, H.; Saar, M.O. A new partial-bounceback lattice-Boltzmann method for fluid flow through heterogeneous media. Comput. Geosci. 2009, 35, 1186–1193. [Google Scholar] [CrossRef]
  42. Lautenschlaeger, M.P.; Weinmiller, J.; Kellers, B.; Danner, T.; Latz, A. Homogenized lattice Boltzmann model for simulating multi-phase flows in heterogeneous porous media. Adv. Water Resour. 2022, 170, 104320. [Google Scholar] [CrossRef]
Figure 1. Soil–rock mixture model and particle distribution rose. (a) SRM–1, n = 0.3642; (b) SRM–2, n = 0.4008; (c) SRM–3, n = 0.5060; (d) SRM–1 particle rose diagram; (e) SRM–2 particle rose diagram; (f) SRM–3 particle rose diagram.
Mathematics 11 01968 g001
Figure 2. D2Q9 model.
Mathematics 11 01968 g002
Figure 3. Model boundary conditions.
Mathematics 11 01968 g003
Figure 4. Segmentation type of model size. (a) random; (b) center, (c) top; (d) equal.
Mathematics 11 01968 g004
Figure 5. Cloud chart of Poiseuille flow velocity field.
Mathematics 11 01968 g005
Figure 6. Comparison of Poiseuille flow analytical value and LBM simulation value.
Mathematics 11 01968 g006
Figure 7. Relationship between resolution and permeability. (a) SRM−1; (b) SRM−2; (c) SRM−3.
Mathematics 11 01968 g007
Figure 8. Typical model display under different simulation testing conditions in SRM–1. (ad) S = 25 mm, (eh) S = 50 mm, (il) S = 75 mm, (mp) S = 100 mm; segmentation types are random, center, top, and equal.
Mathematics 11 01968 g008
Figure 9. Seepage field velocity cloud map of different segmentation types in SRM–1 (unit: cm/s). (ad) S = 25 mm, (eh) S = 50 mm, (il) S = 75 mm; segmentation types are random, center, top, and equal.
Mathematics 11 01968 g009
Figure 10. Relationship between segmentation types and average permeability. (a) SRM–1; (b) SRM–2; (c) SRM–3.
Mathematics 11 01968 g010
Figure 11. Seepage field velocity cloud map for different model feature sizes in SRM–1 (unit: cm/s). (aj) S = 10, 20, 30, 40, 50, 60, 70, 80, 90, 100 mm.
Mathematics 11 01968 g011
Figure 12. Streamline distribution of the velocity field for different model feature sizes in SRM–1. (aj): S = 10, 20, 30, 40, 50, 60, 70, 80, 90, 100 mm.
Mathematics 11 01968 g012
Figure 13. Relationship between model feature size and permeability. (a) SRM–1; (b) SRM–2; (c) SRM–3.
Mathematics 11 01968 g013
Figure 14. Relationship between feature length ratio and permeability. (a) S = 50 mm; (b) S = 80 mm; (c) S = 100 mm.
Mathematics 11 01968 g014
Figure 15. Relationship between soil/rock particle size feature ratio and permeability.
Mathematics 11 01968 g015
Figure 16. Seepage velocity distribution of different soil/rock particle size feature ratio models.
Mathematics 11 01968 g016
Figure 17. Relationship between soil–rock mixture structure and REV size. (a) Overall model of the soil–rock mixture; (b) REV model of the soil–rock mixture with different sizes.
Mathematics 11 01968 g017
Table 1. Size segmentation scheme of different SRM models.
ProjectsModelSegmentation TypeBasic InformationS (mm)Number of Test Conditions
ResolutionSRM–1/SRM–2/SRM–3r–10, r–20, r–30, r–40, r–50
r–60, r–70, r–80, r–90, r–100
10030
Segmentation typeSRM–1/SRM–2/SRM–3Random/Center/Top/Equalsj–25/jz–25/dd–25/df–2525225
sj–50/jz–50/dd–50/df–5050
sj–75/jz–75/dd–75/df–7575
sj–100/jz–100/dd–100/df–100100
Model feature sizeSRM–1/SRM–2/SRM–3Centerjz–10, jz–20, jz–30, jz–40, jz–50, jz–60, jz–70, jz–80, jz–90, jz–10010, 20, 30, 40, 50, 60, 70, 80, 90, 10030
Feature length ratioSRM–1/SRM–2/SRM–3
SRM–add
CenterF = 5, 6, 7, 8, 9, 10, 11, 12, 13, 14, 15, 16, 17, 18, 19, 2050, 80, 10048
Soil/rock particle size feature ratioSRM–1/SRM–2/SRM–3
SRM–add
CenterP = 0.1, 0.2, 0.3, 0.4,
0.5, 0.6, 0.7, 0.8, 0.9
809
Table 2. Parameters of validation examples.
l (mm)b (mm)t (s)μ (Pa·s)ρ (kg·m−3)T (°C)Δp (Pa)
50251.65×10−31.01×10−3100020.03.67 × 10−2
Disclaimer/Publisher’s Note: The statements, opinions and data contained in all publications are solely those of the individual author(s) and contributor(s) and not of MDPI and/or the editor(s). MDPI and/or the editor(s) disclaim responsibility for any injury to people or property resulting from any ideas, methods, instructions or products referred to in the content.

