Article

Using Data of a Lassa Fever Epidemic in Nigeria: A Mathematical Model Is Shown to Capture the Dynamics and Point to Possible Control Methods

by
Obiora Cornelius Collins
* and
Kevin Jan Duffy
Institute of Systems Science, Durban University of Technology, Durban 4000, South Africa
*
Author to whom correspondence should be addressed.
Mathematics 2023, 11(5), 1181; https://doi.org/10.3390/math11051181
Submission received: 17 January 2023 / Revised: 20 February 2023 / Accepted: 21 February 2023 / Published: 28 February 2023
(This article belongs to the Special Issue Mathematical Methods and Models in Epidemiology)

Abstract

:
Lassa fever is a deadly viral illness that is endemic in some parts of West Africa, including Nigeria. A deterministic model in the form of a non-linear system of differential equations is developed to analyse the dynamics and possible control of the disease. The model is tested by fitting it to data from Nigeria’s Lassa fever outbreak using a least-squares fitting routine and the model is shown to provide a reasonable fit to the data. Parameters representing various control measures in the model are estimated using the model fitting. Important epidemiological features of the model such as the basic reproduction number ( R 0 ) , the disease-free equilibrium, and the endemic equilibrium are determined and analysed. The disease-free equilibrium is shown to be asymptotically stable when R 0 < 1 . A bifurcation about R 0 = 1 was determined using the Center Manifold Theorem. Using numerical simulations of the model future dynamics of Lassa fever disease in Nigeria are predicted and the impact of control measures on the disease determined. The use of approved rodenticides is shown to be the most effective control followed by reducing person-to-person and rodent-to-person contacts, respectively. Isolation and treatment of infected individuals are shown to be less effective when compared with the other control measures.

1. Introduction

Lassa haemorrhagic fever, also known as Lassa fever, is a zoonotic, viral illness caused by Lassa virus [1]. A rodent, the multimammate rat (Mastomys natalensis) is the host of the virus. The primary transmission route of the disease to humans is through direct or indirect contact with food or objects contaminated with urine or faeces of infected multimammate rats. Other possible transmission routes include person-to-person transmission and rodent-to-rodent transmission [1,2,3].
Multimammate rats are abundant in rural areas of parts of some West African countries, including Nigeria, Sierra Leone, Liberia, and Guinea [1]. Consequently, Lassa fever has been endemic in these West African countries where the multimammate rats are present. The number of infections per year of Lassa fever is estimated between 100,000 and 300,000, with approximately 1% leading to death [2]. The disease predominates in rural areas where the host rodents are numerous. Low standards of living and poor sanitation in these rural communities attract these rodents and is the main reason why this disease is dominant in those areas.
Several preventive and control strategies have been recommended by the World Health Organization (WHO) for the possible elimination of Lassa fever from endemic communities. For instance, prevention of Lassa fever can be achieved through encouraging improved sanitation to reduce rodents entering residential homes [1]. Preventive measures such as proper storage of foodstuffs, maintaining environmental sanitation, and keeping cats can also reduce the disease especially, in Lassa fever endemic areas. Adequate precautions should be taken when handling Mastomys rats. Also, all animal products should be thoroughly cooked [1].
Early detection and proper treatment of Lassa fever are strongly recommended to reduce the fatality rate [1]. Isolation of infected persons and provision of treatment reduces the risk of person-to-person transmission in health care facilities. Early supportive care with rehydration and proper treatment improves the survival of infected persons. Health professionals dealing with infected persons must use approved safety measures to avoid contact with body fluids [1].
Lassa fever is currently endemic in Nigeria with hundreds of laboratory-confirmed cases per month during the annual peak, which is typically observed during the dry season (December–April). Approximately 90–95% of these people are infected by indirect contact with food or household items contaminated by the excreta of infected Mastomys rats or direct contact with these rats [1]. To reduce the spread of Lassa fever outbreaks in Nigeria, the Nigerian Government, through the Centre for Disease Control (NCDC), implemented several control measures to combat the disease which include the following: (i) Dissemination of guidelines for proper case management, and infection prevention and control (IPC); (ii) Enhanced surveillance activities for Lassa fever-affected areas to increase discovery of cases; (iii) Provision of special treatment centres for clinical management in affected areas; (iv) Increased laboratory capacity to ensure timely processing of samples; (v) Risk communications and community engagement activities through television, radio, print, social media, and other strategies; (vi) Implementation of a vector and environmental control response team in affected areas. Mathematical models in the form of differential equations have been successfully used to study the dynamics and control of several infectious diseases like Lassa fever. These models, such as the one considered here, can assist in existing control measures being more effective.
Even though Lassa fever appears in WHO’s lists of prioritizing diseases for research and development in emergency contexts, only a few theoretical studies are available [2]. Mathematical modelling is a theoretical approach that has been used extensively for the research and development of preventive measures for several infectious diseases [4,5,6,7]. Some findings on Lassa fever using mathematical models are summarized below. Ibrahim and Denes [2] used a mathematical model to study the seasonal influences on the dynamics of Lassa fever disease in Nigeria. Particularly, they investigated parameters that result in the periodic recurrence of Lassa fever in Nigeria. By using a mathematical model, Ref. [8] discovered that any control strategy that reduces rodent populations and the risk of transmission from rodents to humans will assist in achieving Lassa fever elimination in Nigeria. Musa et al. [9] used mechanistic modelling that takes into consideration quarantine, isolation, and hospitalization processes of Lassa fever epidemics in Nigeria from 2016–2019. Particularly, the similarities in the transmission dynamics driving three major Lassa fever outbreaks from 2016–2019 in Nigeria were outlined by their study. Ndenda et al. [10] used fractional-order dynamic modelling to study the influence of environmental viral load, interpersonal contact, and infected rodents on Lassa fever transmission dynamics. They discovered that using multiple interventions and control measures such as environmental sanitation, and reducing rodents-to-humans and humans-to-humans transmission can aid in reducing infections significantly. Mariën et al. [11] used a mathematical model to study the impact of rodents’ control to fight Lassa fever. They show that rodent vaccination is a strategy that could lead to Lassa virus elimination. Abdulhamid et al. [12] considered environmental transmission to study Lassa fever dynamics using a deterministic mathematical model. Their study reveals that the existence of backward bifurcation in the model makes the control of Lassa fever more difficult. Zhao et al. [13] used a mathematical model to investigate the effects of rainfall on Lassa fever epidemics in Nigeria by quantifying the association between reproduction number and rainfall for several locations in Nigeria. There is no doubt that these studies have made significant progress in understanding the dynamics and control of Lassa fever. However, as far as we are aware, none of those studies uses a mathematical model that incorporates multiple control measures together with real data to study and make predictions of the possible future dynamics of the Lassa fever epidemic in Nigeria. The purpose of this study is to fill this gap. The findings from this study should aid both researchers and policymakers in developing better control strategies for effective control and management of seasonal Lassa fever outbreaks in endemic areas.

2. Model Development

A mathematical model is formulated for Lassa fever disease that takes into consideration all the major factors that influence Lassa fever transmission dynamics and its control. For the model development, the following assumptions are made. To make the model more realistic, the possible control measures (i.e., treatment of infected persons, isolation of infected persons, use of rodenticides, and preventive measures) that are considered effective in fighting Lassa fever are incorporated in the model formulation. Since the Lassa fever virus is transmitted between two hosts (humans and rodents), two host populations are present in the model formulation. The total human population at time t, denoted by N h ( t ) , is partitioned into sub-populations: susceptible ( S ( t ) ) , infected ( I ( t ) ) , isolated ( P ( t ) ) , treated ( T ( t ) ) and recovered ( R ( t ) ) individuals (i.e., N h ( t ) = S ( t ) + I ( t ) + P ( t ) + T ( t ) + R ( t ) ). On the other hand, the total rodent population at time t, denoted by N r ( t ) , is divided into susceptible ( X ( t ) ) and infectious ( Y ( t ) ) rodents (i.e., N r ( t ) = X ( t ) + Y ( t ) ). A susceptible-infected model only is used for the dynamics of the rodent population because Mastomys rats infected with the Lassa virus do not become ill, but they can shed the virus in their urine and faeces [14].
The dynamics across each of the subpopulations are captured in the model development as follows. The transmission of Lassa fever can occur through human-to-human, rodent-to-human, human-to-rodent or rodent-to-rodent transmissions [2]. Susceptible individuals may proceed from the susceptible human class to the infected class upon contracting the disease through human-to-human or rodent-to-human transmission. Infected individuals are either moved to the isolated class for treatment in the treatment class or proceed directly to the treatment class. Treated individuals proceed to the recovered/temporally immune class upon recovery. Recovered individuals return to the susceptible class as their immunity relapses. Control measures that can lead to a reduction in human-to-human, rodent-to-human, human-to-rodent, and rodent-to-rodent transmission are represented in the model as reduction parameters. The use of approved rodenticides is another control measure that is present in the model as a rate of rodent death due to this control. Based on these assumptions, the model for the dynamics and control of Lassa fever is presented here:
d S ( t ) d t = Λ h ( 1 c h h ) β h h I ( t ) N h ( t ) S ( t ) ( 1 c r h ) β r h Y ( t ) N r ( t ) S ( t ) μ S ( t ) + ω R ( t ) , d I ( t ) d t = ( 1 c h h ) β h h I ( t ) N h ( t ) S ( t ) + ( 1 c r h ) β r h Y ( t ) N r ( t ) S ( t ) ( σ + ν + μ + δ ) I ( t ) , d P ( t ) d t = σ I ( t ) ( ν + δ + μ ) P ( t ) , d T ( t ) d t = ν I ( t ) + ν P ( t ) ( γ + μ + η ) T ( t ) , d R ( t ) d t = γ T ( t ) ( ω + μ ) R ( t ) , d X ( t ) d t = Λ r ( 1 c r r ) β r r Y ( t ) N r ( t ) X ( t ) ( 1 c h r ) β h r I ( t ) N h ( t ) X ( t ) ( ξ + ρ ) X ( t ) , d Y ( t ) d t = ( 1 c r r ) β r r Y ( t ) N r ( t ) X ( t ) + ( 1 c h r ) β h r I ( t ) N h ( t ) X ( t ) ( ξ + ρ ) Y ( t ) .
The meaning of variables and parameters of model (1) can be found in Table 1 and Table 2, respectively.

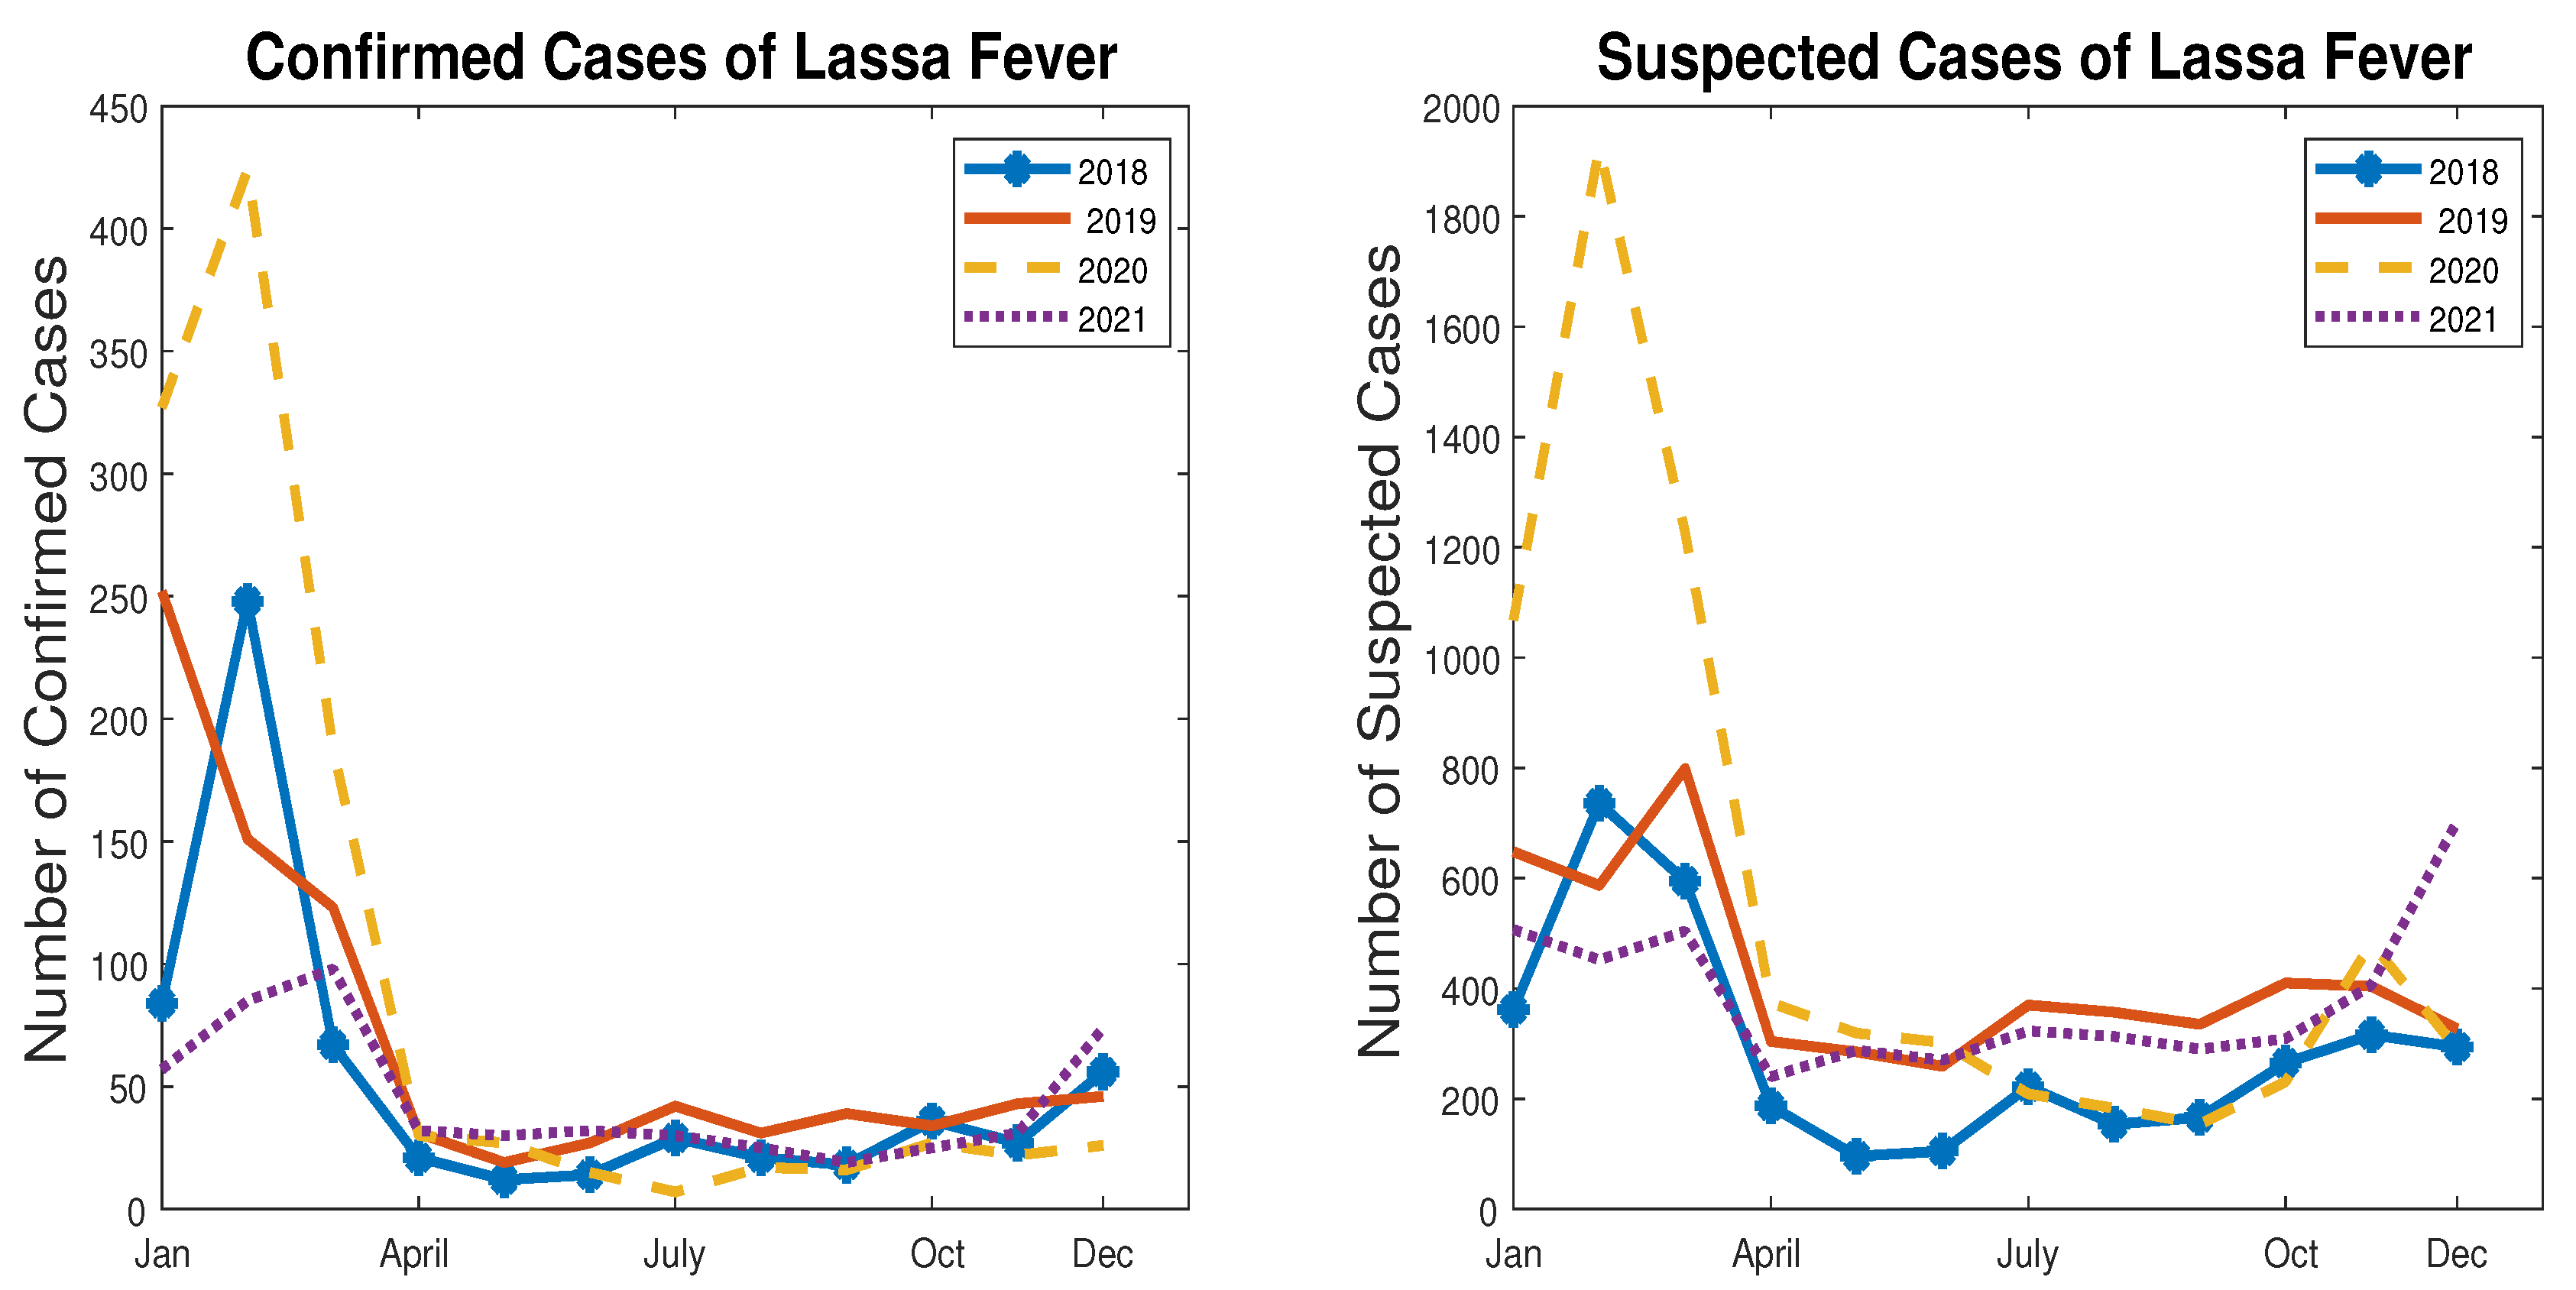
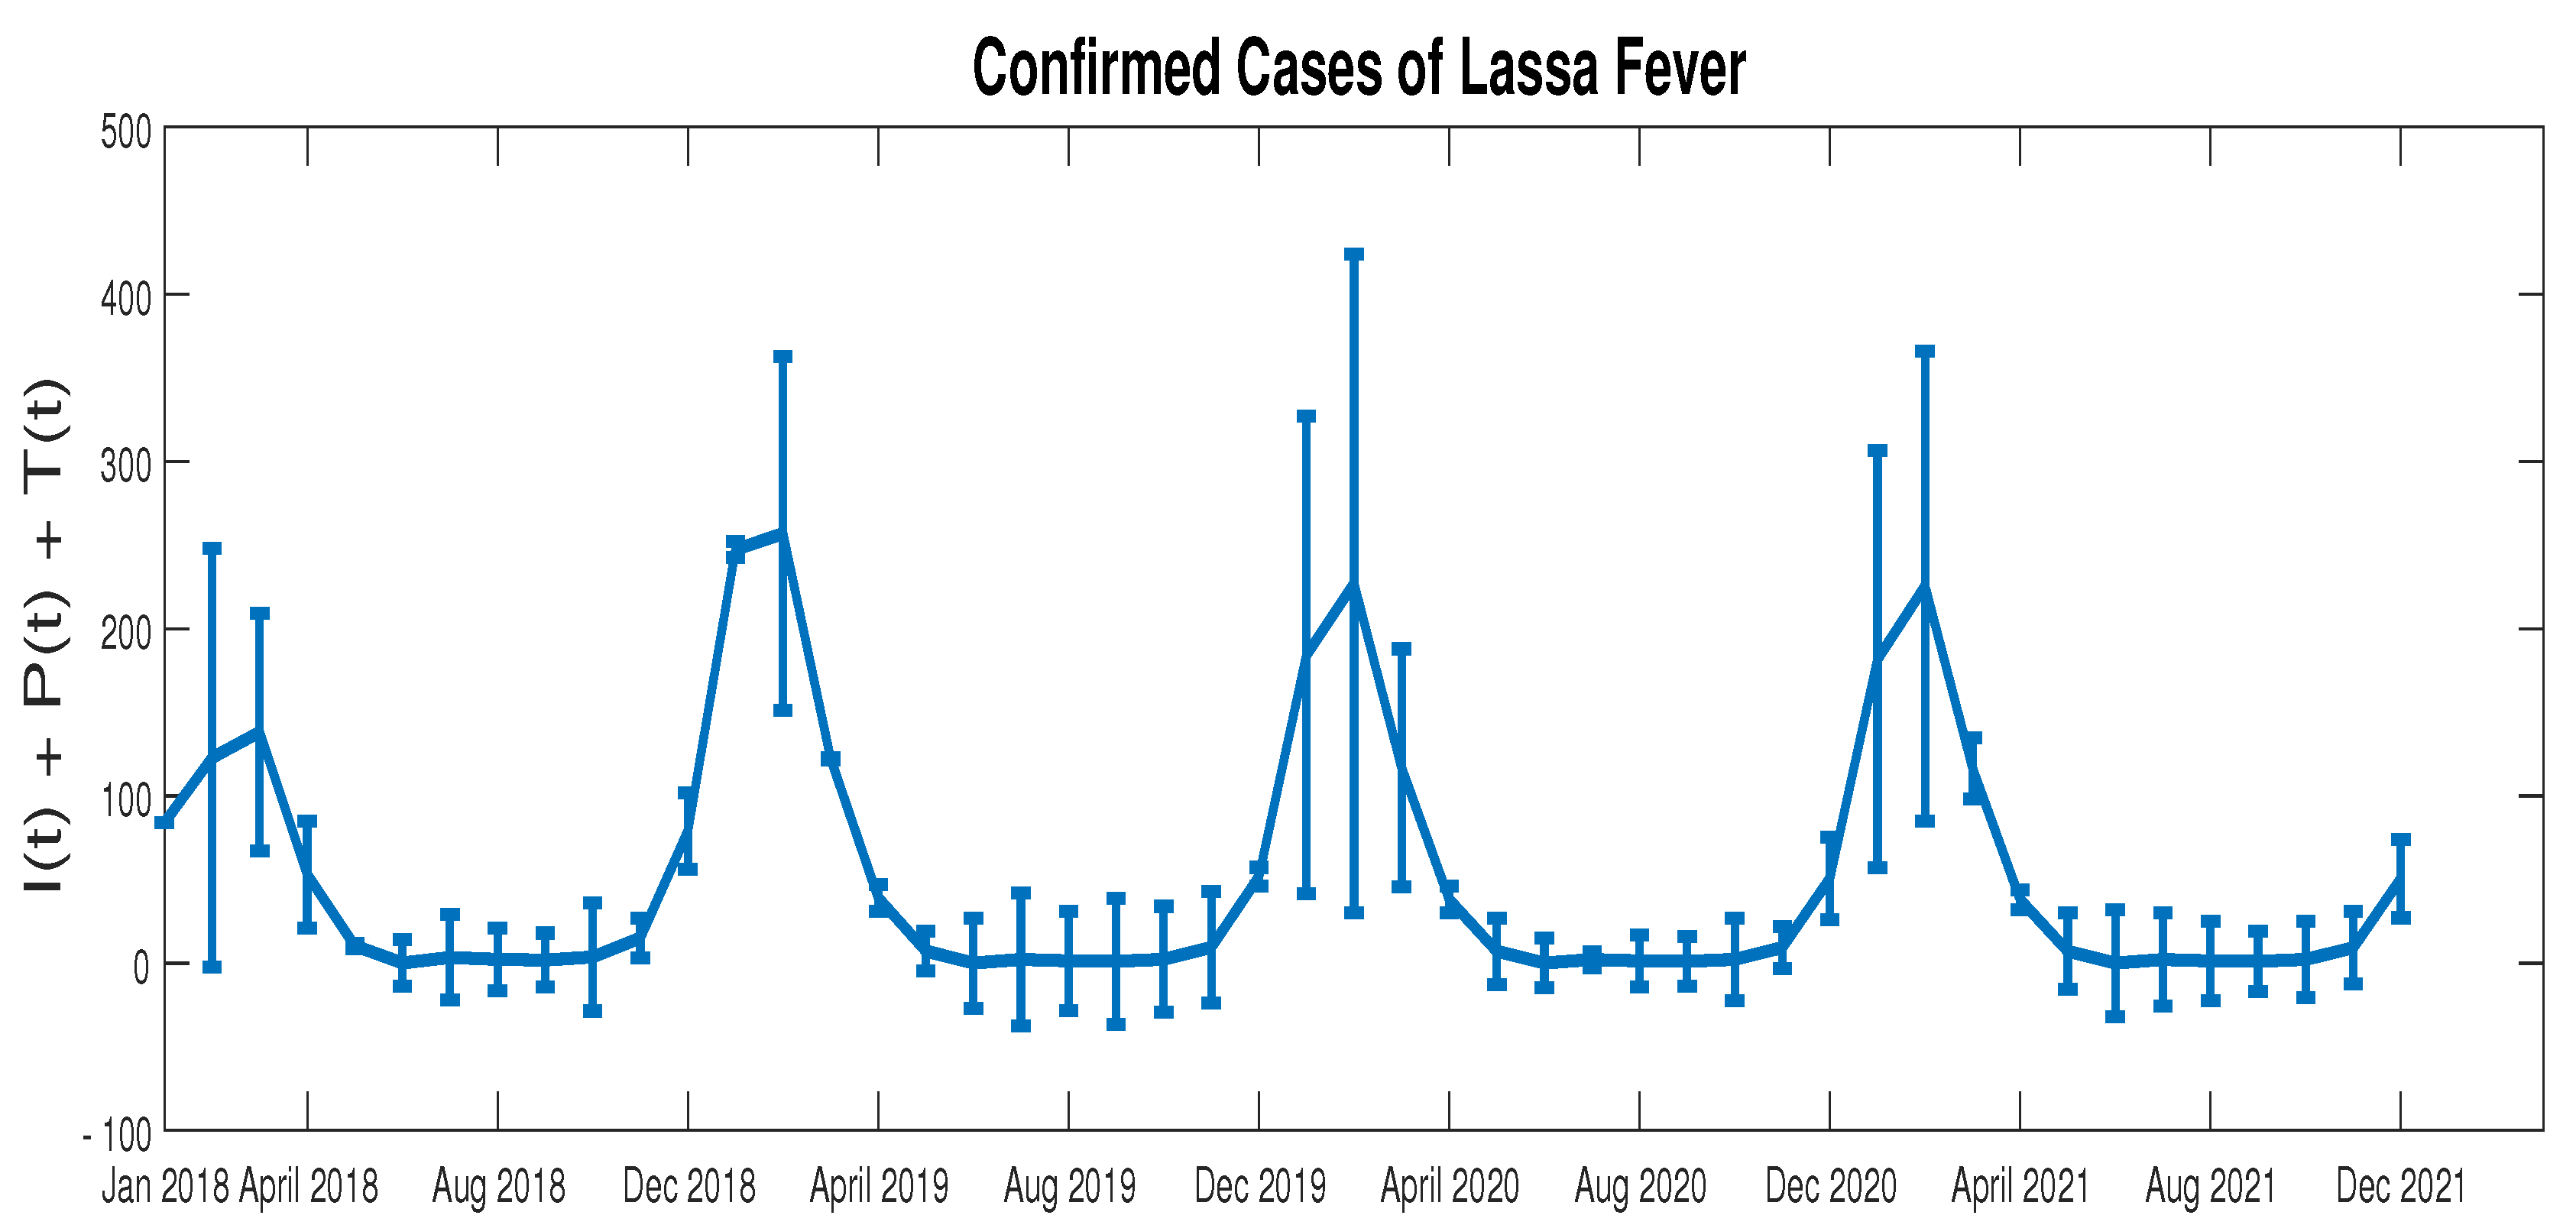
3. Validity of the Model Using Empirical Data of a Lassa Fever Outbreak in Nigeria

From 2018 until now, Nigeria has recorded its highest annual incidences of Lassa fever [15,16]. Statistics from the Nigeria Centre for Disease Control (NCDC) present the following data: 633 confirmed cases of Lassa fever in 2018, 810 in 2019, 1189 in 2020, and 510 in 2021 [16]. This current situation has prompted national and international healthcare mobilization and raised concerns about the ongoing Lassa fever outbreak [15]. In this section, the data are used to explore how effective (1) is in modelling Lassa fever outbreaks in Nigeria.

Model Fitting and Parameter Estimation

The data sets used to fit the model were extracted from the Nigeria Centre for Disease Control and Prevention (NCDC) website [16]. The data provide comprehensive information on the number of confirmed and suspected cases of Lassa fever in Nigeria from 2018 to 2022. The model was fit to this data using a least-squares fitting routine. Parameters used in the model are estimated from existing literature and parameters representing the various control measures are estimated using the model fitting. Confirmed cases and suspected cases of Lassa fever in Nigeria from 2018 to 2021 extracted from the NCDC data set are presented in Figure 1. A suspected case of Lassa fever is defined as any individual with at least one of the following symptoms: malaise, fever, headache, sore throat, cough, nausea, vomiting, diarrhoea, myalgia, chest pain, hearing loss etc. [16]. On the other hand, a confirmed Lassa fever case is defined as any suspected case with laboratory confirmation [16].
The data are presented yearly for visualization of the seasonality of the Lassa fever dynamics in Nigeria. From the figure, it is easily observed that the annual peak of Lassa fever cases (confirmed and suspected cases) is typical during the dry season (December–April). Also, both the confirmed and suspected cases of Lassa fever have similar trajectories in Figure 1. So either of them can be used to predict the future dynamics of Lassa fever in Nigeria. However, in this study, we shall consider the confirmed case data in our analysis.
In fitting model (1) to the data, the following assumptions are made. The confirmed cases comprise the following: infected individuals I ( t ) , isolated individuals P ( t ) , and treated individuals T ( t ) . The transmission rates β h h , β h r , β r h , β r r , and the recruitment rate of susceptible rodents through birth Λ r are multiplied by a seasonality factor ( 1 + cos ( π t 6 + 0.5 ) ) to account for the seasonal pattern observed in the data [2,9,15,16,17]. For fitting the model, we consider parameter values from the literature (3). The units of most of the parameter values in Table 3 are per day, but all parameters were converted to units per month for the numerical simulations. Other parameters, including those representing various control measures, are estimated using the least squared fitting method and are c h h = 0.1468 , c r h = 0.9999 , σ = 0.01097 month−1, ν = 0.001066 month−1, ρ = 1.2244 month−1, c h r = 0.6951 , and c r r = 0.000001179 . Results of the model fitting are given in Figure 2. Overall, the R-squared value for this fit is low (0.567) due to high fluctuations in seasons where the disease is more prevalent (2). However, the model is adequate for the purposes of this study where overall trends are compared for assessing the impacts of the different control measures. The model considered in this study is a set of non-linear ordinary differential equations that have been used previously to fit infectious disease outbreaks such as Lassa fever [9].

4. Model Analyses

The dynamics of model (1) are investigated by means of dynamical system analysis supported with numerical simulations. The mathematical analyses, presented in this section, using various mathematical techniques, enable the determination of epidemiological trends in the model dynamics. For instance, the stability analysis of the model about the disease-free equilibrium is analysed by linearizing the model about its equilibrium point to determine the short-term dynamics of the model. Also, bifurcation analysis is presented using the Centre Manifold Theorem to determine the dynamics when the basic reproduction number crosses unity. The following simplifications are used for the analysis of model (1): d 1 = σ + ν + μ + δ , d 2 = ν + δ + μ , d 3 = γ + μ + η , d 4 = ω + μ , and d 5 = ξ + ρ .

4.1. Stability Analysis

The disease-free equilibrium (DFE) of model (1), the steady-state solution of the model in the absence of Lassa fever disease, is calculated by setting the right-hand sides of model (1) to zero and simultaneously solving the equation for this case. The resulting DFE of model (1) is
( S 0 , I 0 , P 0 , T 0 , R 0 , X 0 , Y 0 ) = Λ h μ , 0 , 0 , 0 , 0 , Λ r d 5 , 0 .
The basic reproduction number is an important epidemiological quantity used in estimating the ability of a new pathogen to spread. The basic reproduction number ( R 0 ) of model (1) is calculated using the next-generation matrix method [20] and is given by
R 0 = R h h + R r r + ( R h h + R r r ) 2 + 4 ( R r h R h r R h h R r r ) 2 ,
where R h h = ( 1 c h h ) β h h d 1 , R r r = ( 1 c r r ) β r r d 5 , R r h = ( 1 c r h ) β r h S 0 d 5 X 0 , and R h r = ( 1 c h r ) β h r X 0 d 1 S 0 . The quantities R h h , R h r , R r h and R r r represent contributions to the basic reproduction number from the human-to-human, rodent-to-human, human-to-rodent and rodent-to-rodent transmissions, respectively. Epidemiologically, if R 0 < 1 , the disease is likely to die out and if R 0 > 1 , the disease can persist [4,20]. Thus, implementing control measures that will keep R 0 below unity is an important target of the epidemiologist for improving the chances of achieving disease eradication [4,5,6,20].
Let R 0 * = R r h R h r ( 1 R h h ) ( 1 R r r ) . By algebraic calculations, it is easy to show that
R 0 = 1 R 0 * = 1 .
The essence of establishing this relationship is because of the role R 0 * will play in our subsequent analyses.
Theorem 1.
For R h h < 1 and R r r < 1 , the DFE of model (1) is locally stable if R 0 * < 1 .
The proof of this theorem is given in the Appendix A. Mathematically, this suggests that Lassa fever disease could be eliminated if the initial population sizes of infected humans and rodents are within some neighbourhood of the DFE (2) provided that R h h < 1 , R r r < 1 , and R 0 * < 1 .

4.2. Existence of Lassa Fever Disease Endemic Equilibrium

The existence of the Lassa fever endemic equilibrium (EE) for model (1) is investigated in this section. The EE for model (1) denoted by
E * = ( S * , I * , P * , T * , R * , R * , Y * )
is the steady-state solution of model (1) in the presence of Lassa fever disease. The existence of EE is summarized in Theorem 2 below.
Theorem 2.
For R h h < 1 and R r r < 1 , the Lassa fever model (1) has at least one endemic equilibrium whenever R 0 * > 1 .
The proof of Theorem 2 is given in the Appendix B. The existence of endemic equilibrium for model (1) shows that it is possible for Lassa fever to be endemic if the endemic equilibrium is proved to be stable whenever R 0 * > 1 . The direction of bifurcation about R 0 = 1 for model (1) can give some insight on the conditions under which Lassa fever can be endemic or not in a system.

4.3. Bifurcation Analysis

The quantity R 0 is often a bifurcation parameter. The bifurcation about R 0 = 1 for model (1) is determined using Center Manifold Theory as described in [21]. This result of the bifurcation analysis is summarized in the theorem below.
Theorem 3.
Lassa fever model (1) undergoes a forward bifurcation at R 0 = 1 , whenever h 2 < h 3 + h 4 + h 5 .
The proof of Theorem 2 is given in the Appendix C. Epidemiologically, if model (1) undergoes a forward bifurcation at R 0 = 1 , it implies that reducing the basic reproduction number below unity is sufficient for complete eradication of Lassa fever. Therefore, determining the possible control measures that will keep the basic reproduction number below unity is crucial for the complete eradication of Lassa fever based on our model formulation. In the next section, numerical simulations are considered to investigate the long-term dynamics of model (1) and the impact of Lassa fever control measures using the previous Lassa fever outbreaks in Nigeria as a case study.

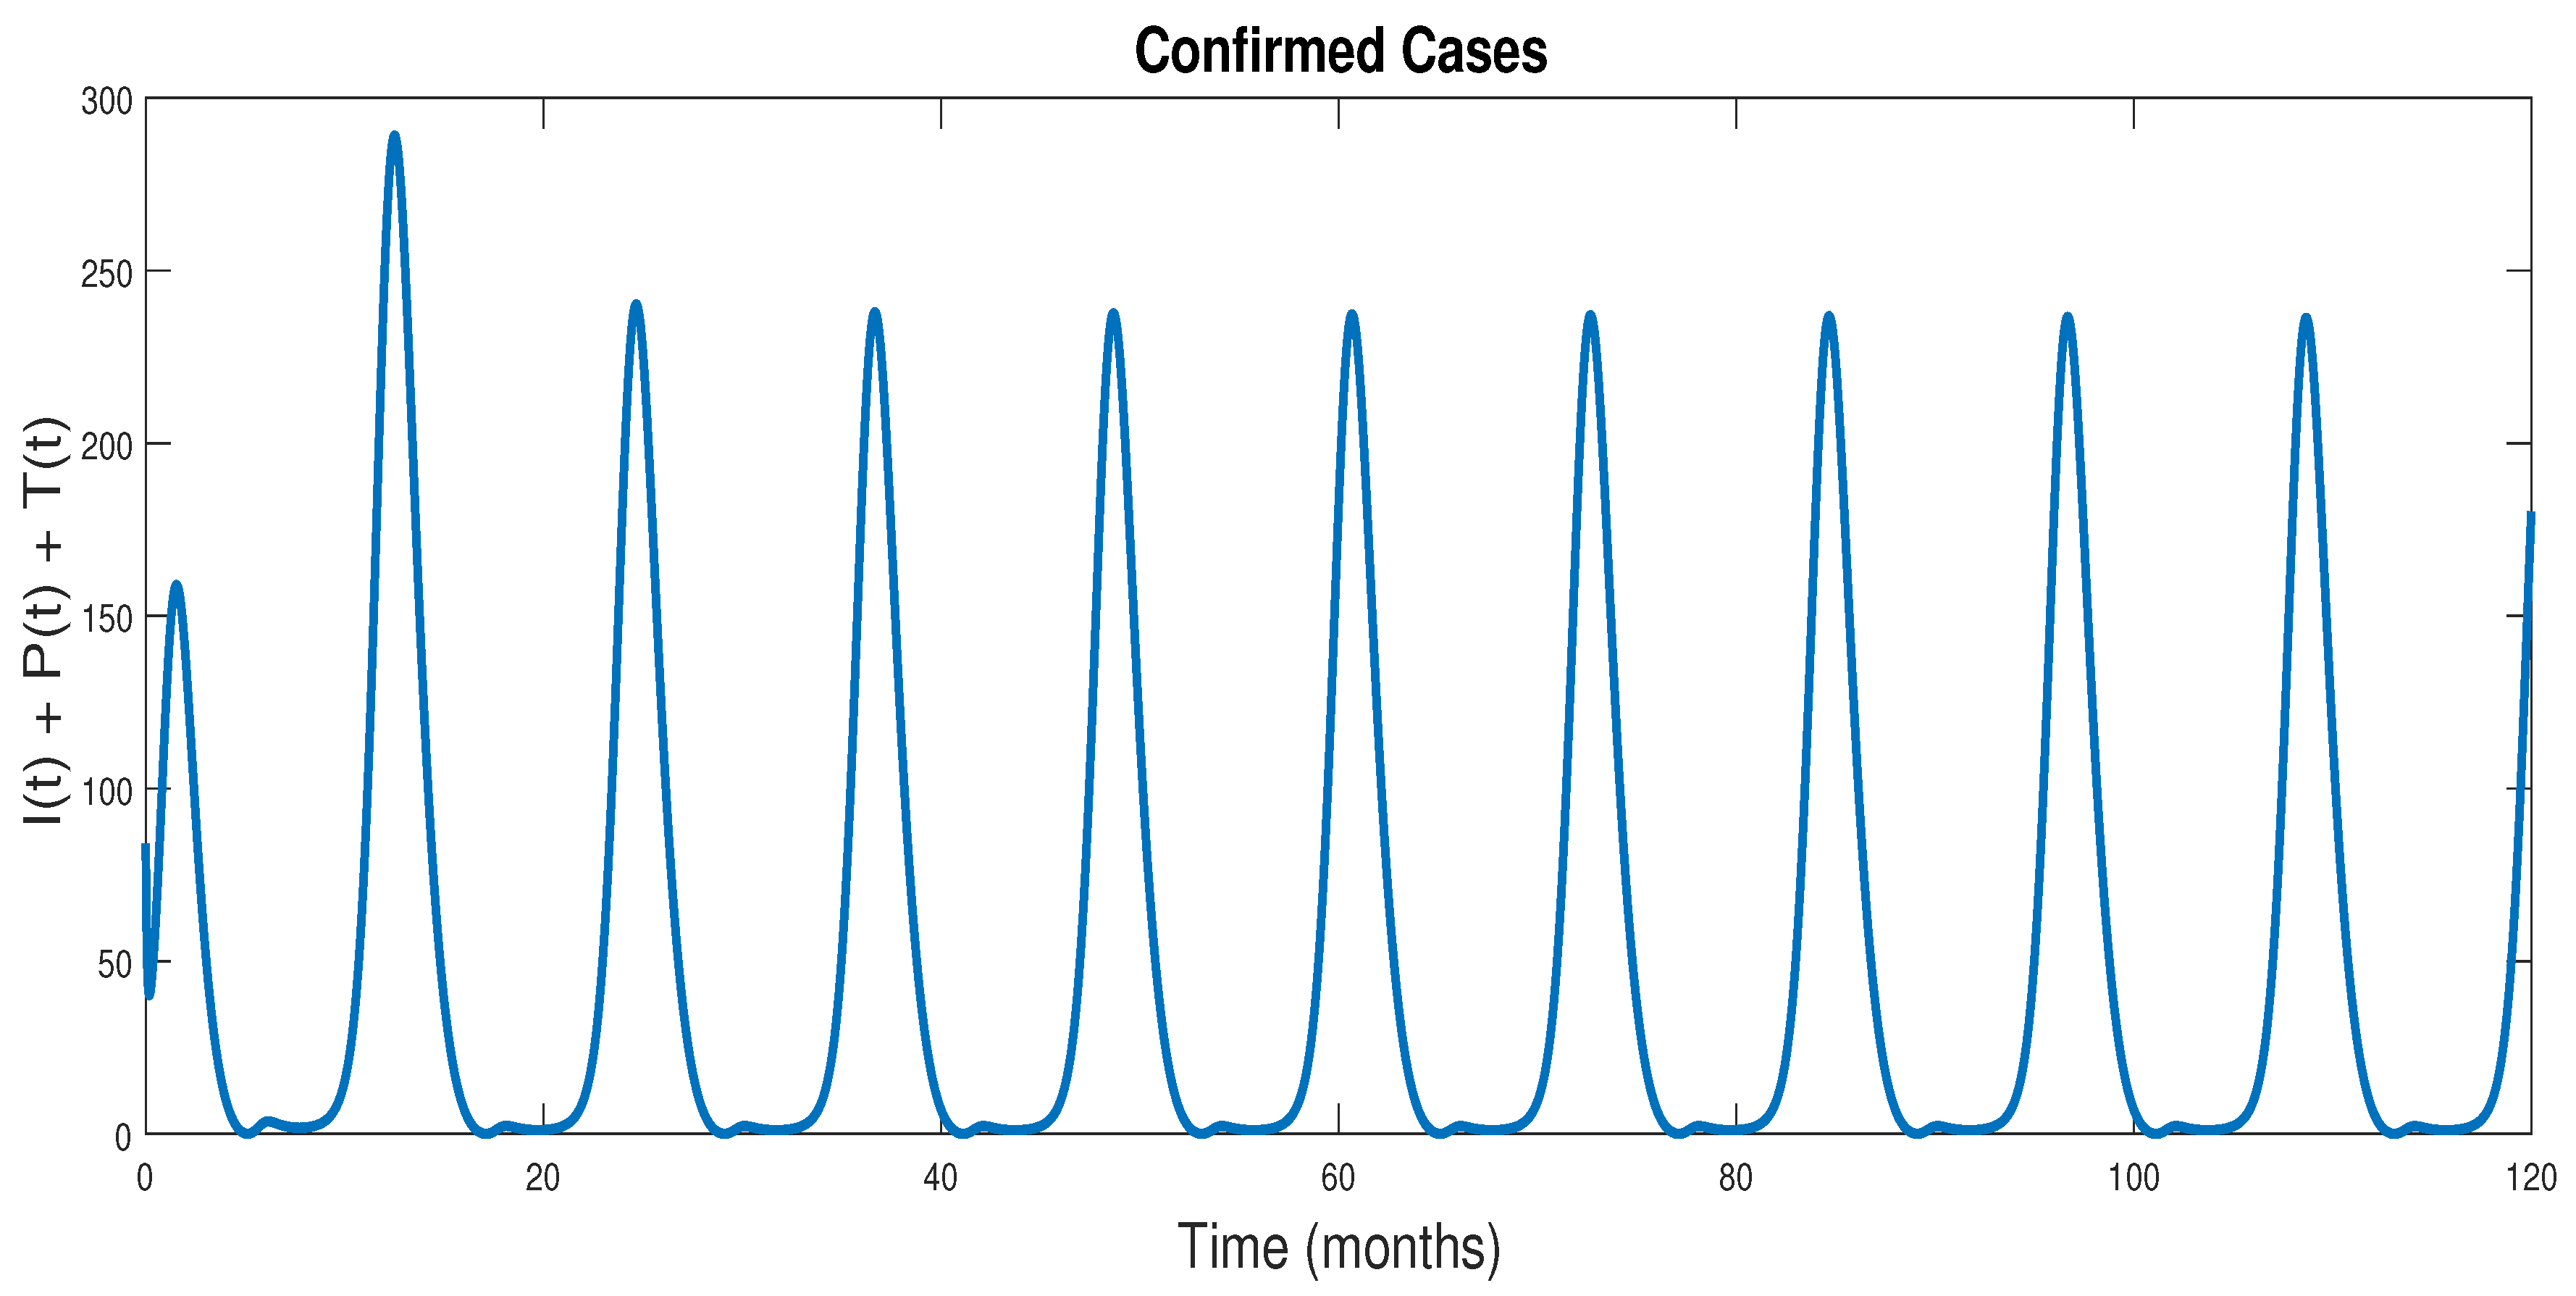
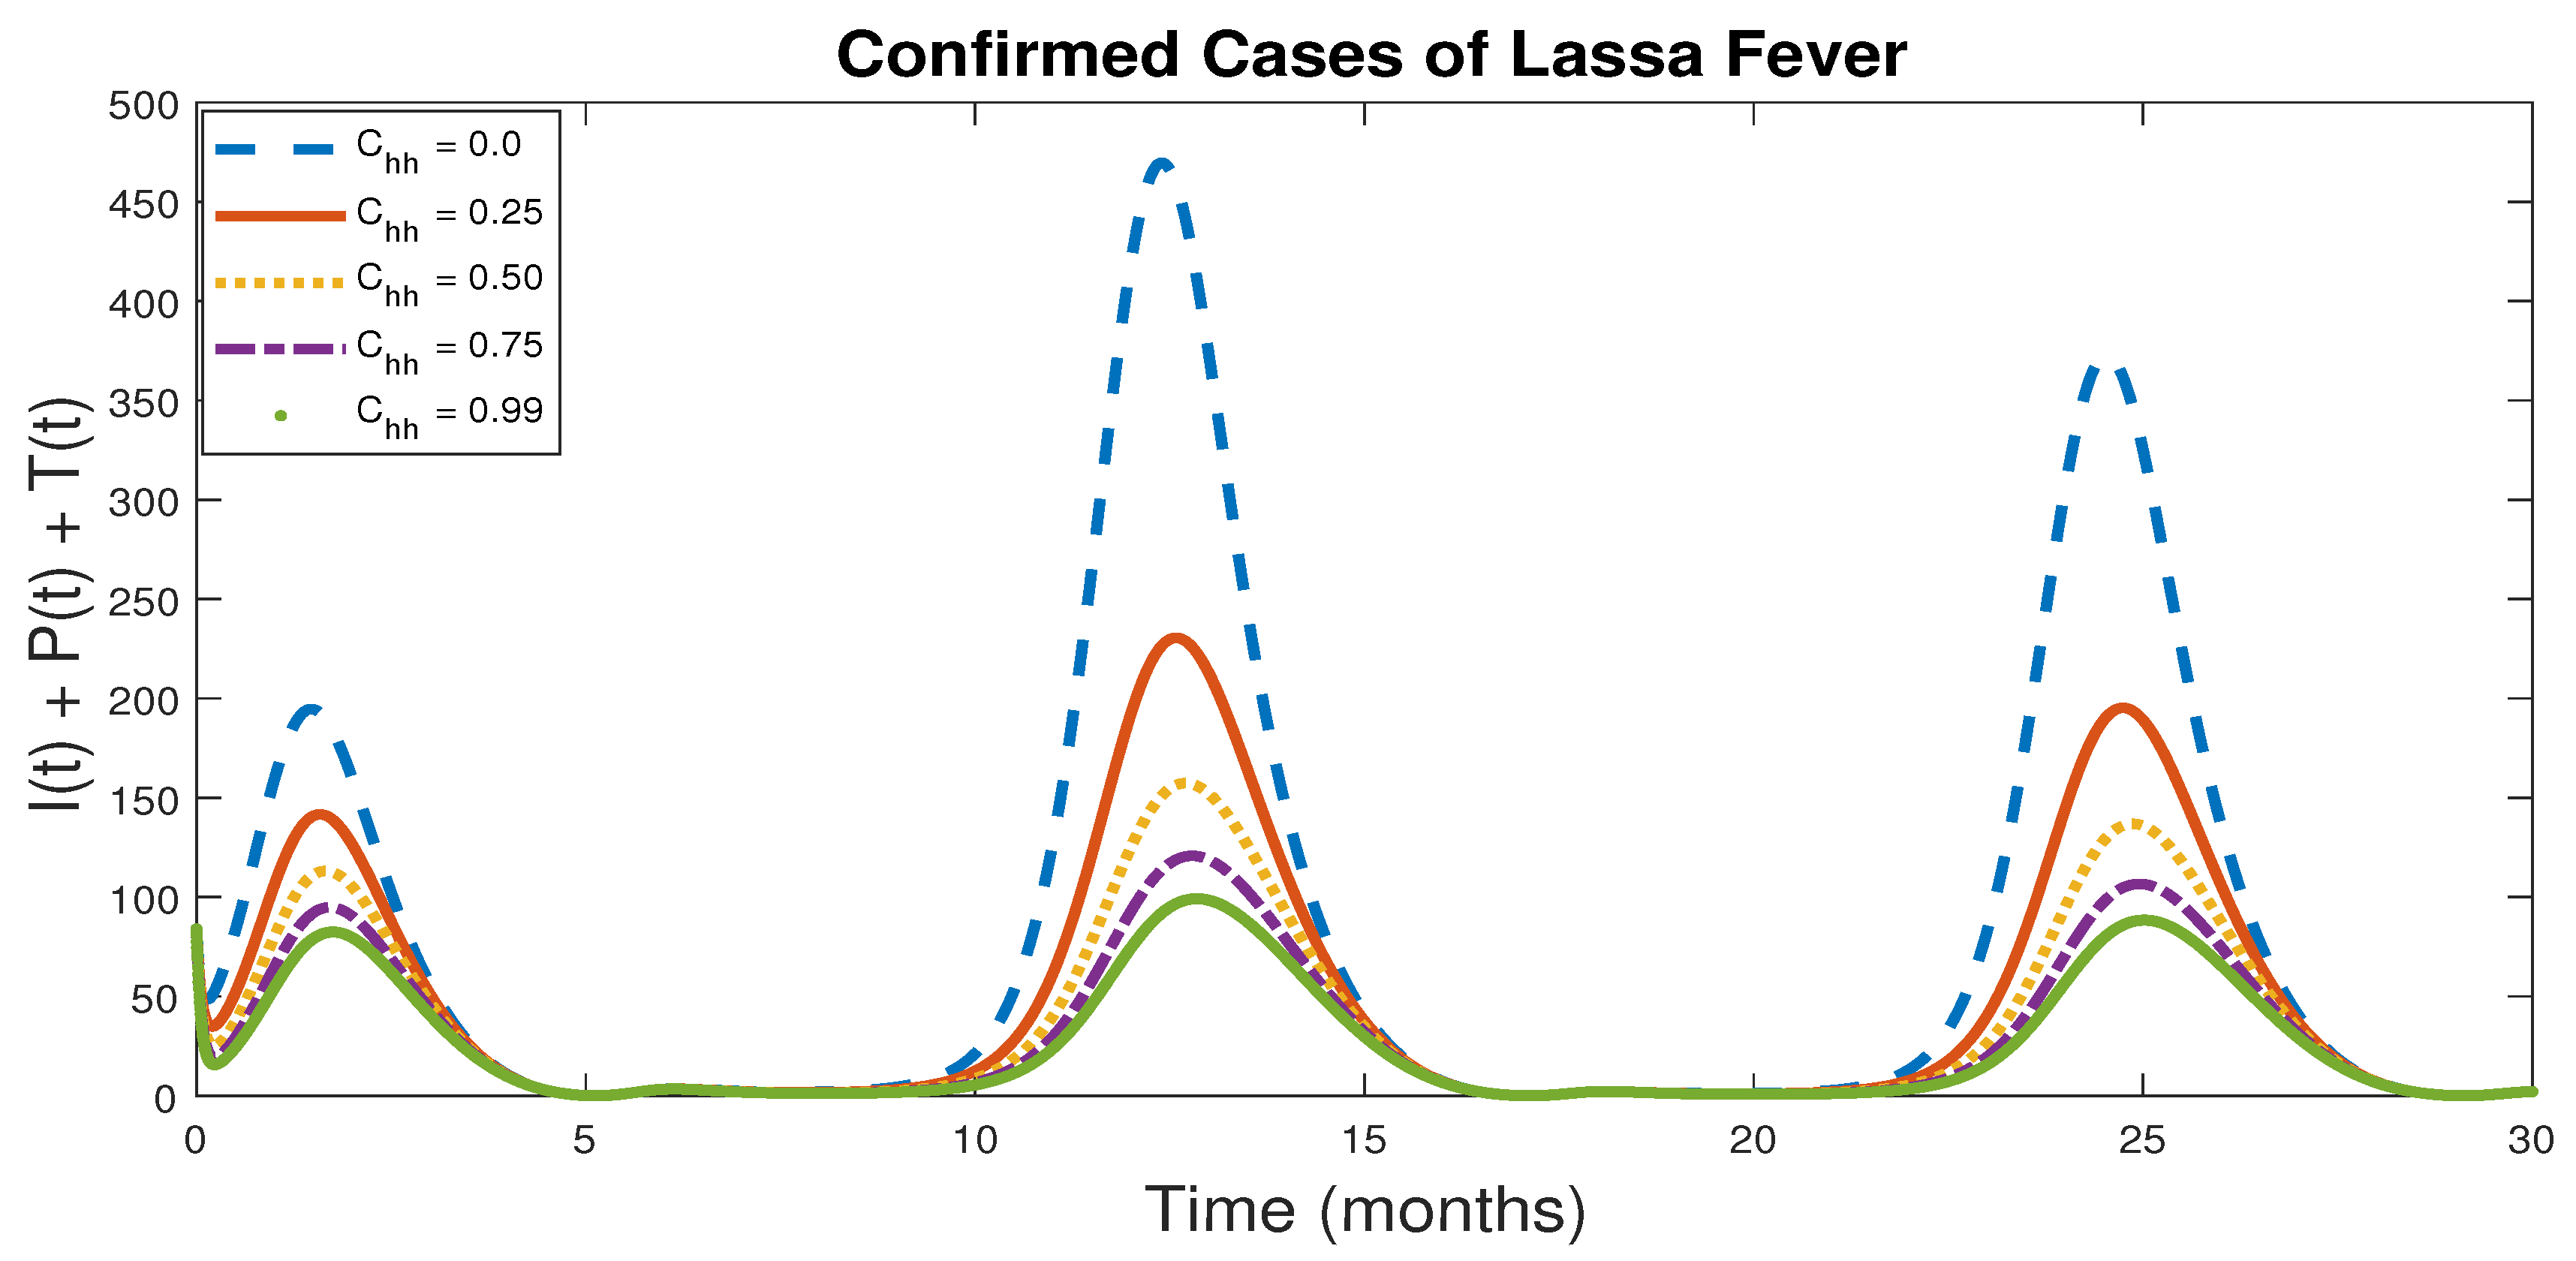
5. Numerical Example: A Case Study of Lassa Fever Outbreak in Nigeria

Using the parameter values estimated from fitting the model to the data, the basic reproduction number R 0 for Lassa fever is calculated to be R 0 = 1.1868 . This result shows that Lassa fever is likely to remain endemic in Nigeria for many years unless effective control measures are introduced that keep the basic reproduction number below unity.
Using these estimated parameter values, the possible long-term dynamics of Lassa fever in Nigeria are predicted as shown in Figure 3.
Figure 3 is a graphical illustration of the possible long-term dynamics of the Lassa fever outbreak in Nigeria using model (1). The figure, which is for a duration of 120 months (10 years), accurately captures the seasonal periodic dynamics of the Lassa fever outbreak in Nigeria. This suggests that seasonal outbreaks of Lassa fever are expected to continue in Nigeria for a long time. Therefore, effective control intervention strategies are highly recommended, especially during the Lassa fever disease annual peak (December to April) for the possible elimination of the disease.

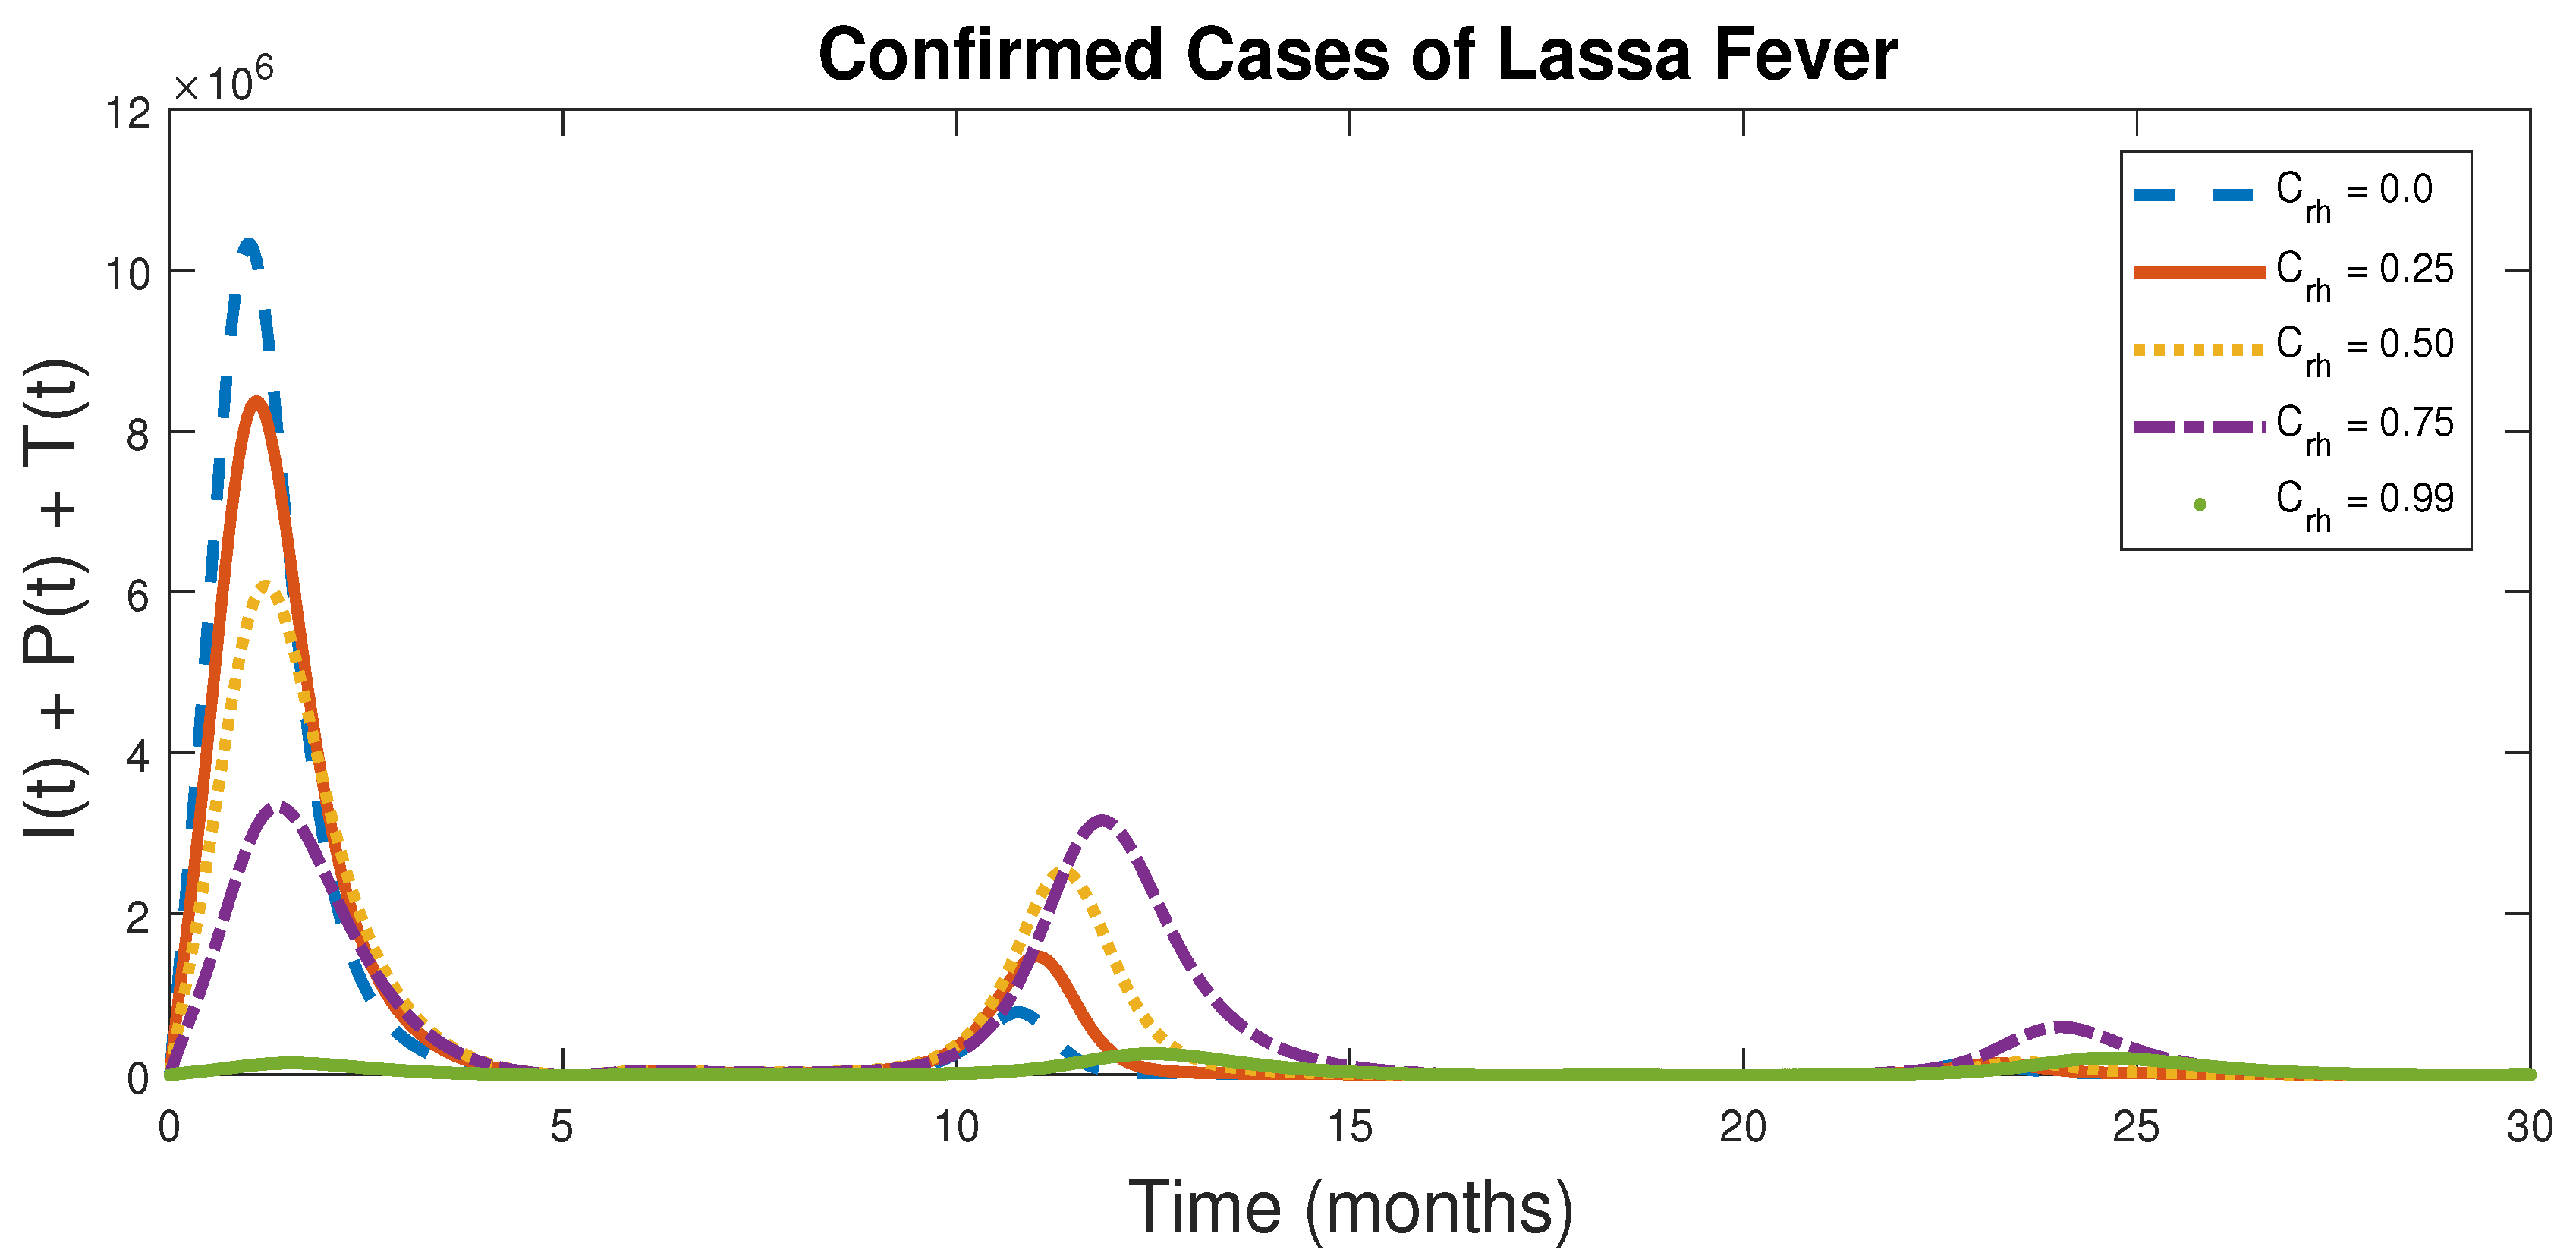
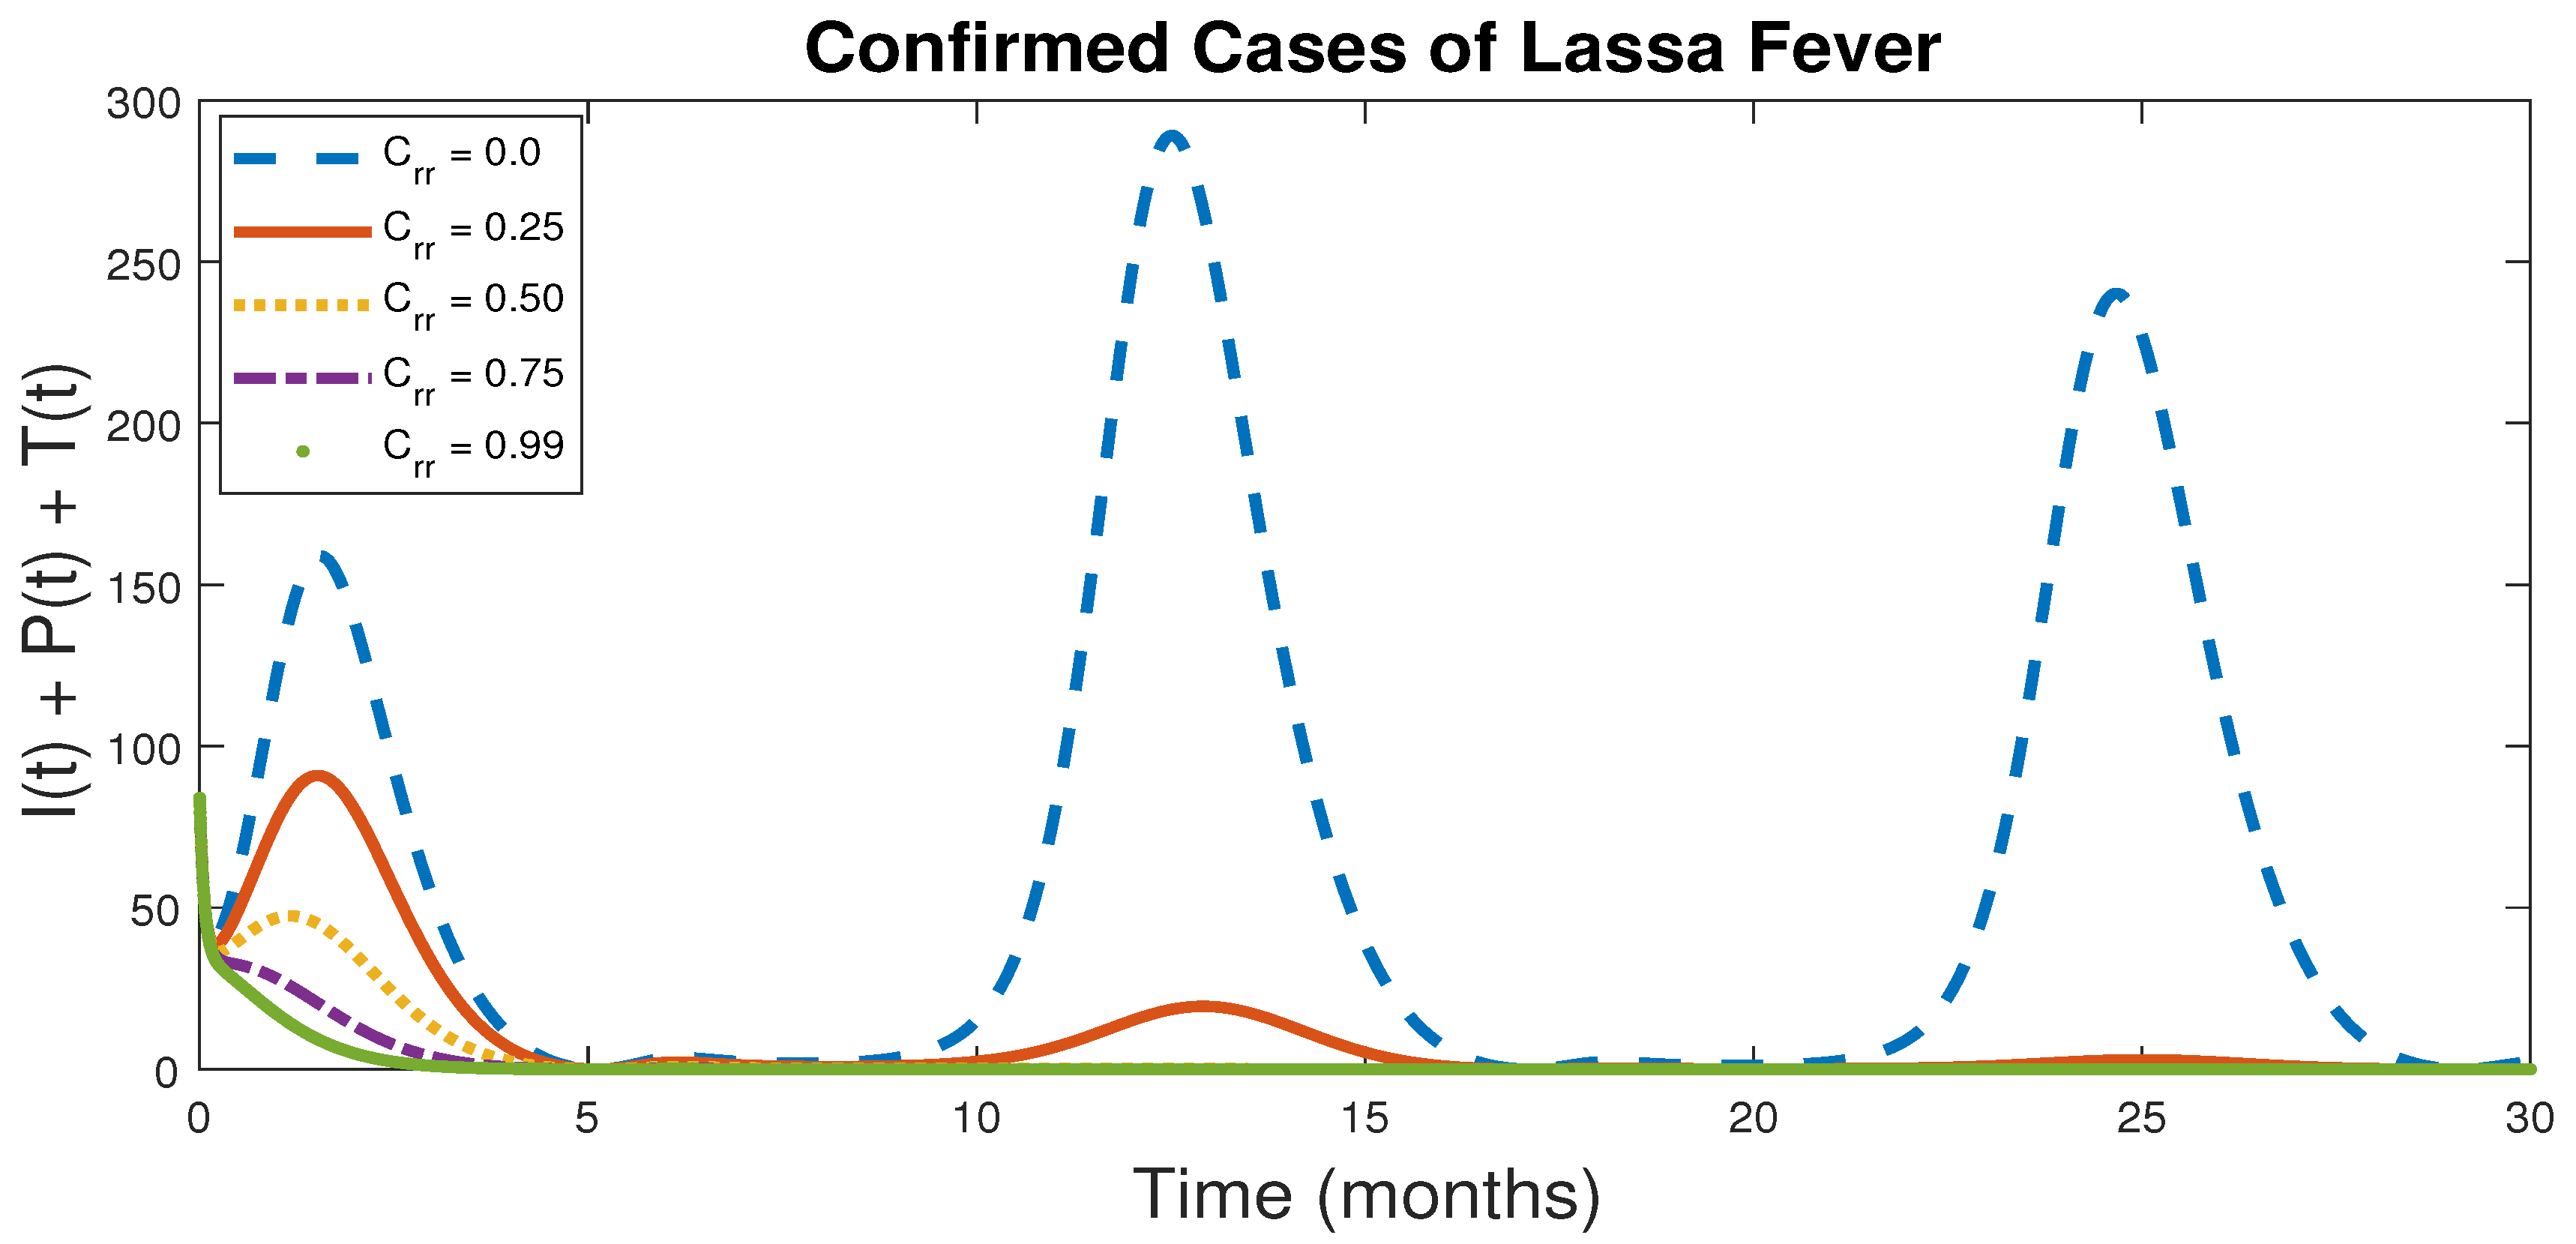
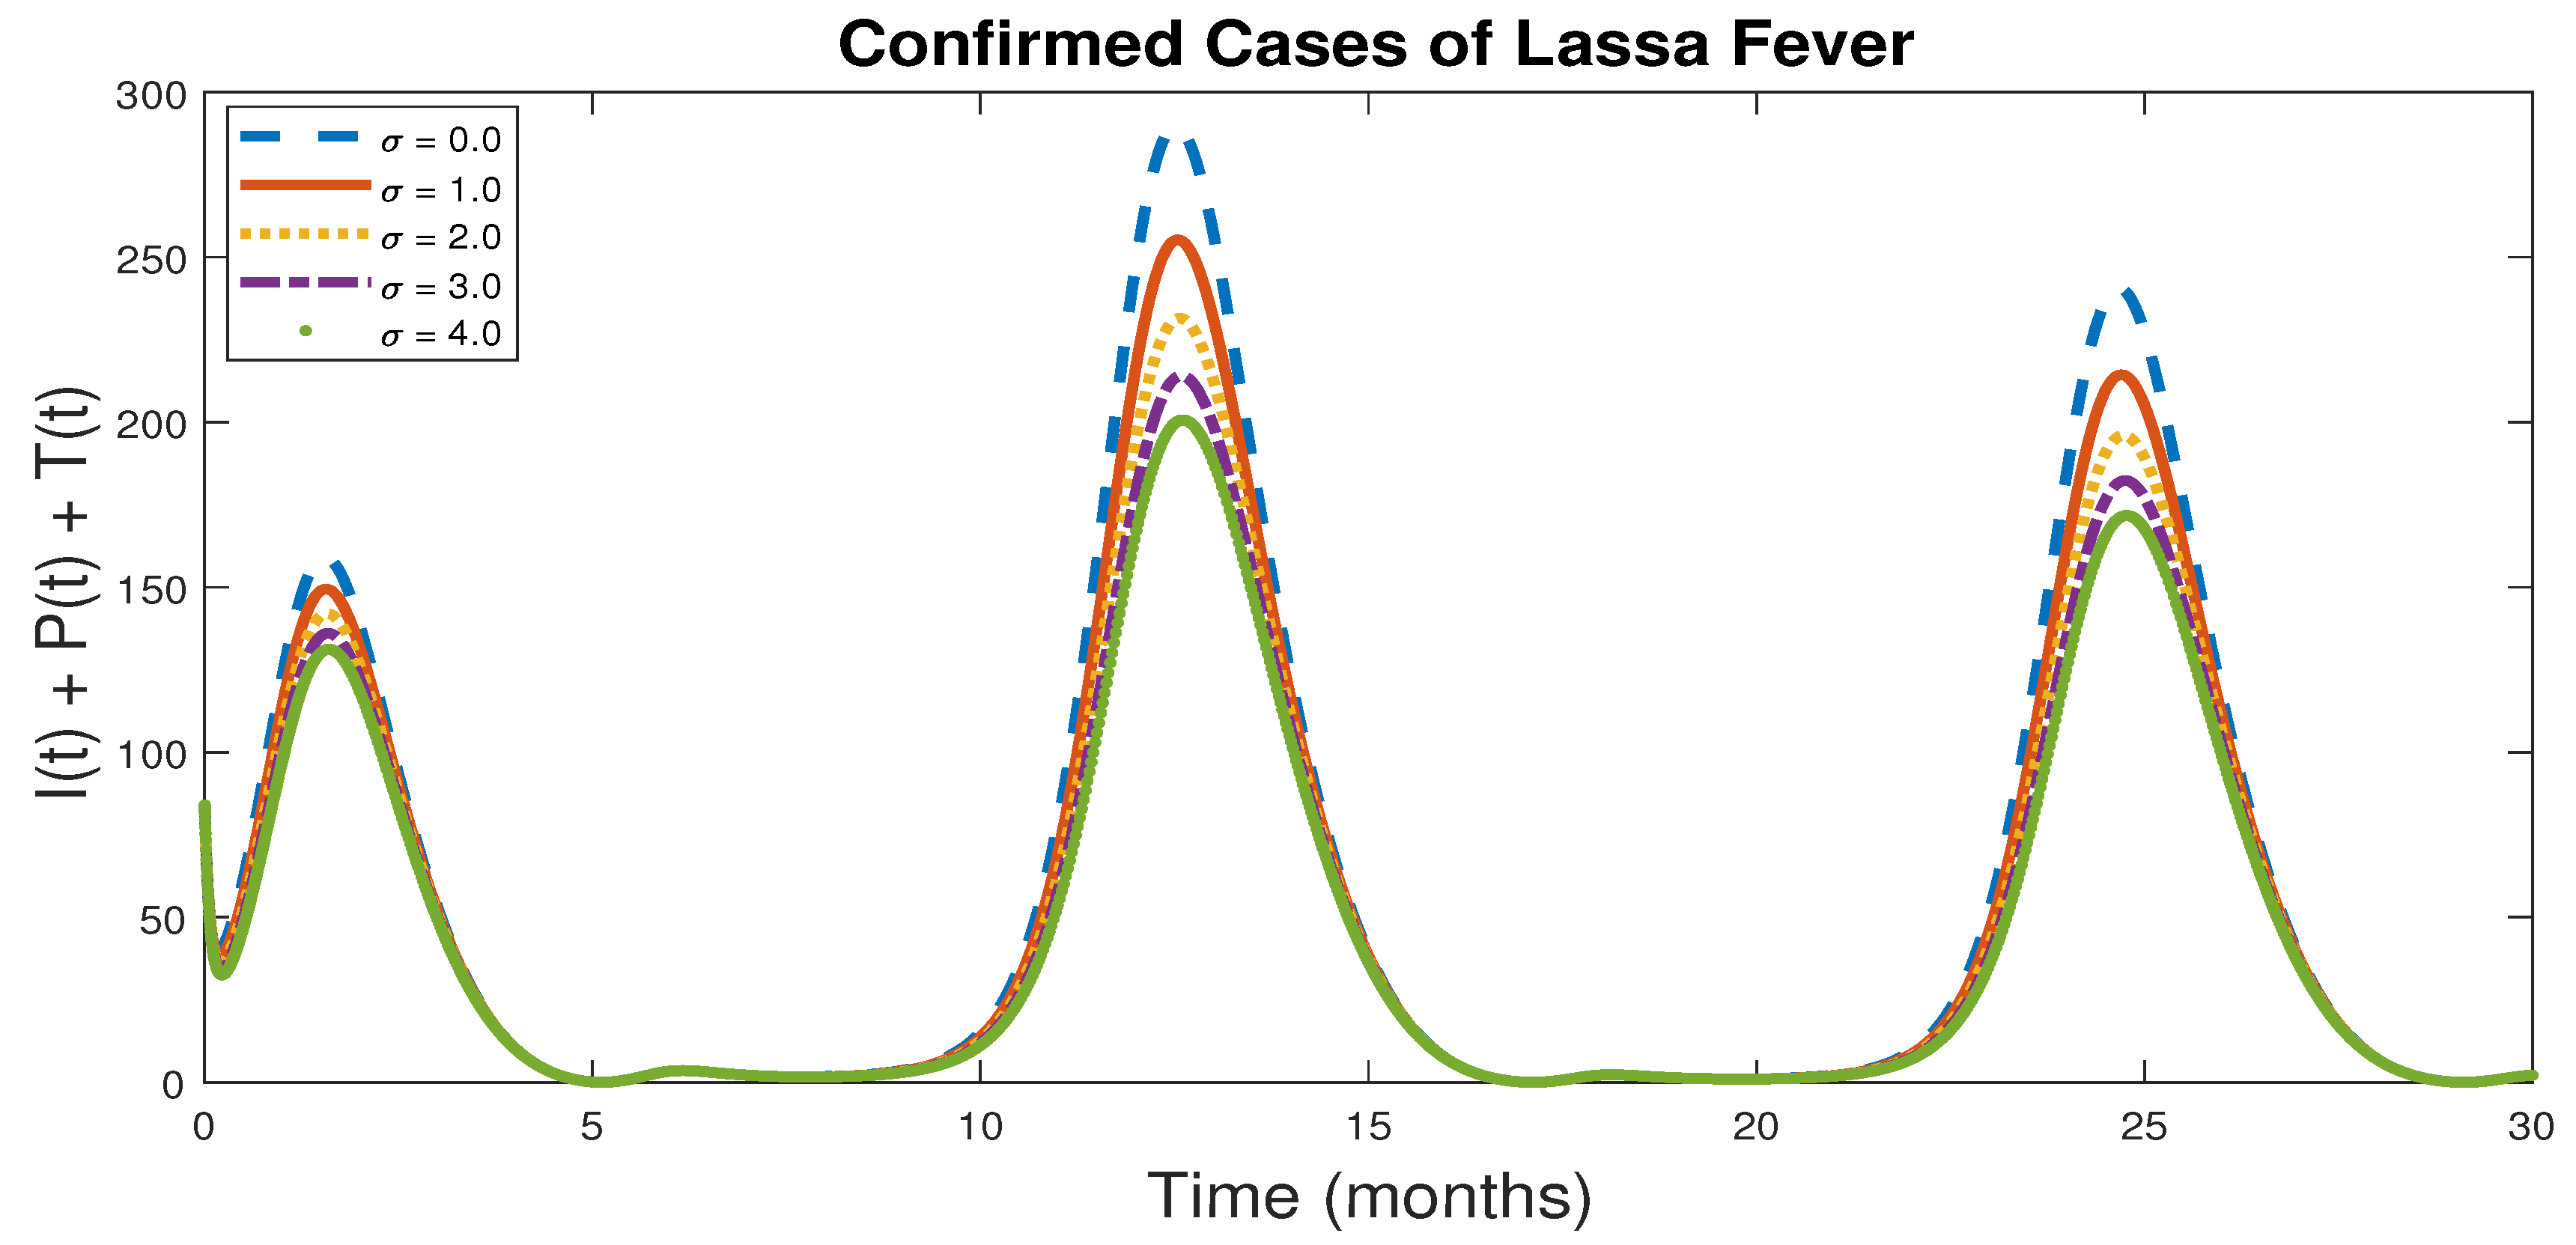
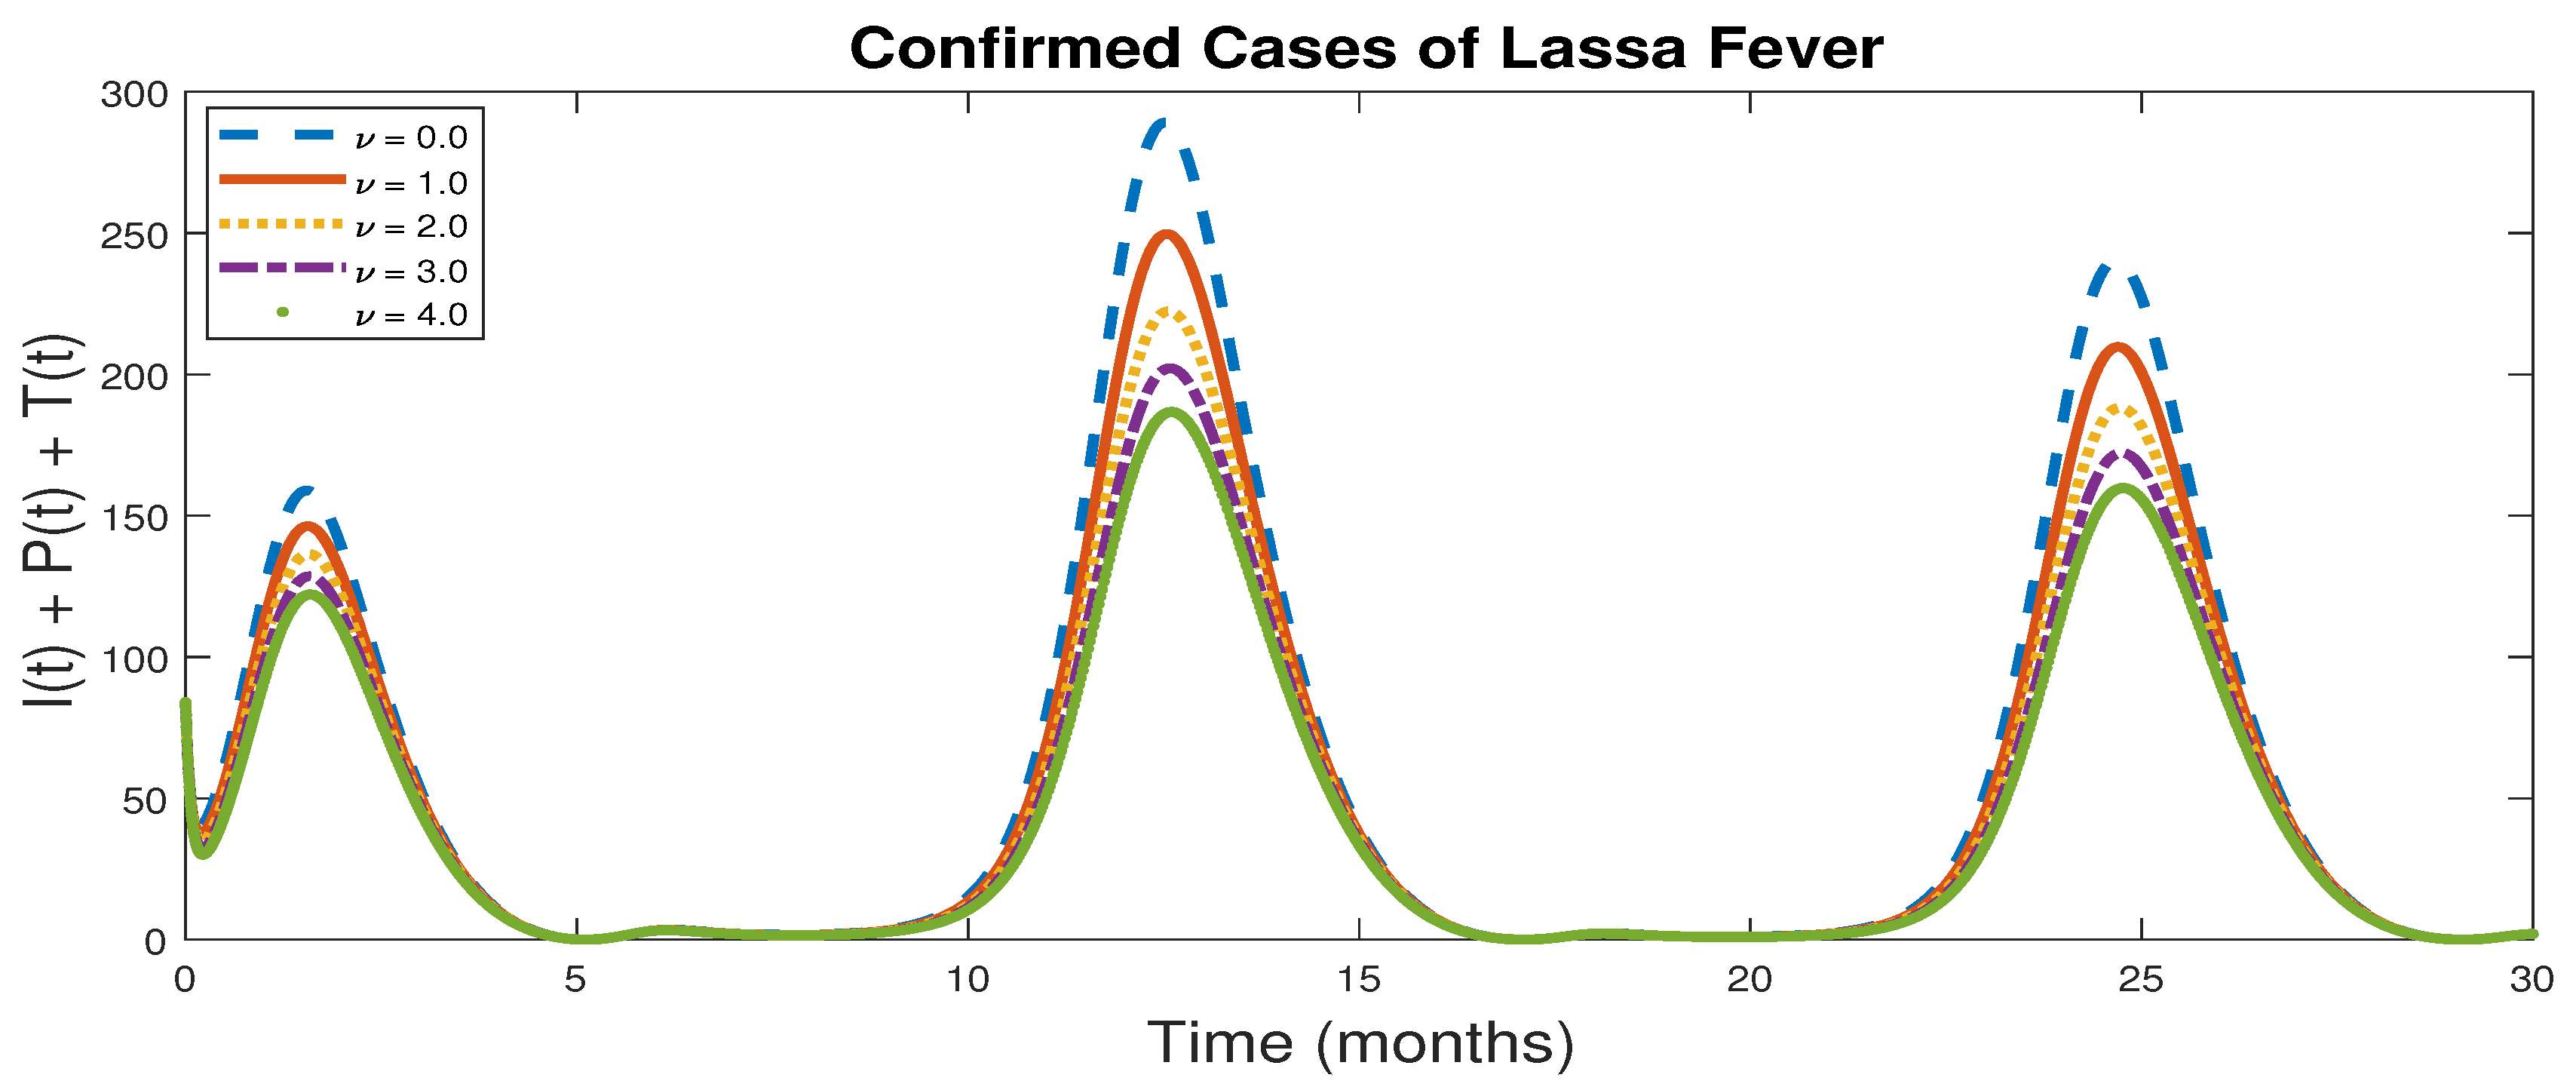
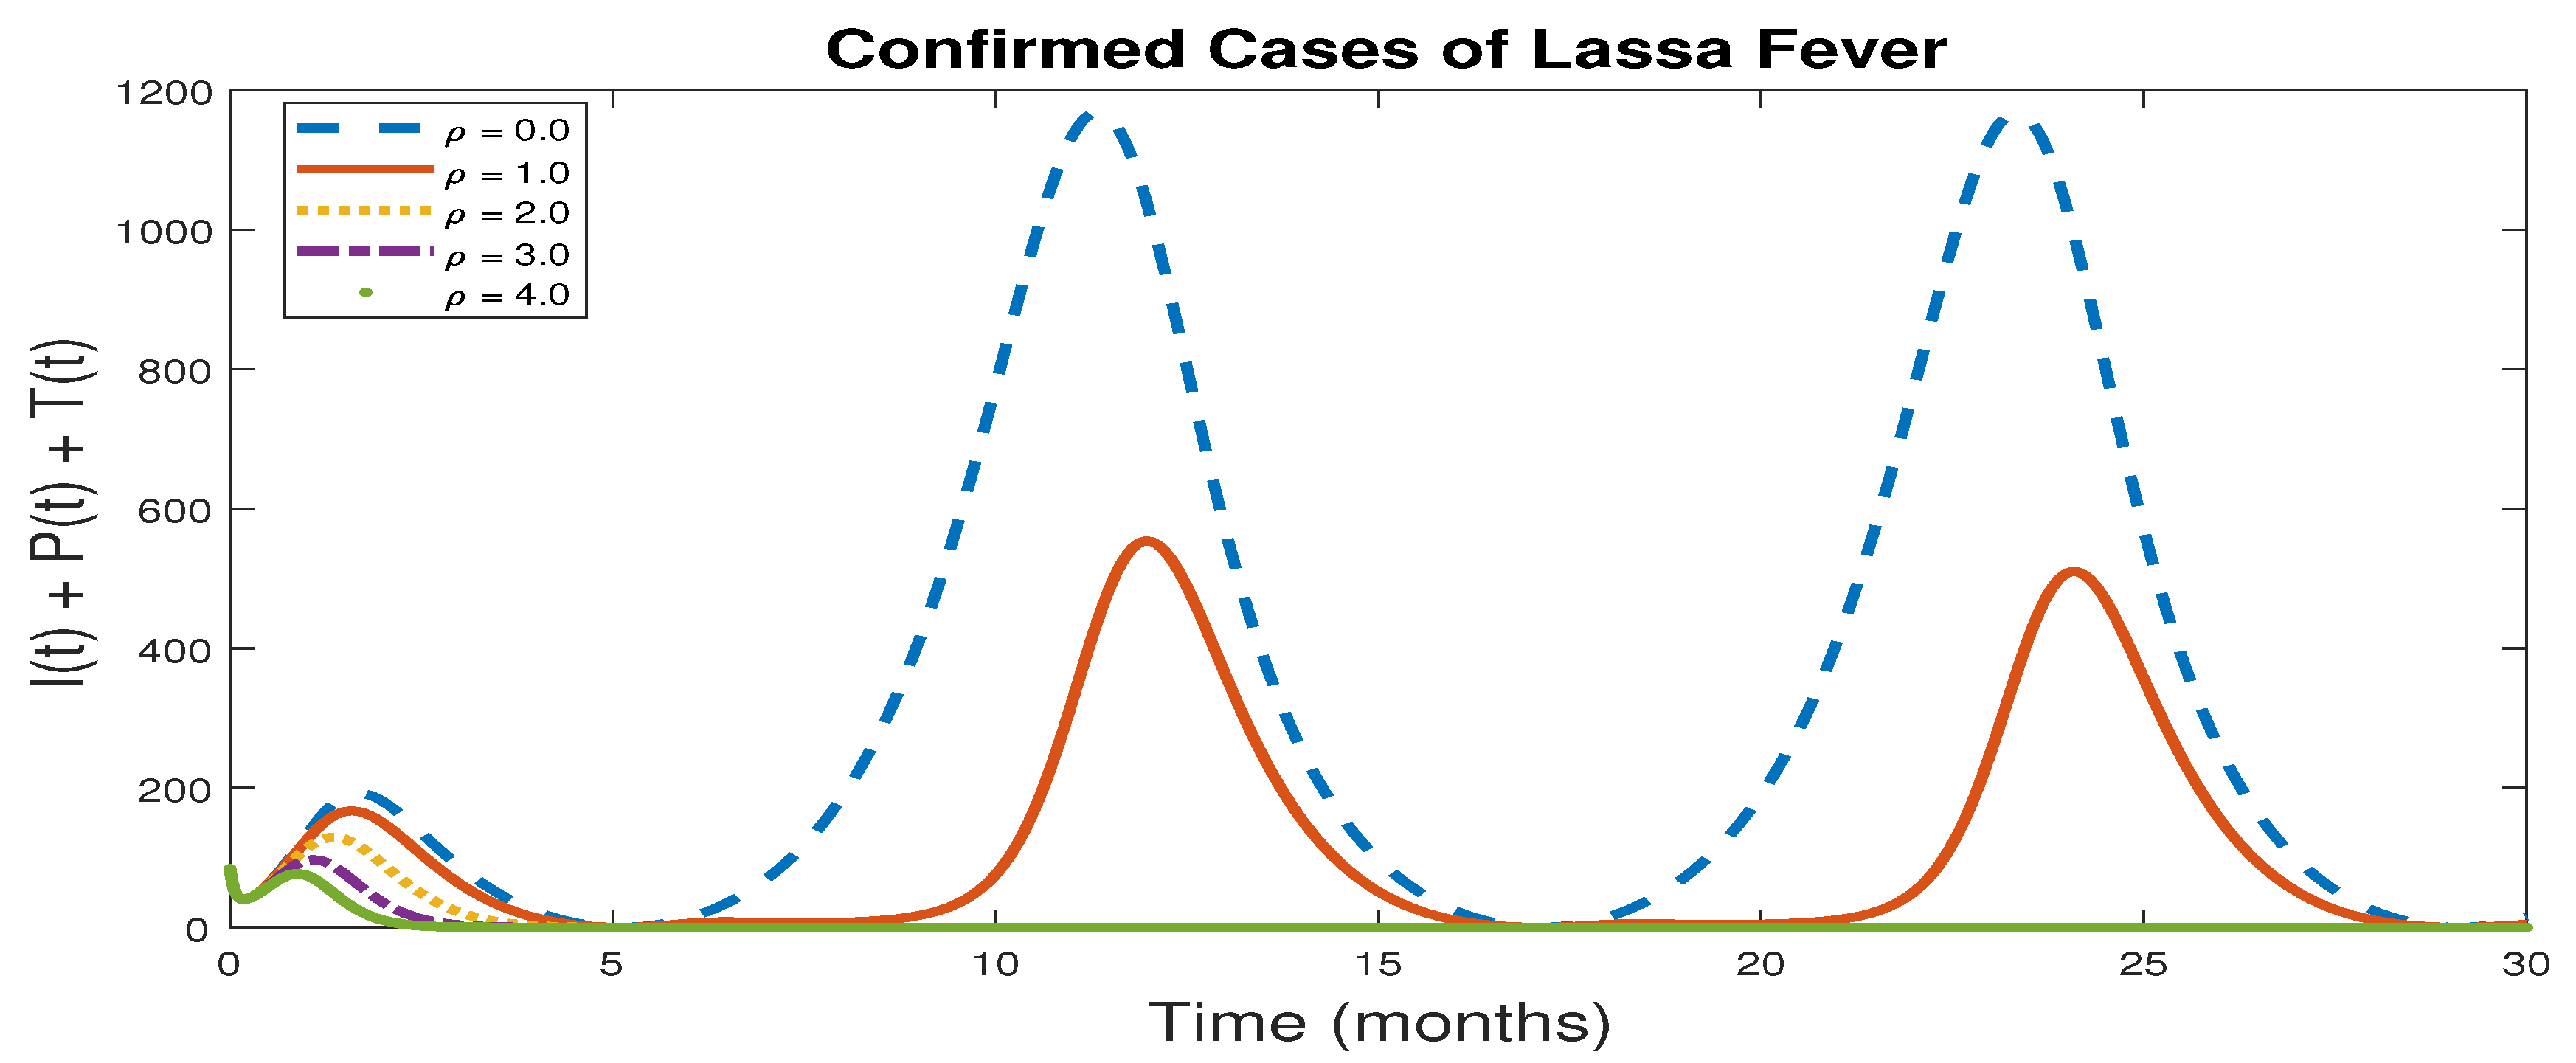
Effects of Control Measures on Lassa Fever Disease

Since the inception of the recent Lassa fever outbreak in Nigeria, several control measures have been implemented. In this section, the effect of control measures on Nigerian Lassa fever is analysed using model (1). The analyses use the estimated parameter values together with parameter values given in Table 3. The results are presented in the Figures below.
Human-to-human transmission is one of the major ways of contracting Lassa fever. This transmission route is very common among health workers caring for Lassa fever-infected persons. Case Management and Infection Prevention and Control (IPC) are control measures that are currently used by the Nigeria Government to reduce person-to-person transmission of Lassa fever, especially among health workers [1]. For this reason, the Government has been conducting Case Management and IPC training for treatment center healthcare workers [1]. These control measures are captured in model (1) by C h h , which allows for a reduction of human-to-human transmission. Figure 4 is a graphical illustration of the effects of a reduction of human-to-human transmission using C h h in (1). The figure shows that increasing this control measure ( C h h ) decreases the number of confirmed cases of Lassa fever during the annual peak period (December to April). Specifically, 99 % efficacy of the control measure can save about 450 individuals from contacting the infection during the annual peak period. Note that outside the peak period, the number of infections dies out making the impact of control less important. Therefore, we recommend the effective implementation of these control measures, especially during the dry season, for optimal reduction of human-to-human transmission of Lassa fever disease in Nigeria.
Rodents-to-human transmission is the primary transmission route of Lassa fever. Humans mainly get infected with Lassa fever through this transmission pathway when they come in contact with food or household items contaminated with urine or faeces from Mastomys rats. Vector and environmental control is the Nigerian Government intervention strategy for reducing rodents-to-human transmission of Lassa fever [1]. Through this intervention strategy, the Ministry of Environment of Nigeria is implementing a Lassa fever environmental response campaign in affected states (locations) [1]. These control measures are captured in model (1) by C r h , which allows for a reduction of rodents-to-human transmission. Figure 5 is a graphical illustration of the effects of a reduction of rodents-to-human transmission using C r h in model (1). The figure shows that the effective implementation of these control measures can lead to a significant decrease in the number of Lassa fever confirmed cases in Nigeria. In fact, rodents-to-human control, unlike human-to-human control, accumulates over time and so some minimal control can effectively eliminate the disease over time, for example, C r h = 0.25 in Figure 5.
The impact of these control measures can also be explained in terms of the basic reproduction number. For instance, when no control measure for a reduction in rodents-to-human transmission is considered ( C r h = 0.0 ), the basic reproduction number increases to R 0 = 1.3065 . However, if the control measure is considered such that ( C r h = 0.75 ), the basic reproduction number decreases to R 0 = 1.2199 , illustrating the impact of this control measure. Therefore, effective implementation of these control measures is strongly recommended for the possible elimination of Lassa fever in Nigeria.
Rodents-to-rodents transmission is an indirect route through which Lassa fever disease can be transmitted to humans [2]. This is because rodents-to-rodent transmission increases the population of infected rodents, which increases the probability of rodents-to-human transmission. Thus, decreasing rodents-to-rodents transmission is a control measure that can reduce Lassa fever disease. Studies have shown that the use of rodent vaccination is a strategy that could lead to Lassa virus elimination [11]. Note, that the main target of rodent vaccination is to reduce rodents-to-rodent transmission. So, control measures such as rodent vaccination is captured in model (1) as reduction of rodents-to-rodents transmission using C r r . Figure 6 is a plot showing the effects of reduction of rodents-to-rodents transmission of Lassa fever in Nigeria. The figure shows that effective implementation of this control with about 99 % efficacy can save about 300 individuals in Nigeria from being infected with the disease during the peak period and consequently lead to possible eradication of the disease in Nigeria. Also, as with direct transmission, rodents-to-rodents control can eliminate the disease over time. Thus, effective implementation of this control is strongly recommended for the possible elimination of Lassa fever in Nigeria.
Isolation of infected individuals is one of the approved epidemiological methods of controlling Lassa fever transmission. Effective implementation leads to a reduction in human-to-human transmission and rodents-to-human transmission. The Nigerian government through their Clinical Management Program established several treatment centers where infected individuals can be isolated for proper treatment [1]. This control measure is captured in model (1) as the rate of isolation of infected individuals ( σ ). Figure 7 is a plot showing the effects of the rate of isolation of infected individuals ( σ ). The figure shows that increasing the rate of isolation of infected individuals decreases the number of Lassa fever confirmed cases in Nigeria during the disease annual peak. Unlike the previous two controls, isolation alone does not stop the seasonal outbreak, as shown in the figure. Therefore, prompt isolation of infected individuals in combination with other control measures are recommended.
Treatment of infected individuals is an approved medical method of controlling Lassa fever infections. Effective implementation of this control measure saves human lives. The Nigerian government, through their Clinical Management Program, established several treatment centres where infected individuals can be properly treated [1]. This control measure is captured in model (1) as a rate of treatment of infected individuals ( ν ). Figure 8 is a plot showing the effects of treatment of infected individuals ( ν ). The figure shows that increasing the rate of treatment of infected individuals decreases the number of confirmed Lassa fever cases. Again, treatment alone does not stop the seasonal outbreak, as shown in the figure. Hence, proper treatment of infected individuals together with other control measures are recommended.
The killing of infected rodents using approved rodenticides is another control measure that reduces Lassa fever transmission. The Ministry of Environment of Nigeria, through the Vector and Environmental Control Strategy, is implementing a Lassa fever environmental response campaign in affected locations [1]. Control measures such as the Vector and Environmental Control Strategy are captured in model (1) as killing rodents using ρ . Figure 9 is a plot showing the effects of killing rodents using chemical control measures ( ρ ). The figure illustrated that increasing the rate of killing rodents reduces Lassa fever infections. Effective implementation of this control can save about 1200 humans from contacting the disease during a disease peak period. In this case, above a threshold of rodent reductions, the disease is completely eliminated. Thus, killing of rodents, especially infected rodents, is strongly recommended for the possible eradication of Lassa fever in Nigeria.

6. Discussion

Lassa fever is a deadly illness caused by the Lassa virus and its main host is the multimammate rat, which is dominant in some rural areas of West Africa. Lassa fever is endemic in some West African countries including Nigeria where multimammate rats are present. Seasonal outbreaks of Lassa fever have been confirmed in Nigeria since 2018 to date [1]. This study considered a mathematical model to analyse the dynamics and control of Lassa fever in Nigeria as a case study.
A deterministic model (1) for the dynamics and control of Lassa fever was developed. The model is shown to fit Nigerian data on Lassa fever outbreaks between 2018 and 2021 using parameters from previous literature and fitting control parameters.
The model is shown to have a unique disease-free equilibrium and at least one endemic equilibrium. The basic reproduction number R 0 of the model was determined using the next-generation matrix method. It is shown that the disease-free equilibrium is asymptotically stable when R 0 < 1 . This means that Lassa fever disease will be eradicated using the specified control measures if the initial population of the infected individuals lies within the region of attraction of the disease-free equilibrium when R 0 < 1 otherwise the disease persists. The Center Manifold Theorem was used to determine the conditions for the bifurcation about R 0 = 1 . For h 2 > ( h 3 + h 4 + h 5 ) , the model undergoes forward bifurcation, which implies that keeping the basic reproduction number below unity is sufficient for the total eradication of Lassa fever using the specified control measures. Further analysis was considered to determine the long-term dynamics of Lassa fever transmission and the impact of control measures using model (1). This was carried out using numerical simulations with the published data from Nigeria as a case study.
As the model is a good fit for the outbreak of Lassa fever in Nigeria from 2018 to 2021, it is used further for predictions of Lassa fever trends in Nigeria. Using the parameter values, the basic reproduction number R 0 for Lassa fever over this period is R 0 = 1.1868 . This result shows that Lassa fever is likely to remain endemic in Nigeria for many years unless effective control measures are implemented. This fact is supported by numerical predictions. Therefore, effective control intervention strategies are highly recommended in Nigeria, especially during the Lassa fever disease annual peak (December to April) for the possible elimination of the disease in Nigeria.
The influence of various control measures for Lassa fever disease in Nigeria is examined using the model (1) together with the estimated parameter values. Effective implementation of the reduction in human-to-human transmission using control measures can save about 450 individuals from contracting the infection during the annual peak (December to April) in Nigeria. Similarly, effective implementation of the reduction in rodents-to-human transmission using control measures leads to a significant decrease in the number of Lassa fever confirmed cases in Nigeria. Also, effective implementation of the reduction of rodents-to-rodents transmission using control measures can save about 300 individuals in Nigeria from being infected with the disease during the peak period and consequently lead to possible eradication of the disease in Nigeria. Furthermore, effective implementation of the killing of infected rodents using approved rodenticides can save about 1200 from getting infected. Isolation and treatment of infected individuals are shown to have some influence in reducing Lassa fever disease in Nigeria but were less effective when compared with other control measures like the use of rodenticides, reduction in person-to-person transmissions, and rodent-to-person transmissions. Also, isolation and treatment of infected individuals do not stop the seasonal outbreaks. A possible explanation for the insignificant impact of isolation and treatment could be that treated individuals do not have permanent immunity against re-infection. Therefore, based on these results, effective implementation of control measures such as the use of rodenticides, reduction in person-to-person, rodent-to-rodent, and rodent-to-person transmission should be the main focus for the possible elimination of the seasonal Lassa fever outbreaks in Nigeria.
The results of our study agree with other findings on Lassa fever disease outbreaks in Nigeria. For instance, Ref. [9] used a mechanistic modelling study of Lassa fever epidemics in Nigeria from 2016–2019. Similarities in the transmission dynamics driving the three major Lassa fever outbreaks over that period were outlined by their study. Qualitatively, their model and the one used here support the occurrence of forward bifurcation where the stability changes from a disease-free equilibrium to an endemic equilibrium. However, our model incorporates multiple control measures together with data to study and make predictions of the possible dynamics of future Lassa fever epidemics. Although our model successfully captured the overall dynamics of a Nigerian Lassa fever outbreak, it has limitations. A major limitation is that data on rodent population densities in that country are not available even though rodents are the major source of Lassa fever infection. Future research can focus on Lassa fever dynamics when rodent data become available.

Author Contributions

Conceptualization, O.C.C. and K.J.D.; Methodology, O.C.C.; Formal analysis, O.C.C. and K.J.D.; Writing—original draft, O.C.C.; Writing—review & editing, K.J.D.; Funding acquisition, K.J.D. All authors have read and agreed to the published version of the manuscript.

Funding

This research was funded by the National Research Foundation of South Africa (Grant Number 131604).

Data Availability Statement

Data is available from the original source (see reference [16]).

Acknowledgments

O.C.C. & K.J.D. acknowledge the financial support from the National Research Foundation of South Africa (Grant Number 131604).

Conflicts of Interest

The authors declare no conflict of interest.

Appendix A. Proof of Theorem 1

Proof. 
The eigenvalues of the Jacobian of model (1) about the DFE are:
λ 1 = μ , λ 2 = d 2 , λ 3 = d 3 , λ 4 = d 4 , λ 5 = d 5 , λ 6 = d 1 R h h 0 + d 5 R r r 0 d 1 R h h 0 + d 5 R r r 0 2 + 4 d 1 d 5 ( R h r R r h R h h 0 R r r 0 ) 2 , λ 7 = d 1 R h h 0 + d 5 R r r 0 + d 1 R h h 0 + d 5 R r r 0 2 + 4 d 1 d 5 ( R h r R r h R h h 0 R r r 0 ) 2 ,
where R h h 0 = ( 1 R h h ) and R r r 0 = ( 1 R r r ) . Obviously, λ 1 < 0 , λ 2 < 0 , λ 3 < 0 , λ 4 < 0 , λ 5 < 0 and λ 6 < 0 . Mathematically, λ 7 < 0 if R h r R r h ( 1 R h h ) ( 1 R r r ) < 0 . But, R h r R r h ( 1 R h h ) ( 1 R r r ) = ( 1 R h h ) ( 1 R r r ) R h r R r h ( 1 R h h ) ( 1 R r r ) 1 . Therefore, λ 7 < 0 if R h r R r h ( 1 R h h ) ( 1 R r r ) < 1 . Hence, the DFE (2) is locally stable if R 0 * < 1 . □

Appendix B. Proof of Theorem 2

Proof. 
The proof of the existence of the Lassa fever endemic equilibrium (EE) for model (1) is established as follows. The EE for model (1) denoted by
E * = ( S * , I * , P * , T * , R * , R * , Y * )
is the steady-state solution of model (1) in the presence of Lassa fever disease. Equating the right-hand sides of model (1) to zero and solving simultaneously, gives the following:
S * = S 0 A 2 I * , P * = σ I * d 2 , T * = ν ( σ + d 2 ) I * d 2 d 3 , R * = γ ν ( σ + d 2 ) I * d 2 d 3 d 3 , X * = N r * Y * , Y * = N r * X * , N h * = S 0 A 1 I * , N r * = Λ r d 5 ,
where A 1 = δ d 2 d 3 + δ σ d 3 + ν η d 1 μ d 2 d 3 > 0 and A 2 = ( ν γ μ + ν ( μ + η ) d 4 + ( δ + μ ) d 3 d 4 ) d 1 μ d 2 d 3 d 4 > 0 . Substituting R r r , R h h , R r h and R h r into model (1) and solving for Y * from the equation d I d t = 0 , gives
Y * = d 1 S 0 I * ( N h * R h h S * ) d 5 R r h N h * S * .
Observe from the above Equation (A3) that Y * > 0 N h * R h h S * > 0 . Substituting S * = S 0 A 2 I * and N h * = S 0 A 1 I * into N h * R h h S * and simplifying gives N h * R h h S * = S 0 ( 1 R h h ) + ( A 2 R h h A 1 ) I * . Since, N h * R h h S * > 0 , we must have that S 0 ( 1 R h h ) > 0 and ( A 2 R h h A 1 ) > 0 . This shows that ( 1 R h h ) > 0 at the endemic stage of the model (1).
Also, substituting the basic reproduction numbers and simplifying d Y d t = 0 , gives
d 1 S 0 R h r I * X * = d 5 Y * N h * ( N r * R r r X * ) .
For endemic equilibrium to exist, we must have that N r * R r r X * > 0 . Further simplification gives N r * R r r X * = N r * ( 1 R r r ) + Y * R r r . This also shows that ( 1 R r r ) > 0 at the endemic stage of the model (1).
Taking these into consideration and substituting Equation (A2) into Equation (A4) and solving for I * in the Equation (A4), gives the polynomial
a 3 ( I * ) 3 + a 2 ( I * ) 2 + a 1 ( I * ) + a 0 = 0 ,
where the coefficients
a 0 = l 1 ( S 0 ) 2 d 5 R r h , a 1 = S 0 l 2 d 5 S 0 R r h l 1 ( A 1 + A 2 ) d 5 R r h l 3 d 1 S 0 ( 1 R h h ) , a 2 = S 0 l 1 S 0 A 1 A 2 d 5 R r h l 2 ( A 1 + A 2 ) d 5 R r h l 3 ( A 2 R h h A 1 ) d 1 l 4 d 1 S 0 ( 1 R h h ) , a 3 = l 2 A 1 A 2 d 5 R r h l 4 ( A 2 R h h A 1 ) d 1 S 0 ,
and
l 1 = S 0 N r * ( 1 R h h ) ( 1 R r r ) ( R 0 * 1 ) , l 2 = N r * A 2 R r h R h r + ( A 2 R h h A 1 ) ( 1 R r r ) , l 3 = S 0 R r h R h r + ( 1 R h h ) R r r , l 4 = ( A 2 R h h A 1 ) R r r R r h R h r .
Clearly,
l 1 > 0 R 0 * > 1 , R r r < 1 , R h h < 1 , l 2 < 0 R r r < 1 , l 3 > 0 R h h < 1 .
From the above, we observe that the coefficients
a 0 > 0 R 0 * > 1 , R r r < 1 , R h h < 1 , a 1 < 0 R 0 * > 1 , R r r < 1 , R h h < 1 .
So there is at least a sign change in the coefficients a 0 , a 1 , a 2 , a 3 of the polynomial (A5). Hence, by Descartes rule of signs, there exists at least one positive real root for Equation (A5) whenever R 0 * > 1 , R r r < 1 , R h h < 1 . This completes the proof. □

Appendix C. Proof of Theorem 3

Proof. 
To prove that model (1) undergoes a forward bifurcation at R 0 = 1 , we proceed as follows. Using the Center Manifold Theory as described in [21], let ϕ = β r h be a bifurcation parameter. By denoting x 1 = S ( t ) , x 2 = I ( t ) , x 3 = P ( t ) , x 4 = T ( t ) , x 5 = R ( t ) , x 6 = X ( t ) , x 7 = Y ( t ) , N h ( t ) = x 1 + x 2 + x 3 + x 4 + x 5 , and N r ( t ) = x 6 + x 7 , model (1) becomes
d x 1 d t = Λ h ( 1 c h h ) β h h x 2 x 1 x 1 + x 2 + x 3 + x 4 + x 5 ( 1 c r h ) β r h x 2 x 1 x 6 + x 7 μ x 1 + ω x 5 : = f 1 , d x 2 d t = ( 1 c h h ) β h h x 2 x 1 x 1 + x 2 + x 3 + x 4 + x 5 + ( 1 c r h ) β r h x 2 x 1 x 6 + x 7 ( σ + ν + μ + δ ) x 2 : = f 2 , d x 3 d t = σ x 2 ( ν + δ + μ ) x 3 : = f 3 , d x 4 d t = ν x 2 + ν x 3 ( γ + μ + η ) x 4 : = f 4 , d x 5 d t = γ x 4 ( ω + μ ) x 5 : = f 5 , d x 6 d t = Λ r ( 1 c r r ) β r r x 7 x 6 x 6 + x 7 ( 1 c h r ) β h r x 2 x 6 x 1 + x 2 + x 3 + x 4 + x 5 ( ξ + ρ ) x 6 : = f 6 , d x 7 d t = ( 1 c r r ) β r r x 7 x 6 x 6 + x 7 + ( 1 c h r ) β h r x 2 x 6 x 1 + x 2 + x 3 + x 4 + x 5 ( ξ + ρ ) x 7 : = f 7 ,
with R 0 = R 0 * = 1 corresponding to β r h = ϕ = ϕ * = d 1 d 5 ( 1 R r r ) ( 1 R h h ) β h r ( 1 c r h ) ( 1 c h r ) . The DFE (2) becomes ( x 1 * , x 2 * , x 3 * , x 4 * , x 5 * , x 6 * , x 7 * ) = Λ h μ , 0 , 0 , 0 , 0 , Λ r ξ + ρ , 0 . For ϕ = ϕ * , the Jacobian of model (A6) at the DFE is calculated as
J = μ p 12 0 0 ω 0 p 27 0 p 22 0 0 0 0 p 27 0 σ d 2 0 0 0 0 0 ν ν d 3 0 0 0 0 0 0 γ d 4 0 0 0 p 72 0 0 0 d 5 p 67 0 p 72 0 0 0 0 p 77 ,
where p 12 = ( 1 c h h ) β h h = d 1 R h h > 0 , p 22 = d 1 ( 1 c h h ) β h h = d 1 ( 1 R h h ) > 0 , p 27 = ( 1 c r h ) β r h * x 1 * x 6 * > 0 , p 72 = ( 1 c h r ) β h r x 6 * x 1 * > 0 , p 67 = ( 1 c r r ) β r r = d 5 R r r > 0 , p 77 = d 5 ( 1 c r r ) β r r = d 5 ( 1 R r r ) > 0 .
A right eigenvector w = ( w 1 , w 2 , w 3 , w 4 , w 5 , w 6 , w 7 ) associated with simple zero eigenvalue is
w = d 1 A 2 w 2 , w 2 , σ w 2 d 2 , d 1 ν w 2 d 2 d 3 , γ d 1 ν w 2 d 2 d 3 d 4 , w 6 , p 22 w 2 p 27 ,
where w 2 = w 2 > 0 , w 6 = ( p 27 p 72 + p 67 p 22 ) w 2 d 5 p 27 < 0 and the superscript represent the transpose. Similarly, a left eigenvector v = ( v 1 , v 2 , v 3 , v 4 , v 5 , v 6 , v 7 ) associated with simple zero eigenvalue is
v = 0 , p 72 v 7 p 22 , 0 , 0 , 0 , 0 , p 22 p 27 ( p 72 p 27 + p 22 2 ) w 2 ,
where v 2 is determined taking into consideration the condition v . w = 1 of the eigenvectors. According to the Center Manifold Theory [21] the bifurcation of model (1) about R 0 = 1 are totally determined by the sign of a and b, where
a = k , i , j = 1 n v k w i w j 2 f k x i x j ( 0 , 0 ) ,
b = k , i = 1 n v k w i 2 f k x i ϕ ( 0 , 0 ) ,
and f k is the kth component of f. Algebraic computation of a and b gives
a = 2 x 1 * x 6 * ( h 2 ( h 3 + h 4 + h 5 ) ) ,
b = v 2 w 7 ( 1 c r h ) x 1 * x 6 * > 0 ,
where h 2 = v 2 w 7 d 5 R r h ( w 1 x 6 * + w 6 * x 1 * ) > 0 , h 3 = v 2 ( w 1 h 1 d 1 R h h x 6 * + w 7 2 d 5 R r h x 1 * ) > 0 , h 4 = v 7 d 1 R h r ( w 7 ( w 1 + h 1 ) x 6 * + w 2 w 6 * x 1 * ) > 0 , h 5 = v 7 w 7 2 d 5 R r r x 1 * > 0 , h 1 = w 2 + w 3 + w 4 + w 5 and w 6 * = w 6 > 0 . So, the bifurcation at R 0 = 1 depends on the sign of a and there are two possibilities (i.e., a < 0 or a > 0 ). According to the Center manifold Theorem [21], if a < 0 (i.e., h 2 < h 3 + h 4 + h 5 ), then model (1) undergoes a forward bifurcation at R 0 = 1 . This completes the proof. □

References

  1. World Health Organization, Lassa Fever-Nigeria. 2022. Available online: https://www.who.int/emergencies/disease-outbreak-news/item/lassa-fever—nigeria (accessed on 13 June 2022).
  2. Ibrahim, M.A.; Denes, A. A mathematical model for Lassa fever transmission dynamics in a seasonal environment with a view to the 2017–20 epidemic in Nigeria. Nonlinear Anal. Real World Appl. 2021, 60, 103310. [Google Scholar] [CrossRef]
  3. Hamblion, E.L.; Raftery, P.; Wendl, A.; Dweh, E.; Williams, G.S.; George, R.N.; Soro, L.; Katawera, V.; Clement, P.; Gasasira, A.N.; et al. The challenges of detecting and responding to a Lassa fever outbreak in an Ebola-affected setting. Int. J. Infect. Dis. 2018, 66, 65–73. [Google Scholar] [CrossRef] [PubMed] [Green Version]
  4. Tien, J.H.; Earn, D.J. Multiple transmission pathways and disease dynamics in a waterborne pathogen model. Bull. Math. Biol. 2010, 72, 1506–1533. [Google Scholar] [CrossRef] [PubMed]
  5. Collins, O.C.; Duffy, K.J. Estimating the impact of lock-down, quarantine and sensitization in a COVID-19 outbreak: Lessons from the COVID-19 outbreak in China. PeerJ 2020, 8, e9933. [Google Scholar] [CrossRef] [PubMed]
  6. Collins, O.C.; Duffy, K.J. Mathematical Analyses on the Effects of Control Measures for a Waterborne Disease Model with Socioeconomic Conditions. J. Comput. Biol. 2021, 28, 19–32. [Google Scholar] [CrossRef]
  7. Collins, O.C.; Govinder, K.S. Incorporating heterogeneity into the transmission dynamics of a waterborne disease model. J. Theor. Biol. 2014, 356, 133–143. [Google Scholar] [CrossRef]
  8. Ojo, M.M.; Gbadamosi, B.; Benson, T.O.; Adebimpe, O.; Georgina, A.L. Modeling the dynamics of Lassa fever in Nigeria. J. Egypt. Math. Soc. 2021, 29, 1–9. [Google Scholar] [CrossRef]
  9. Musa, S.S.; Zhao, S.; Gao, D.; Lin, Q.; Chowell, G.; He, D. Mechanistic modelling of the large-scale Lassa fever epidemics in Nigeria from 2016 to 2019. J. Theor. Biol. 2020, 493, 110209. [Google Scholar] [CrossRef] [PubMed]
  10. Ndenda, J.P.; Njagarah, J.B.; Shaw, S. Influence of environmental viral load, interpersonal contact and infected rodents on Lassa fever transmission dynamics: Perspectives from fractional-order dynamic modelling. AIMS Math. 2022, 7, 8975–9002. [Google Scholar] [CrossRef]
  11. Marien, J.; Borremans, B.; Kourouma, F.; Baforday, J.; Rieger, T.; Günther, S.; Magassouba, N.F.; Leirs, H.; Fichet-Calvet, E. Evaluation of rodent control to fight Lassa fever based on field data and mathematical modelling. Emerg. Microbes Infect. 2019, 8, 640–649. [Google Scholar] [CrossRef] [PubMed] [Green Version]
  12. Abdulhamid, A.; Hussaini, N.; Musa, S.S.; He, D. Mathematical analysis of Lassa fever epidemic with effects of environmental transmission. Results Phys. 2022, 35, 105335. [Google Scholar] [CrossRef]
  13. Zhao, S.; Musa, S.S.; Fu, H.; He, D.; Qin, J. Large-scale Lassa fever outbreaks in Nigeria: Quantifying the association between disease reproduction number and local rainfall. Epidemiol. Infect. 2020, 148, e4. [Google Scholar] [CrossRef] [PubMed] [Green Version]
  14. World Health Organization. Lassa Fever Fact Sheets. 2022. Available online: https://www.who.int/news-room/fact-sheets/detail/lassa-fever#:~:text=The%20animal%20reservoir%2C%20or%20host,in%20their%20urine%20and%20faeces (accessed on 4 February 2023).
  15. Redding, D.W.; Gibb, R.; Dan-Nwafor, C.C.; Ilori, E.A.; Yashe, R.U.; Oladele, S.H.; Amedu, M.O.; Iniobong, A.; Attfield, L.A.; Donnelly, C.A.; et al. Geographical drivers and climate-linked dynamics of Lassa fever in Nigeria. Nat. Commun. 2021, 12, 5759. [Google Scholar] [CrossRef] [PubMed]
  16. Nigeria Centre for Disease Control (NCDC). An Update of Lassa Fever Outbreak in Nigeria. 2022. Available online: https://ncdc.gov.ng/diseases/sitreps/?cat=5&name=An%20update%20of%20Lassa%20fever%20outbreak%20in%20Nigeria (accessed on 5 February 2022).
  17. Herdicho, F.F.; Chukwu, W.; Tasman, H. An optimal control of malaria transmission model with mosquito seasonal factor. Results Phys. 2021, 25, 104238. [Google Scholar]
  18. Ojo, M.M.; Goufo, E.F. Modeling, analyzing and simulating the dynamics of Lassa fever in Nigeria. J. Egypt. Math. Soc. 2022, 30, 1. [Google Scholar] [CrossRef]
  19. Davies, J.; Lokuge, K.; Glass, K. Routine and pulse vaccination for Lassa virus could reduce high levels of endemic disease: A mathematical modelling study. Vaccine 2019, 37, 3451–3456. [Google Scholar] [CrossRef] [PubMed]
  20. van den Driessche, P.; Watmough, J. Reproduction numbers and sub-threshold endemic equilibria for compartmental models of disease transmission. Math. Biosci. 2002, 180, 29–48. [Google Scholar] [CrossRef] [PubMed]
  21. Castillo-Chavez, C.; Song, B. Dynamical models of tuberculosis and their applications. Math. Biosci. Eng. 2004, 1, 361. [Google Scholar] [CrossRef] [PubMed]
Figure 1. Plot showing the monthly confirmed cases and suspected cases of Lassa fever in Nigeria from 2018 to 2021 [16].
Mathematics 11 01181 g001
Figure 2. Model fit of the confirmed cases of Lassa fever in Nigeria from 2018 to 2021, where vertical lines represent the error bars of the model fit.
Mathematics 11 01181 g002
Figure 3. Plot showing a possible long-term dynamics of Lassa fever in Nigeria using the estimated parameter values.
Mathematics 11 01181 g003
Figure 4. Plot showing the effects of reduction of human-to-human transmission using control measures ( C h h ) on the dynamics of Lassa fever in Nigeria.
Mathematics 11 01181 g004
Figure 5. Plot showing the effects of reduction of rodents-to-human transmission using control measures ( C r h ) on the dynamics of Lassa fever in Nigeria.
Mathematics 11 01181 g005
Figure 6. Plot showing the effects of reduction of rodents-to-rodents transmission using control measures ( C r r ) on the dynamics of Lassa fever in Nigeria.
Mathematics 11 01181 g006
Figure 7. Plot showing the effects of rate of isolation of infected individuals ( σ ) on the dynamics of Lassa fever in Nigeria.
Mathematics 11 01181 g007
Figure 8. Plot showing the effects of the rate of treatment of infected individuals ( ν ) on the dynamics of Lassa fever in Nigeria.
Mathematics 11 01181 g008
Figure 9. Plot showing the effects of killing rodents using chemical control measures ( ρ ) on the dynamics of Lassa fever in Nigeria.
Mathematics 11 01181 g009
Table 1. Variables for model (1).
VariablesMeaningUnit
N h ( t ) Total human population at time tPersons
S ( t ) Population susceptible humans at time tPersons
I ( t ) Population of infected human at time tPersons
P ( t ) Population of isolated individuals at time tPersons
T ( t ) Populations of treated individuals at time tPersons
R ( t ) Recovered/immune human at time tPersons
N r ( t ) Total rodents population at time tRodents
X ( t ) Population of susceptible rodents at time tRodents
Y ( t ) Population of infected rodents at time tRodents
Table 2. Parameters for model (1).
VariablesMeaningUnit
Λ h Recruitment rate of humans through birth or immigrationPersons day−1
β h h Human-to-human transmission rateDay−1
β r r Rodent-to-rodent transmission rateDay−1
β r h Rodent-to-human transmission rateDay−1
β h r Human-to-rodent transmission rateDay−1
μ Natural mortality rate of humansDay−1
σ Rate of isolation of infected individualsDay−1
ν Treatment rate of I ( t ) and P ( t ) Day−1
δ Disease induced death rate of I ( t ) and P ( t ) Day−1
η Disease induced death rate of T ( t ) Day−1
γ Expected recovery rate of T ( t ) Day−1
ω Rate of relapse from R ( t ) to S ( t ) Day−1
ξ Natural death rate of rodentsDay−1
ρ Death rate of rodents due to control measures (CM)Day−1
Λ r Recruitment rate of rodents through birthRodents day−1
c h h Reduction of human-to-human transmission using CMDimensionless
c h r Reduction of human-to-rodent transmission using CMDimensionless
c r h Reduction of rodent-to-human transmission using CMDimensionless
c r r Decrease in rodent-to-rodent transmission using CMDimensionless
Table 3. Parameter information for model (1).
ParameterUnitBaselineRangeSource
Λ h Persons day−1 10,000 [2]
Λ r Rodents day−1 83.33 [18]
β h h day−1 0.221 0.03–0.50[2]
β r h day−1 0.0296 0.01–0.80[2]
β h r day−1 0.259 0.03–0.50[2]
β r r day−1 0.052 0.005–0.40[2]
μ day−1 0.00005 [2]
δ day−1 0.485 0.10–0.50[9]
η day−1 0.269 0.10–0.50[9]
γ day−1 0.446 0.00–1.00[9]
ω day−1 0.00578 0.0035–0.03[9]
ξ day−1 0.003 0.001–0.006[9,19]
Disclaimer/Publisher’s Note: The statements, opinions and data contained in all publications are solely those of the individual author(s) and contributor(s) and not of MDPI and/or the editor(s). MDPI and/or the editor(s) disclaim responsibility for any injury to people or property resulting from any ideas, methods, instructions or products referred to in the content.

