
Modelling of Interaction Dynamics of a Pathogen and Bio-Markers (Matrix Metalloproteinases) of Tissue Destruction in Pulmonary Tuberculosis


Abstract
:1. Introduction
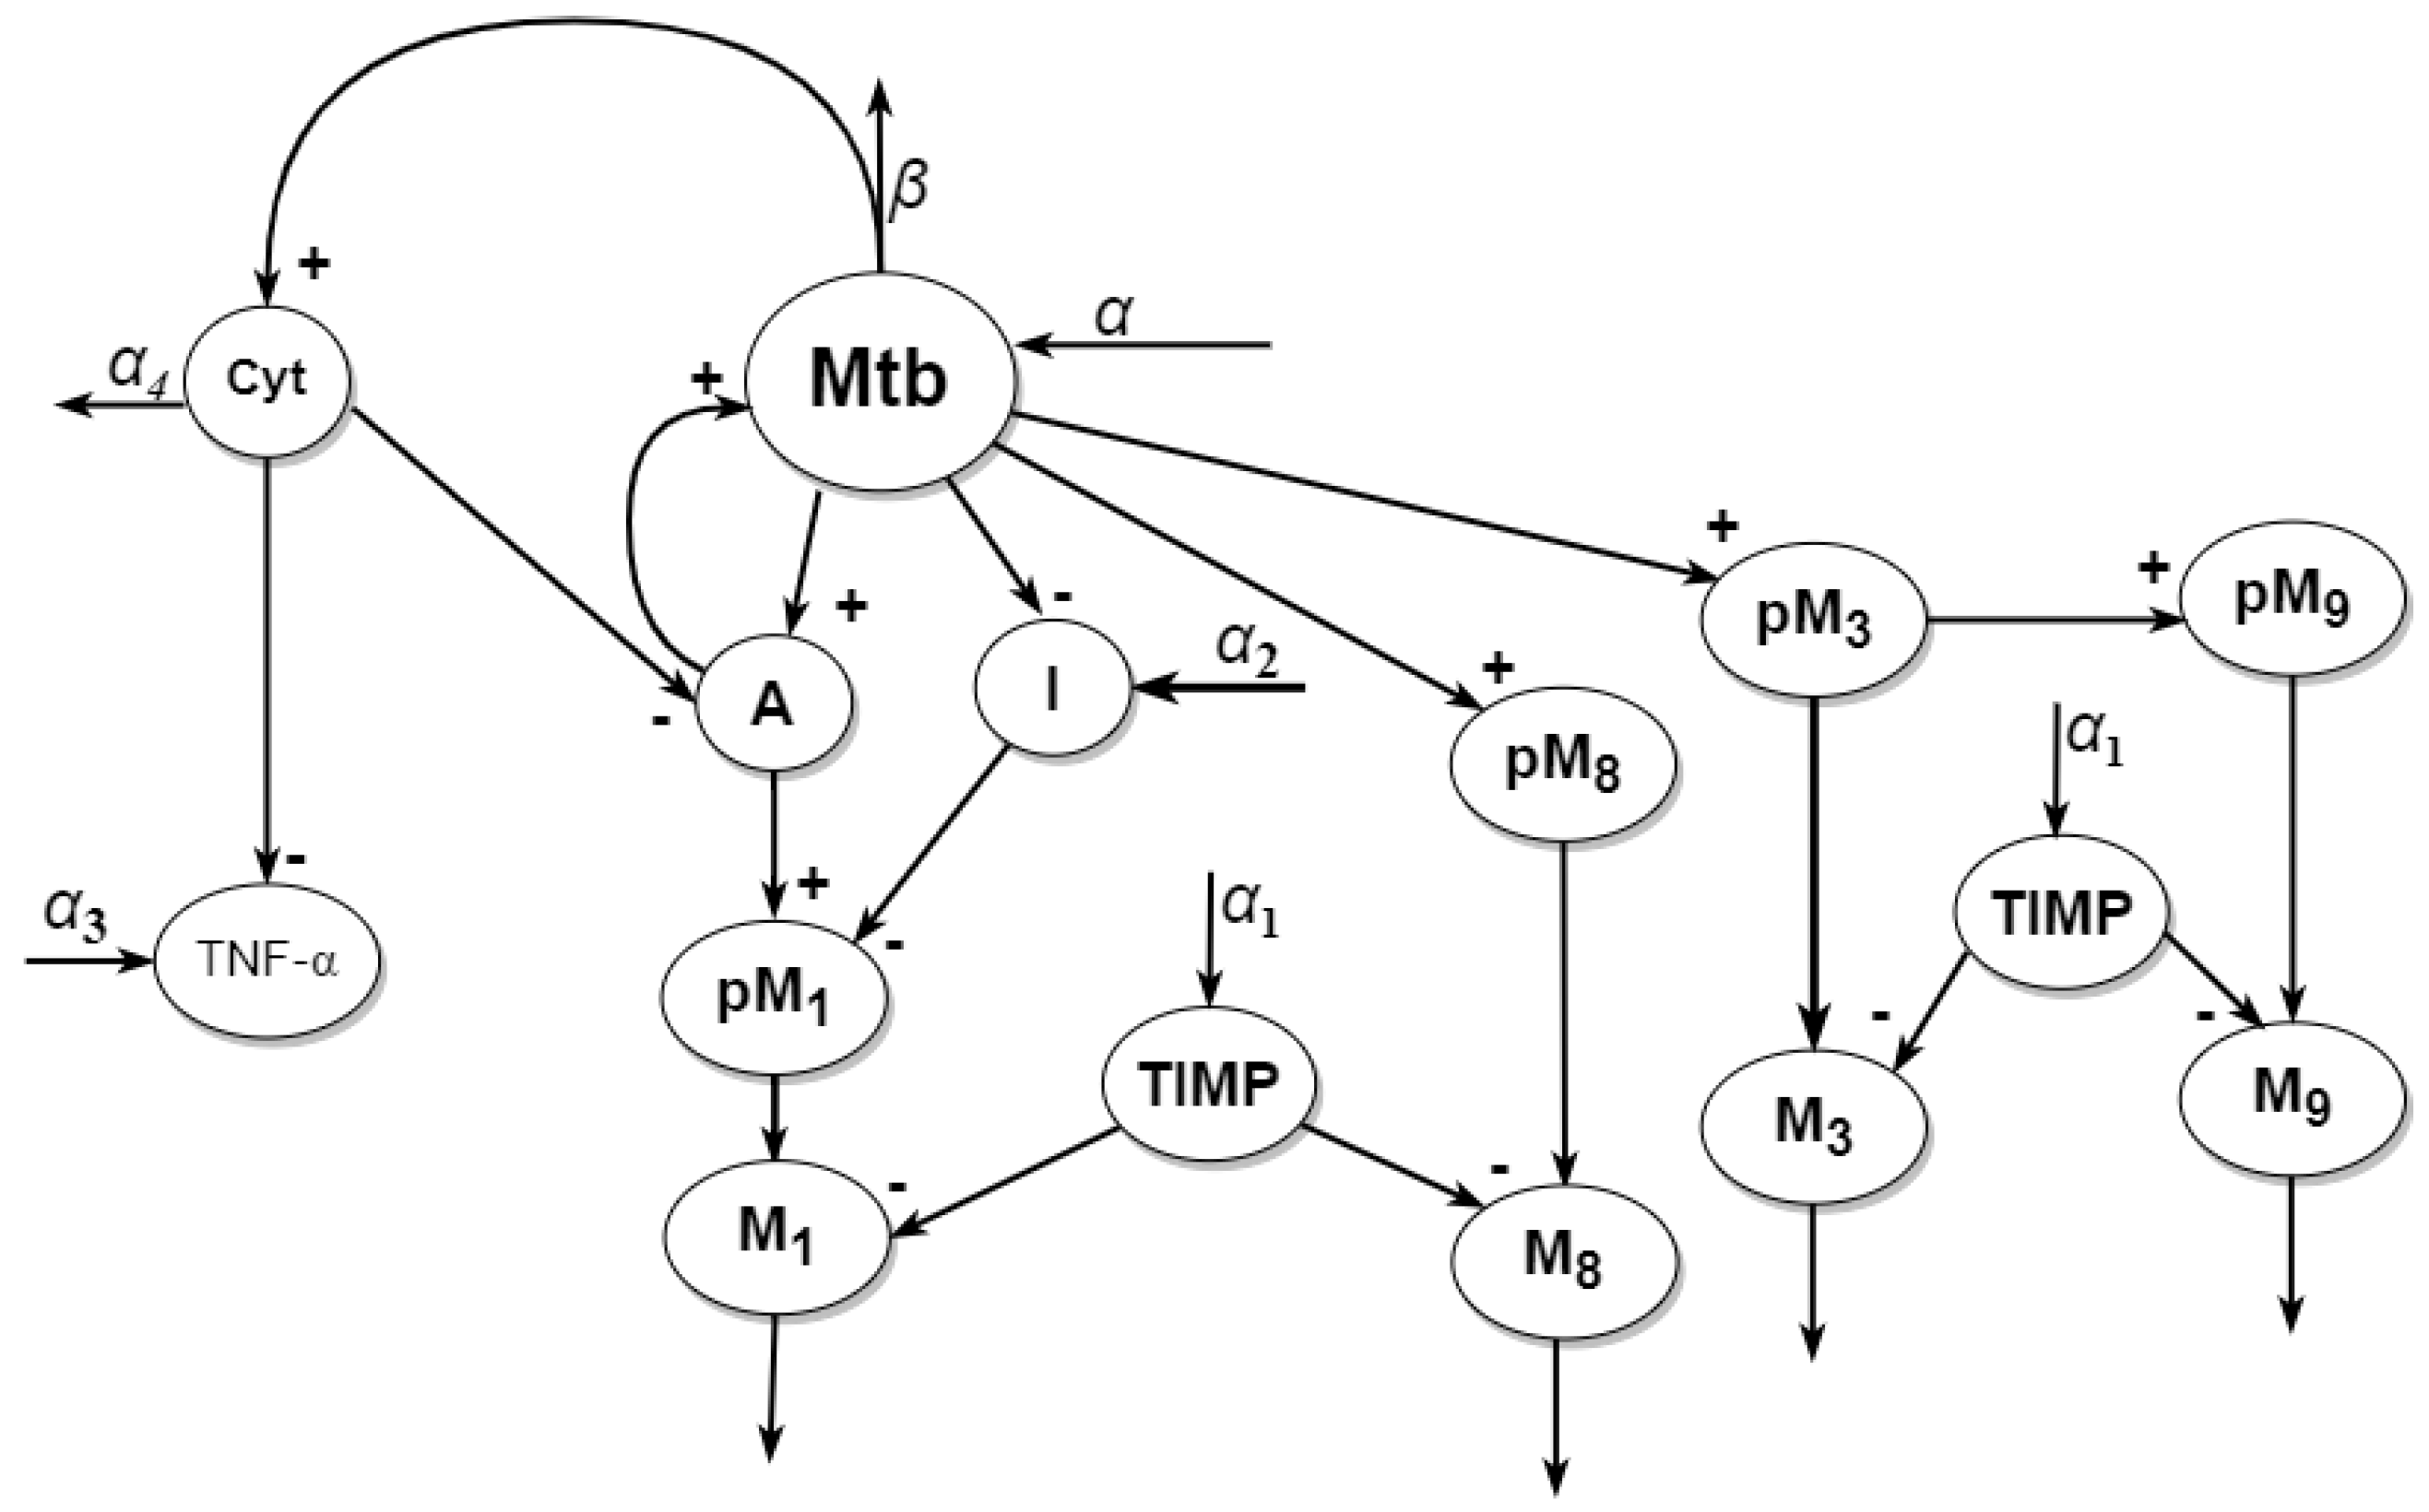
2. Model
2.1. Model Statement
2.2. Model Reduction
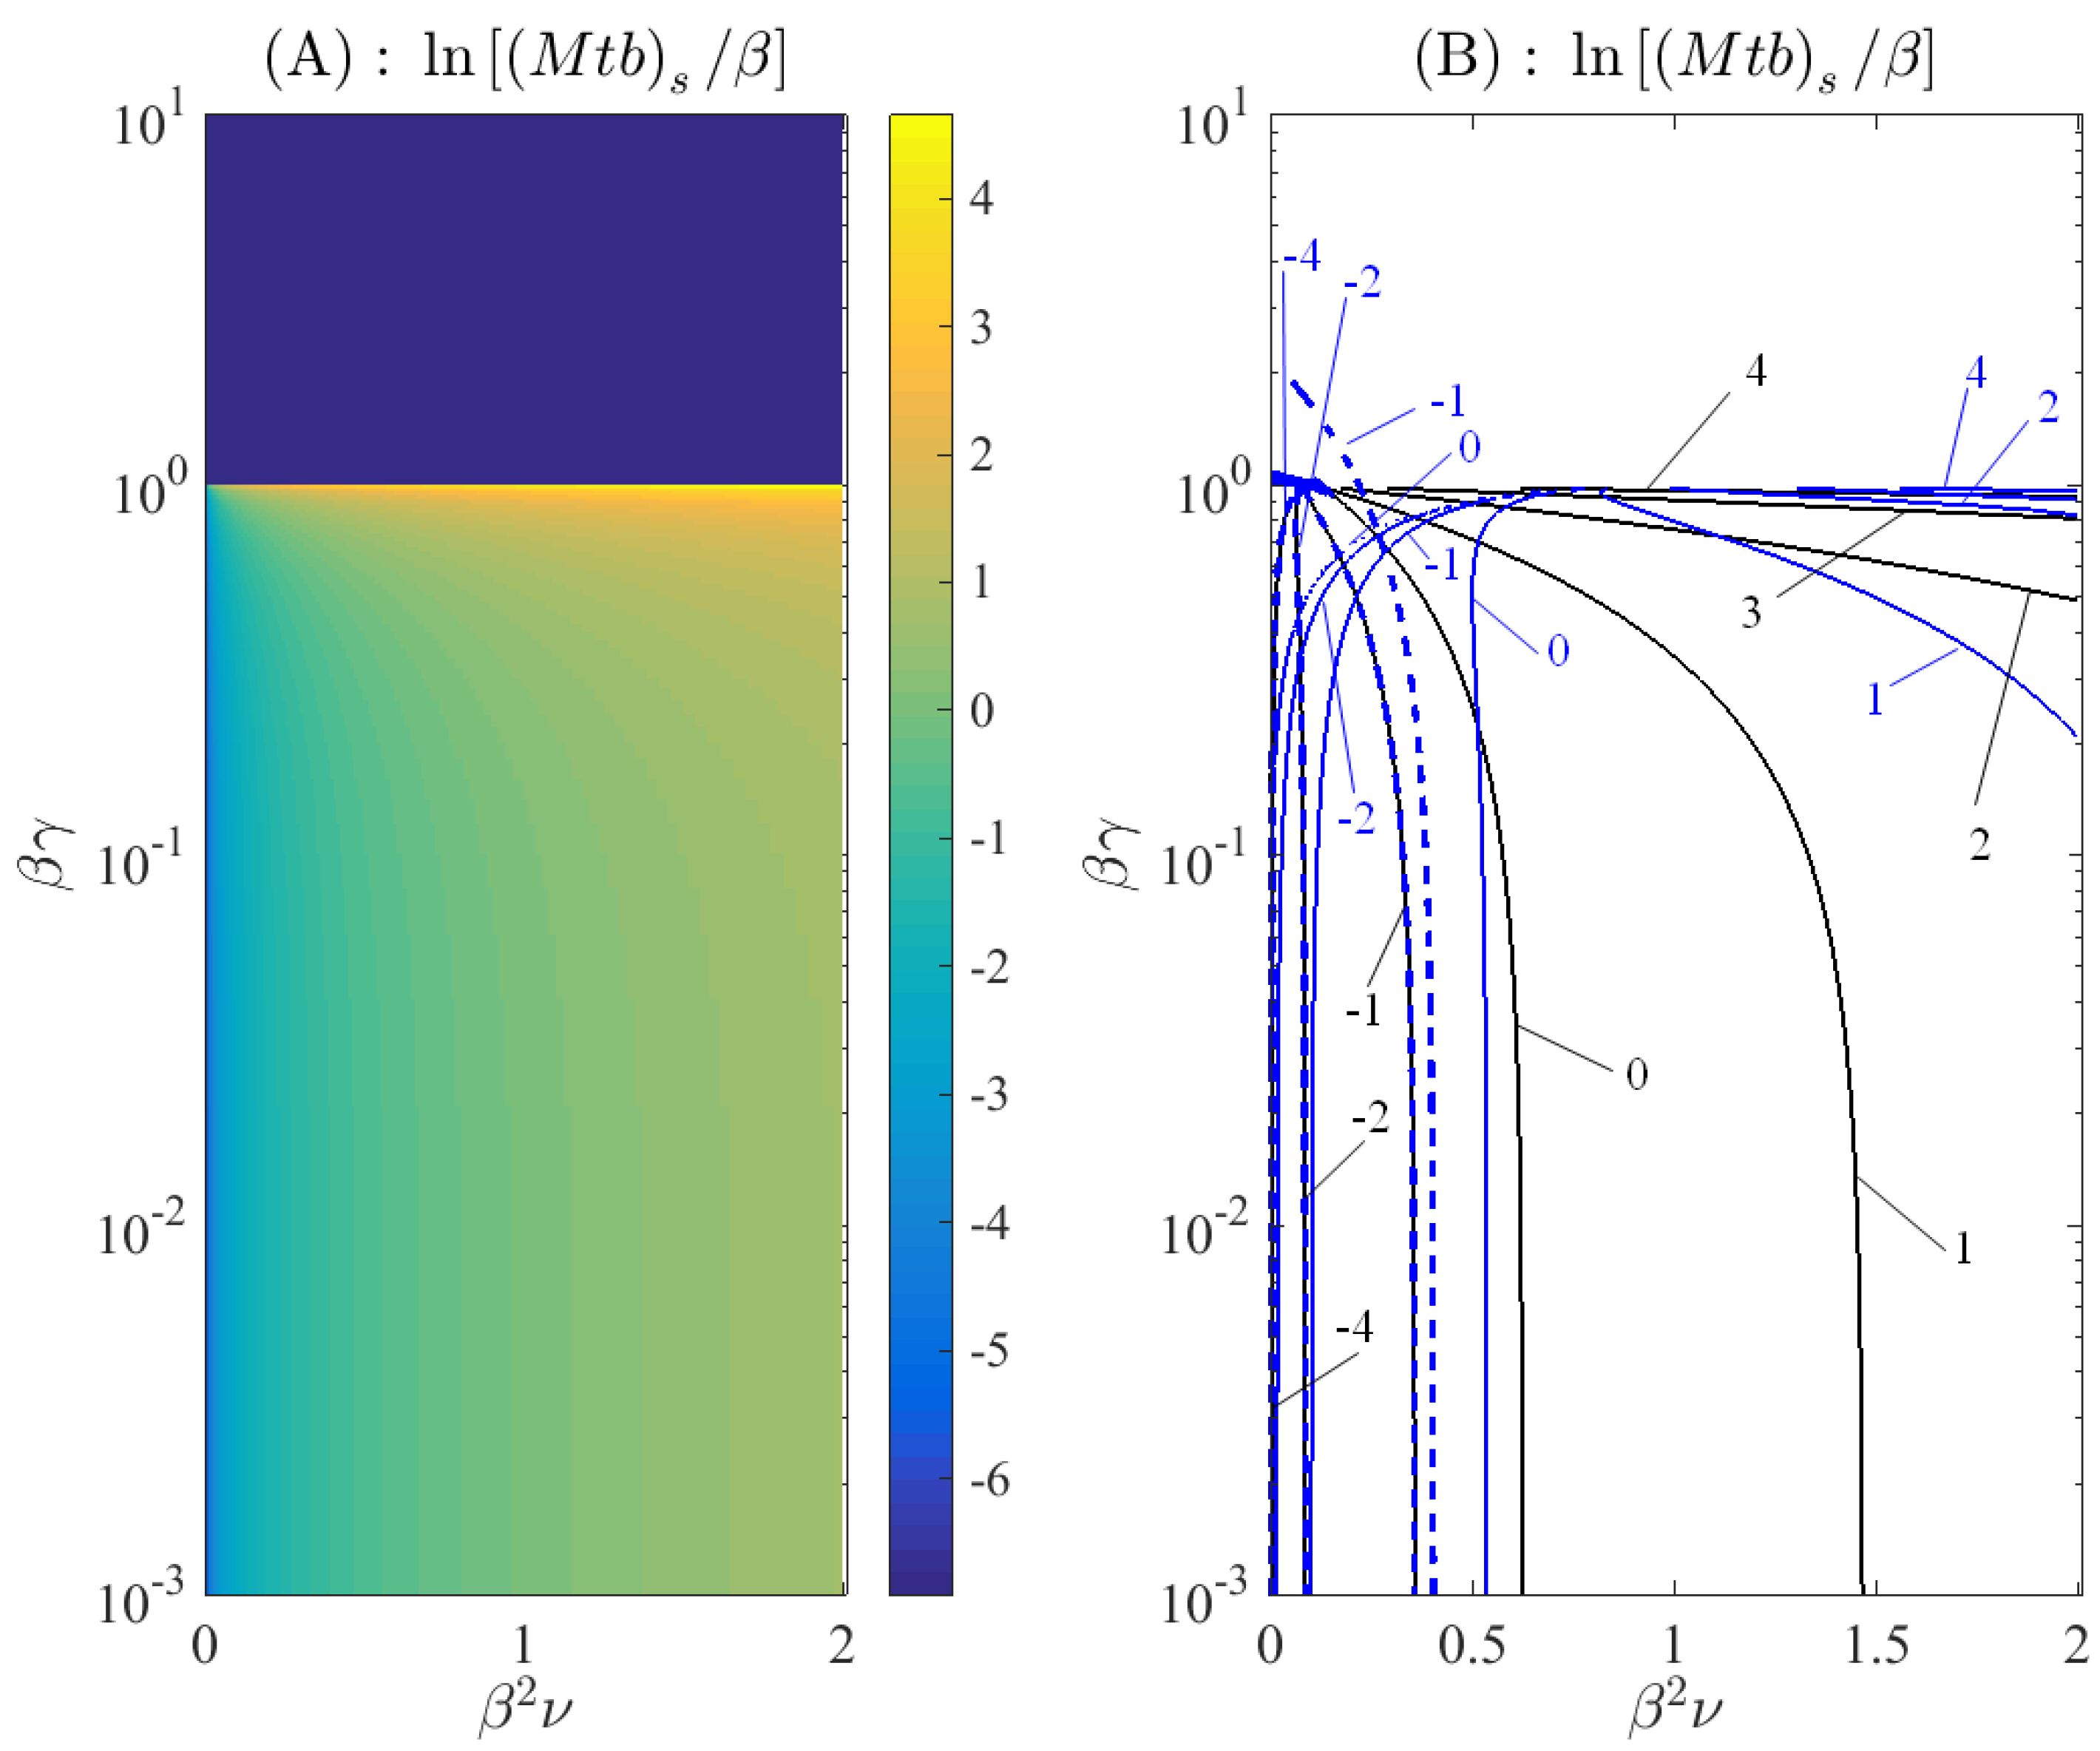
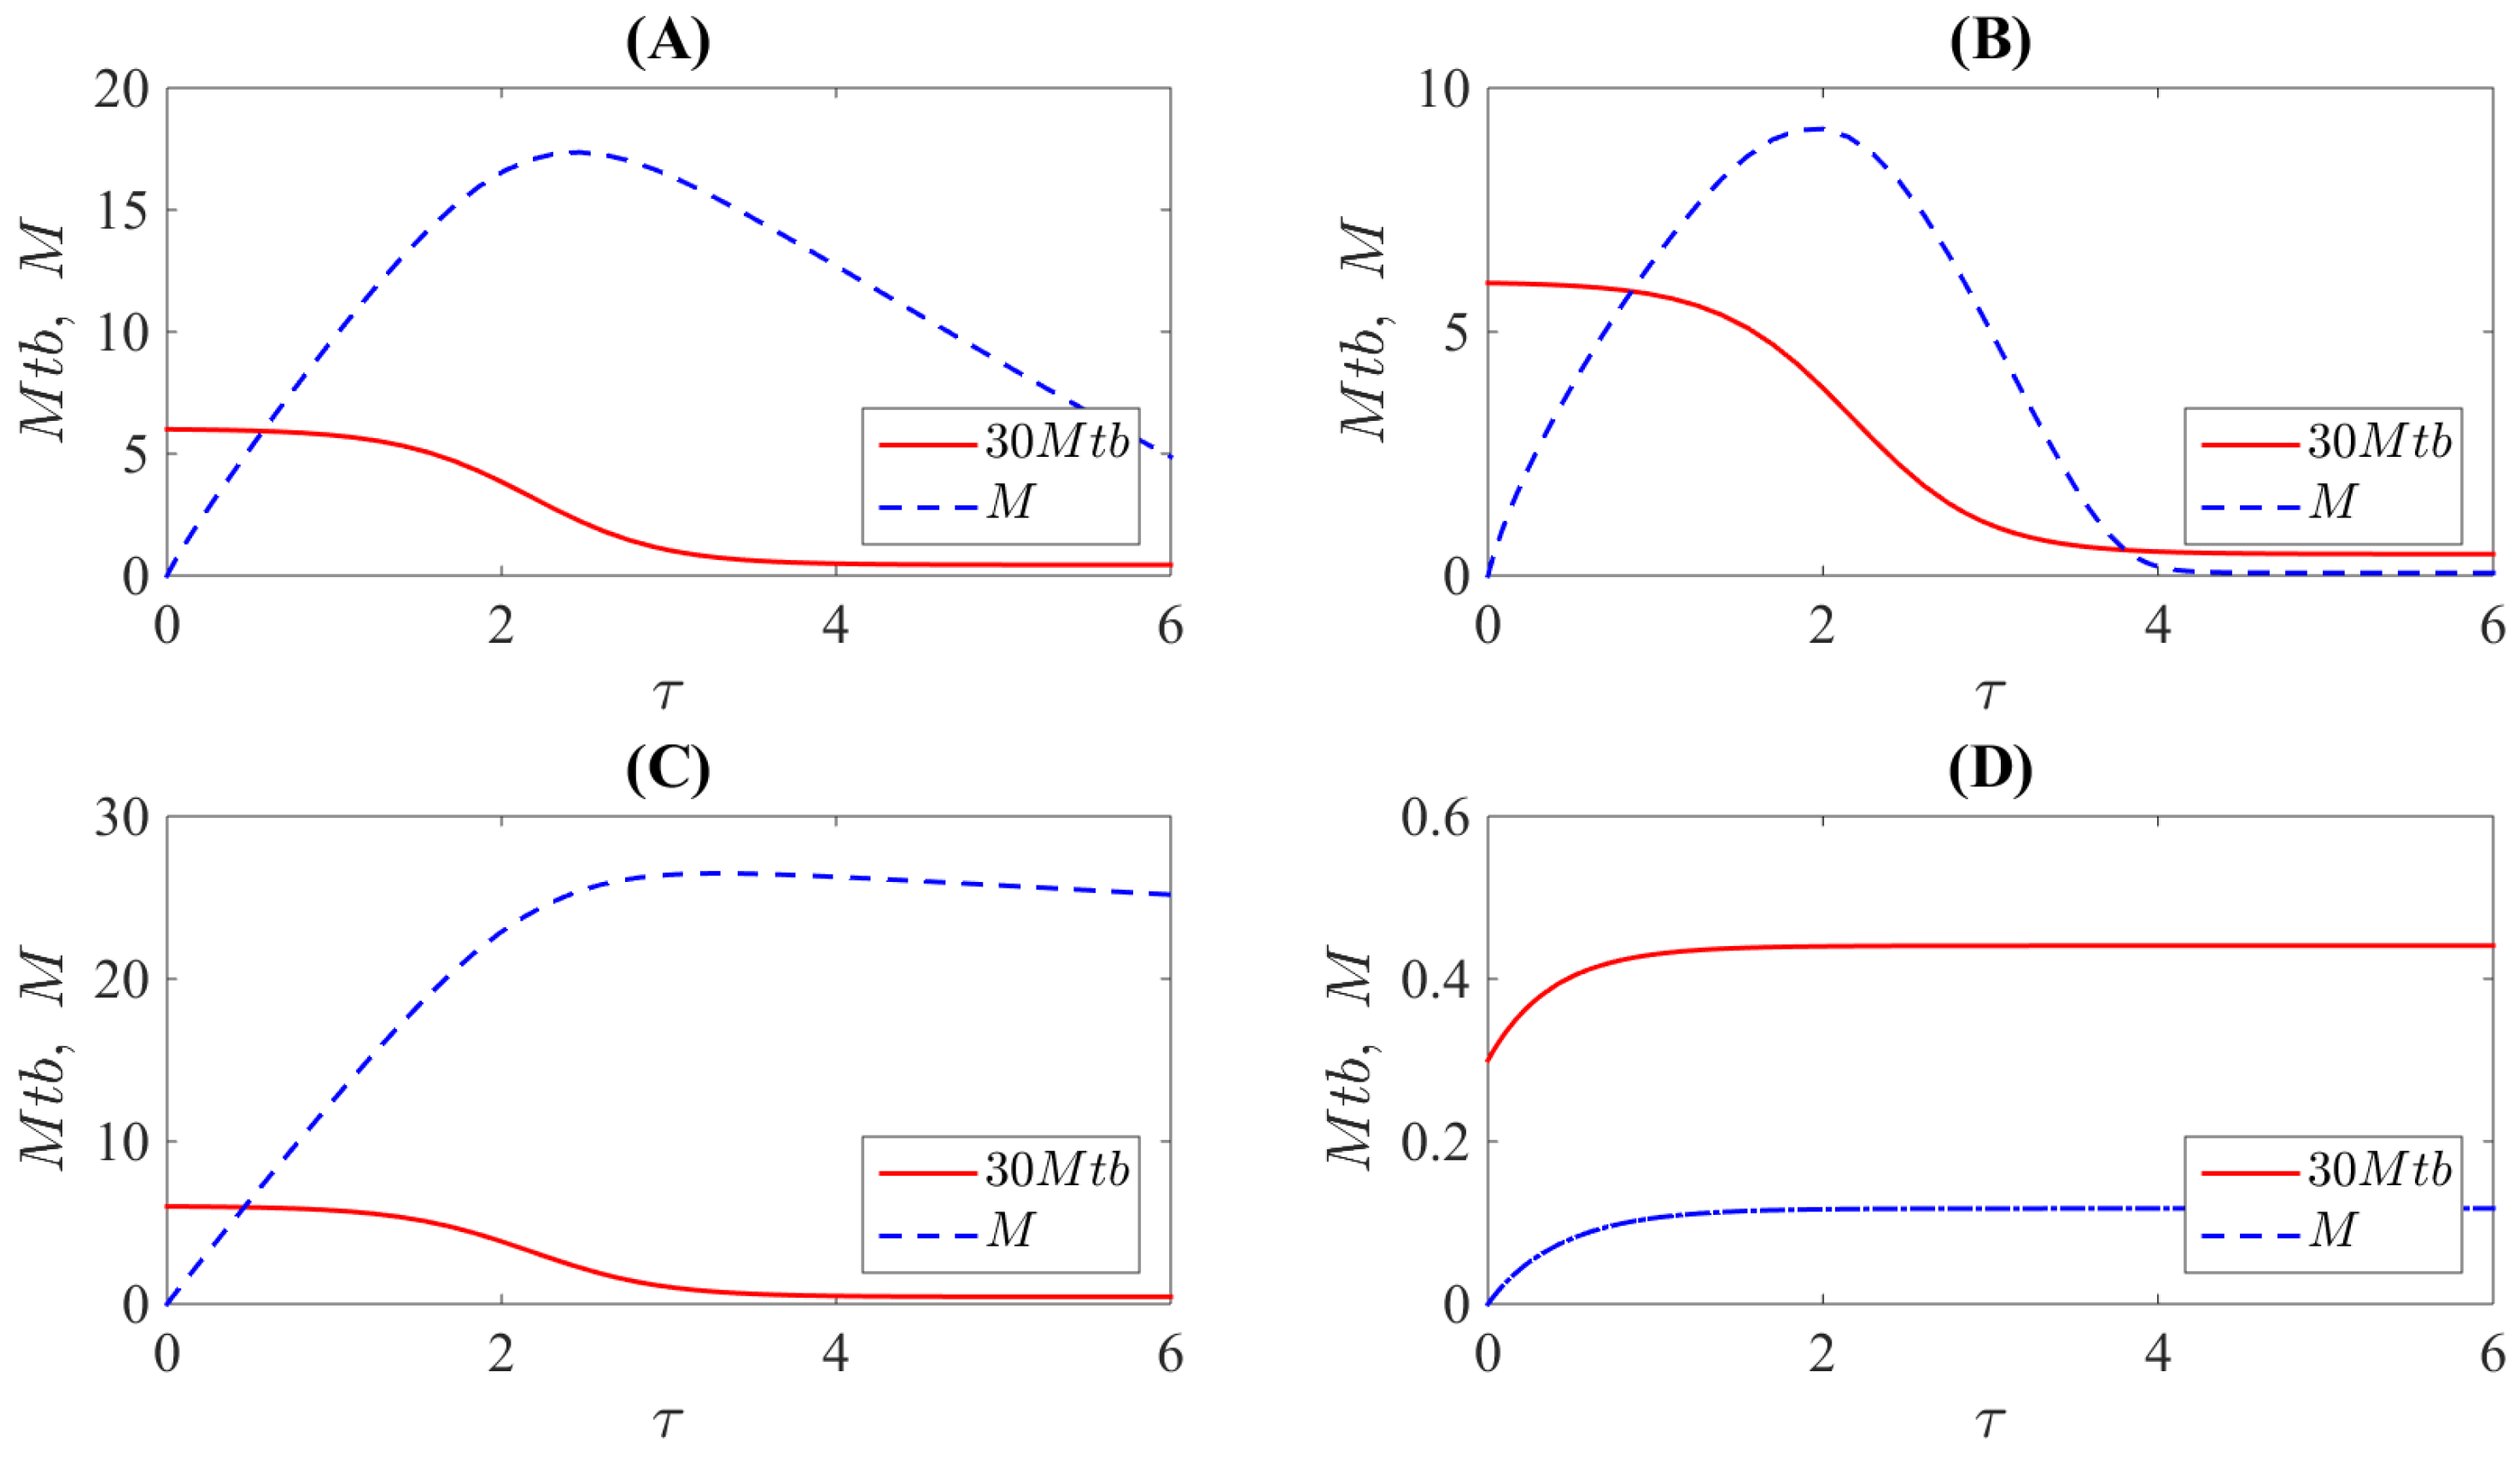
3. Results
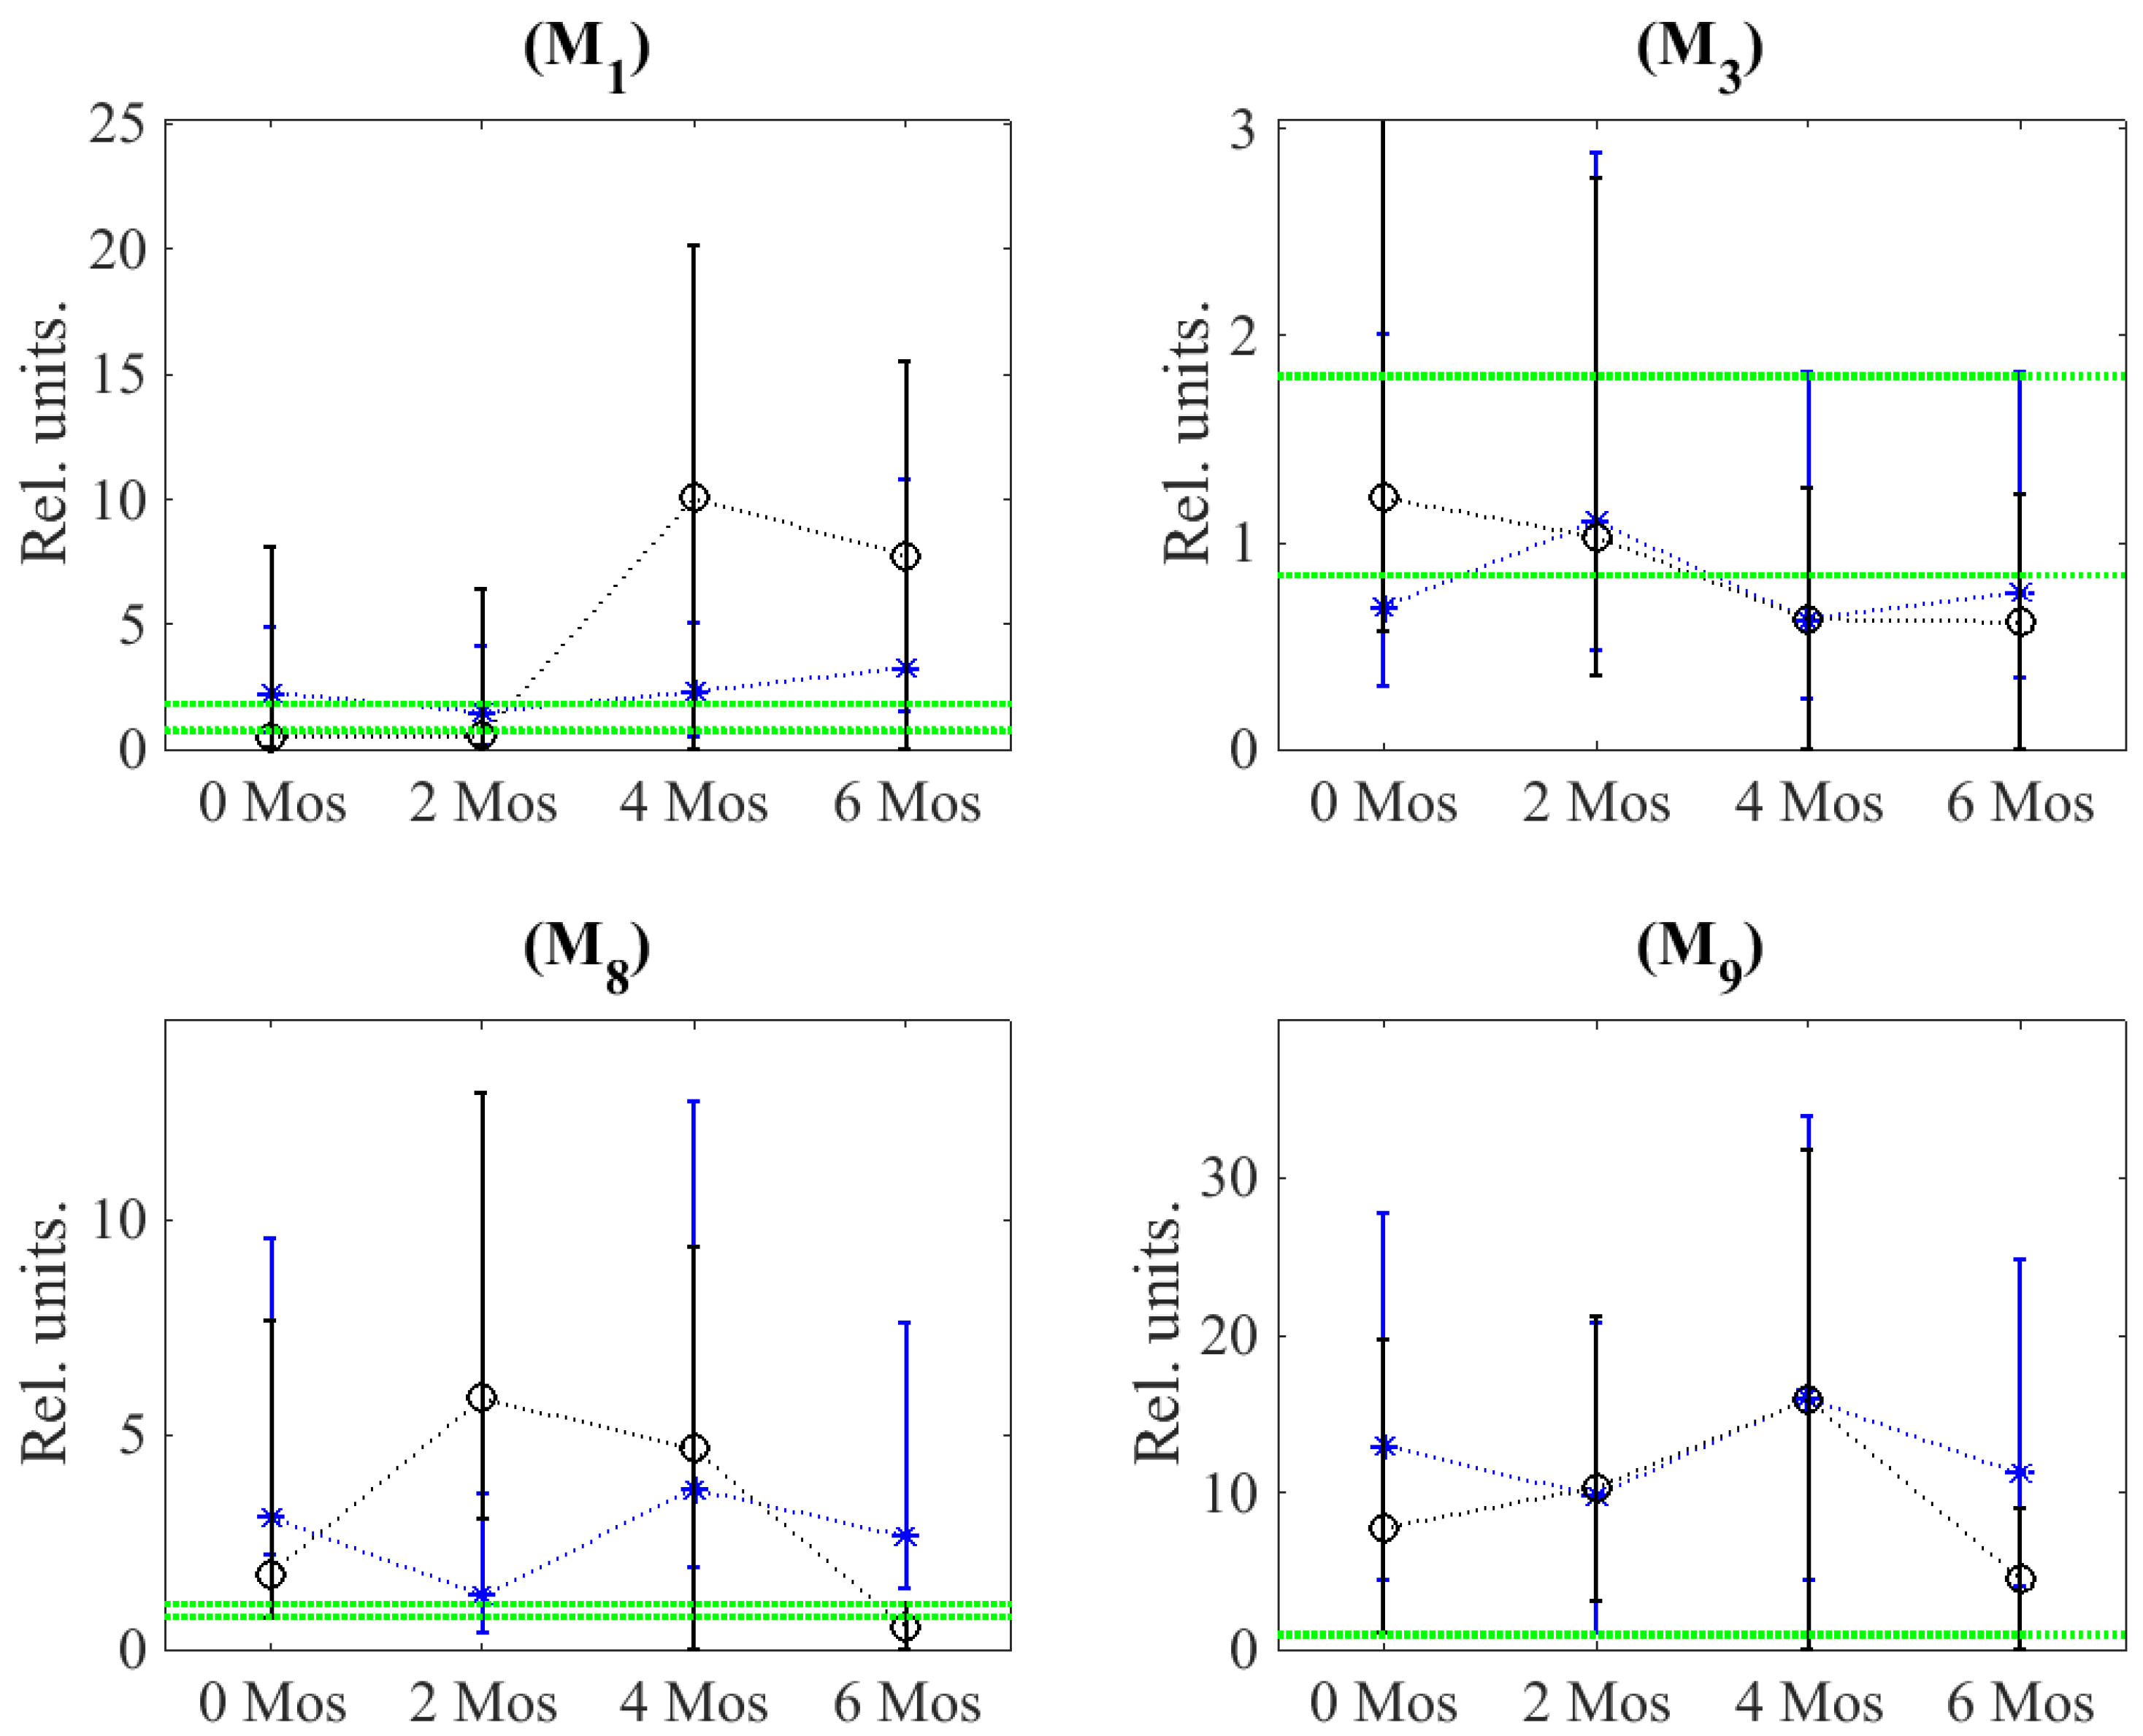
Dynamics of Matrix Metalloproteinases
4. Discussion
5. Conclusions
Supplementary Materials
Author Contributions
Funding
Informed Consent Statement
Data Availability Statement
Conflicts of Interest
References
- Pieters, J.; McKinney, J.D. (Eds.) Pathogenesis of Mycobacterium tuberculosis and Its Interaction with the Host Organism; Springer: Berlin/Heidelberg, Germany, 2013. [Google Scholar]
- Kirschner, D.; Pienaar, E.; Marino, S.; Linderman, J.J. A review of computational and mathematical modeling contributions to our understanding of Mycobacterium tuberculosis within-host infection and treatment. Curr. Opin. Syst. Biol. 2017, 3, 170–185. [Google Scholar] [CrossRef] [PubMed]
- Cadena, A.M.; Fortune, S.M.; Flynn, J.L. Heterogeneity in tuberculosis. Nat. Rev. Immunol. 2017, 17, 691–702. [Google Scholar] [CrossRef] [PubMed]
- Magombedze, G.; Marino, S. Mathematical and computational approaches in understanding the immunobiology of granulomatous diseases. Curr. Opin. Syst. Biol. 2018, 12, 1–11. [Google Scholar] [CrossRef]
- Vlazaki, M.; Huber, J.; Restif, O. Integrating mathematical models with experimental data to investigate the within-host dynamics of bacterial infections. Pathog. Dis. 2019, 77, ftaa001. [Google Scholar] [CrossRef] [PubMed]
- Elkington, P.; Polak, M.E.; Reichmann, M.T.; Leslie, A. Understanding the tuberculosis granuloma: The matrix revolutions. Trends Mol. Med. 2022, 28, 143–154. [Google Scholar] [CrossRef] [PubMed]
- Layre, E. Trafficking of Mycobacterium tuberculosis envelope components and release within extracellular vesicles: Host-pathogen interactions beyond the wall. Front. Immunol. 2020, 11, 1230. [Google Scholar] [CrossRef]
- Abreu, R.; Giri, P.; Quinn, F. Host-pathogen interaction as a novel target for host-directed therapies in tuberculosis. Front. Immunol. 2020, 11, 1553. [Google Scholar] [CrossRef] [PubMed]
- Urbanowski, M.E.; Ordonez, A.A.; Ruiz-Bedoya, C.A.; Jain, S.K.; Bishai, W.R. Cavitary tuberculosis: The gateway of disease transmission. Lancet Infect. Dis. 2020, 20, e117–e128. [Google Scholar] [CrossRef]
- Kathamuthu, G.R.; Kumar, N.P.; Moideen, K.; Nair, D.; Banurekha, V.V.; Sridhar, R.; Baskaran, D.; Babu, S. Matrix metalloproteinases and tissue inhibitors of metalloproteinases are potential biomarkers of pulmonary and extra-pulmonary tuberculosis. Front. Immunol. 2020, 11, 419. [Google Scholar] [CrossRef]
- Yu, Y.; Jiang, X.X.; Li, J.C. Biomarker discovery for tuberculosis using metabolomics. Front. Mol. Biosci. 2023, 10, 1099654. [Google Scholar] [CrossRef]
- Elkington, P.T.; Ugarte-Gil, C.A.; Friedland, J.S. Matrix metalloproteinases in tuberculosis. Eur. Respir. J. 2011, 38, 456–464. [Google Scholar] [CrossRef] [PubMed]
- Sabir, N.; Hussain, T.; Mangi, M.H.; Zhao, D.; Zhou, X. Matrix metalloproteinases: Expression, regulation and role in the immunopathology of tuberculosis. Cell Prolif. 2019, 52, e12649. [Google Scholar] [CrossRef] [PubMed]
- Rohlwink, U.K.; Walker, N.F.; Ordonez, A.A.; Li, Y.J.; Tucker, E.W.; Elkington, P.T.; Wilkinson, R.J.; Wilkinson, K.A. Matrix Metalloproteinases in Pulmonary and Central Nervous System Tuberculosis—A Review. Int. J. Mol. Sci. 2019, 20, 1350. [Google Scholar] [CrossRef] [PubMed]
- Lavrova, A.I.; Esmedljaeva, D.S.; Belik, V.; Postnikov, E.B. Matrix metalloproteinases as markers of acute inflammation process in the pulmonary tuberculosis. Data 2019, 4, 137. [Google Scholar] [CrossRef]
- Nogueira, B.M.F.; Krishnan, S.; Barreto-Duarte, B.; Araújo-Pereira, M.; Queiroz, A.T.L.; Ellner, J.J.; Salgame, P.; Scriba, T.J.; Sterling, T.R.; Gupta, A.; et al. Diagnostic biomarkers for active tuberculosis: Progress and challenges. EMBO Mol. Med. 2022, 14, e14088. [Google Scholar] [CrossRef]
- Kumar, N.P.; Moideen, K.; Nancy, A.; Viswanathan, V.; Thiruvengadam, K.; Sivakumar, S.; Hissar, S.; Nair, D.; Banurekha, V.V.; Kornfeld, H.; et al. Association of Plasma Matrix Metalloproteinase and Tissue Inhibitors of Matrix Metalloproteinase Levels With Adverse Treatment Outcomes Among Patients With Pulmonary Tuberculosis. JAMA Netw. Open 2020, 3, e2027754. [Google Scholar] [CrossRef]
- Postnikov, E.B.; Esmedljaeva, D.S.; Lavrova, A.I. A CatBoost machine learning for prognosis of pathogen’s drug resistance in pulmonary tuberculosis. In Proceedings of the 2020 IEEE 2nd Global Conference on Life Sciences and Technologies (LifeTech), Kyoto, Japan, 10–12 March 2020; pp. 86–87. [Google Scholar] [CrossRef]
- Lavrova, A.I.; Postnikov, E.B. An Improved Diagnostic of the Mycobacterium tuberculosis Drug Resistance Status by Applying a Decision Tree to Probabilities Assigned by the CatBoost Multiclassifier of Matrix Metalloproteinases Biomarkers. Diagnostics 2022, 12, 2847. [Google Scholar] [CrossRef]
- Leonard-Duke, J.; Evans, S.; Hannan, R.T.; Barker, T.H.; Bates, J.H.T.; Bonham, C.A.; Moore, B.B.; Kirschner, D.E.; Peirce, S.M. Multi-scale models of lung fibrosis. Matrix Biol. 2020, 91, 35–50. [Google Scholar] [CrossRef]
- Ruggiero, S.M.; Pilvankar, M.R.; Ford Versypt, A.N. Mathematical modeling of tuberculosis granuloma activation. Processes 2017, 5, 79. [Google Scholar] [CrossRef]
- Prats, C.; Vilaplana, C.; Valls, J.; Marzo, E.; Cardona, P.J.; López, D. Local inflammation, dissemination and coalescence of lesions are key for the progression toward active tuberculosis: The bubble model. Front. Microbiol. 2016, 7, 33. [Google Scholar] [CrossRef]
- Lin, P.L.; Ford, C.B.; Coleman, M.T.; Myers, A.J.; Gawande, R.; Ioerger, T.; Sacchettini, J.; Fortune, S.M.; Flynn, J.L. Sterilization of granulomas is common in active and latent tuberculosis despite within-host variability in bacterial killing. Nat. Med. 2014, 20, 75–79. [Google Scholar] [CrossRef] [PubMed]
- Minucci, S.; Heise, R.L.; Valentine, M.S.; Gninzeko, F.J.K.; Reynolds, A.M. Mathematical modeling of ventilator-induced lung inflammation. J. Theor. Biol. 2021, 526, 110738. [Google Scholar] [CrossRef] [PubMed]
- Sharebiani, H.; Hajimiri, S.; Abbasnia, S.; Soleimanpour, S.; Asnaashari, A.M.H.; Valizadeh, N.; Derakhshan, M.; Pilpa, R.; Firouzeh, A.; Ghazvini, K.; et al. Game theory applications in host-microbe interactions toward disease manifestation: Mycobacterium tuberculosis infection as an example. Iran. J. Basic Med. Sci. 2021, 24, 1324–1335. [Google Scholar] [CrossRef] [PubMed]
- Sershen, C.L.; Salim, T.; May, E.E. Investigating the comorbidity of COPD and tuberculosis, a computational study. Front. Syst. Biol. 2023, 3, 940097. [Google Scholar] [CrossRef]
- Lavrova, A.I.; Postnikov, E.B.; Esmedljaeva, D.S. Mathematical modeling of cavity development in lung tuberculosis. Proc. SPIE 2021, 11847, 1184707. [Google Scholar] [CrossRef]
- Bazykin, A.D. Nonlinear Dynamics of Interacting Populations; World Scientific: Singapore, 1998. [Google Scholar]
- Kryvohuz, M.; Mukamel, S. Nonlinear response theory in chemical kinetics. J. Chem. Phys. 2014, 140, 034111. [Google Scholar] [CrossRef]
- Amaral, E.P.; Vinhaes, C.L.; Oliveira-de Souza, D.; Nogueira, B.; Akrami, K.M.; Andrade, B.B. The interplay between systemic inflammation, oxidative stress, and tissue remodeling in tuberculosis. Antioxidants Redox Signal. 2021, 34, 471–485. [Google Scholar] [CrossRef]
- Kremer, M. Population Growth and Technological Change: One Million B.C. to 1990. Q. J. Econ. 1993, 108, 681–716. [Google Scholar] [CrossRef]
- Markov, A.V.; Korotayev, A.V. Phanerozoic marine biodiversity follows a hyperbolic trend. Palaeoworld 2007, 16, 311–318. [Google Scholar] [CrossRef]
- Holling, C.S. Some Characteristics of Simple Types of Predation and Parasitism. Can. Entomol. 1959, 91, 385–398. [Google Scholar] [CrossRef]
- Ashby, M.T. Appreciating formal similarities in the kinetics of homogeneous, heterogeneous, and enzyme catalysis. J. Chem. Educ. 2007, 84, 1515. [Google Scholar] [CrossRef]
- Weller, S.W. Kinetics of heterogeneous catalyzed reactions. Catal. Rev. 1992, 34, 227–280. [Google Scholar] [CrossRef]


Disclaimer/Publisher’s Note: The statements, opinions and data contained in all publications are solely those of the individual author(s) and contributor(s) and not of MDPI and/or the editor(s). MDPI and/or the editor(s) disclaim responsibility for any injury to people or property resulting from any ideas, methods, instructions or products referred to in the content. |
© 2023 by the authors. Licensee MDPI, Basel, Switzerland. This article is an open access article distributed under the terms and conditions of the Creative Commons Attribution (CC BY) license (https://creativecommons.org/licenses/by/4.0/).
Share and Cite
Lavrova, A.I.; Esmedljaeva, D.S.; Postnikov, E.B. Modelling of Interaction Dynamics of a Pathogen and Bio-Markers (Matrix Metalloproteinases) of Tissue Destruction in Pulmonary Tuberculosis. Mathematics 2023, 11, 4522. https://doi.org/10.3390/math11214522
Lavrova AI, Esmedljaeva DS, Postnikov EB. Modelling of Interaction Dynamics of a Pathogen and Bio-Markers (Matrix Metalloproteinases) of Tissue Destruction in Pulmonary Tuberculosis. Mathematics. 2023; 11(21):4522. https://doi.org/10.3390/math11214522
Chicago/Turabian StyleLavrova, Anastasia I., Dilyara S. Esmedljaeva, and Eugene B. Postnikov. 2023. "Modelling of Interaction Dynamics of a Pathogen and Bio-Markers (Matrix Metalloproteinases) of Tissue Destruction in Pulmonary Tuberculosis" Mathematics 11, no. 21: 4522. https://doi.org/10.3390/math11214522