
Diffusion Simulation on Mammograms: A Technique for Analyzing and Monitoring Breast Tumors

Abstract
:
1. Introduction
2. MDC Calculation
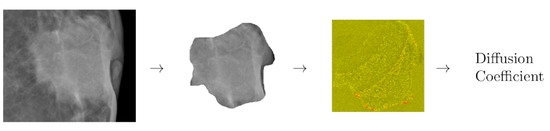
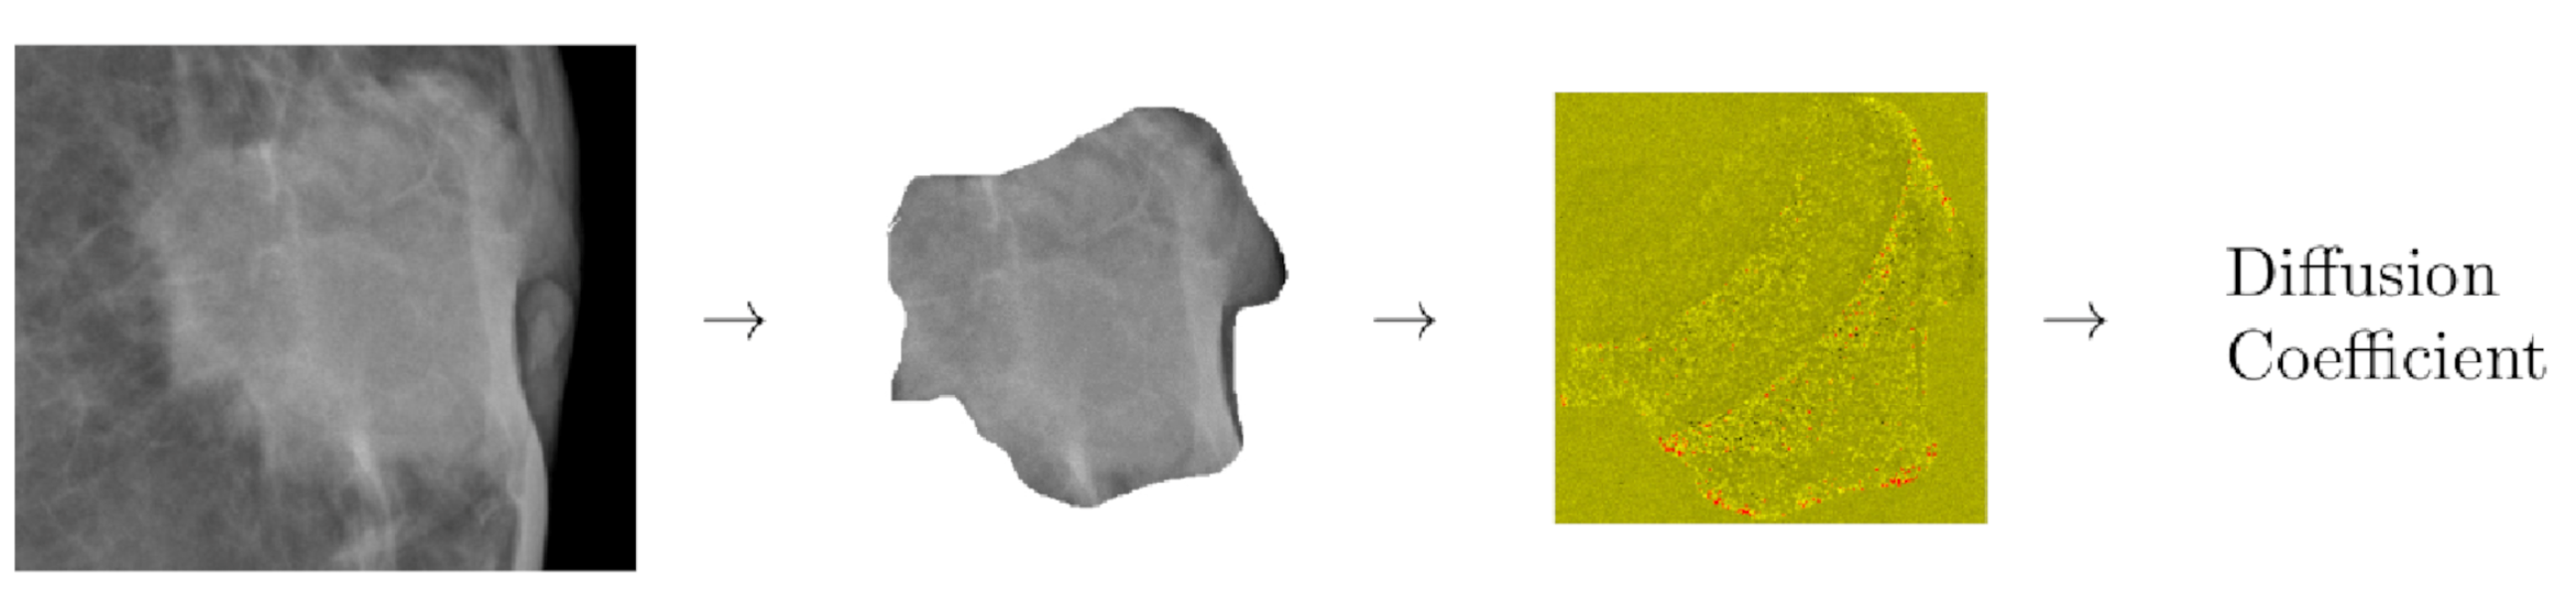
2.1. Building the Simulation Space from Mammograms
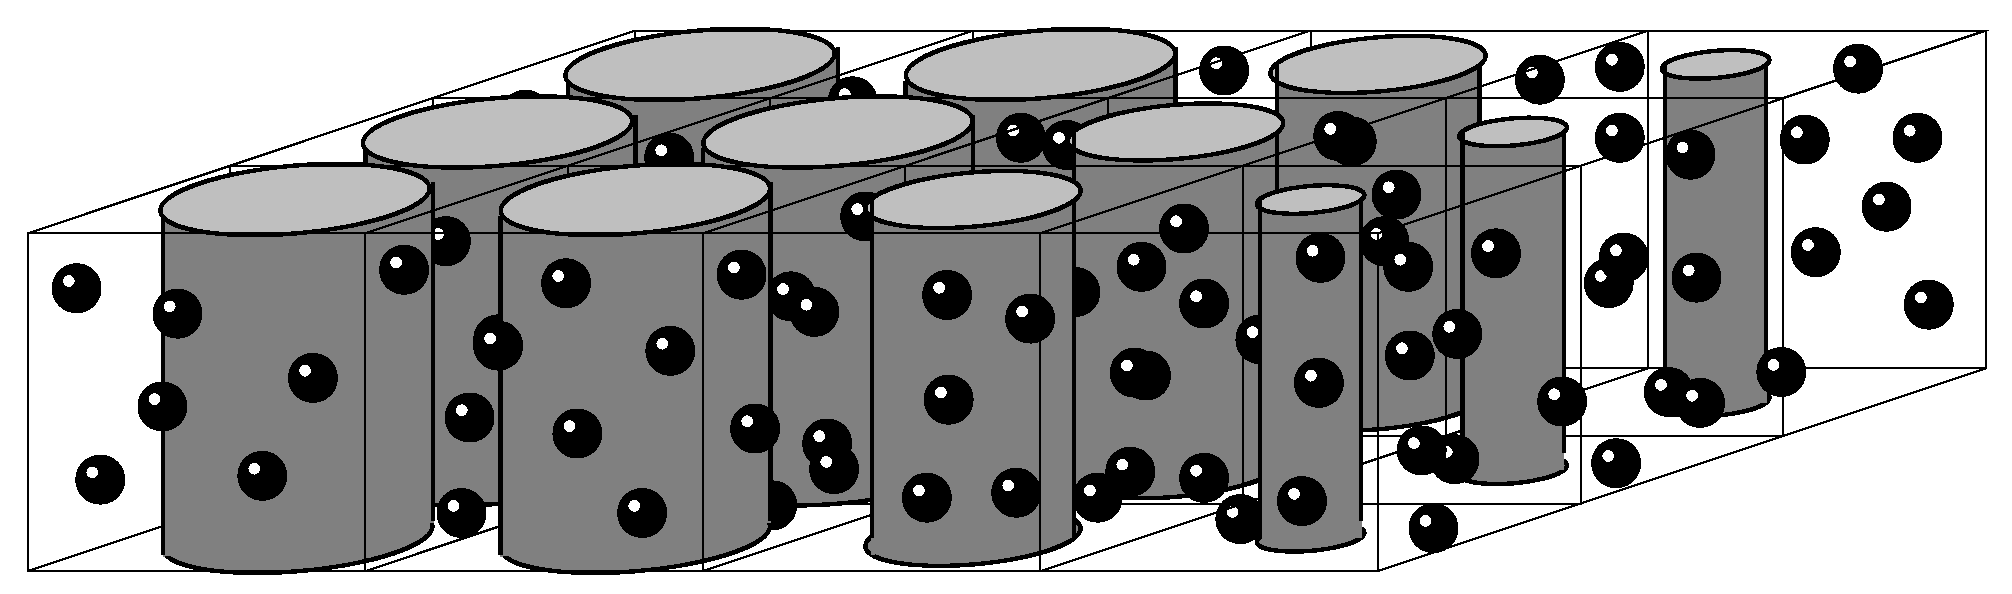
2.2. Mesoscopic Technique
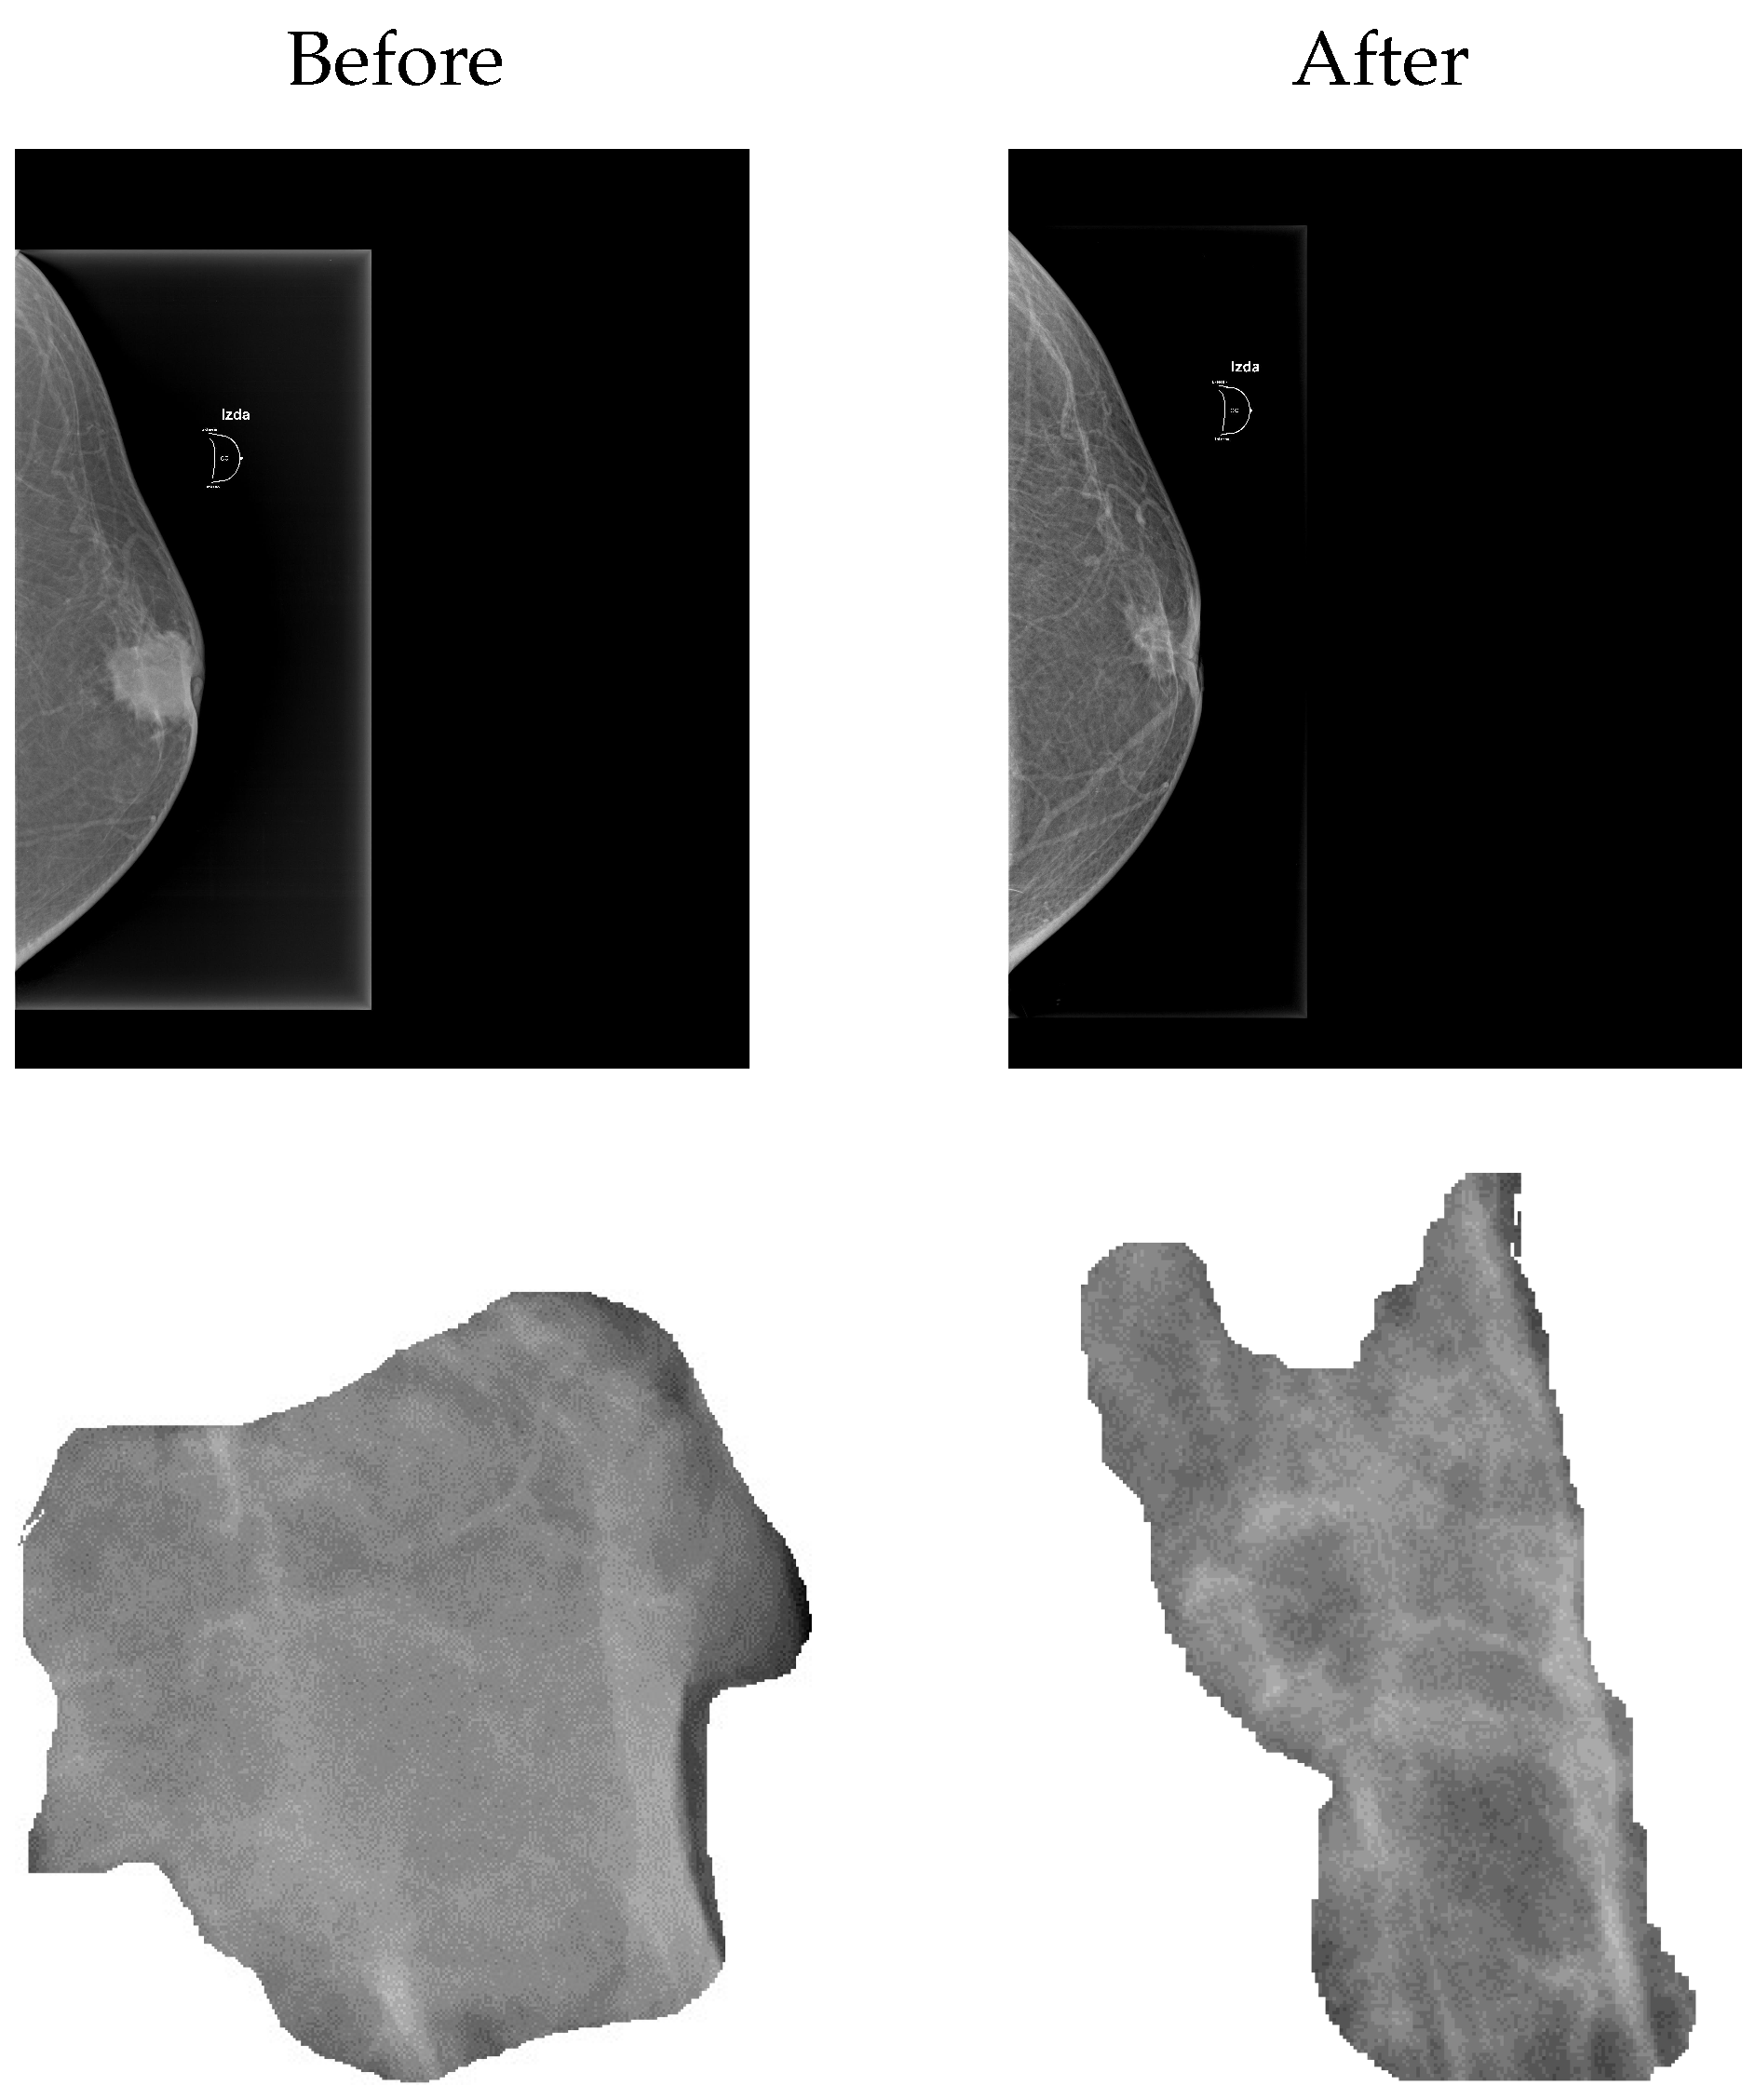
3. Results
4. Conclusions
5. Patents
Author Contributions
Funding
Data Availability Statement
Acknowledgments
Conflicts of Interest
References
- Dorrius, M.D.; Dijkstra, H.; Oudkerk, M.; Sijens, P.E. Effect of b value and pre-admission of contrast on diagnostic accuracy of 1.5-T breast DWI: A systematic review and meta-analysis. Eur. Radiol. 2014, 24, 2835–2847. [Google Scholar] [CrossRef] [PubMed]
- Shi, R.Y.; Yao, Q.Y.; Wu, L.M.; Xu, J.R. Breast lesions: Diagnosis using diffusion weighted imaging at 1.5 T and 3.0 T—Systematic review and meta-analysis. Clin. Breast Cancer 2018, 18, e305–e320. [Google Scholar] [CrossRef] [PubMed]
- Chen, X.; Li, W.L.; Zhang, Y.L.; Wu, Q.; Guo, Y.M.; Bai, Z.L. Meta-analysis of quantitative diffusion-weighted MR imaging in the differential diagnosis of breast lesions. BMC Cancer 2010, 10, 693. [Google Scholar] [CrossRef] [PubMed]
- Iima, M.; Honda, M.; Sigmund, E.E.; Ohno Kishimoto, A.; Kataoka, M.; Togashi, K. Diffusion MRI of the breast: Current status and future directions. J. Magn. Reson. Imaging 2019, 52, 70–90. [Google Scholar] [CrossRef] [PubMed]
- Messina, C.; Bignone, R.; Bruno, A.; Bruno, A.; Bruno, F.; Calandri, M.; Caruso, D.; Coppolino, P.; De Robertis, R.; Gentili, F.; et al. Diffusion-weighted imaging in oncology: An update. Cancers 2020, 12, 1493. [Google Scholar] [CrossRef]
- Belli, P.; Costantini, M.; Ierardi, C.; Bufi, E.; Amato, D.; Mule’, A.; Nardone, L.; Terribile, D.; Bonomo, L. Diffusion-weighted imaging in evaluating the response to neoadjuvant breast cancer treatment. Breast J. 2011, 17, 610–619. [Google Scholar] [CrossRef] [PubMed]
- Fangberget, A.; Nilsen, L.; Hole, K.H.; Holmen, M.; Engebraaten, O.; Naume, B.; Smith, H.J.; Olsen, D.R.; Seierstad, T. Neoadjuvant chemotherapy in breast cancer-response evaluation and prediction of response to treatment using dynamic contrast-enhanced and diffusion-weighted MR imaging. Eur. Radiol. 2011, 21, 1188–1199. [Google Scholar] [CrossRef]
- Bufi, E.; Belli, P.; Di Matteo, M.; Terribile, D.; Franceschini, G.; Nardone, L.; Petrone, G.; Bonomo, L. Effect of breast cancer phenotype on diagnostic performance of MRI in the prediction to response to neoadjuvant treatment. Eur. J. Radiol. 2014, 83, 1631–1638. [Google Scholar] [CrossRef]
- Park, S.H.; Moon, W.K.; Cho, N.; Chang, J.M.; Im, S.A.; Park, I.A.; Kang, K.W.; Han, W.; Noh, D.Y. Comparison of diffusion-weighted MR imaging and FDG PET/CT to predict pathological complete response to neoadjuvant chemotherapy in patients with breast cancer. Eur. Radiol. 2012, 22, 18–25. [Google Scholar] [CrossRef]
- Hahn, S.Y.; Ko, E.Y.; Han, B.K.; Shin, J.H.; Ko, E.S. Role of diffusion-weighted imaging as an adjunct to contrast-enhanced breast MRI in evaluating residual breast cancer following neoadjuvant chemotherapy. Eur. J. Radiol. 2014, 83, 283–288. [Google Scholar] [CrossRef]
- Li, X.; Abramson, R.G.; Arlinghaus, L.R.; Kang, H.; Chakravarthy, A.B.; Abramson, V.G.; Farley, J.; Mayer, I.A.; Kelley, M.C.; Meszoely, I.M.; et al. Multiparametric magnetic resonance imaging for predicting pathological response after the first cycle of neoadjuvant chemotherapy in breast cancer. Investig. Radiol. 2015, 50, 195–204. [Google Scholar] [CrossRef] [PubMed]
- Minarikova, L.; Bogner, W.; Pinker, K.; Valkovič, L.; Zaric, O.; Bago-Horvath, Z.; Bartsch, R.; Helbich, T.H.; Trattnig, S.; Gruber, S. Investigating the prediction value of multiparametric magnetic resonance imaging at 3 T in response to neoadjuvant chemotherapy in breast cancer. Eur. Radiol. 2017, 27, 1901–1911. [Google Scholar] [CrossRef] [PubMed]
- Agarwal, K.; Sharma, U.; Sah, R.G.; Mathur, S.; Hari, S.; Seenu, V.; Parshad, R.; Jagannathan, N.R. Pre-operative assessment of residual disease in locally advanced breast cancer patients: A sequential study by quantitative diffusion weighted MRI as a function of therapy. Magn. Reson. Imaging 2017, 42, 88–94. [Google Scholar] [CrossRef] [PubMed]
- Wilmes, L.J.; McLaughlin, R.L.; Newitt, D.C.; Singer, L.; Sinha, S.P.; Proctor, E.; Wisner, D.J.; Saritas, E.U.; Kornak, J.; Shankaranarayanan, A.; et al. High-resolution diffusion-weighted imaging for monitoring breast cancer treatment response. Acad. Radiol. 2013, 20, 581–589. [Google Scholar] [CrossRef] [PubMed]
- McLaughlin, R.L.; Newitt, D.C.; Wilmes, L.J.; Jones, E.F.; Wisner, D.J.; Kornak, J.; Proctor, E.; Joe, B.N.; Hylton, N.M. High resolution in vivo characterization of apparent diffusion coefficient at the tumor–stromal boundary of breast carcinomas: A pilot study to assess treatment response using proximity-dependent diffusion-weighted imaging. J. Magn. Reson. Imaging 2014, 39, 1308–1313. [Google Scholar] [CrossRef] [PubMed]
- Hamstra, D.A.; Rehemtulla, A.; Ross, B.D. Diffusion magnetic resonance imaging: A biomarker for treatment response in oncology. J. Clin. Oncol. 2007, 25, 4104–4109. [Google Scholar] [CrossRef] [PubMed]
- Li, X.R.; Cheng, L.Q.; Liu, M.; Zhang, Y.J.; Wang, J.D.; Zhang, A.L.; Song, X.; Li, J.; Zheng, Y.Q.; Liu, L. DW-MRI ADC values can predict treatment response in patients with locally advanced breast cancer undergoing neoadjuvant chemotherapy. Med. Oncol. 2012, 29, 425–431. [Google Scholar] [CrossRef]
- Richard, R.; Thomassin, I.; Chapellier, M.; Scemama, A.; de Cremoux, P.; Varna, M.; Giacchetti, S.; Espié, M.; de Kerviler, E.; de Bazelaire, C. Diffusion-weighted MRI in pretreatment prediction of response to neoadjuvant chemotherapy in patients with breast cancer. Eur. Radiol. 2013, 23, 2420–2431. [Google Scholar] [CrossRef]
- Iwasa, H.; Kubota, K.; Hamada, N.; Nogami, M.; Nishioka, A. Early prediction of response to neoadjuvant chemotherapy in patients with breast cancer using diffusion-weighted imaging and gray-scale ultrasonography. Oncol. Rep. 2014, 31, 1555–1560. [Google Scholar] [CrossRef]
- Yuan, L.; Li, J.J.; Li, C.Q.; Yan, C.G.; Cheng, Z.L.; Wu, Y.K.; Hao, P.; Lin, B.Q.; Xu, Y.K. Diffusion-weighted MR imaging of locally advanced breast carcinoma: The optimal time window of predicting the early response to neoadjuvant chemotherapy. Cancer Imaging 2018, 18, 38. [Google Scholar] [CrossRef]
- Sharma, U.; Danishad, K.K.A.; Seenu, V.; Jagannathan, N.R. Longitudinal study of the assessment by MRI and diffusion-weighted imaging of tumor response in patients with locally advanced breast cancer undergoing neoadjuvant chemotherapy. NMR Biomed. Int. J. Devoted Dev. Appl. Magn. Reson. In Vivo 2009, 22, 104–113. [Google Scholar] [CrossRef] [PubMed]
- Shin, H.J.; Baek, H.M.; Ahn, J.H.; Baek, S.; Kim, H.; Cha, J.H.; Kim, H.H. Prediction of pathologic response to neoadjuvant chemotherapy in patients with breast cancer using diffusion-weighted imaging and MRS. NMR Biomed. 2012, 25, 1349–1359. [Google Scholar] [CrossRef] [PubMed]
- Fujimoto, H.; Kazama, T.; Nagashima, T.; Sakakibara, M.; Suzuki, T.H.; Okubo, Y.; Shiina, N.; Fujisaki, K.; Ota, S.; Miyazaki, M. Diffusion-weighted imaging reflects pathological therapeutic response and relapse in breast cancer. Breast Cancer 2014, 21, 724–731. [Google Scholar] [CrossRef] [PubMed]
- Liu, S.; Ren, R.; Chen, Z.; Wang, Y.; Fan, T.; Li, C.; Zhang, P. Diffusion-weighted imaging in assessing pathological response of tumor in breast cancer subtype to neoadjuvant chemotherapy. J. Magn. Reson. Imaging 2015, 42, 779–787. [Google Scholar] [CrossRef] [PubMed]
- Park, S.H.; Moon, W.K.; Cho, N.; Song, I.C.; Chang, J.M.; Park, I.A.; Han, W.; Noh, D.Y. Diffusion-weighted MR imaging: Pretreatment prediction of response to neoadjuvant chemotherapy in patients with breast cancer. Radiology 2010, 257, 56–63. [Google Scholar] [CrossRef]
- Jensen, L.R.; Garzon, B.; Heldahl, M.G.; Bathen, T.F.; Lundgren, S.; Gribbestad, I.S. Diffusion-weighted and dynamic contrast-enhanced MRI in evaluation of early treatment effects during neoadjuvant chemotherapy in breast cancer patients. J. Magn. Reson. Imaging 2011, 34, 1099–1109. [Google Scholar] [CrossRef]
- Che, S.; Zhao, X.; Yanghan, O.; Li, J.; Wang, M.; Wu, B.; Zhou, C. Role of the intravoxel incoherent motion diffusion weighted imaging in the pre-treatment prediction and early response monitoring to neoadjuvant chemotherapy in locally advanced breast cancer. Medicine 2016, 95, e2420. [Google Scholar] [CrossRef]
- Partridge, S.C.; Zhang, Z.; Newitt, D.C.; Gibbs, J.E.; Chenevert, T.L.; Rosen, M.A.; Bolan, P.J.; Marques, H.S.; Romanoff, J.; Cimino, L.; et al. Diffusion-weighted MRI findings predict pathologic response in neoadjuvant treatment of breast cancer: The ACRIN 6698 Multicenter Trial. Radiology 2018, 289, 618–627. [Google Scholar] [CrossRef]
- Echeverria, C.; Kapral, R. Autocatalytic reaction dynamics in systems crowded by catalytic obstacles. Phys. D Nonlinear Phenom. 2010, 239, 791–796. [Google Scholar] [CrossRef]
- Malevanets, A.; Kapral, R. Mesoscopic model for solvent dynamics. J. Chem. Phys. 1999, 110, 8605–8613. [Google Scholar] [CrossRef]
- Echeverria, C.; Tucci, K.; Alvarez-Llamoza, O.; Orozco-Guillén, E.; Morales, M.; Cosenza, M. Mesoscopic model for binary fluids. Front. Phys. 2017, 12, 128703. [Google Scholar] [CrossRef]
- Echeveria, C.; Tucci, K.; Kapral, R. Diffusion and reaction in crowded environments. J. Phys. Condens. Matter 2007, 19, 065146. [Google Scholar] [CrossRef]
- Echeverria, C.; Herrera, J.L.; Alvarez-Llamoza, O.; Morales, M.; Tucci, K. Damping and clustering into crowded environment of catalytic chemical oscillators. Phys. A Stat. Mech. Its Appl. 2019, 517, 297–306. [Google Scholar] [CrossRef]
- Echeverria, C.; Kapral, R. Macromolecular dynamics in crowded environments. J. Chem. Phys. 2010, 132, 104902. [Google Scholar] [CrossRef] [PubMed]
- Echeverria, C.; Kapral, R. Molecular crowding and protein enzymatic dynamics. Phys. Chem. Chem. Phys. 2012, 14, 6755–6763. [Google Scholar] [CrossRef] [PubMed]
- Echeverria, C.; Kapral, R. Enzyme kinetics and transport in a system crowded by mobile macromolecules. Phys. Chem. Chem. Phys. 2015, 17, 29243–29250. [Google Scholar] [CrossRef] [PubMed]
- Collins, T.J. ImageJ for microscopy. Biotechniques 2007, 43, S25–S30. [Google Scholar] [CrossRef]
- Ihle, T.; Kroll, D. Stochastic rotation dynamics: A Galilean-invariant mesoscopic model for fluid flow. Phys. Rev. E 2001, 63, 020201. [Google Scholar] [CrossRef]
- Green, M.S. Markoff random processes and the statistical mechanics of time-dependent phenomena. II. Irreversible processes in fluids. J. Chem. Phys. 1954, 22, 398–413. [Google Scholar] [CrossRef]
- Kubo, R. Statistical-mechanical theory of irreversible processes. I. General theory and simple applications to magnetic and conduction problems. J. Phys. Soc. Jpn. 1957, 12, 570–586. [Google Scholar] [CrossRef]
- Kapral, R. Multiparticle collision dynamics: Simulation of complex systems on mesoscales. Adv. Chem. Phys. 2008, 140, 89. [Google Scholar]
- Sharma, U.; Sah, R.G.; Agarwal, K.; Parshad, R.; Seenu, V.; Mathur, S.R.; Hari, S.; Jagannathan, N.R. Potential of diffusion-weighted imaging in the characterization of malignant, benign, and healthy breast tissues and molecular subtypes of breast cancer. Front. Oncol. 2016, 6, 126. [Google Scholar] [CrossRef] [PubMed]
- Yoshikawa, M.I.; Ohsumi, S.; Sugata, S.; Kataoka, M.; Takashima, S.; Mochizuki, T.; Ikura, H.; Imai, Y. Relation between cancer cellularity and apparent diffusion coefficient values using diffusion-weighted magnetic resonance imaging in breast cancer. Radiat. Med. 2008, 26, 222–226. [Google Scholar] [CrossRef] [PubMed]


| Study | ADC* | ADC* | MDC* |
|---|---|---|---|
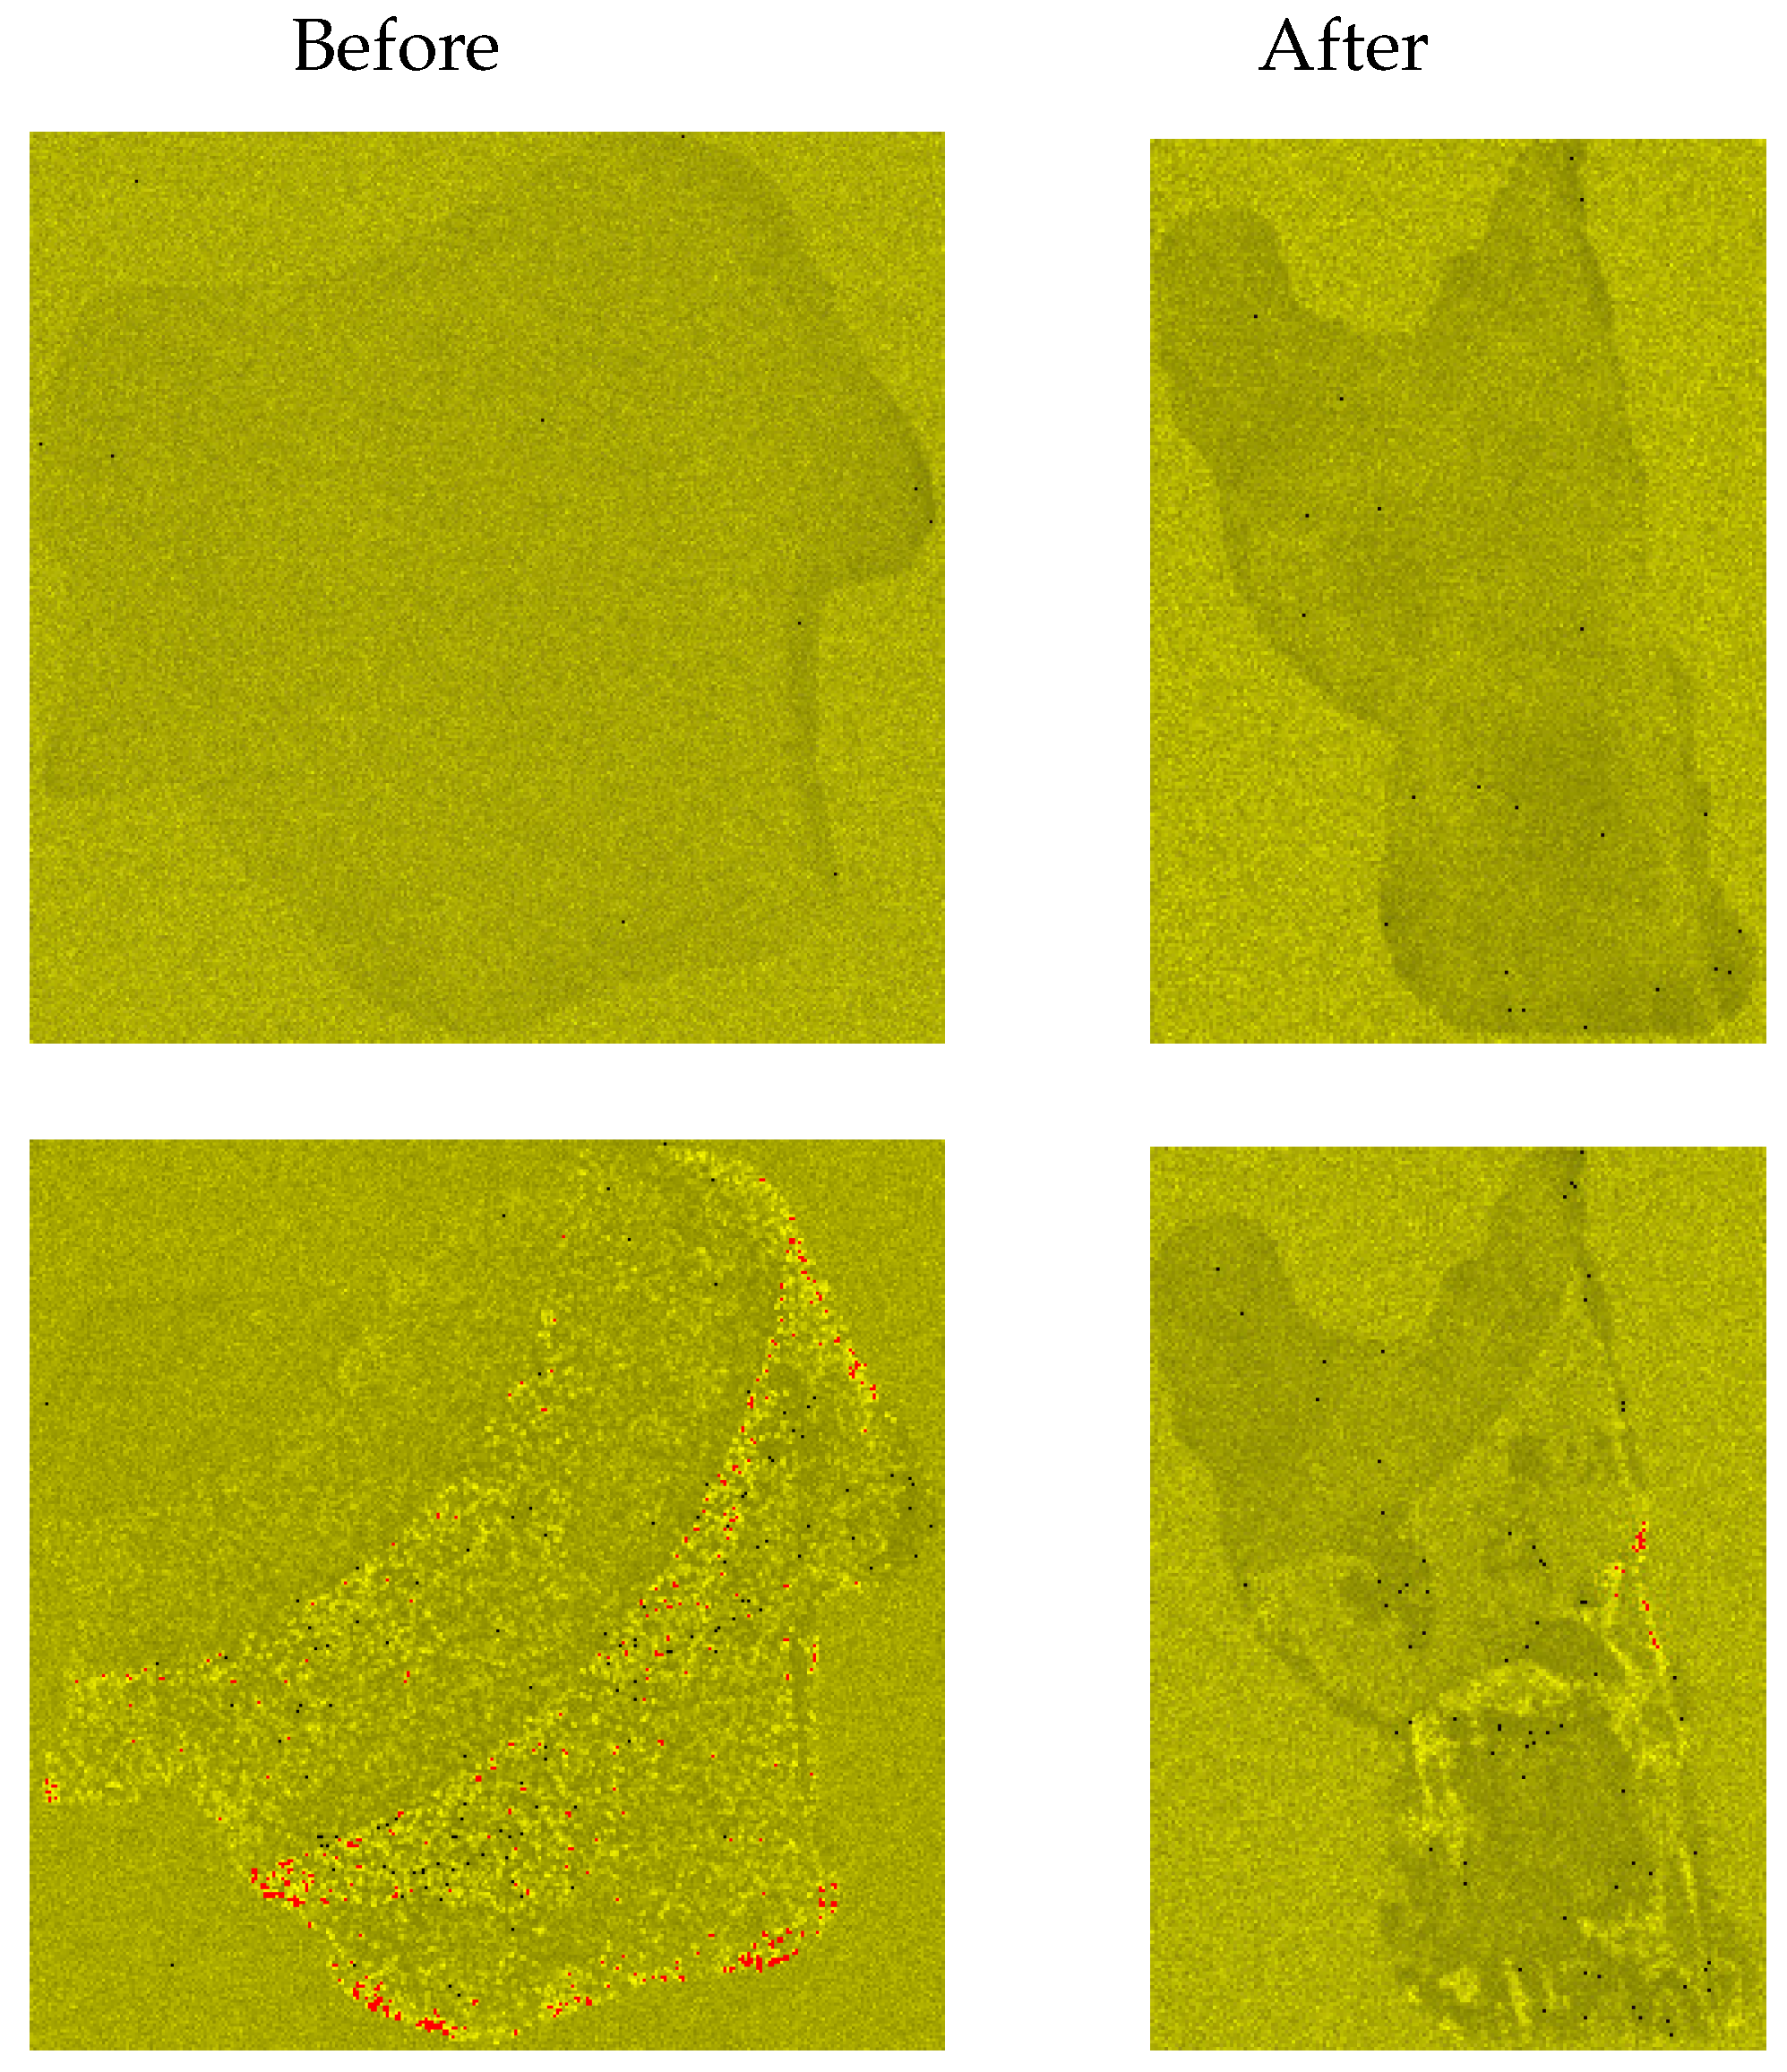
| Before | |||
| After | |||
Disclaimer/Publisher’s Note: The statements, opinions and data contained in all publications are solely those of the individual author(s) and contributor(s) and not of MDPI and/or the editor(s). MDPI and/or the editor(s) disclaim responsibility for any injury to people or property resulting from any ideas, methods, instructions or products referred to in the content. |
© 2023 by the authors. Licensee MDPI, Basel, Switzerland. This article is an open access article distributed under the terms and conditions of the Creative Commons Attribution (CC BY) license (https://creativecommons.org/licenses/by/4.0/).
Share and Cite
Borjas, J.; Tucci, K.; Alvarez-Llamoza, O.; Echeverria, C. Diffusion Simulation on Mammograms: A Technique for Analyzing and Monitoring Breast Tumors. Mathematics 2023, 11, 4988. https://doi.org/10.3390/math11244988
Borjas J, Tucci K, Alvarez-Llamoza O, Echeverria C. Diffusion Simulation on Mammograms: A Technique for Analyzing and Monitoring Breast Tumors. Mathematics. 2023; 11(24):4988. https://doi.org/10.3390/math11244988
Chicago/Turabian StyleBorjas, Jonas, Kay Tucci, Orlando Alvarez-Llamoza, and Carlos Echeverria. 2023. "Diffusion Simulation on Mammograms: A Technique for Analyzing and Monitoring Breast Tumors" Mathematics 11, no. 24: 4988. https://doi.org/10.3390/math11244988