Article

Optimal Sizing of a Photovoltaic Pumping System Integrated with Water Storage Tank Considering Cost/Reliability Assessment Using Enhanced Artificial Rabbits Optimization: A Case Study

by
Abdolhamid Mazloumi
1,
Alireza Poolad
2,
Mohammad Sadegh Mokhtari
3,
Morteza Babaee Altman
4,
Almoataz Y. Abdelaziz
5 and
Mahmoud Elsisi
6,7,*
1
Department of Electrical Engineering, Gorgan Branch, Islamic Azad University, Gorgan 4917954834, Iran
2
Department of Electrical Engineering, Bushehr Branch, Islamic Azad University, Bushehr 7515895496, Iran
3
Department of Computer Science, University of Antwerp, 2000 Antwerp, Belgium
4
Department of Energy Engineering, Amirkabir University of Technology (Tehran Polytechnic), Tehran 1591634311, Iran
5
Faculty of Engineering and Technology, Future University in Egypt, Cairo 11835, Egypt
6
Department of Electrical Engineering, National Kaohsiung University of Science and Technology, Kaohsiung 807618, Taiwan
7
Department of Electrical Engineering, Faculty of Engineering at Shoubra, Benha University, Cairo 11629, Egypt
*
Author to whom correspondence should be addressed.
Mathematics 2023, 11(2), 463; https://doi.org/10.3390/math11020463
Submission received: 12 November 2022 / Revised: 9 January 2023 / Accepted: 11 January 2023 / Published: 15 January 2023

Abstract

:
In this paper, optimal sizing of a photovoltaic (PV) pumping system with a water storage tank (WST) is developed to meet the water demand to minimize the life cycle cost (LCC) and satisfy the probability of interrupted water (pIW) constraint considering real region data. The component sizing, including the PV resources and the WST, is determined optimally based on LCC and pIW using a new meta-heuristic method named enhanced artificial rabbits optimization (EARO) via a nonlinear inertia weight reduction strategy to overcome the premature convergence of its conventional algorithm. The WST is sized optimally regarding the lack of irradiation and inaccessibility of the pumping system so that it is able to improve the water supply reliability. The LCC for water extraction heights of 5 and 10 m is obtained at 0.2955 M$ and 0.2993 M$, respectively, and the pIW in these two scenarios is calculated as zero, which means the complete and reliable supply of the water demand of the customers using the proposed methodology based on the EARO. Also, the results demonstrated the superior performance of EARO in comparison with artificial rabbits optimization (ARO) and particle swarm optimization (PSO); these methods have supplied customers’ water demands with higher costs and lower reliability than the proposed EARO method. Also, during the sensitivity analysis, the results showed that changes in the irradiance and height of the water extraction have a considerable effect on the cost and ability to meet customer demand.

1. Introduction

Today, the use of clean energy resources as distributed generation generators is of great interest [1]. One of the most common renewable resources is photovoltaic (PV) energy, which has been widely used in various energy production applications [2]. One of its applications is in water-pumping systems to extract customers’ drinking water and also in the agricultural industry for irrigation [3], in such a way that the electricity required by electrical motor pumps is supplied by PV arrays. The water pumps generally depend on electricity or diesel generators to provide electricity. The pumped water is stored in the tanks for use by customers during the day, at night, or in the absence of radiation. The tank operates as a storage system, and the battery is generally not used to store PV power; however, it can be used reliably for specific needs. The use of diesel has a high fuel cost and also increases environmental pollution. PV water pump systems are not environmentally friendly and have low maintenance costs. Optimal design and optimal sizing of a water-pumping system are desirable features. To supply water to customers based on a system to minimize the cost, the size of the components must be determined optimally [4,5]. In recent years, many studies have been performed on the use of new energy sources and their optimization based on intelligent optimization methods [6,7,8,9]. The main reason for the acceptance of new energy sources is the available energy of this type of resource. On the other hand, the use of these resources is very useful for feeding electric pumps in places far from electricity networks. Studies have been conducted in the field of designing PV water-pumping systems to supply the water demand of customers. In the economic index, the cost of energy production of the system is considered, which is related to the cost of purchasing, maintaining, and replacing the cost of components. In the technical index, the water supply is also incorporated. In [10], a design method is presented for the sizing of photovoltaic panels to feed the pumping system in Spain. In [11], an optimization method is used for determining the size of PV resources for Turkish weather conditions, and the optimal size of PV energy components and the optimal electrical structure of the system components are identified. In [12], the sizing of a PV water-pumping system using a storage tank is performed with reference to the loss of energy probability and considering lifetime cost for Algeria. In [13], the load loss probability method is applied to optimize the size of PV water-pumping systems. In [14], the sizing of a PV water pump system with daily radiation profiles is presented, and the results show that the proposed method reduces the capital cost and removes battery storage dependency. In [15], a method is proposed for sizing a PV water-pumping system based on optimal control with the aim of daily pumped water maximization by optimizing motor efficiency. In [16], the sizing of a PV water-pumping system integrated with a battery storage system is presented, considering net present cost minimization and satisfying constraints regarding shortage of power supply probability. In [17], a framework for sizing a PV water-pumping system with battery storage is proposed to minimize the cost of energy considering the loss of power probability. In [18], the optimal size of a reliable PV water-pumping system integrated with a diesel generator is presented to minimize the cost of energy. In [19], the effectiveness of a PV water-pumping system integrated with battery storage is presented with peak-shaving minimization. In [20], an algorithm is proposed for sizing a photovoltaic water-pumping system with a diesel generator to minimize the LCC. In [21], the sizing of a photovoltaic pumping system with battery storage and diesel backup is developed to minimize the cost of energy. In [22], the net present cost is minimized in designing a photovoltaic water-pumping system integrated with battery storage. In [23], PV and wind arrays are applied to supply a water-pumping system with electricity. The goal of system sizing is considered to determine the size of the system components to minimize the costs of the system and satisfy the LPSP. In [24], PV resources and storage systems are applied to meet the demand of an electric water-pumping system for power. Excess photovoltaic energy that is not consumed by the electric pump is stored in a battery.
Due to the lack of grid power in remote areas, PV water-pumping systems are one of the most cost-effective methods to supply the drinking water of customers. Using a PV water-pumping system has become popular due to the importance of available electricity and rising diesel costs. In these systems, the amount of extracted water depends on the available PV radiation and sizing the system optimally. The literature review found that in the sizing studies of PV water-pumping systems, battery storage or fuel cells are applied to compensate for the shortage of power due to oscillation of the irradiance and especially the lack of radiation at night, while the use of these storage devices increases the system cost significantly. Moreover, the literature review found that using optimization methods with high convergence rates and accuracy helped to identify the components’ sizing optimally and reduce the water extraction costs. Given that the optimization methods work well in some optimization problems but may not be suited for implementation in other problems’ solutions, today there is still a need to use more powerful optimization methods [25,26]. A summary of the literature review is presented in Table 1.
In this paper, the sizing of a PV water-pumping system with a water storage tank (WST) is performed to minimize the life cycle cost (LCC) and satisfying a reliability constraint regarding the probability of interrupted water (pIW) for remote area application considering real regional data. Decision variables include the number of PV arrays and WSTs, and these variables are determined using an enhanced artificial rabbits optimization (EARO) method. The PV arrays are used to supply the electrical energy needed by the motor pump. The required electrical power of the motor pump is optimized. The conventional ARO [27] is enhanced with a nonlinear inertia weight reduction strategy [28] to remove premature convergence and enhance the ARO by preventing local optimum trapping. The capability of EARO to solve the problem is compared with those of traditional ARO and PSO. The impact of several important factors on the system design has also been investigated. Highlights of the research are as follows:
  • Sizing of a photovoltaic water-pumping system for the Gorgan region in Iran;
  • Sizing framework considering reliability/cost assessment;
  • Using a new enhanced artificial rabbits optimization (EARO) method with a nonlinear inertia weight reduction strategy;
  • Considerable effect of changes in irradiance and water extraction height of the system sizing;
  • Superior performance of EARO compared with conventional ARO and PSO.
The PV water pump system is mathematically modeled in Section 2. Section 3 describes the method of determining the system size considering economic and technical indices. In Section 4, the EARO method and its processes for solving the problem are demonstrated. Section 5 presents the simulation results of sizing the PV pumping system and the sensitivity analysis results, and finally, Section 6 concludes the research findings.

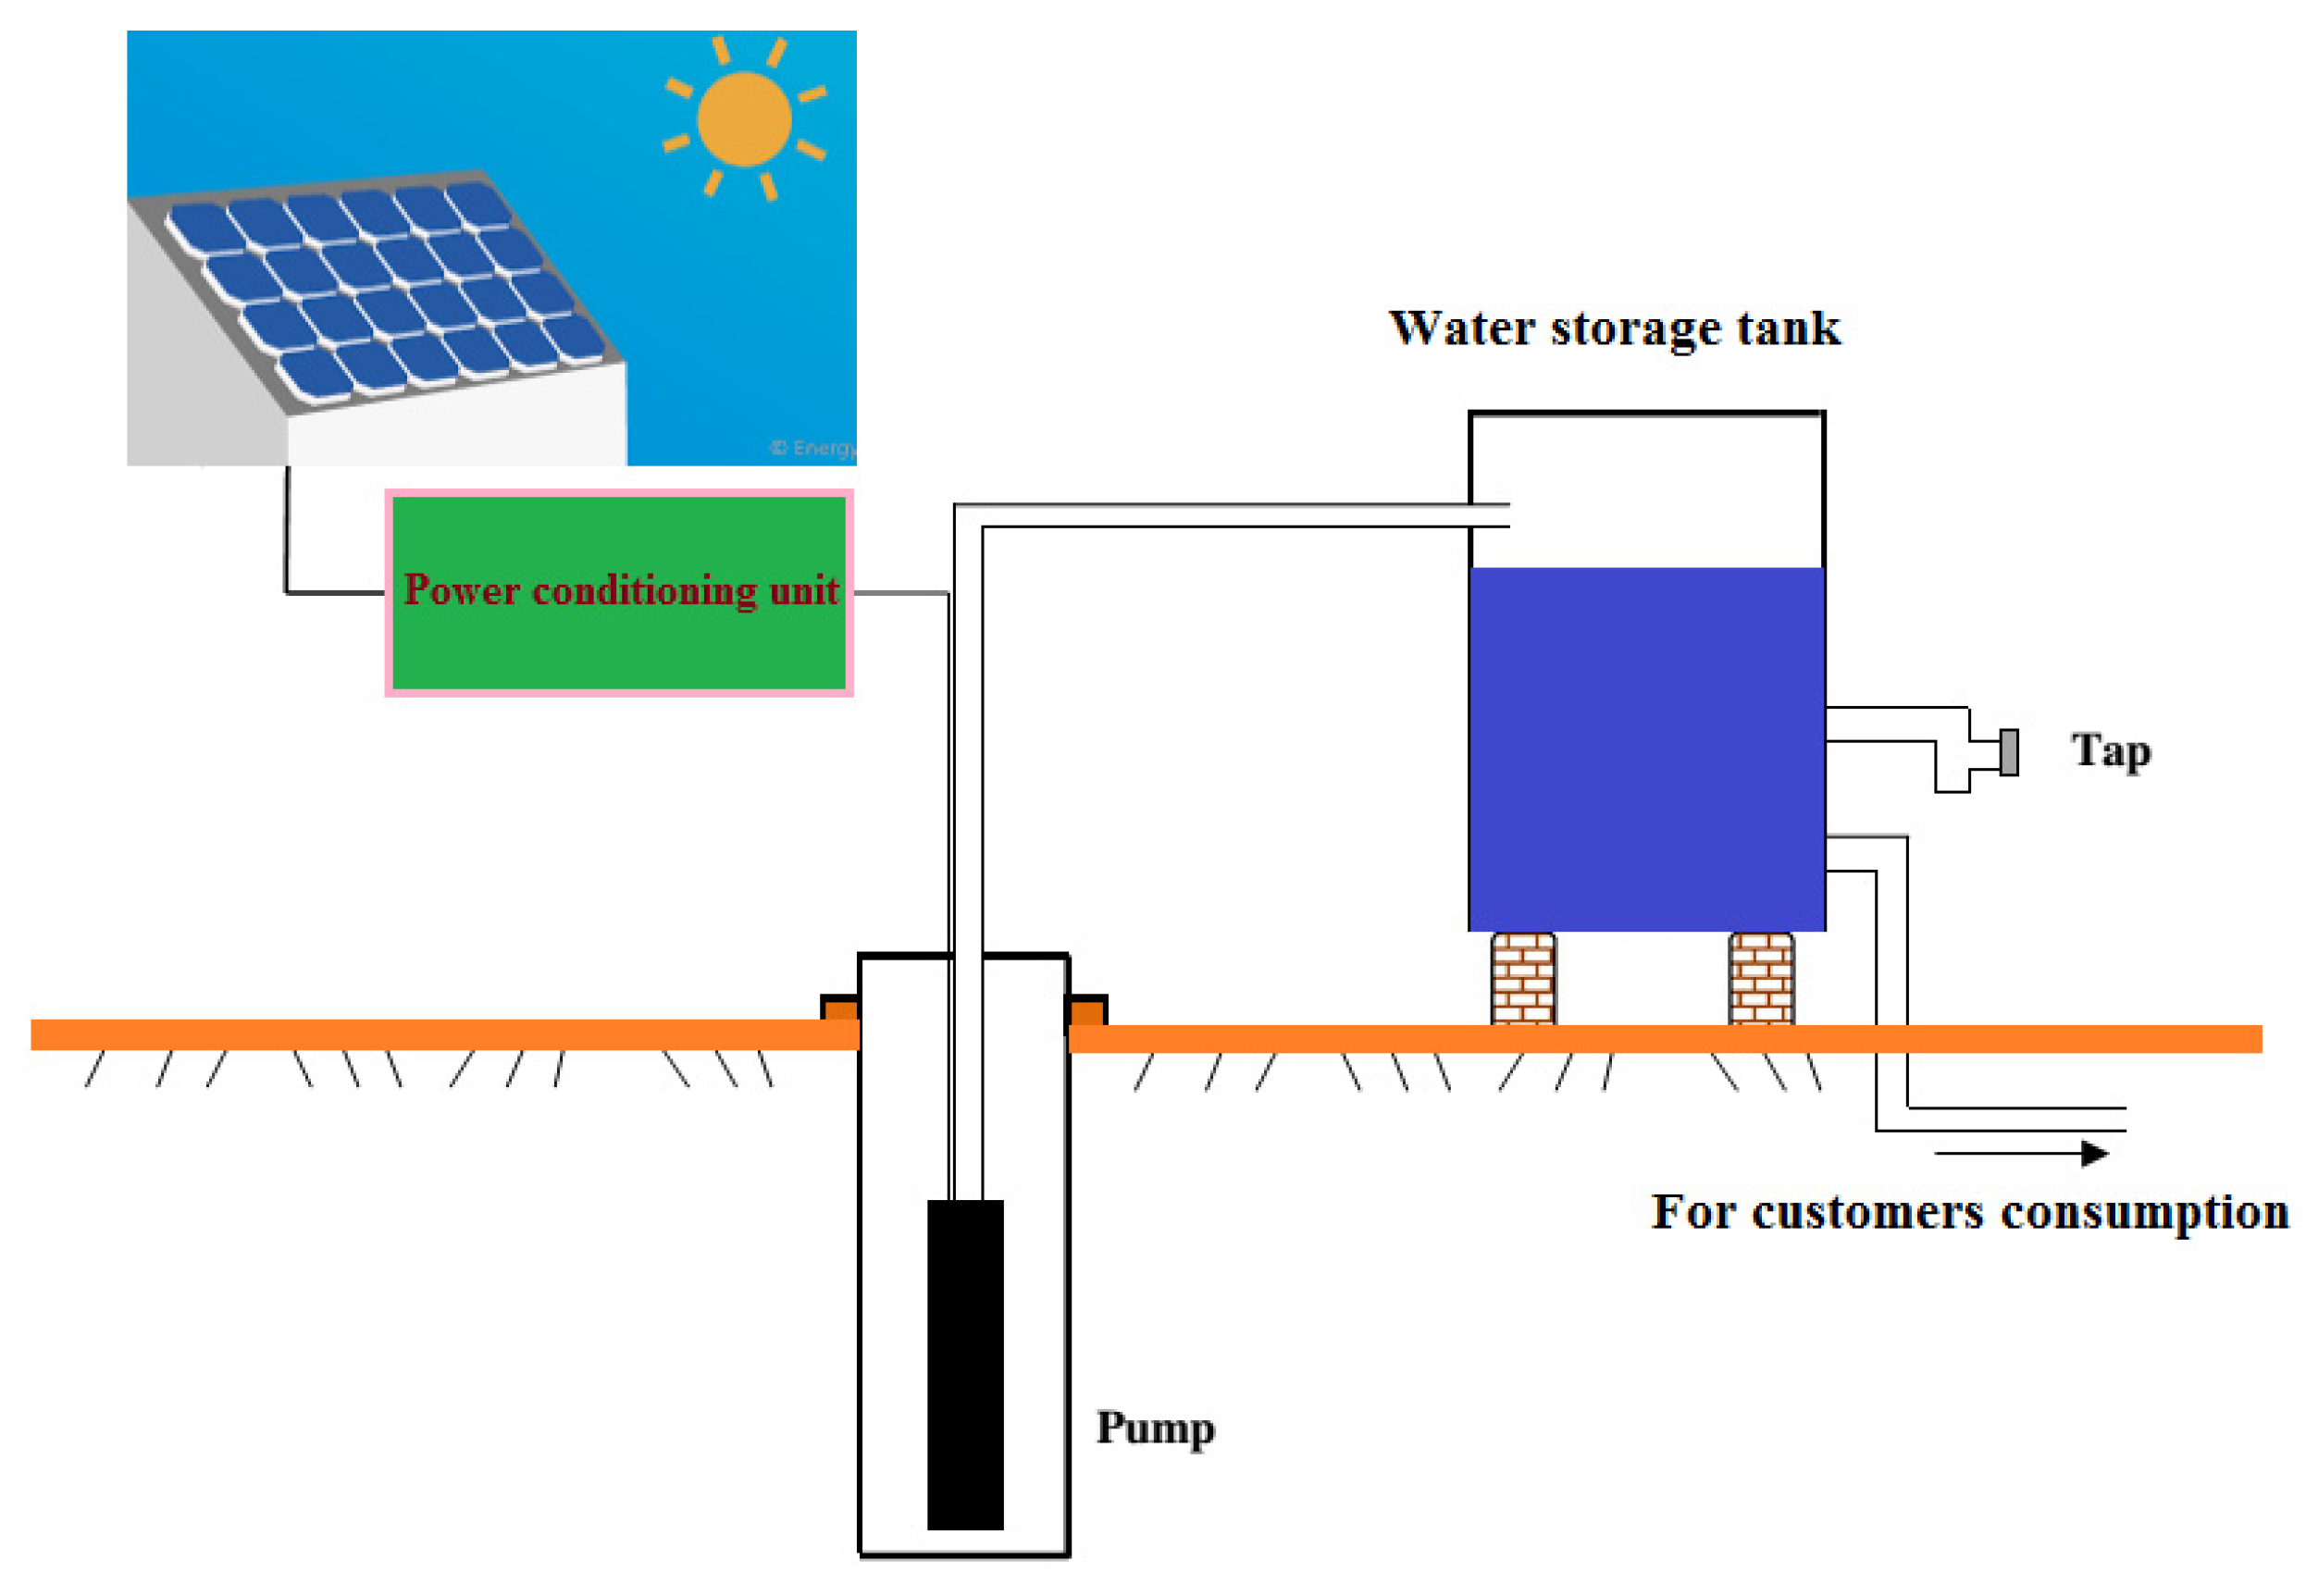
2. Modeling of PV Pumping System

Electrical water pumps for drinking applications represent an important field of reliable PV systems. As shown in Figure 1, these systems typically include a PV generator, a water tank, and a DC pump.
In the studied system, a water storage tank (WST) is used instead of a battery bank. In systems involving batteries, a lack of power for the electric pump is counteracted by discharging the battery, while in a PV pump system equipped with a WST, the tank plays the role of a battery through the management of water consumption. The operation of the proposed system is as follows:
  • If the amount of pumped water is more than the required water at that hour, the excess water is saved in the WST, and the new state is determined when the tank is full. In this case, the amount of remaining water is not stored.
  • If the amount of water demanded per hour is less than the amount of pumped water, the WST is applied to fully satisfy the water demand. The new charge status of the WST is determined. If the WST is depleted, the shortage is expressed as the probability of interrupted water.

2.1. PV Model

The PV module and array power based on solar radiation and temperature is computed by [7,11]:
p P V ( t ) = P P V , R a t e d × η M P P T × α P V ( t ) α P V , Re f × ( 1 + μ × ( ξ c ( t ) ξ r e f ) )
ξ c ( t ) = ξ a ( t ) + ( χ 20 800 ) × α P V ( t )
P P V ( t ) = N P V × p P V ( t )
where, p P V ( t ) is the PV module-generated power at time t, P P V , R a t e d is the nominal power of the PV module, η M P P T is the efficiency of the PV maximum power point tracking (98.83%), α P V ( t ) and α P V , Re f are the instantaneous irradiance at time t and solar radiation in standard condition (1000 W/m2), respectively, μ is the temperature coefficient of the PV system (−3.7 × 10⁻³ (1/°C)), ξ r e f indicates the temperature of the module at time t (°C), ξ r e f refers to the reference temperature of the PV system, χ is the nominal operating cell temperature (°C), N P V refers to the PV module number, and P P V ( t ) is the power of the PV array.

MPPT of PV System

In this study, the maximum power point tracking (MPPT) of the PV system is based on a meta-heuristic algorithm to maximize the output power of the PV system and maximize PPV (d) by optimizing the duty cycle (d) of the DC/DC converter. The duty cycle range of the converter is dmin < d < dmax, where dmin and dmax respectively represent the minimum and maximum values of the duty cycle, i.e., 0 and 1. The EARO method is used as a direct control method to optimally adjust the duty cycle of the DC/DC converter of the PV system and reduce the steady-state fluctuations of the system. First, the EARO algorithm information is entered, including the number of the population (here 10) and the maximum iterations (here 100), and the minimum and maximum duty cycle intervals are also applied. For each population, the duty cycle algorithm is randomly selected in its allowed range by the EARO method, and voltage, current, and, as a result, PV power are calculated for it. The member of the population corresponding to the previously obtained best photovoltaic power is selected as the best result of the algorithm. Then, the population set of the algorithm is updated. For the updated population (selection of new cycles), the objective function, i.e., photovoltaic power, is calculated. The best member of the population with the maximum previously obtained power is selected as the representative of the population. If the solution is better compared to the previous value, it will be replaced. If the convergence condition is estimated, which is to achieve the maximum power and execute the maximum iterations of the EARO algorithm, by determining the optimal duty cycle, the algorithm is stopped; otherwise, the above steps are repeated until the optimal work cycle is determined. In this study, the tracking efficiency of the photovoltaic system is 98.83%.

2.2. Pump Model

The below model is considered for the water flow Q against the input power P of pumping system and the height h [10,11,12]:
P ( Q , h ) = α ( h ) × Q 3 + β ( h ) × Q 2 + Ω ( h ) × Q + ϕ ( h )
where the coefficients depend on the water height and are defined as follows [12]:
α ( h ) = α 0 + α 1 × h + α 2 × h 2 + α 3 × h 3
β ( h ) = β 0 + β 1 × h + β 2 × h 2 + β 3 × h 3
Ω ( h ) = Ω 0 + Ω 1 × h + Ω 2 × h 2 + Ω 3 × h 3
ϕ ( h ) = ϕ 0 + ϕ 1 × h + ϕ 2 × h 2 + ϕ 3 × h 3
The Q corresponding to the P is determined by Equation (9), with γ > P(Q). In the iteration k, Q can be presented as [12]:
Q k = Q k 1 ( Q k 1 ) ( Q k 1 )
where
( Q k 1 ) = α × Q 3 k 1 + β × Q 2 k 1 + δ × Q k 1 + γ P ( Q k 1 )
where ( Q k 1 ) is derived from ( Q k 1 ) .

2.3. WST Model

The size of the WST is found to meet the water requirement for a period when there is no energy source; this period is called system adequacy. Depending on the production of the PV array and the total load demand, the water charge state (WCHS) can be computed as follows [7,11]:
  • Charge of WST
W C H S ( t ) = W C H S ( t 1 ) + ( P P V ( t ) P W D ( t ) / η I n v ) × Δ t × η W T S
  • Discharge of WST
W C H S ( t ) = W C H S ( t 1 ) ( P W D ( t ) / η I n v P P V ( t ) ) × Δ t
where W C H S ( t ) and W C H S ( t 1 ) refer to the charge condition of the WST (Wh) at time t and (t − 1), respectively; PPV(t) refers to the power generated using the PV array (W); PWD(t) refers to the hydraulic demand at t (W); and η W T S is the tank efficiency in the charge state (equal to 1). Also, W C H S ( t ) = N W T S × V O L W T S is considered for water storage demanded, in which N W T S is the WST number, and V O L W T S shows the WST volume (m3). Each WST can transmit 1 m3 to customers in one hour. The charge state of the WST is limited by
0 W C H S ( t ) W C H S max

3. Sizing Methodology

For determination of the optimal component size, the system is optimized to meet the water demand and evaluated with economic and technological indices. In this study, the proposed approach to system evaluation is based on the two concepts of project lifetime cost for economic evaluation (LCC) and a reliability index called the probability of interrupted water (pIW). Combining the system with the lowest LCC and the best pIW is the optimal combination and provides the desired reliability.
Currently, excessive consumption of non-renewable energies such as coal, gas, and oil for the traditional production of electrical energy has caused serious environmental threats, including climate change and increased air pollution. For this reason, adopting an approach towards using energy sources that are compatible with the environment’s health is necessary. After that, it is necessary to pay attention to the environmental costs of electricity production, which can have destructive effects on natural resources. In the energy sector, external costs that are imposed on society and the environment cause water and air pollution, reduction of freshwater resources, etc. By employing new and renewable energies, we can help reduce these costs. Among the mentioned renewable energies, solar energy can be mentioned as an endless source of energy that solves many problems in the field of energy and environment. A circular economy is a closed-loop system in which a product is not thrown away after use. Thus, there will be no waste at the end of the production cycle, making it more efficient in the long run. By implementing circular economy models, it is possible to significantly reduce the amount of production waste and increase economic growth by creating new industries around better management of production waste. In this research, instead of using energy sources based on fossil fuels with waste, photovoltaic renewable energy sources have been used to supply the required power of the water pump system to minimize the environmental effects and waste resulting from it, reduce the cost of the energy project over its lifetime, and reduce CO2 emissions by using a circular economy.

3.1. Objective Function

LCC includes the costs of components such as PV arrays, motor pump sets, tanks, and inverters. According to the system under study, the cost of LCC is expressed as the investment cost ( C c a p ), the maintenance cost ( C O & M ), and the cost of interrupted water ( C W R W ). It should be noted that the LCC only considers the costs incurred during the project’s lifetime, and the impact of end-of-life system components’ value (considering circular economy) has not been considered. Therefore, LCC is defined as follows [1,5,10,11,12]:
M i n i m i z e L C C = C c a p + C O & M + C I W + C W R W
  • Initial Investment Cost
The component capital cost includes the cost of components, the cost of construction, and the cost of installation of the components. The construction and installation costs are considered equal to 40% of the PV array cost and equal to 20% of the cost of the motor pump set. The capital cost (Ccap) is expressed as follows:
C c a p = N P V . C U n i t , P V + N W S T . C U n i t , W S T   + N p u m p . C U n i t , p u m p + N I n v . C I n v
where NPV and CUnit,PV refer to the PV number and the PV unit cost, respectively. NWST and CUnit,WST are the tank number and the tank unit cost, respectively. Npump and CUnit,pump are the pump motor number and the unit cost, respectively, and NInv and CInv are the inverter number and unit cost, respectively.
  • Operation and Maintenance Cost
The cost of operation and maintenance (CO&M) is defined by [11,12,13]
C O & M = { C ( O & M ) 1 × [ 1 + τ 1 ψ τ 1 ] × [ 1 1 + τ 1 1 ψ ] κ , f o r ψ τ 1 C ( O & M ) 1 × κ , f o r ψ = τ 1
where τ 1 is the inflation rate, ψ refers to the annual interest rate, and κ indicates the system lifetime. C(O&M)0 indicates CO&M in the first year, which can be defined in terms of as part of the capital cost (Ccap). C(O&M)1 is computed as follows:
C ( O & M ) 1 = × C c a p
-
Cost of Water Reliability Weakness
The water reliability weakness of customers is equal to the amount of water not supplied by the system multiplied by the cost per liter of water, which is defined as follows:
C W R W = t = 1 T ( P W D ( t ) × p I W × C I W )
where p I W is the probability of interrupted water, and C I W is the cost of not supplying each liter of water demanded by customers in terms of U.S. dollars.

3.2. Reliability Constraint

The p I W index is a technical index for finding the size of PV water-pumping system components for a system equipped with a water tank. When the pumped water amount is more than the amount of water consumed by the customers, the excess water is saved in the WST, and the amount of water stored in hour t is obtained from Equation (11). In case that the amount of water required by the customers is more than the amount of pumped water, the water shortage of the customers will be compensated by the discharge of the WST, in which case the amount of water in the tank at hour t is defined by Equation (12). However, if the amount of water in the reservoir is not able to fully meet the water demand of the customers, then the amount of interrupted water per hour (IW (t)) is defined as follows [5,7,9]:
I W ( t ) = P W D ( t ) × Δ t ( P P V ( t ) × Δ t + W C H S ( t 1 ) )
p I W = t = 1 T I W ( t ) t = 1 T P W D ( t )
where the value of p I W is between 0 and 1. A value of 0 means that all the water customers demand has been supplied, and a value of 1 means that the total water demand has not been supplied.

3.3. Proposed Optimizer (EARO)

The sizing of the PV pump system with the aim of minimizing LCC and p I W satisfaction using enhanced artificial rabbits optimization (EARO) is presented. The optimization variables include the PV array number and the WST number determined using the EARO method.

3.3.1. Inspiration

The ARO algorithm is modeled based on the survival strategies of rabbits in the wild [27]. The ARO algorithm uses strategies of foraging and hiding and reduces their energy to exchange among these strategies to solve an optimization problem.

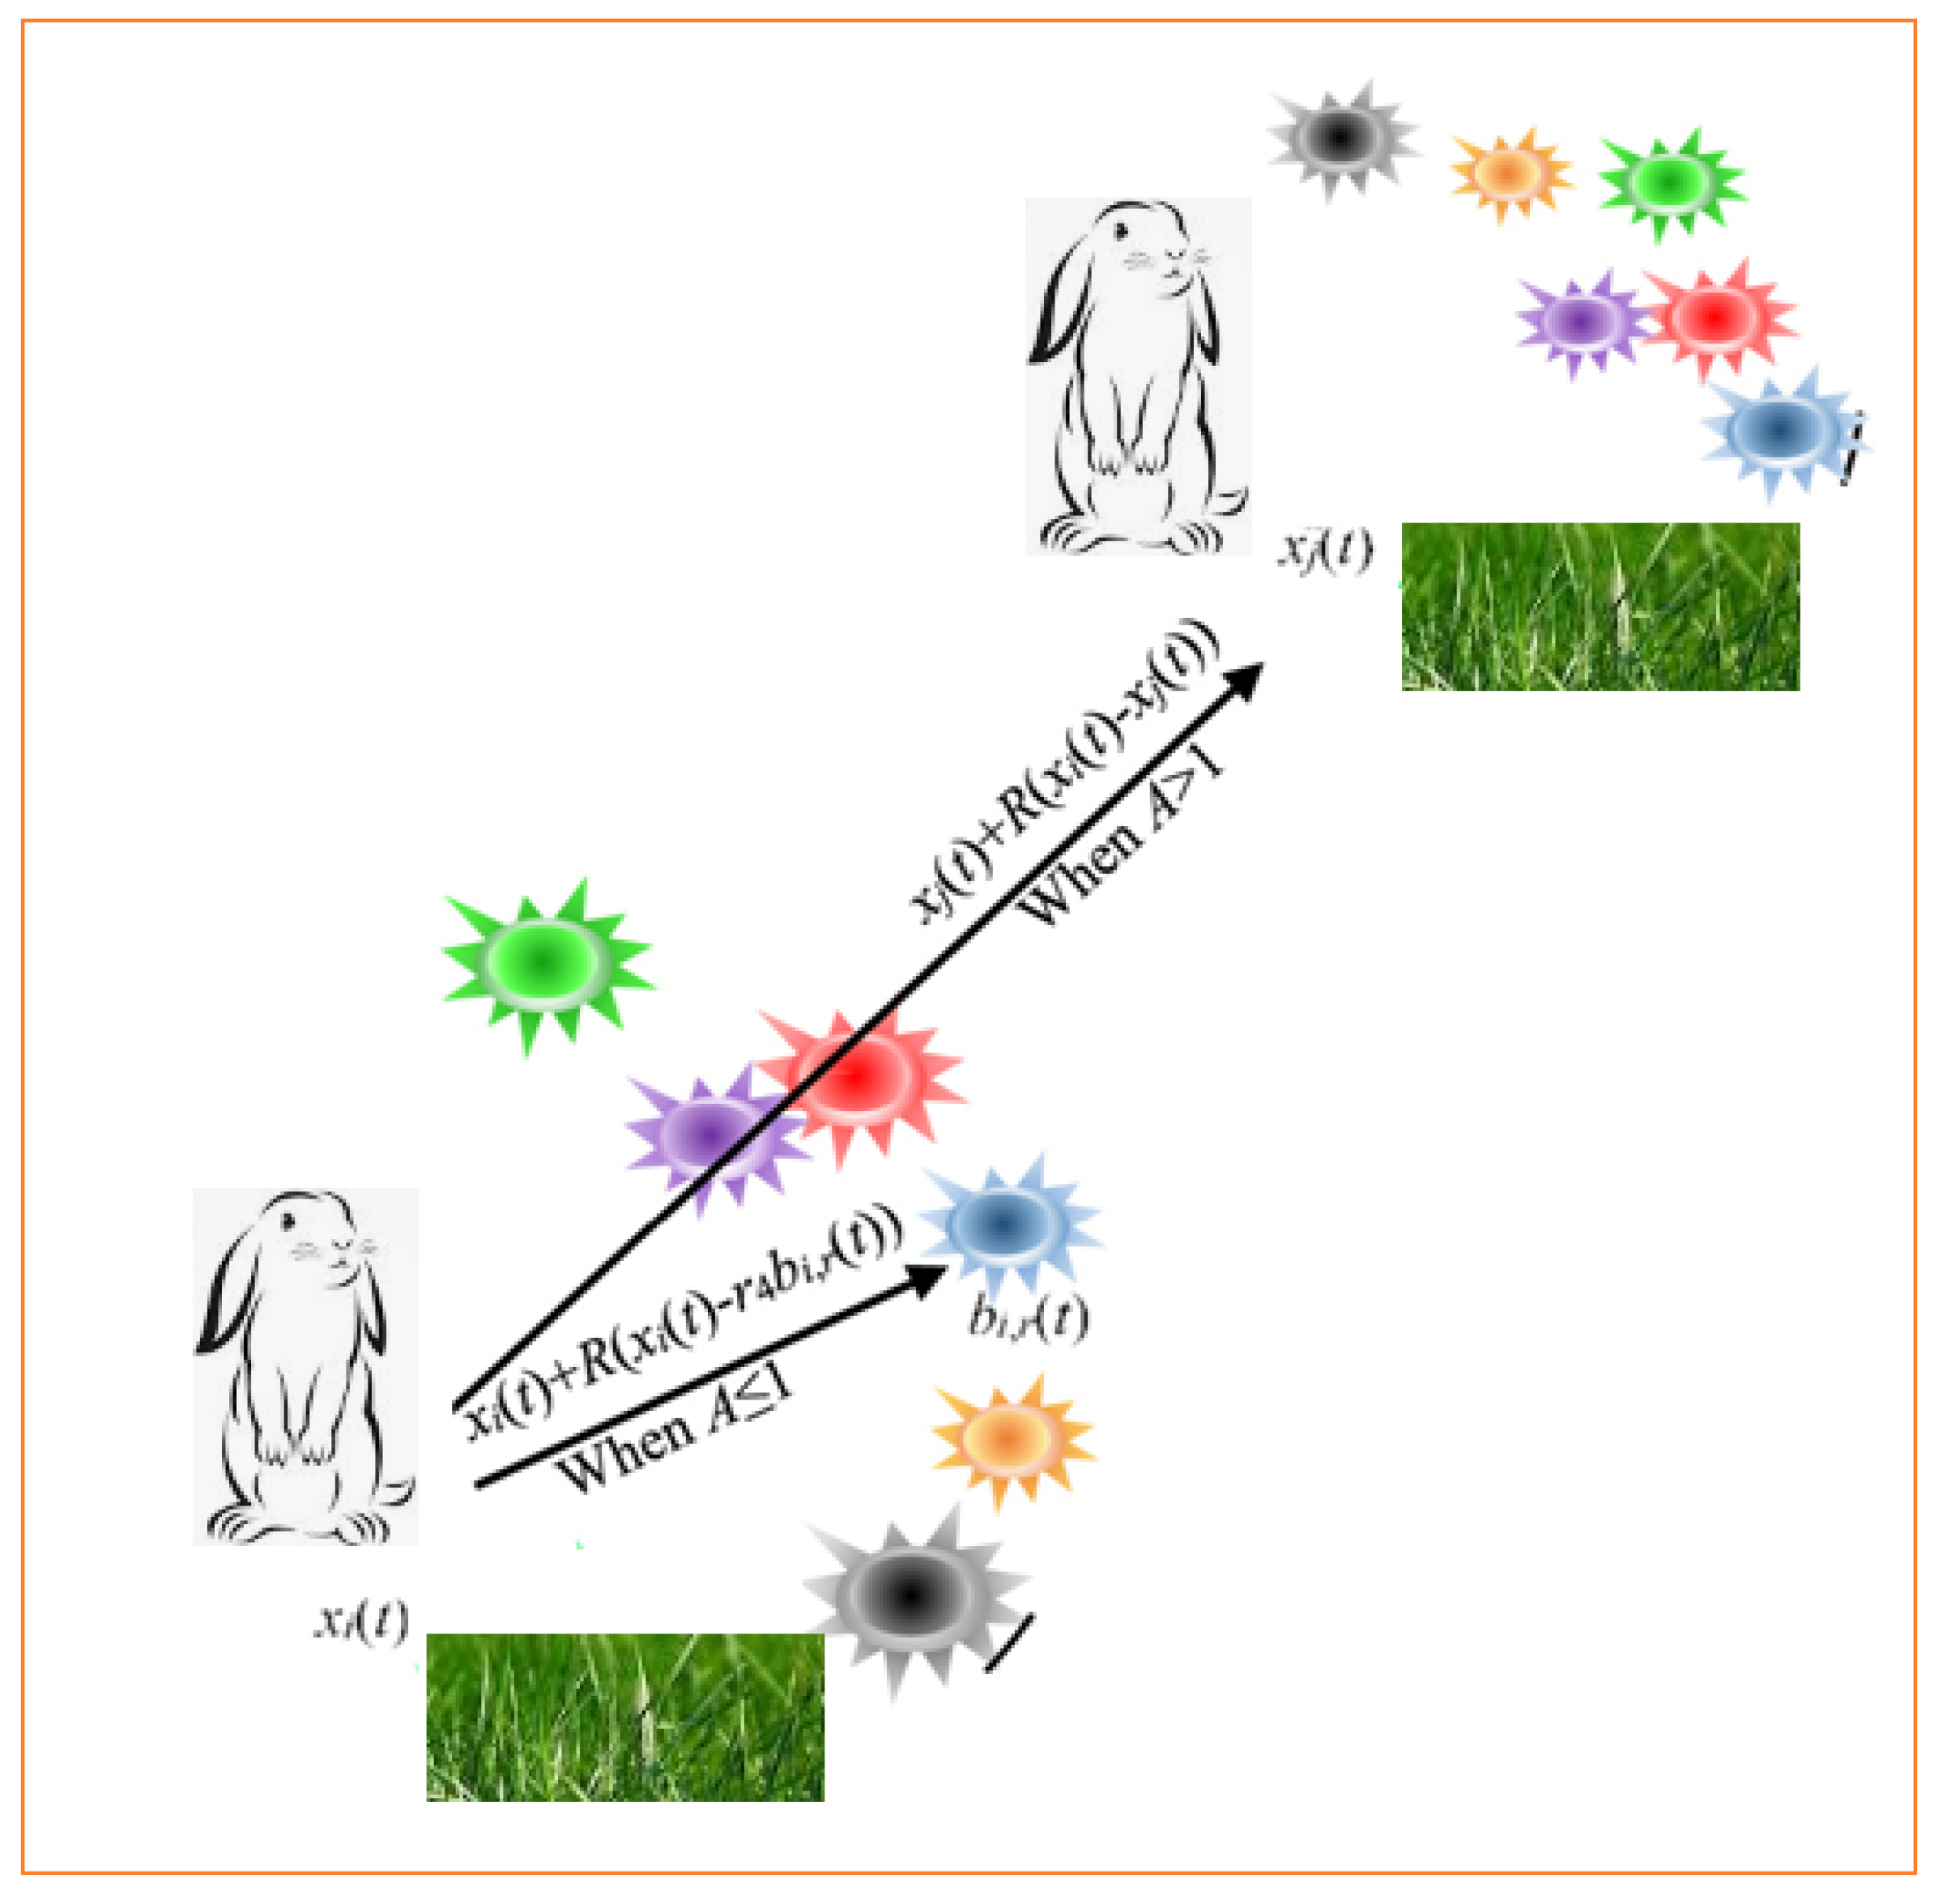
3.3.2. Searching for Shortcut Food (Exploration)

Rabbits tend to look for food far away, so they are not interested in looking for food in nearby places; in other words, they are not satisfied with the grass in their area and search far away, which is called detour foraging. In the ARO algorithm, each rabbit has a number d of hiding places in its own area. Rabbits randomly consider the position of other rabbits to search for food. In this way, rabbits may gather around a food source to obtain enough food while searching for food. So, detour foraging means that each searcher is interested in updating its position towards each other searcher by adding a disturbance. The detour foraging model is presented as follows [27]:
v i ( t + 1 ) = x j ( t ) + R . ( x i ( t ) x j ( t ) ) + r o u n d ( 0.5 . ( 0.05 + r 1 ) ) . n 1 ,
i , j = 1 , ... , n a n d j i
R = L . c
L = ( e e ( t 1 T ) 2 ) . sin ( 2 π r 2 )
c ( k ) = { 1 i f k = = g ( l ) , k = 1 , ... , d a n d l = 1 , ... , r 3 . d 0 e l s e
g = r a n d p e r m ( d )
n 1 N ( 0 , 1 )
where v i ( t + 1 ) represents the ith candidate rabbit position at time t + 1, x i ( t ) refers to the ith rabbit position at time t, n represents a rabbit population size, d is the number of dimensions of the problem, and T represents the maximum iterations number, . indicates the ceiling function, rand perm represents the random order of integers 1 to d, r1 to r3 represents three random numbers in the range (1, 0), L is the length of the run, and n1 is bound to the normal distribution.

3.3.3. Random Hiding (Exploitation)

In each iteration, a rabbit generates a number of hiding places (d) around each dimension of the search space and considers one of those hiding places to hide. In this way, it reduces the possibility of being hunted. The jth hiding place of the ith rabbit is defined as follows [27]:
b i , j ( t ) = x i ( t ) + H . g . x i ( t ) , i = 1 , ... , n a n d j = 1 , ... , d
H = T t + 1 T . r 4
n 2 N ( 0 , 1 )
g ( k ) = { 1 i f k = = j , k = 1 , ... , d 0 e l s e
During each dimension, d number of hiding places is produced in the neighborhood of a rabbit. H represents the hidden parameter, which goes from 1 to 1/T based on a random disturbance during the repetitions in a linear way.
In order to hide from hunters and not be hunted, rabbits are not interested in choosing one of the hiding places randomly. Random hiding behavior is defined as follows [27]:
v i ( t + 1 ) = x i ( t ) + R . ( r 4 . b i , r ( t ) x i ( t ) ) , i = 1 , ... , n
g r ( k ) = { 1 i f k = = r 5 . d , k = 1 , ... , d 0 e l s e
b i , r ( t ) = x i ( t ) + H . g r . x i ( t )
where b i , r refers to a hideout considered randomly to hide in from d number of hideouts, and r4 and r5 represent numbers between 0 and 1, randomly selected. According to the above equations, the i-th searching person tries to update his position with respect to a random hideout considered from the d available hideouts.
The position of the i-th rabbit is updated as follows [27]:
x i ( t + 1 ) = { x i ( t ) f ( x i ( t ) ) f ( v i ( t + 1 ) ) v i ( t + 1 ) f ( x i ( t ) ) > f ( v i ( t + 1 ) )

3.3.4. Energy Reduction (Transition from Exploration to Exploitation)

In the ARO algorithm, rabbits tend to engage in detour foraging behavior repeatedly, while they engage in random hiding behavior in the later stage of iterations. Therefore, over time, a rabbit’s energy decreases. Therefore, the energy factor is presented as follows [27]:
A ( t ) = 4 ( 1 t T ) ln 1 r
where r represents a number between 0 and 1. When A(t) > 1, the rabbit is subject to random exploration, and detour foraging occurs. When A(t) ≤ 1, the rabbit is not interested in randomly using its hiding places, and in this condition random hiding occurs. The search structure according to factor A is shown in Figure 2.
Therefore, the ARO algorithm randomly generates a population of rabbits as candidate answers in the search space. In each iteration, a rabbit updates its position relative to a random rabbit from the population or a random rabbit taken from the hiding places. As the repetitions increase, factor A goes through a decreasing process, so that each rabbit in the population is forced to perform a transfer operation. The algorithm is updated until it reaches the convergence criterion of the algorithm to obtain the best response. The pseudo-code of the ARO algorithm is presented in Algorithm 1.
Algorithm 1 Pseudo-Code of ARO
Initiate a rabbits set i and calculate the fitness (Fiti) and Xbest
While the convergence criteria is not met do
 For each individual Xi do
 Compute the A operator via Equation (35)
 If A > 1
   Select a rabbit from individuals randomly
  Compute R via Equations (23)–(26)
  Implement detour foraging using Equation (21)
  Compute the Fiti
  Update the present individual position via Equation (34)
  Else
  Produce d burrows and pick hiding randomly via Equation (33)
  Implement the hiding randomly via Equation (31)
  Compute the Fiti
  Update the individual position via Equation (34)
  End If
  Update the best solution determined Xbest
  End For
End While
Return Xbest

3.3.5. Overview of EARO

In the optimization process, the optimal selection of the inertia weight is very effective in solving the problem. A big value of the inertia weight makes the algorithm perform better in global search. However, a small value of the inertia weight makes the algorithm perform better in local search. In the ARO algorithm, the value of the inertia weight is chosen as equal to one. Therefore, to strengthen the performance of the algorithm in preventing premature convergence, it is better to consider the inertia weight dynamics to accelerate the achievement of the global optimum. In solving the optimization problem based on the ARO algorithm, to improve the convergence and prevent premature convergence, the nonlinear inertia weight reduction method [28] is applied as follows:
I W ( t ) = I W L + ( 0.5 ( 1 + cos ( π t T ) ) ) ψ × ( I W U I W L )
where I W L and I W U refer to lower and upper amounts of I W , respectively ( ψ = 10 [28]).
According to Equation (36), Equations (34) and (31) are updated:
x i ( t + 1 ) = { I W ( t ) . x i ( t ) f ( x i ( t ) ) f ( v i ( t + 1 ) ) v i ( t + 1 ) f ( x i ( t ) ) > f ( v i ( t + 1 ) )
v i ( t + 1 ) = I W ( t ) . x i ( t ) + R . ( r 4 . b i , r ( t ) I W ( t ) . x i ( t ) ) , i = 1 , ... , n

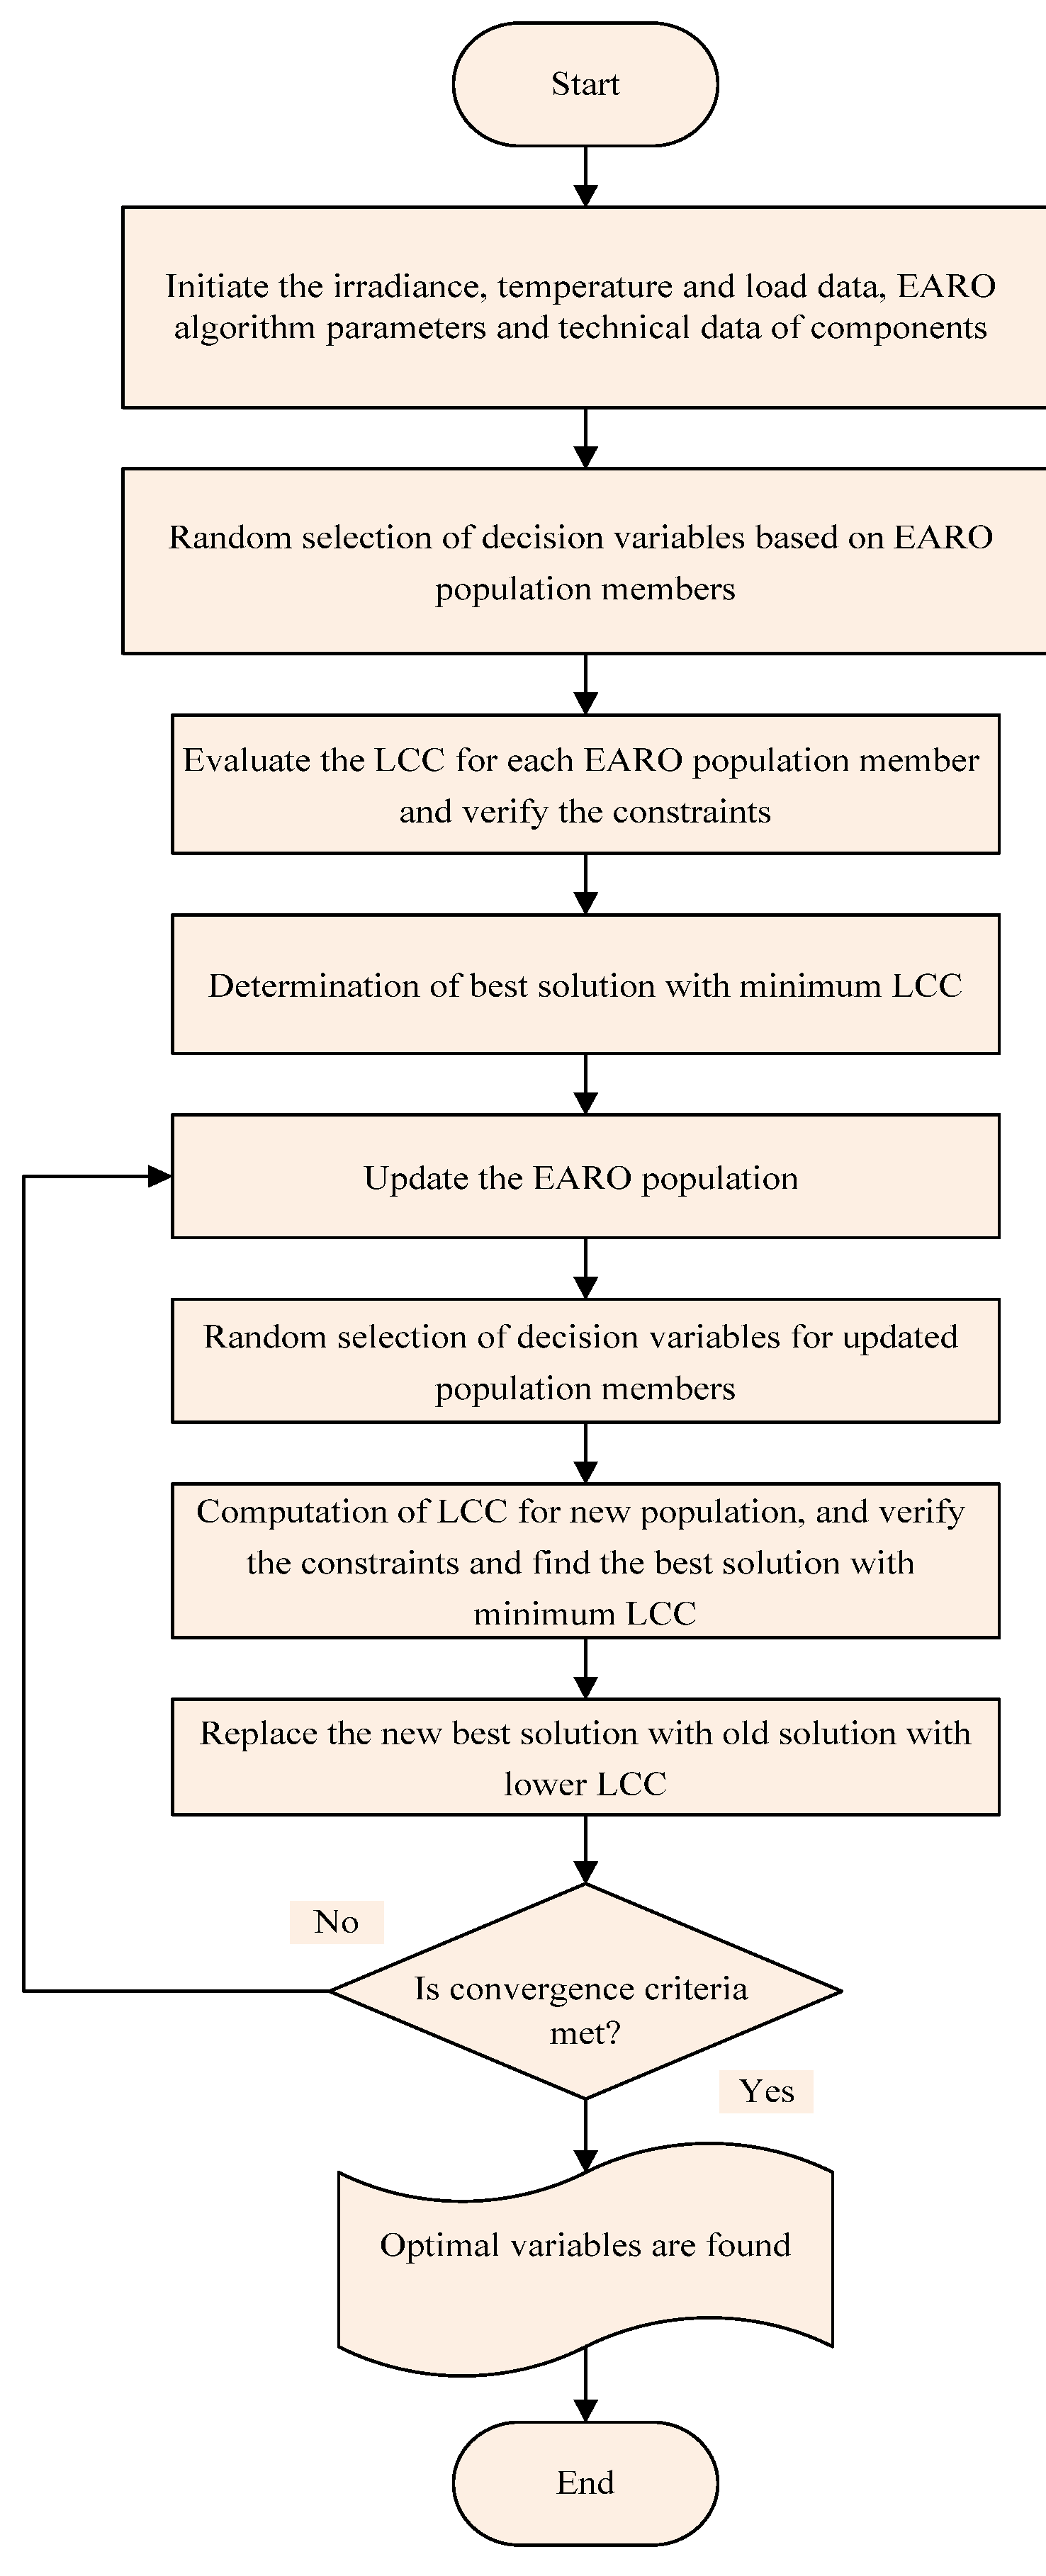
3.3.6. The EARO Implementation

The PV water pump system sizing is developed using the EARO method. The optimization variables are optimally determined by EARO. The algorithm iterations number is considered to be 100, and the population number is selected as 50 according to the trial-and-error method and the authors’ experience. The flowchart of the EARO to implement the problem is depicted in Figure 3. The steps of EARO performing sizing solving are presented as follows:
Step 1: Insert the data related to the irradiance and temperature considering real regional data and produce the initial population for x = [ N P V , N Tan k ] as a decision variables vector.
Step 2: The variables set are identified randomly after considering the search space for members of the population.
Step 3: The LCC is calculated for each variable set via ARO, and the corresponding lowest LCC is determined as the best member of the population.
Step 4: The population position is updated, and then the LCC is computed for the new population. If the member corresponding to the best value of the cost is better than the LCC gained in Step 4, it replaces the older value.
Step 5: In the enhanced ARO phase, the algorithm position is updated with a nonlinear inertia weight reduction strategy, and then the OF is computed for the updated population.
Step 6: The optimal variable set is replaced by the best set obtained in Step 5 if it has better results than the cost achieved in Step 4.
Step 7: The convergence criteria are evaluated. If these criteria are met, go to Step 8; otherwise, return to Step 4.
Step 8: Stop the EARO and print the best variables.

4. Simulation Results

In this paper, the sizing of the PV water pump system is performed by considering the possibility of water supply to the customers using EARO considering real regional data. The simulation of the studied system is performed in different scenarios of water height. The simulation results include the optimal components capacity and system cost for the full supply of customer demand. It should be noted that in order to confirm the efficiency of the EARO method, the problems with traditional ARO and PSO, which have shown their ability in recent years to optimize power engineering problems, have been evaluated, and the results are compared. Finally, the effect of some system parameters on optimization is evaluated.

4.1. Sizing Parameters

The proposed framework is applied for sizing the PV water pump system separate from the network with the aim of providing drinking water to customers. The cost data of the system are presented in Table 2. The efficiency of the inverter is considered to be 95% [11,12,13]. The technical data of the PV array and pump motor are given in Table 3 and Table 4, respectively.
The amount of water consumed in each hour during a 24 h period is equal to 24.10 cubic meters. Each water tank has a maximum capacity of 1 m3, and the capacity of each at the beginning of the program is considered 0.25 m3. The values of the coefficients of Equations (4)–(8) are given in Table 5. The changes in radiation as well as temperature for a full day and night are shown in Figure 4 and Figure 5. The solar radiation and temperature are of the Gorgan area (latitude 37°24′ and longitude 55°15′) in Iran.
The cost of the photovoltaic array from the investment point of view is USD 249.91 per kilowatt, and the cost from the maintenance point of view is 1% of that, equal to USD 2.49 per hour. The purchase cost of each water tank is USD 42,000, and the maintenance cost is USD 420 [12,13]. The sizing of the PV water pump system is considered using EARO, taking into account the possibility of non-supply of water to p I W customers. System costs are presented as an economic index, and p I W as a technical index for the system’s ability to supply water to customers. The simulations are implemented in two scenarios as follows:
Scenario #1: Sizing of a PV water pump system for a water extraction height of 5 m with LCC minimization and satisfying the p I W constraint;
Scenario #2: Sizing of a PV water pump system for a water extraction height of 10 m with LCC minimization and satisfying the p I W constraint.

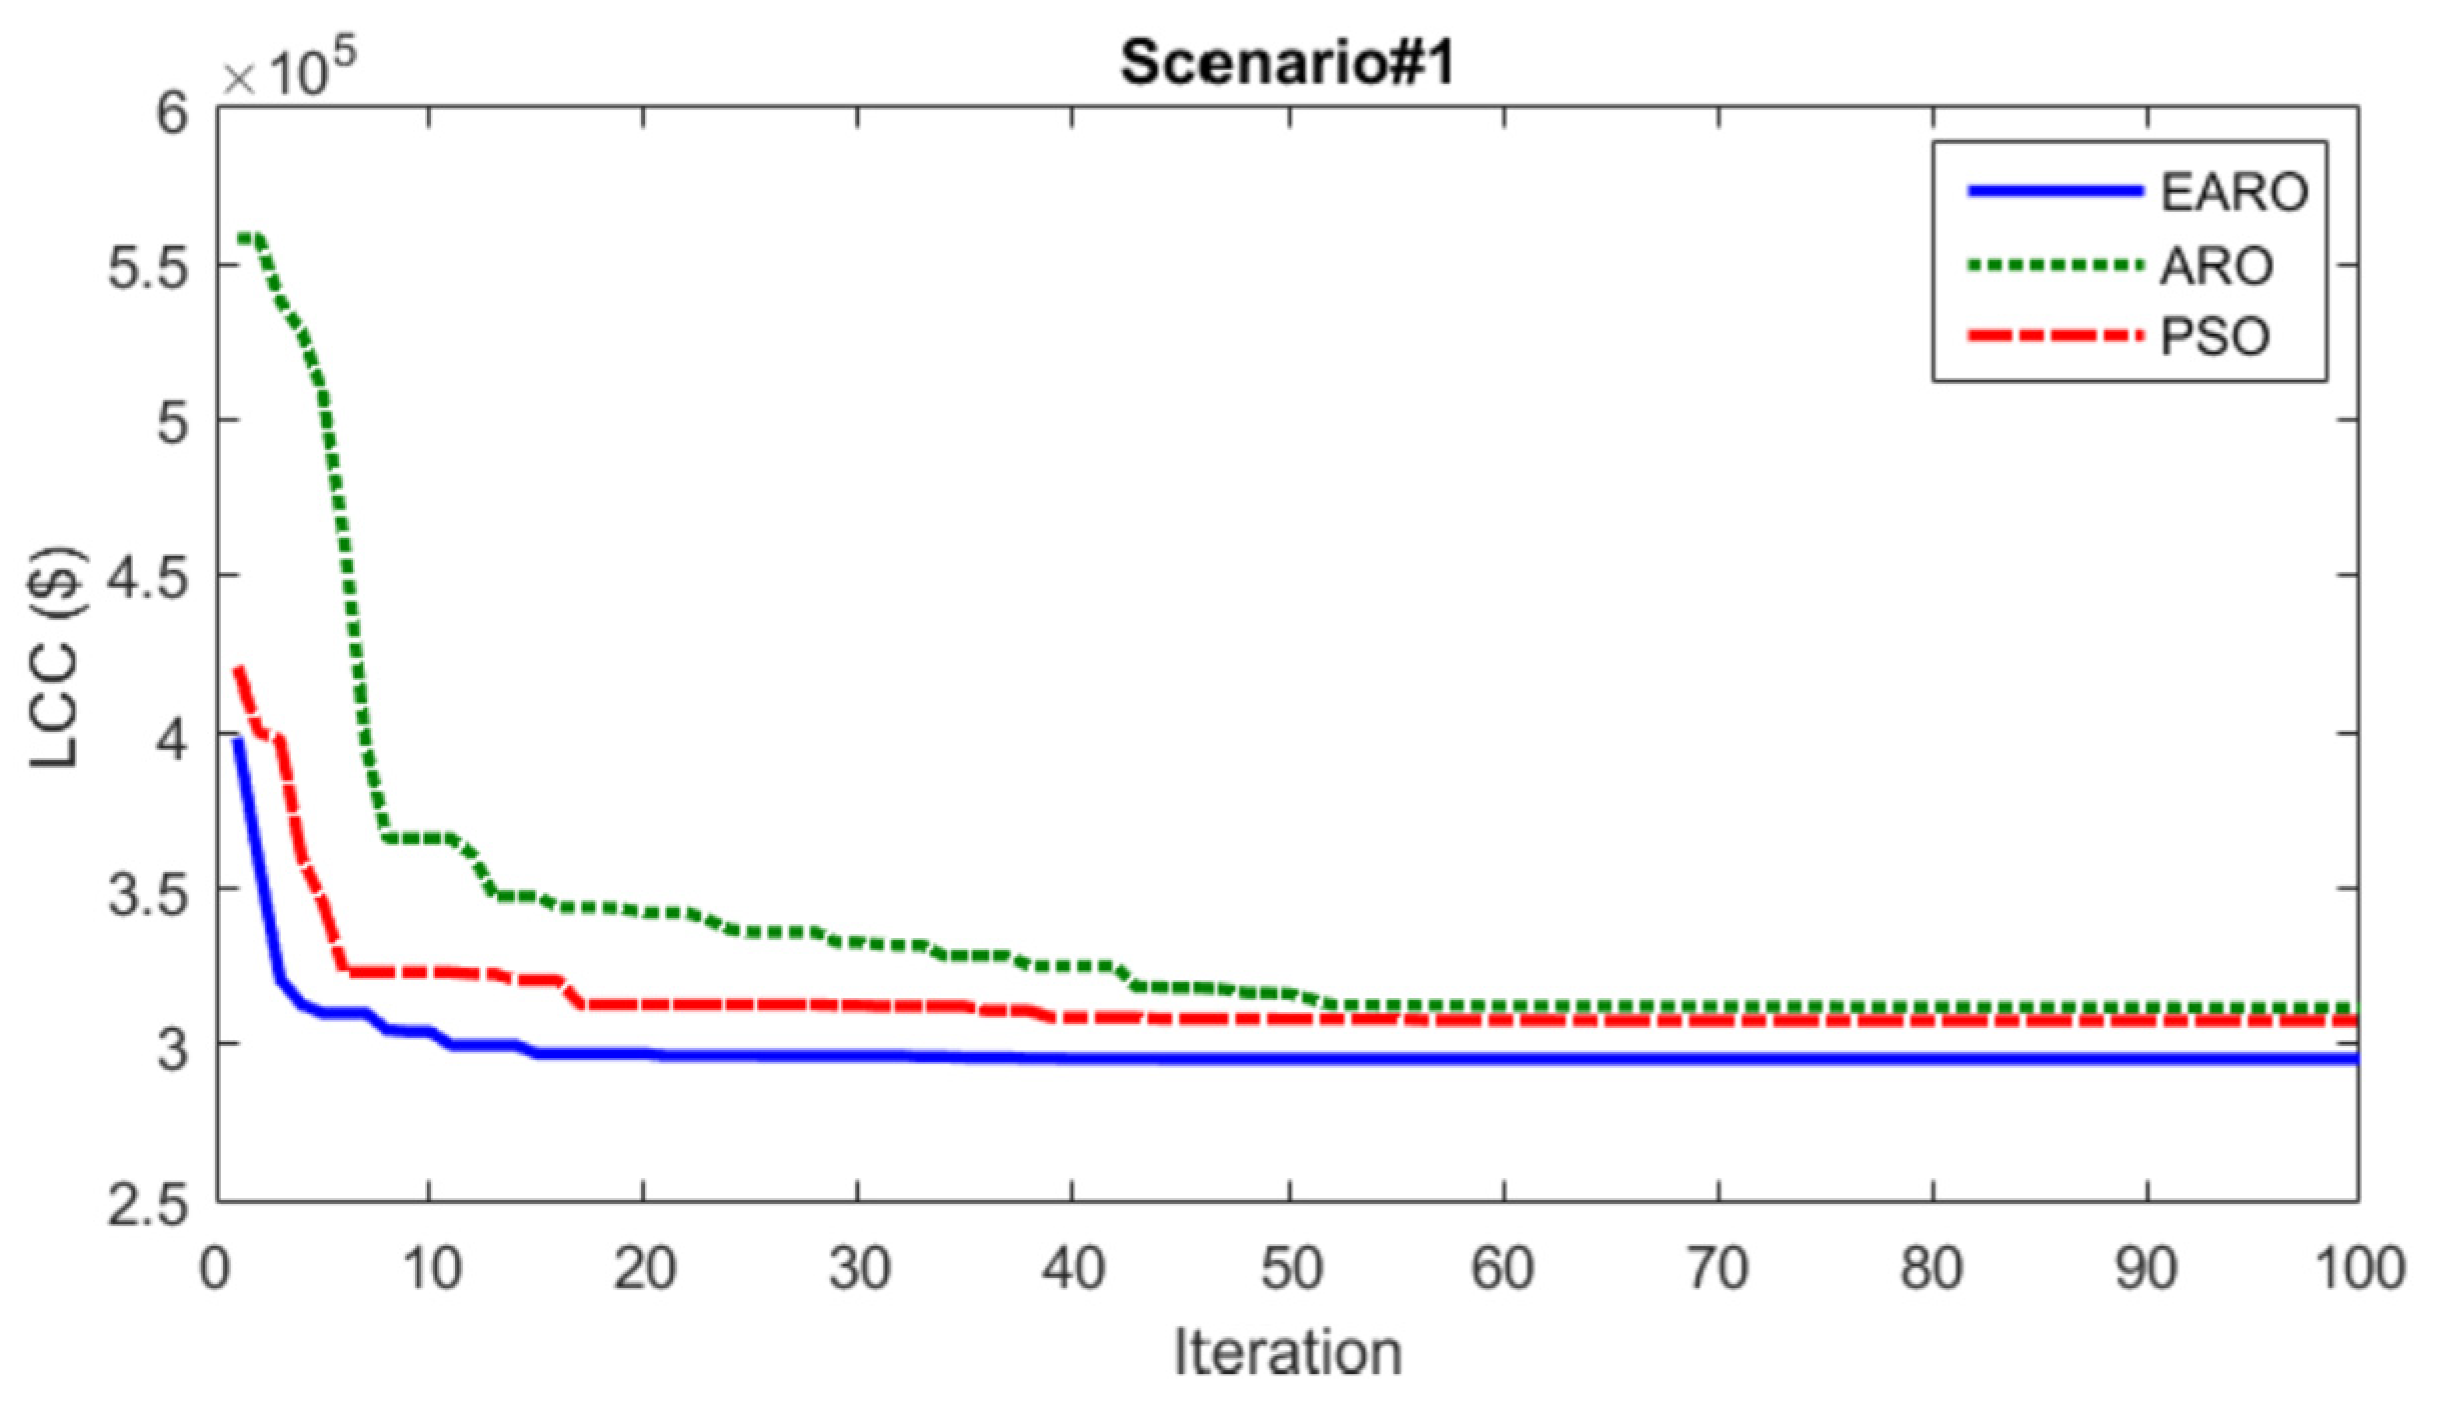
4.2. Simulation Results of the First Scenario

Based on Scenario 1, the solar pumping system is designed considering a water height of 5 m. The convergence process of the different algorithms is shown in Figure 6. This figure shows that the system costs using the EARO method are lower than for other methods. In Table 6, the results are given. Based on Scenario 1, the PV array and water tank numbers are set to 5 and 7, respectively. The system cost is 0.2955 M$. Using EARO, the LCC is lower than for the ARO and PSO methods, and the system was able to fully supply the water consumed by the customers. However, when using the ARO and PSO methods, system costs were equal to 3119 and 0.3078 M$, respectively, and on the other hand, these methods did not provide 4.18 and 4.16% of the water required by customers, respectively. Therefore, the obtained results confirm the better capability of EARO in terms of achieving the lowest cost and the highest reliability of water supply to customers.
Table 7 shows the sensitivity of pIW compared to the number of PV arrays based on the EARO method; in other words, it can be seen that with the increase in the PV number, unsupplied water for customers decreases, and they are supplied with higher reliability.
Figure 7 illustrates the variations in pIW compared to the PV number; with the increase in the PV number, the water demand of the customers is met with a higher level of reliability.

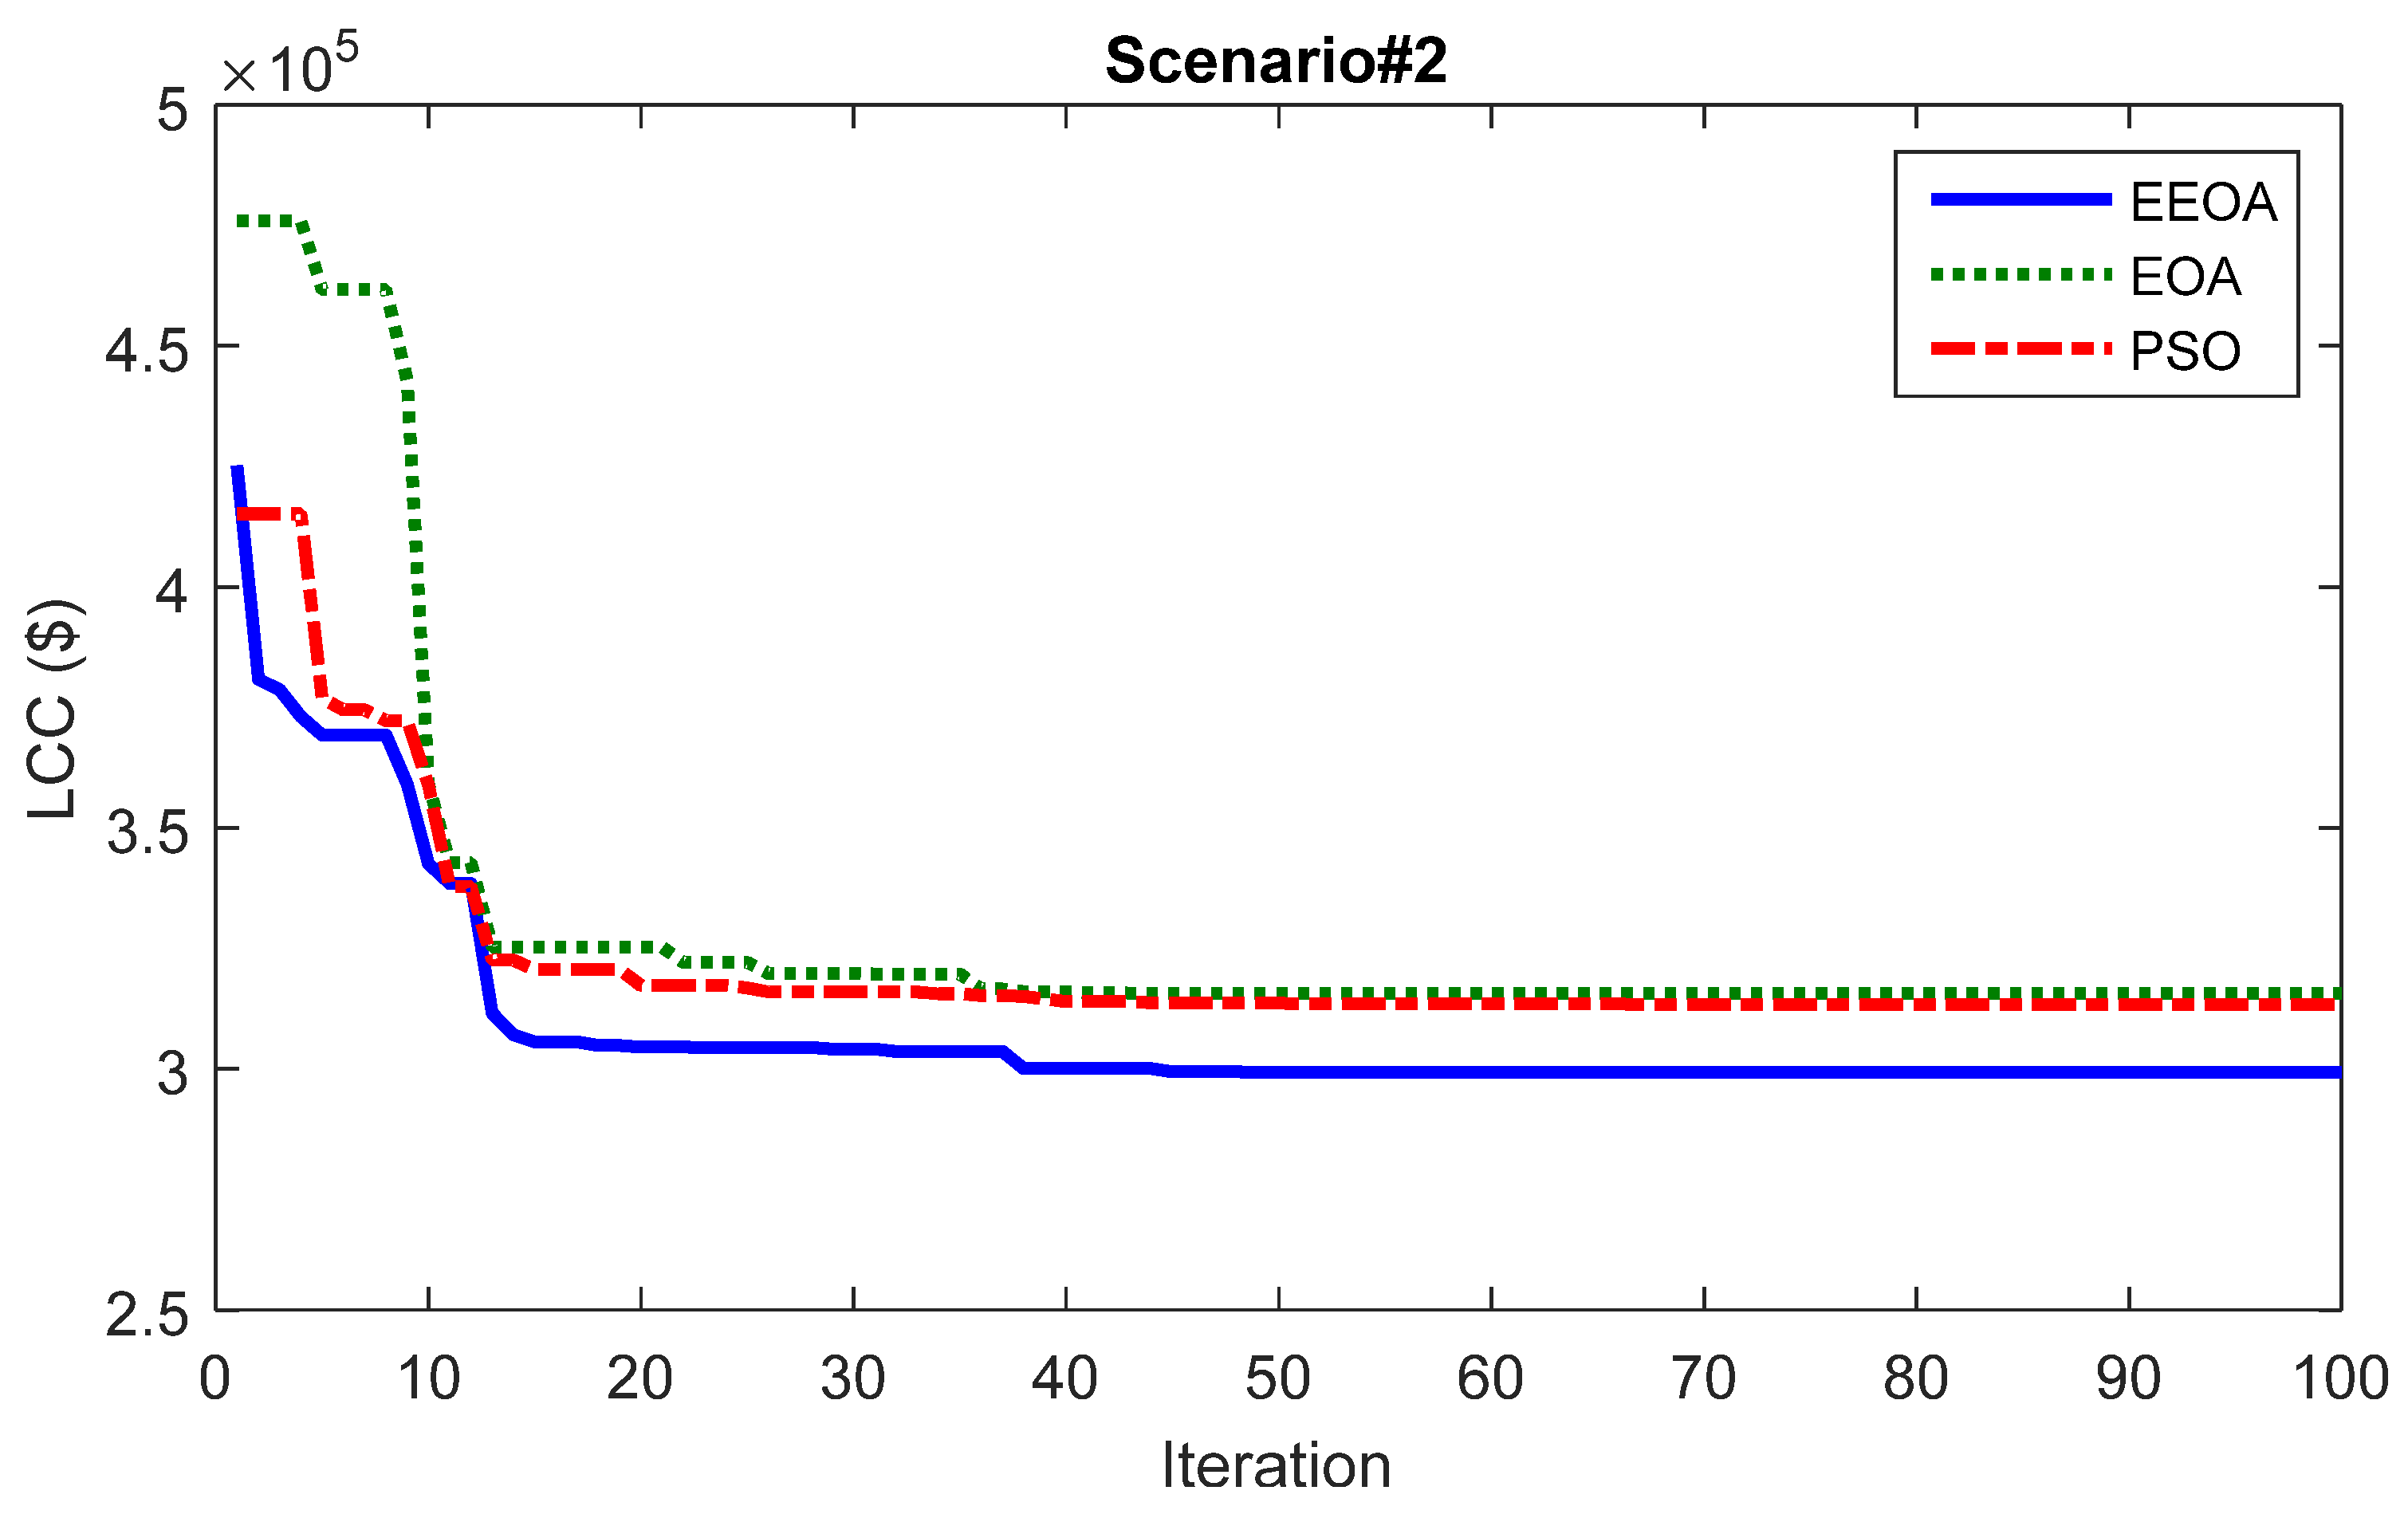
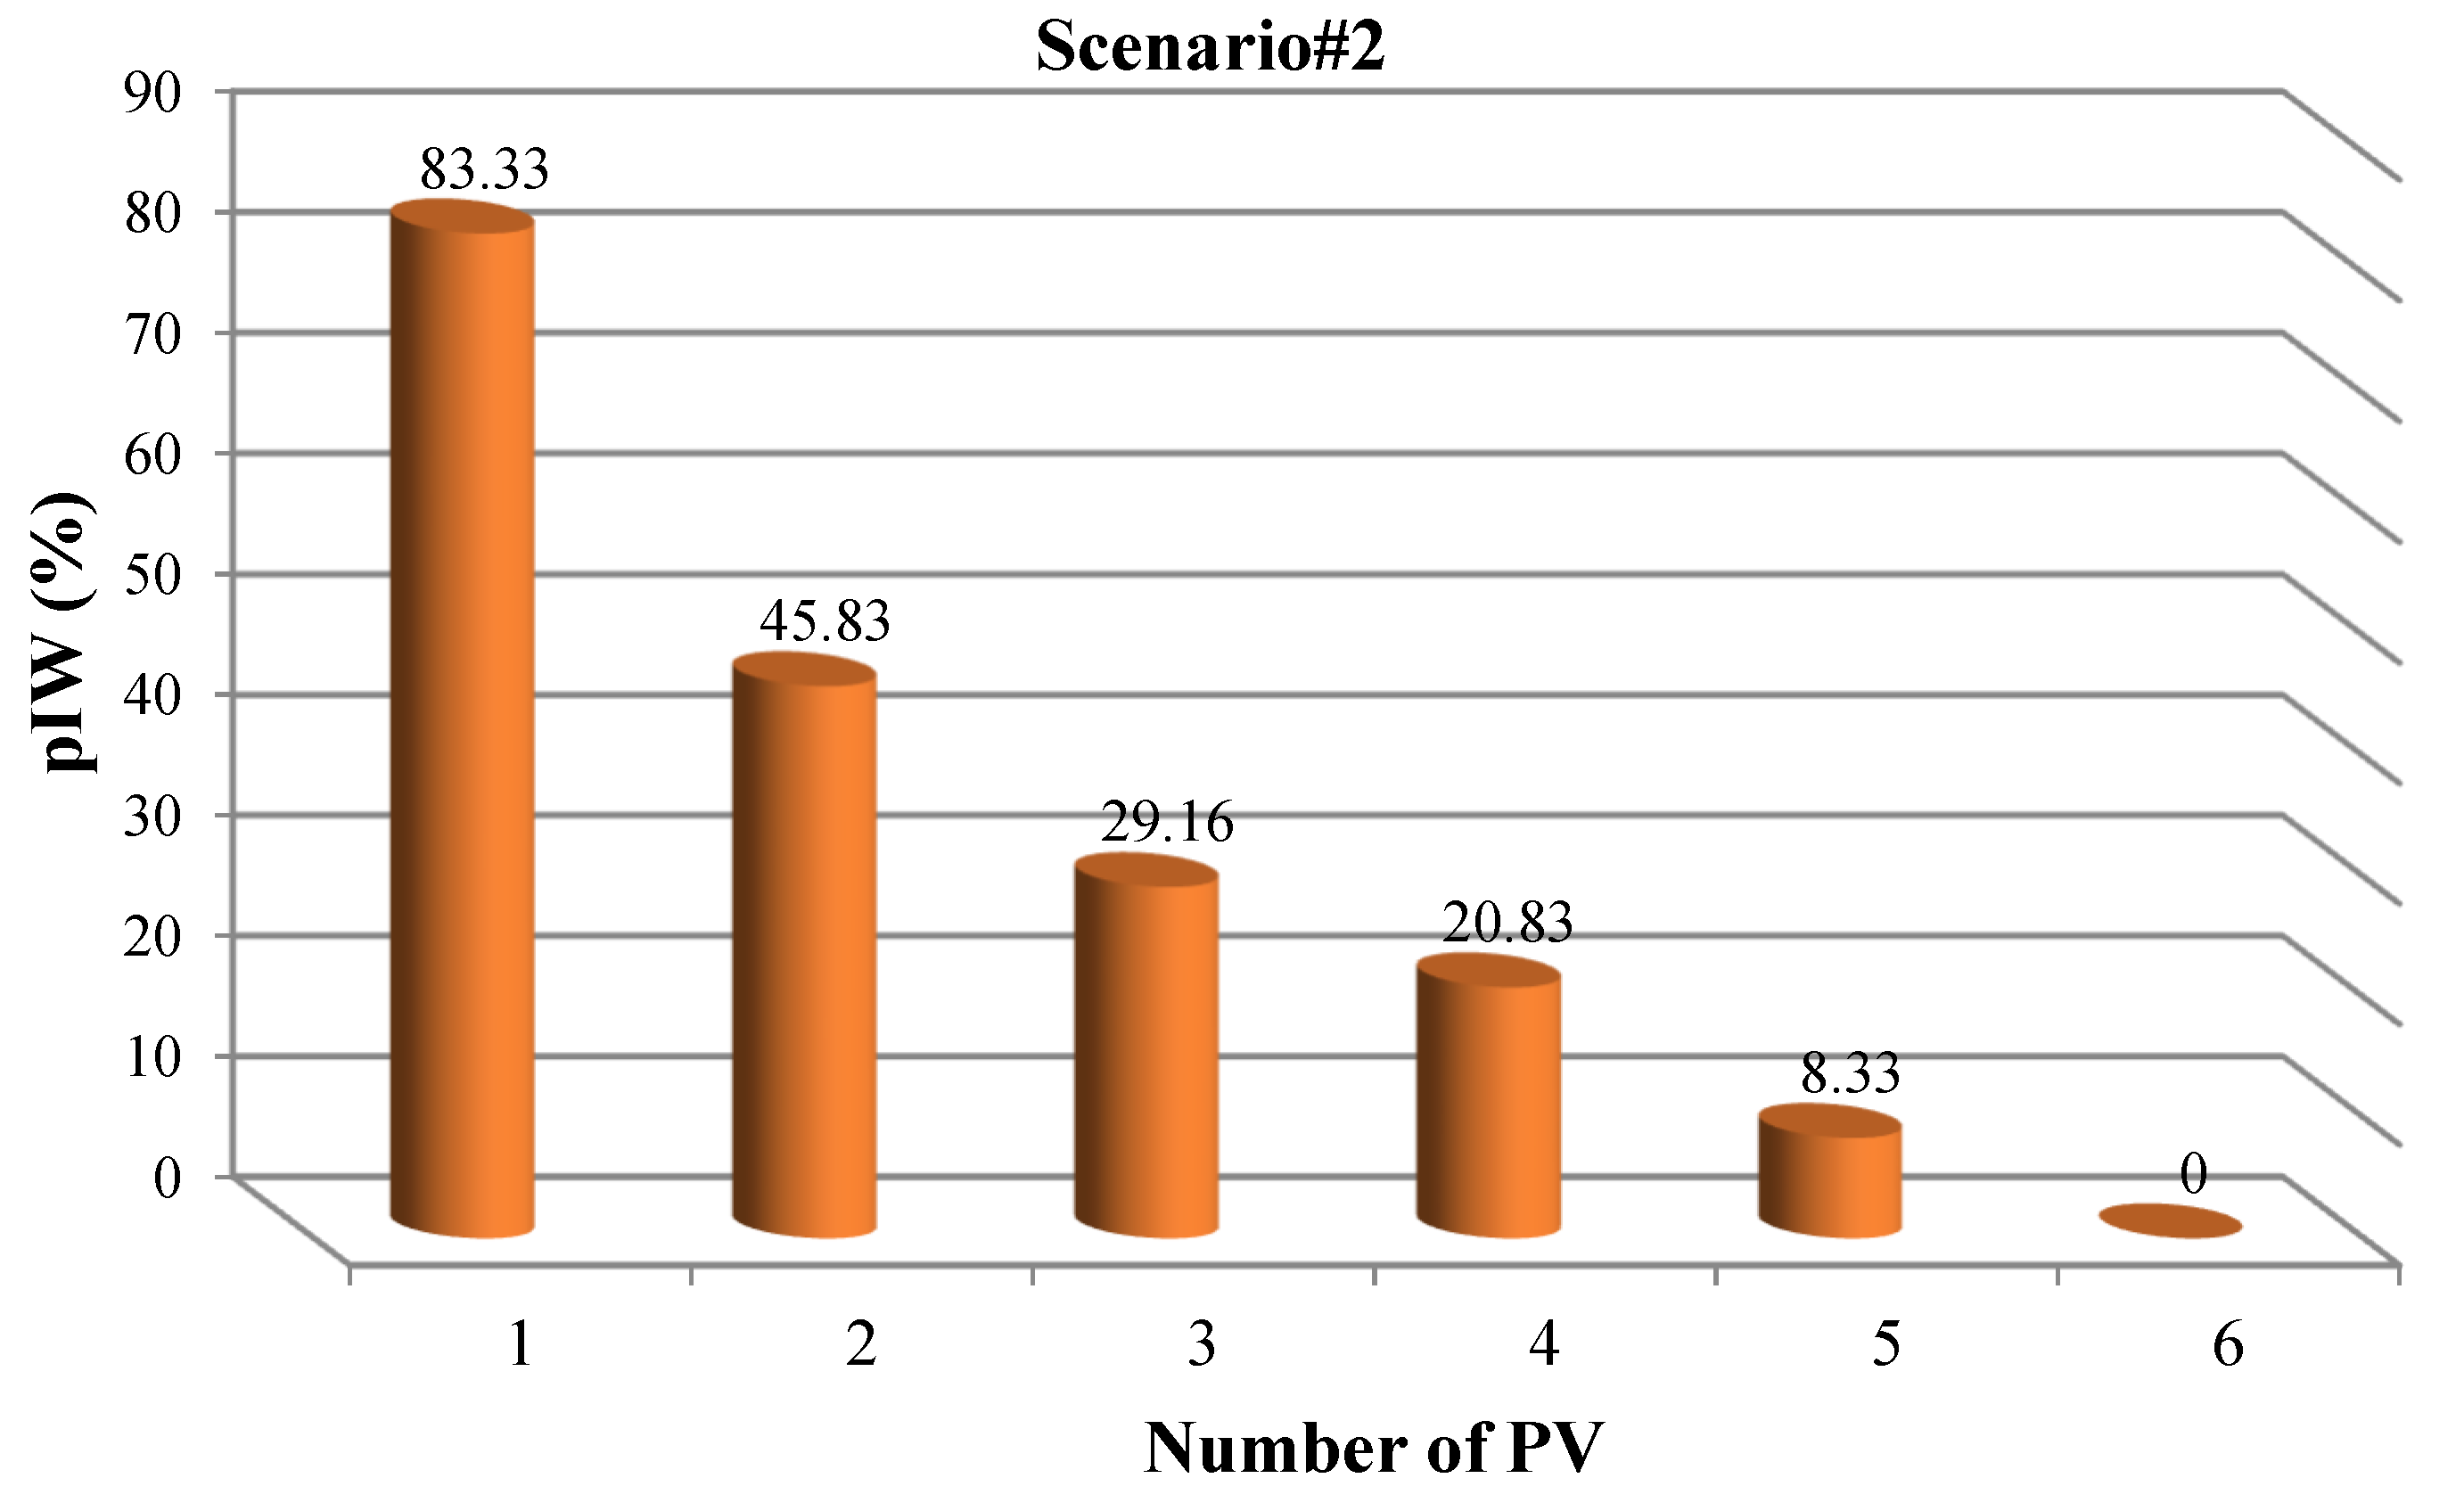
4.3. Results of Scenario 2

The results Scenario 2, with height of 10 m, are given in Table 8. Figure 8 shows the convergence process of the different algorithms and demonstrates that EAROs obtain the optimal component sizing with lowest LCC.
In the second scenario, the PV array number and tank number of the EARO method are 6 and 7, respectively. The LCC obtained using EARO is 0.2993 M$. For ARO and PSO, NPV and NWST are equal to 6. Using ARO and PSO, the LCC is 0.3157 M$ and 0.3134 M$, respectively. Therefore, according to the results, it can be said that the EARO method has optimized the system at a lower cost and also has provided the total water demanded by customers with p I W equal to zero. On the other hand, the ARO and PSO methods did not provide 4.47 and 4.23% of the total water required by the customers, respectively, which increased the cost by imposing the cost of WNS by these methods. Therefore, the proposed method of EARO is a cost-effective and reliable method compared to other methods.
In Table 9 and Figure 9, the variations in p I W compared to the PV array number are plotted; it is clear that the p I W value decreases as the PV array number increases.

4.4. Comparison of Scenario Results

The results of Scenarios 1 and 2 obtained via EARO are compared with each other. The required power of the motor pump is supplied by photovoltaic sources, and the required power of the motor pump is optimized. When the height of water extraction increases, in this case, the motor pump needs more power to extract the same volume of water in the base state (base height of 5 m). Based on Table 10, it is clear that with the increase of water height from 5 to 10 m and thus the increase in the height of water extraction, the optimization program has considered more photovoltaic panels or more photovoltaic power to supply the required power of the motor pump. On the other hand, the optimization program has guaranteed the complete and reliable supply of 100% (with pIW = 0) of the water demand of the customers under the conditions of changing the height of water extraction, satisfying the water reliability index. As a result, it can be seen that the LCC of the system has increased with the increase in the height of water extraction due to the increase in photovoltaic power required by the motor pump.
In the following, the effects of some effective technical parameters such as changes in the intensity of PV radiation and changes in temperature and the water demand of customers on system optimization—in other words, on the optimal capacity of components and system costs—have been evaluated. It should be noted that the simulations in this section have been performed at a height of 10 m.

4.5. Sensitivity Analysis

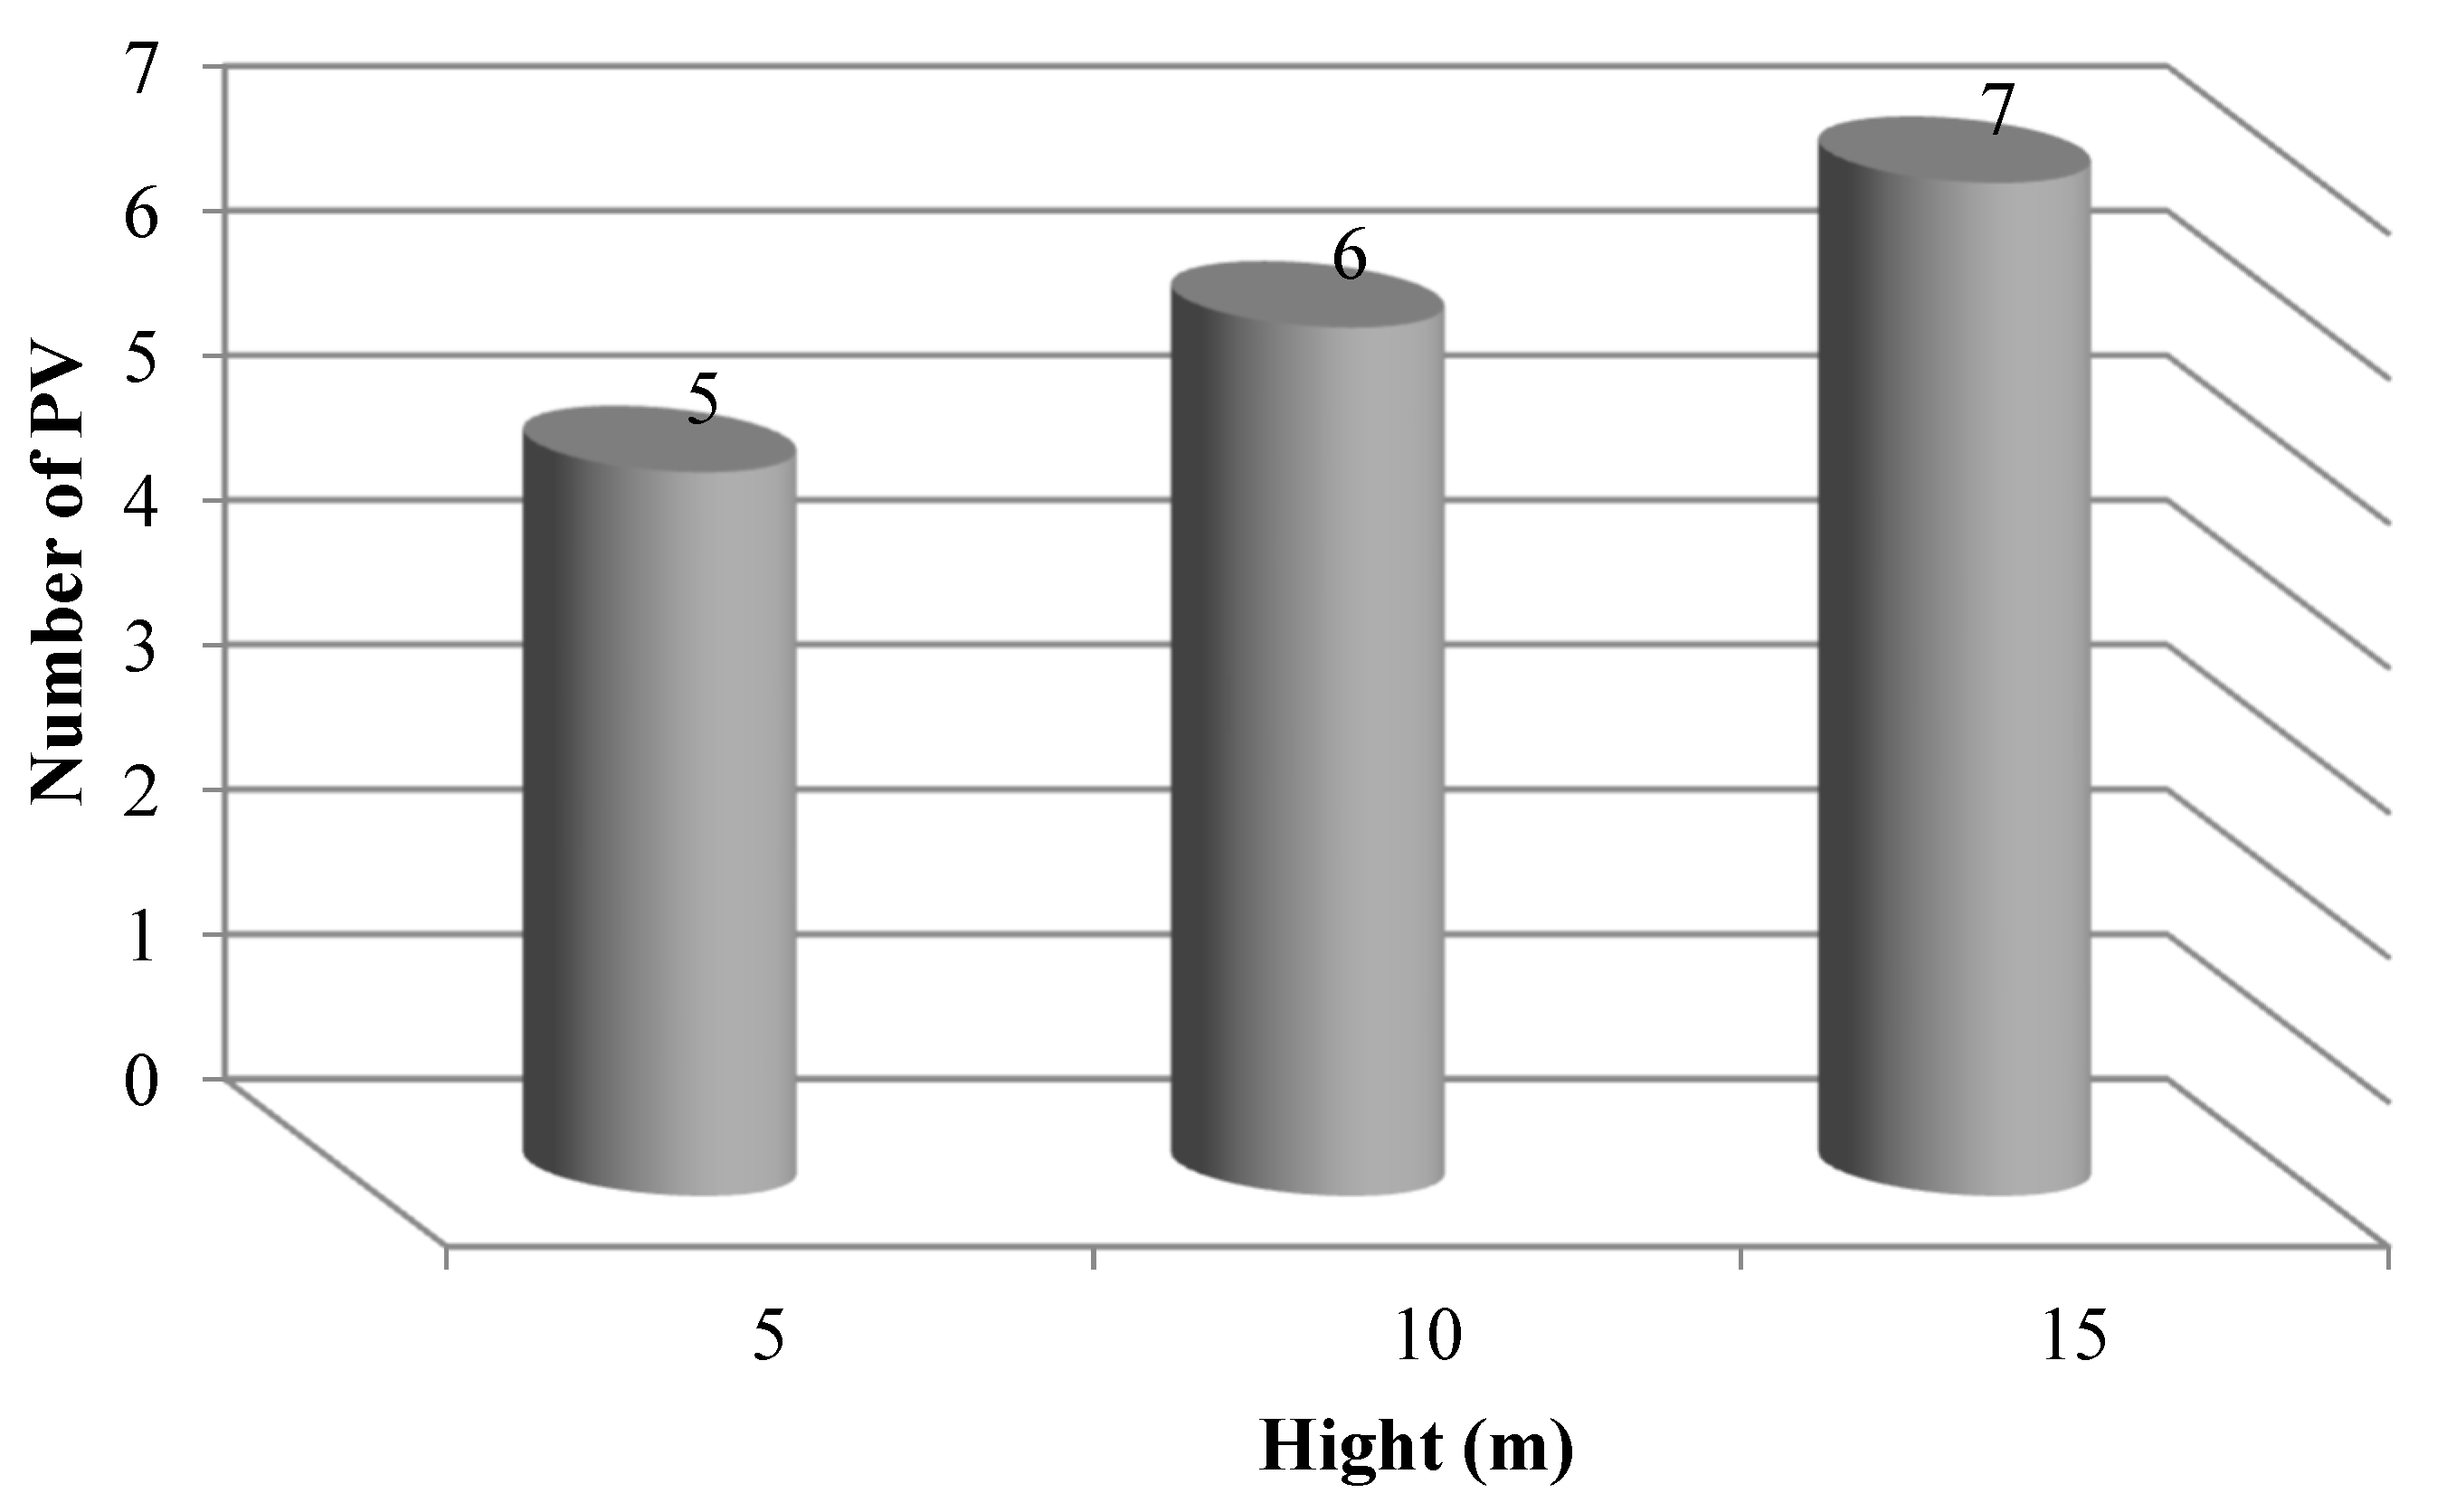
4.5.1. Effect of Height Changes

In Table 11 and Figure 10, the effect of increasing the height of water extraction on the number of photovoltaic panels is evaluated. With the increase in the height of water extraction, the required power of the motor pump has increased the number of photovoltaic panels used.

4.5.2. Effect of Changes in the Number of Tanks

The results of changes in the number of water storage tanks in relation to the height are presented in Table 12. In a 24 h period, the water demand of the customers is completely satisfied. Therefore, the optimization program under the conditions of changes in the height of water extraction has tried to fully supply the same volume of water required by the customers as in the base height scenario by increasing the required power of the motor pump. So, with the increase in the height of water extraction, the number of water tanks required by the customers has remained unchanged.

4.5.3. Effect of Changes in Irradiance

The irradiance is decreased by 25% and increased by 25%, and the results are compared with a height of 10 m. The results of irradiance changes are presented in Table 13. As we know, with the increase of irradiance (compared to the basic state), the output power of a photovoltaic panel increases. Therefore, in conditions of increased irradiance, the amount of extracted power is higher. As can be seen, with the 25% increase in irradiance, the number of photovoltaic panels has decreased from seven to five. In other words, the optimization program considers the power produced by five photovoltaic panels in the condition of a 25% increase in irradiance equivalent to the power produced by six photovoltaic panels in the basic irradiance condition. Also, the optimization program has selected the power produced by nine photovoltaic panels in the conditions of 25% reduction of irradiance, equivalent to the power generated by six photovoltaic panels in the basic irradiance. On the other hand, it is clear that with the increase (decrease) of the number of photovoltaic panels in the conditions of 25% reduction (increase) of irradiance, the cost of the system has increased (decreased). Also, the results show that the decrease in irradiance has weakened the reliability of the customers’ water supply.

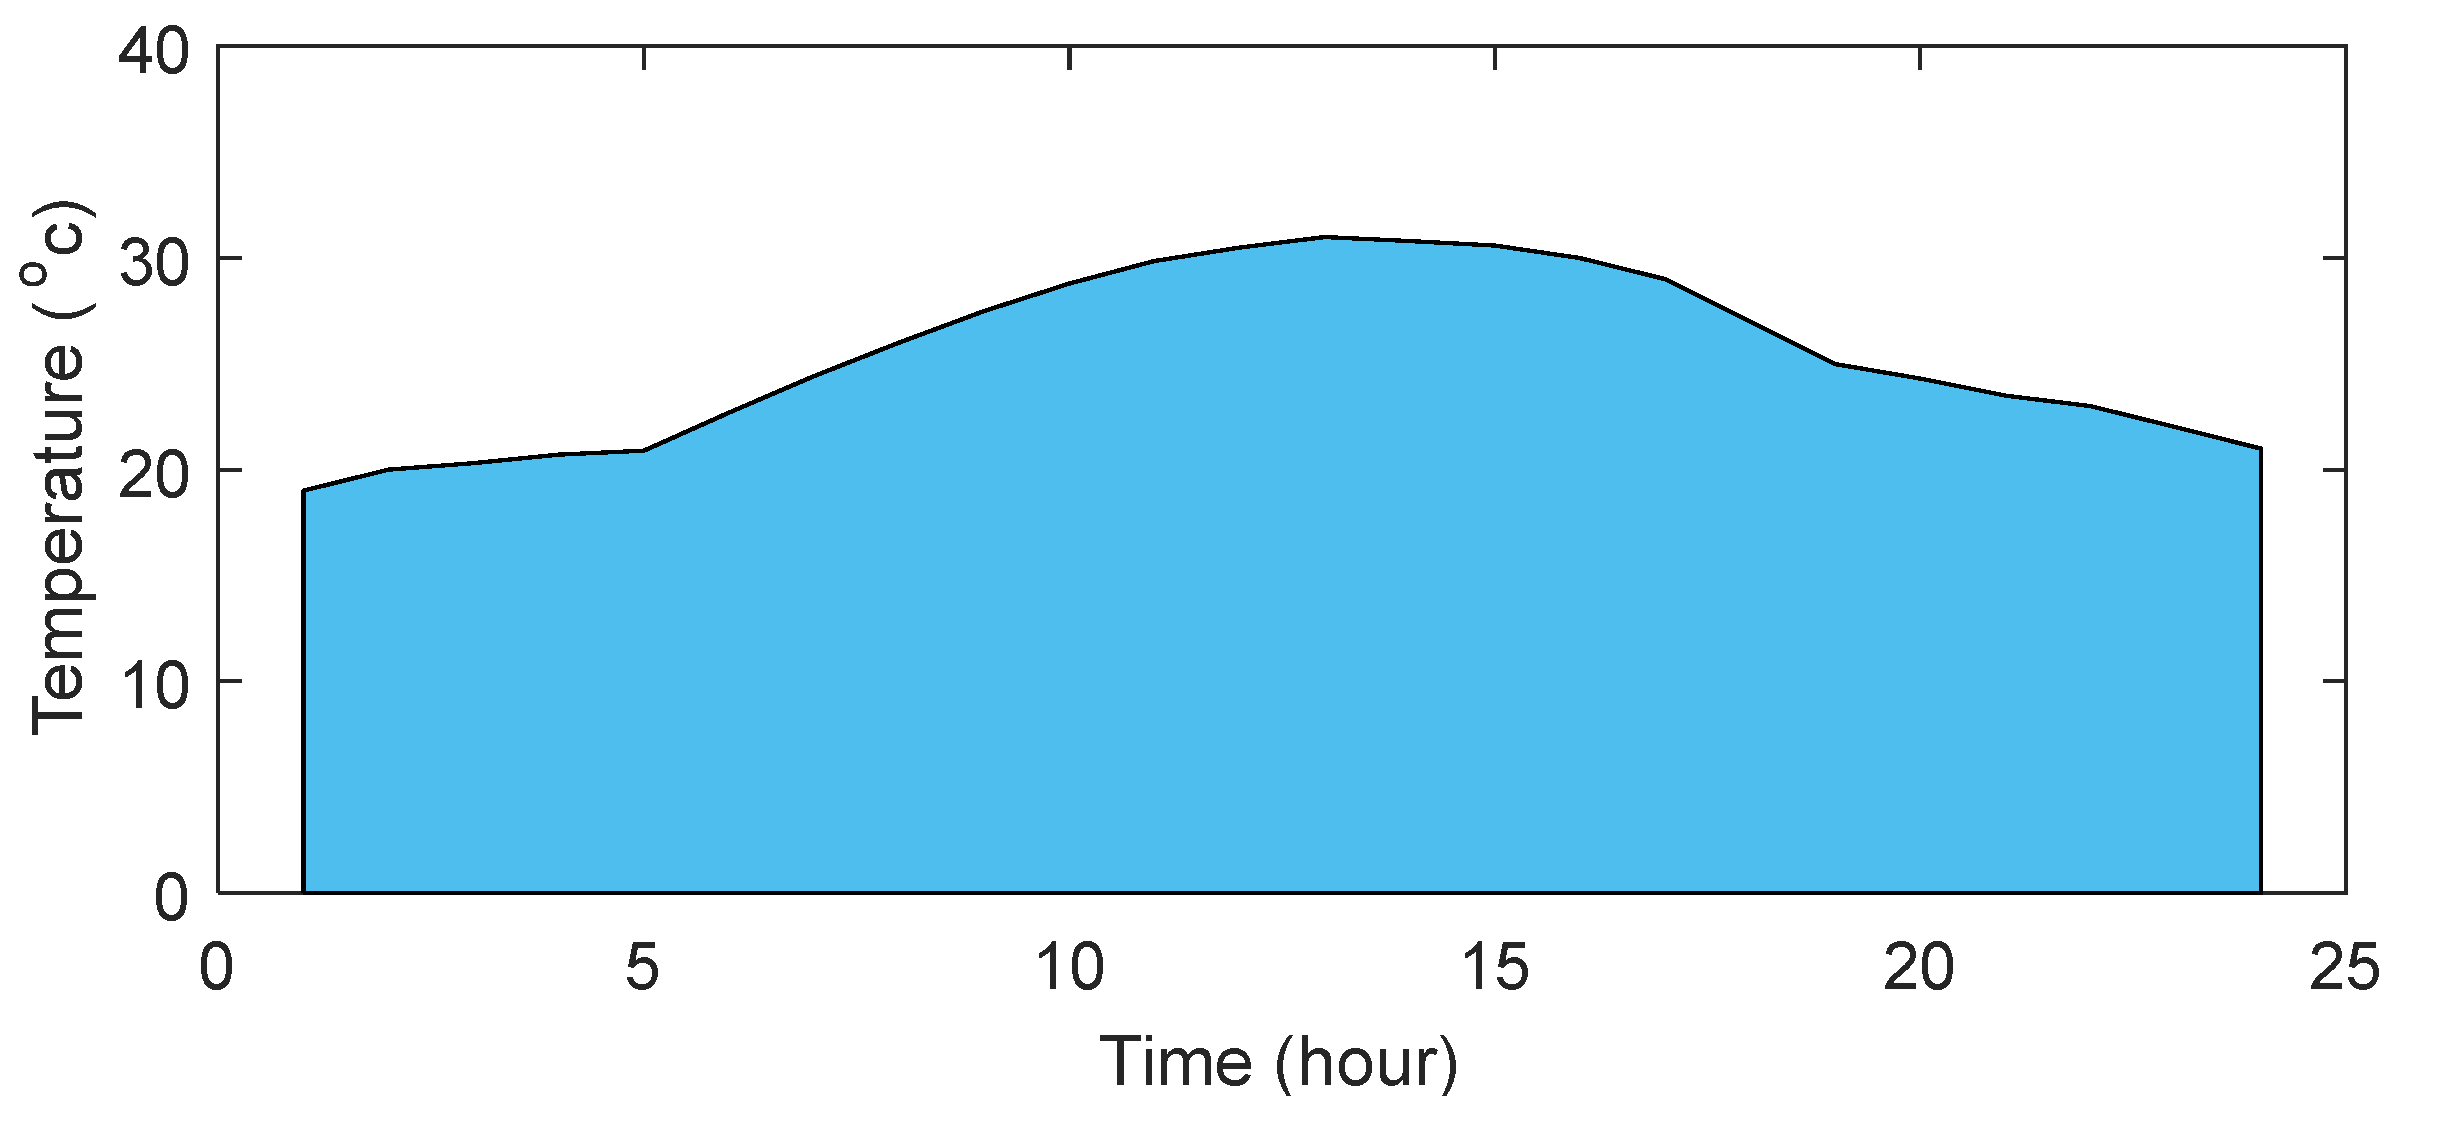
4.5.4. Effect of Temperature Changes

The effect of temperature variations (10% decrease and increase compared to the baseline) on the optimal capacity of system components and the cost to meet the total water demand is presented in Table 14. An increase in temperature causes very small changes in the output power of photovoltaic panels. This effect is mostly considered in low-power applications of photovoltaic modules, and it is ignored in high-power applications. Based on the obtained results, it is clear that 10% changes in temperature did not affect the production of photovoltaic power and ultimately the cost and water supply of the customers.

4.5.5. Effect of Water Demand Changes

The effect of changes in the percentage of water consumed by customers on system optimization has been evaluated in this section. The results are given in Table 15. As the water demand of the customers increases, the pump motor needs more power to extract more water and vice versa. Therefore, more photovoltaic panels are needed to supply the required power for the motor pump. Therefore, the increase in the water demand of the customers increases the cost. Similarly, reducing the water demand of the customers will reduce the number of photovoltaic panels and reduce the cost. On the other hand, in the conditions of increased water needs, the optimization program may not be able to fully meet the needs of the customers.

4.5.6. Effect of Considering Replacement Cost

In this section, the effect of considering the replacement cost of system components according to the project lifetime of the system (25 years) and operation period of the equipment is presented in the solutions of Scenarios 1 and 2 according to Table 16. In this condition the replacement cost considered for the motor pump and also inverter is added to Equation (14). So, the replacement cost is defined as C R = C r e p × S F F ( i , y r e p ) , and S F F = i / ( 1 + i ) y 1 ( C r e p is the replacement cost of a motor pump and inverter (U.S. dollars), i is the annual real interest rate, and y r e p is the lifetime of the motor pump and inverter). In this case, based on Table 2, the lifespan of the project is considered to be 25 years according to the lifespan of the photovoltaic sources and the water tank, and the useful lifespan of the pump motor and inverter is also considered to be 10 years. In this situation, the cost of replacing the equipment is considered similar to the investment cost of each piece of equipment, which is naturally included in the cost function (LCC) of Equation (14) based on the annual operating period of this study, and the simulation results using the EARO optimization method are presented in Table 16. The LCC for Scenario 1 and Scenario 2 is obtained 0.3073 M$ and 0.3111 M$, respectively.

5. Comparison of the Results

In battery-based water-pumping systems, the water demand is met online. By receiving radiation, PV resources supply the electrical energy of the motor pump. In other words, the water-related electricity needed by customers to extract water is delivered to the pump motor, and the extra PV power is saved in the batteries for hours without PV radiation and thus without PV electricity. The battery is discharged, and the pump motor is provided with power for the extraction of water for delivery to customers. In other words, the warehouse is electric. In a tank-based photovoltaic water pump, the battery is deleted, and the water tank replaces it. For the method of EARO, according to the annual cost of the system for 10 m of irrigation equal to 0.3073 M$ and the consumption of 10 m3 of water by the customers every day, the cost of the water supplied to subscribers per liter (CWS) is equal to USD 0.0841. The numerical comparison of the CWS is given in Table 17. It can be seen that the EARO method with the PV pump system based on the water storage tank has obtained a lower cost per liter compared to other methods based on the battery storage system [29,30]. The configuration provided along with the proposed methodology is simpler compared to other methods, the life of the storage system based on the water storage tank is longer, and the cost of the water supplied to the subscribers is lower.

6. Conclusions

In this paper, the sizes of PV pumping system components are determined to meet the water demand of customers to minimize LCC and satisfy a reliability constraint, optimally for the Gorgan region. The sizes of components such as PV arrays and the number of water storage tanks are calculated optimally via EARO. Also, the capability of EARO is compared with those of the traditional ARO and PSO. The LCC values for water extraction heights of 5 m and 10 m are 0.3073 M$ and 0.3111 M$, respectively, using EARO. The results demonstrated that the water-pumping system can supply the customers’ demand fully based on continuous provision. The results showed that EARO, in designing the PV water pump system compared to the ARO and PSO methods, has a lower cost with higher reliability. The effect of some important factors on system design is also evaluated. As PV energy size increases, system reliability and cost increase. As the water extraction depth increases, the PV energy required to supply the pump motor as well as the system cost increase. As the irradiance increases, the PV number and consequently the system cost decrease, and vice versa. The results also demonstrated that increasing the temperature does not have a significant effect on system optimization, optimal component sizes, or the reliability index. Also, the proposed method performance was confirmed, compared to the previous methods, to have a lower cost of water extraction per liter. Assessing the uncertainty of PV power generation and water consumption of customers in designing a PV water pump system is suggested for future work.

Author Contributions

A.M.: conceptualization, methodology, software, and writing; A.P.: conceptualization, methodology, software, and writing; M.S.M.: methodology and software; M.B.A.: software, optimization, and writing—original draft; A.Y.A. and M.E.: investigation, supervision, validation, and writing—review & editing. All authors have read and agreed to the published version of the manuscript.

Funding

This research received no external funding.

Data Availability Statement

Not applicable.

Conflicts of Interest

The authors declare no conflict of interest.

References

  1. Naderipour, A.; Abdul-Malek, Z.; Nowdeh, S.A.; Kamyab, H.; Ramtin, A.R.; Shahrokhi, S.; Klemeš, J. Comparative evaluation of hybrid photovoltaic, wind, tidal and fuel cell clean system design for different regions with remote application considering cost. J. Clean. Prod. 2021, 283, 124207. [Google Scholar] [CrossRef]
  2. Arabi, N.S.A.; Saftjani, P.B.; Abdul-Malek, Z.; Mustafa, M.W.B.; Kamyab, H.; Davoudkhani, I.F. Deterministic and probabilistic multi-objective placement and sizing of wind renewable energy sources using improved spotted hyena optimizer. J. Clean. Prod. 2021, 286, 124941. [Google Scholar]
  3. Jafar-Nowdeh, A.; Babanezhad, M.; Arabi-Nowdeh, S.; Naderipour, A.; Kamyab, H.; Abdul-Malek, Z.; Ramachandaramurthy, V.K. Meta-heuristic matrix moth–flame algorithm for optimal reconfiguration of distribution networks and placement of PV and wind renewable sources considering reliability. Environ. Technol. Innov. 2020, 20, 101118. [Google Scholar] [CrossRef]
  4. Errouha, M.; Derouich, A.; Motahhir, S.; Zamzoum, O.; El Ouanjli, N.; El Ghzizal, A. Optimization and control of water pumping PV systems using fuzzy logic controller. Energy Rep. 2019, 5, 853–865. [Google Scholar] [CrossRef]
  5. Nowdeh, S.A.; Ghahnavieh, A.A.; Khanabdal, S.A.H.E.B. PV/FC/Wind Hybrid System Optimal Sizing Using PSO Modified Algorithm; Tomul LVIII (LXII), Fasc, 4; Universitatea Tehnică „Gheorghe Asachi” din Iasi: Cluj-Napoca, Romania, 2012. [Google Scholar]
  6. Davoodkhani, F.; Nowdeh, S.A.; Abdelaziz, A.Y.; Mansoori, S.; Nasri, S.; Alijani, M. A new hybrid method based on gray wolf optimizer-crow search algorithm for maximum power point tracking of photovoltaic energy system. In Modern Maximum Power Point Tracking Techniques for Photovoltaic Energy Systems; Springer: Cham, Switzerland, 2020; pp. 421–438. [Google Scholar]
  7. Naderipour, A.; Abdul-Malek, Z.; Vahid, M.Z.; Seifabad, Z.M.; Hajivand, M.; Arabi-Nowdeh, S. Optimal, Reliable and Cost-Effective Framework of Photovoltaic-Wind-Battery Energy System Design Considering Outage Concept Using Grey Wolf Optimizer Algorithm—Case Study for Iran. IEEE Access 2019, 7, 182611–182623. [Google Scholar] [CrossRef]
  8. Abdul-Malek, Z.; Noorden, Z.A.; Davoudkhani, I.F.; Nowdeh, S.A.; Kamyab, H.; Ghiasi, S.M.S. Carrier wave optimization for multi-level photovoltaic system to improvement of power quality in industrial environments based on Salp swarm algorithm. Environ. Technol. Innov. 2021, 21, 101197. [Google Scholar]
  9. Arabi-Nowdeh, S.; Nasri, S.; Saftjani, P.B.; Naderipour, A.; Abdul-Malek, Z.; Kamyab, H.; Jafar-Nowdeh, A. Multi-criteria optimal design of hybrid clean energy system with battery storage considering off-and on-grid application. J. Clean. Prod. 2021, 290, 125808. [Google Scholar] [CrossRef]
  10. Paredes-Sánchez, J.P.; Villicaña-Ortíz, E.; Xiberta-Bernat, J.P.V. water pumping system for water mining environmental control in a slate mine of Spain. J. Clean. Prod. 2015, 87, 501–504. [Google Scholar] [CrossRef]
  11. Dursun, M.; Ozden, S. Application of PV powered automatic water pumping in Turkey. Int. J. Comput. Electr. Eng. 2012, 4, 161. [Google Scholar] [CrossRef] [Green Version]
  12. Bakelli, Y.; Arab, A.H.; Azoui, B. Optimal sizing of photovoltaic pumping system with water tank storage using LPSP concept. PV Energy 2011, 85, 288–294. [Google Scholar] [CrossRef]
  13. Bakelli, Y.; Kaabeche, A. Optimal size of photovoltaic pumping system using nature-inspired algorithms. Int. Trans. Electr. Energy Syst. 2019, 29, e12045. [Google Scholar] [CrossRef]
  14. Maddalena, E.T.; da Silva Moraes, C.G.; Bragança, G.; Junior, L.G.; Godoy, R.B.; Pinto, J.O.P. A battery-less photovoltaic water-pumping system with low decoupling capacitance. IEEE Trans. Ind. Appl. 2019, 55, 2263–2271. [Google Scholar] [CrossRef]
  15. Errouha, M.; Derouich, A.; Motahhir, S.; Zamzoum, O. Optimal control of induction motor for photovoltaic water pumping system. Technol. Econ. Smart Grids Sustain. Energy 2020, 5, 6. [Google Scholar] [CrossRef] [Green Version]
  16. Khiareddine, A.; Salah, C.B.; Mimouni, M.F. Power management of a photovoltaic/battery pumping system in agricultural experiment station. Sol. Energy 2015, 112, 319–338. [Google Scholar] [CrossRef]
  17. Yang, J.; Olsson, A.; Yan, J.; Chen, B. A hybrid life-cycle assessment of CO2 emissions of a PV water pumping system in China. Energy Procedia 2014, 61, 2871–2875. [Google Scholar] [CrossRef] [Green Version]
  18. Liu, B.; Wang, Z.; Feng, L.; Jermsittiparsert, K. Optimal operation of photovoltaic/diesel generator/pumped water reservoir power system using modified manta ray optimization. J. Clean. Prod. 2021, 289, 125733. [Google Scholar] [CrossRef]
  19. Sarmas, E.; Spiliotis, E.; Marinakis, V.; Tzanes, G.; Kaldellis, J.K.; Doukas, H. ML-based energy management of water pumping systems for the application of peak shaving in small-scale islands. Sustain. Cities Soc. 2022, 82, 103873. [Google Scholar] [CrossRef]
  20. Nikzad, A.; Chahartaghi, M.; Ahmadi, M.H. Technical, economic, and environmental modeling of solar water pump for irrigation of rice in Mazandaran province in Iran: A case study. J. Clean. Prod. 2019, 239, 118007. [Google Scholar] [CrossRef]
  21. Muhsen, D.H.; Khatib, T.; Haider, H.T. A feasibility and load sensitivity analysis of photovoltaic water pumping system with battery and diesel generator. Energy Convers. Manag. 2017, 148, 287–304. [Google Scholar] [CrossRef]
  22. Mukherjee, S.; Chattaraj, S.; Prasad, D.; Singh, R.P.; Khan, M.I. MPPT-Based PV Powered Water Pumping With RMS: Augmentation of IoE Technology. In Role of IoT in Green Energy Systems; IGI Global: Hershey, PA, USA, 2021; pp. 194–224. [Google Scholar]
  23. Ma, T.; Yang, H.; Lu, L.; Peng, J. Optimal design of an autonomous PV–wind-pumped storage power supply system. Appl. Energy 2014, 160, 728–736. [Google Scholar] [CrossRef]
  24. Kaldellis, J.K.; Kapsali, M.; Kondili, E.; Zafirakis, D. Design of an integrated PV-based pumped hydro and battery storage system including desalination aspects for the Island of Tilos-Greece. In Proceedings of the International Conference on Clean Electrical Power (ICCEP), Sardinia, Italy, 11–13 June 2013. [Google Scholar]
  25. Ma, T.; Yang, H.; Lu, L.; Peng, J. Technical feasibility study on a standalone hybrid PV-wind system with pumped hydro storage for a remote island in Hong Kong. Renew. Energy 2014, 69, 7–15. [Google Scholar] [CrossRef]
  26. Ma, T.; Yang, H.; Lu, L. Feasibility study and economic analysis of pumped hydro storage and battery storage for a renewable energy powered island. Energy Convers. Manag. 2014, 79, 387–397. [Google Scholar] [CrossRef]
  27. Wang, L.; Cao, Q.; Zhang, Z.; Mirjalili, S.; Zhao, W. Artificial rabbits optimization: A new bio-inspired meta-heuristic algorithm for solving engineering optimization problems. Eng. Appl. Artif. Intell. 2022, 114, 105082. [Google Scholar] [CrossRef]
  28. Jahannoush, M.; Nowdeh, S.A. Optimal designing and management of a stand-alone hybrid energy system using meta-heuristic improved sine–cosine algorithm for Recreational Center, case study for Iran country. Appl. Soft Comput. 2020, 96, 106611. [Google Scholar] [CrossRef]
  29. Bhayo, B.A.; Al-Kayiem, H.H.; Gilani, S.I. Assessment of stand-alone PV-Battery system for electricity generation and utilization of excess power for water pumping. Sol. Energy 2019, 194, 766–776. [Google Scholar] [CrossRef]
  30. Lorenzo, C.; Almeida, R.H.; Martínez-Núñez, M.; Narvarte, L.; Carrasco, L.M. Economic assessment of large power photovoltaic irrigation systems in the ECOWAS region. Energy 2018, 155, 992–1003. [Google Scholar] [CrossRef]
Figure 1. Schematic of the PV water-pumping system.
Mathematics 11 00463 g001
Figure 2. Search structure according to factor A.
Mathematics 11 00463 g002
Figure 3. Flowchart of the EARO implementation for sizing problem solving.
Mathematics 11 00463 g003
Figure 4. Irradiance during a day for Gorgan region.
Mathematics 11 00463 g004
Figure 5. Ambient temperature during a day for Gorgan region.
Mathematics 11 00463 g005
Figure 6. The EARO, ARO, and PSO convergence curves in the first scenario.
Mathematics 11 00463 g006
Figure 7. Change compared to PV number in Scenario 1.
Mathematics 11 00463 g007
Figure 8. The EARO, ARO, and PSO convergence curves in the second scenario.
Mathematics 11 00463 g008
Figure 9. Changes relative to PV number in the Scenario 2.
Mathematics 11 00463 g009
Figure 10. Curve of changes in the number of PV arrays relative to water extraction height.
Mathematics 11 00463 g010
Table 1. Summary of literature review.
Ref.ConfigurationObjective FunctionReliabilityEnhanced Optimizer
[11]PV+MP+WST+BatteryEnergy efficiency
[12]PV+MP+WSTLCC
[13]PV+MP+BatteryNet present cost
[14]PV+MP+BatteryEnvironmental impacts
[15]PV+MPSystem efficiency
[16]PV+MP+BatteryNet present cost
[17]PV+MP+BatteryLevelized Cost of Energy
[18]PV+MP+DieselCost of Energy
[19]PV+MP+BatteryPeak shaving
[20]PV+MP+DieselLCC
[21]PV+MP+Battery+DieselCost of Energy
[22]PV+MP+BatteryNet present cost
[23]PV+WT+BatteryCost of Energy
* MP: Motor pump, WT: Wind turbine, ✕ refers to not included and ✓ refers to included.
Table 2. The cost data of the system [11,12,13].
ComponentCapital Cost (U.S. Dollars)Maintenance Cost (U.S. Dollars) τ 1   ( % ) ψ κ
PV Array294.912.954825
Pump Motor2102.14810
Water Tank42,0004204825
Inverter50.0570.5 -- -- 10
Table 3. Technical data of PV array [12,13].
Pmax (W)qknRsInVnocIscVmaxImax
551.6 ×10−191.38 × 10−231.50.0126.521.73.417.43.16
Table 4. Technical characteristics of motor pump [12,13].
Motor TypeNominal Power (W)Voltage Range (V)Maximum Current (A)
DC4000–4813
Table 5. Coefficients value of motor pump [12,13].
CoefficientValueCoefficientValue
α ( h ) α0 = −214.42 Ω ( h ) Ω0 = −152.82
α1 = 108.43Ω1 = 72.369
α2 = −9.9276Ω2 = −6.5469
α3 = 0.2201Ω3 =0.1499
β ( h ) β0 = 470.5 ϕ ( h ) Φ0 = 16.79
β1 = −157.19Φ1 = −2.8140
β2 = 15.038Φ2 = 0.7072
β3 = −0.339Φ3 = −0.0158
Table 6. System optimization results in the first scenario.
Method/ParameterNPVNWSTLCC (M$) p I W   ( % )
EARO570.29550
ARO560.31194.18
PSO460.30784.16
Table 7. p I W sensitivity to the number of PV arrays in the first scenario.
NPV12345
p I W (%)54.1629.1616.664.160
Table 8. System optimization results in the second scenario.
Method/ParameterNPVNWSTLCC (M$) p I W   ( % )
EARO670.29930
ARO660.31574.47
PSO660.31344.23
Table 9. Sensitivity to the number of PV arrays in the second scenario.
NPV123456
p I W (%)83.3345.8329.1620.838.330
Table 10. Results of Scenarios 1 and 2.
Method/ParameterNPVNWSTLCC (M$) p I W   ( % )
Scenario #1570.29550
Scenario #2670.29930
Table 11. Changes in the number of PV arrays relative to water extraction height.
Height (m)51015
NPV567
Table 12. Results of scenarios 1 and 2.
Height (m)51015
NPV777
Table 13. Effect of changes in PV radiation intensity on system optimization.
Irradiance/ParameterNPVNWSTLCC (M$) p I W   ( % )
25% decrease970.33262.67
Nominal670.29930
25% increase570.29220
Table 14. Effect of temperature changes on system optimization.
Temperature/ParameterNPVNWSTLCC (M$) p I W   ( % )
10% decrease670.29930
Nominal670.29930
10% increase670.29930
Table 15. Optimization results from water demand changes.
Water Demand/ParameterNPVNWSTLCC (M$) p I W   ( % )
20% decrease470.29370
Nominal670.29930
20% increase870.32893.4
Table 16. Results of effect of considering replacement cost for Scenarios 1 and 2.
Method/ParameterNPVNWSTLCC (M$) p I W   ( % )
Scenario #1
With replacement cost
570.30730
Scenario #2
With replacement cost
670.31110
Table 17. Comparison of the EARO performance with previous studies.
AlgorithmSystemCWS ($)
EAROPV/Pump/WST0.0841
[29]PV/Pump/Battery0.375
[30]PV/Pump/Diesel0.261
Disclaimer/Publisher’s Note: The statements, opinions and data contained in all publications are solely those of the individual author(s) and contributor(s) and not of MDPI and/or the editor(s). MDPI and/or the editor(s) disclaim responsibility for any injury to people or property resulting from any ideas, methods, instructions or products referred to in the content.

