1. Introduction
Stroke is a medical emergency in which poor blood flow to the brain causes cell death and may result in permanent disability or death if not treated in a timely manner. According to the Australian Bureau of Statistics, stroke was recorded as the underlying cause of 8400 deaths in 2018, accounting for 5.3% of all deaths in Australia [
1]. Apart from identifying the type of stroke, which can be either intracerebral hemorrhage (ICH) or ischemic stroke (IS), a critical task is to retrieve stroke position in order to implement the medical intervention as soon as possible. At present, clinical diagnosis of stroke mainly includes X-ray computed tomography (X-ray CT) and magnetic resonance imaging (MRI). However, both types of devices have poor portability, where the former has ionizing radiation and the latter has high cost and slow diagnosis.
In recent years, the feasibility of microwave radio frequency (RF) detecting brain stroke, breast tumors, and other internal lesions has been studied and demonstrated in many works, as dielectric properties of normal human tissue and diseased tissue vary greatly under microwave frequency [
2,
3,
4,
5,
6]. Relatively, RF technology has not only the advantages of non-ionizing radiation, short scanning time, etc. but also great deployability in mobile clinics or ambulances [
7]. Generally, the RF localization method can be divided into two categories: microwave imaging (MWI) and artificial intelligence (AI). In the MWI method, the antenna array transmits electromagnetic (EM) waves to penetrate the area to be measured and receive scattered signals to reconstruct the dielectric distribution of the area to be measured. A conventional delay and sum (DAS) with coherence weighting is reported to reconstruct hemorrhagic stroke images in a simulated 3D head model [
3]. Another representative example of the MWI method is microwave tomography (MWT) based on the DBIM-TwIST algorithm [
8]. However, the inherent non-linearity and ill-posedness of inverse scattering reconstructing images remain challenging; problems such as artifacts, low resolution, and long reconstructing time prevent their practical use in most clinical and non-clinical situations.
Reliable stroke location with immediate feedback without human visual discrimination is a challenge in the field. The application of AI methods to the classification of stroke subtypes has been explored [
7,
9,
10]. Over the years, AI methods have also been increasingly applied to stroke location prediction and have shown great potential [
9,
10,
11,
12]. Many studies focus on the localization of hemorrhagic stroke and made progress [
9,
11,
12]. For example, a framework for stroke detection on a deep-learned stochastic model was proposed recently, achieving mean and median IoU (intersection over union) of 0.84 and 0.94, respectively [
9]. A few works have validated the localization of ischemic stroke. In 2021, Salucci et al. proposed a Multi-Step Learning-by-Examples Strategy for Real-Time Brain Stroke, where support vector regression (SVR) is used to estimate stroke coordinates [
10]. However, only 25 possible stroke positions are considered in the experiment, and only stroke phantoms of the same size are used in simulation, lacking generality and scalability when applied in real situations. Therefore, the research gap in the development of localization algorithms that are not limited by stroke phantom size, sub-type, and locations is generated.
In this study, a ridge regression–meanshift (RRMS) framework is proposed to localize brain stroke regions using EM signals. Firstly, scatter parameters in 751 frequency points are collected through a 16-port antenna array vector network analysis (VNA). Secondly, multiple ridge regression (RR) predictors are constructed based on the scattering features from EM signals. Based on the predicted distances, the mean shift clustering method (MS) is used to find the densest point clusters, and take the cluster centroid as the center coordinate of the predicted target. The main contributions of this paper are as follows: Firstly, this paper uses experimental data rather than simulated data, covering more than 100 different stroke clot locations for modeling. Secondly, stroke classification is not required in advance in the training phase, but two different stroke subtypes, ICH and IS, and stroke clots of different sizes (20mm and 30mm) are mixed to improve the robustness of the model. Finally, it bypasses traditional image reconstruction, providing the location of the stroke blood clot in a shorter period of time without artifacts and low-resolution interference.
This paper’s structure is organized as follows: The description of the experimental environment and methods are given in
Section 2. Then the experiment procedures are provided in
Section 3;
Section 4 reports representative experiment results to verify the effectiveness of the proposed method. Finally, we summarize our findings and discuss comparisons with existing similar studies, as well as future work, in
Section 5.
2. Experimental Environment
The data used in this experiment were obtained from phantom measurements, the anthropomorphic head model used is EMvision 3B headset, and the vector network analyzer (VNA) used was M9800A.
2.1. Anthropomorphic Brain Stroke Model
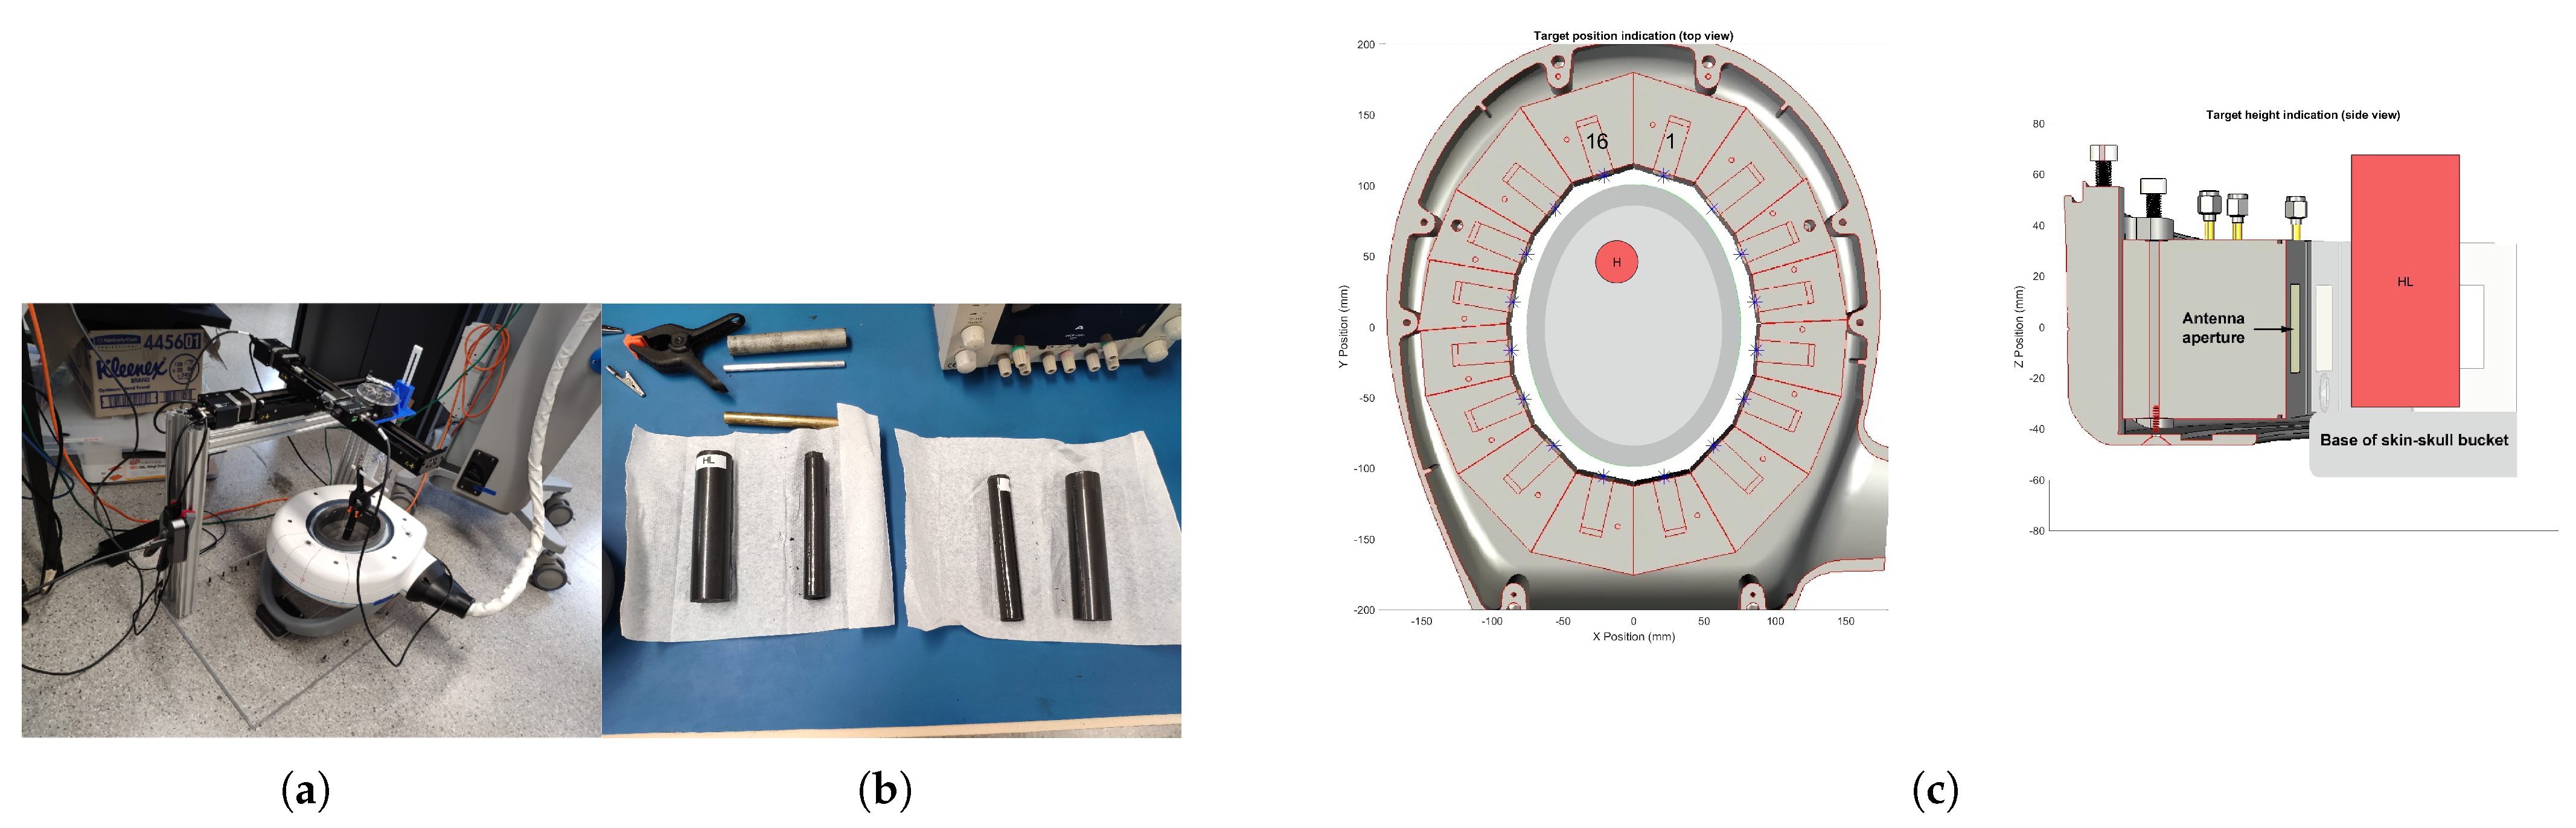
As shown in
Figure 1a, the anthropomorphic head phantom was implemented by a skin–skull bucket (SSB), being filled with the average brain-emulating liquid which was used to mimic the average dielectric measurements of human brain tissue. Additionally, solid emulating cylinders of different sizes and specifications were used to mimic various stroke targets, which provided a more realistic design approach to represent stroke data in real-world situations.
Figure 1b shows the brain stroke targets (phantoms) we used in our experiments, which were coded as HL, HM, IM, and IL from left to right, where H was hemorrhagic and I was ischemic, L referred to large size target and M referred to medium size target. A ground truth example can be seen in
Figure 1c The descriptions and specifications of these stroke phantoms are shown in
Table 1.
2.2. RF Data Collection
All signals were generated and received using the VNA controlled by a laptop. To obtain the data, A 16-antenna array was designed and placed around the SSB. Among them, each antenna was both a transmitter and a receiver. The operating frequency of the antenna array was between 0.5–2 GHz, and a total of 751 frequency points were collected with 2 MHz steps. Therefore, a total of 751 × 16 × 16 scattering parameters (data points) were captured for each case. In microwave RF signals, the dielectric properties of different stroke locations in the head can be reflected in the scattering parameters. Therefore, the scattering parameter matrix was collected in each movement and stored as a Touchstone format file by moving these targets along an 8 mm spaced grid pattern in X-coordinate and Y-coordinate.
2.3. Methodology
In this study, a novel two-stage stroke localization method is proposed that eschews traditional electromagnetic imaging methods.
Ridge regression (RR) is a biased estimation regression method proposed by Hoerl and Kennard [
13], dedicated to linear data analysis. RR is essentially an improved least-squares estimation method. It prevents parameter overfitting by adding L2 regularization terms to standard linear regression. Assuming that dataset D has
N samples,
, where
is the
ith input variable (dimension =
p). The solution of the ridge regression coefficients depends on the optimization:
where
is defined as the corresponding distance between the stroke target from antenna port
i.
here refers to power transferred from other ports to port
i when
i is matched.
and
are parameters determined during learning process, where
is the coefficient term and
is the regression error term. The penalty function of the L2-norm is represented by
, where
is the penalty coefficient, determined by grid search in the experiment.
2.4. MeanShift Clustering
MeanShift(MS) is a density-based nonparametric clustering algorithm, proposed by Comaniciu and Meer [
14]. MS works by setting a kernel function to estimate the density of the samples. In this study, it is used to find the final centroid. Suppose there is a dataset with
n samples and
d dimensions defined as
, then the bandwidth parameter
h can be automatically estimated using
cluster.estimate_bandwidth in
sklearn package in python. The kernel density function is estimated as:
The effect of clustering varies with bandwidth value
h. The radially symmetric kernel is defined as:
where
represents normalization constant which assures
integrates to 1. The goal of MS is to move the sample points in the direction of the local density increase, and the gradient is the direction in which the function increases the fastest.
3. Experimental Procedures
This experiment is mainly divided into three steps: data preprocessing, feature selection, and ridge regression–mean shift (RRMS) localization.
3.1. Data Preprocessing
In the experiment, four types of HL, HM, IM, and IL targets are mixed together to improve the generality and scalability of this framework and are divided into the training set and test set according to the ratio of 7:3.
Table 2 shows the specifications of the training and test sets.
Before analyzing the scattered signal, according to the fact that most machine learning models do not support complex-number input, all experiments mentioned in this article extract the gain ratio(dB) of the original signal as features, where the gain ratio represents the power loss and gain ratio of antennas.
3.2. Feature Selection
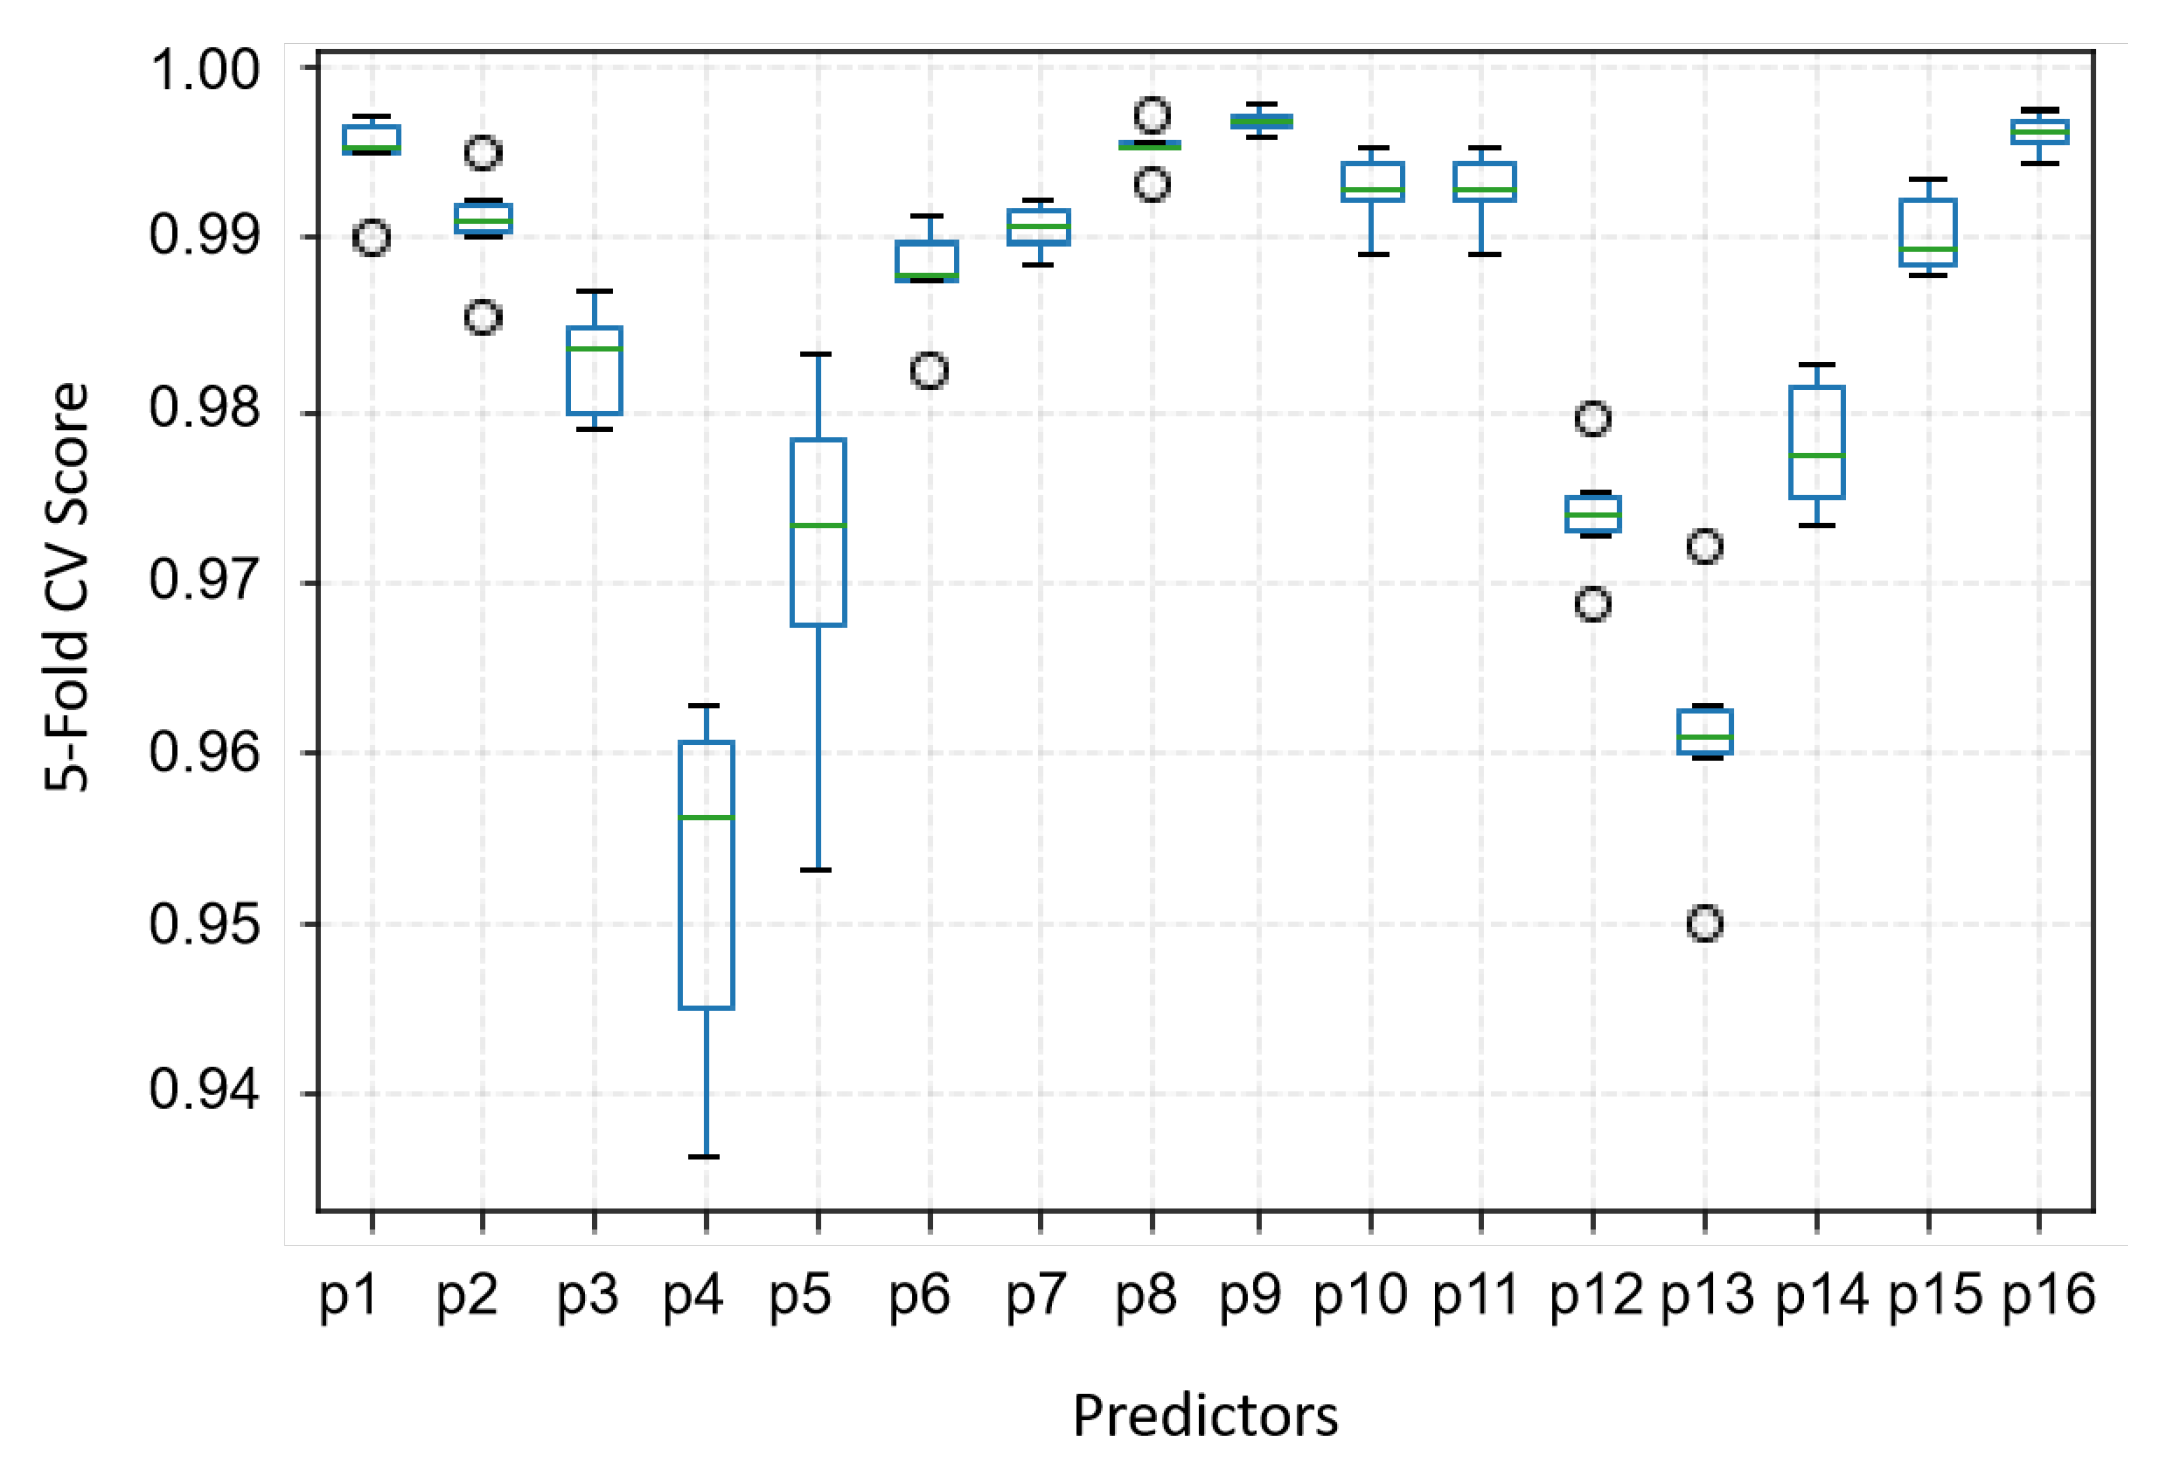
Electromagnetic signals are a relatively sophisticated ultra-high-dimensional dataset. For each stroke data, there are S-parameter features. There may be a large number of irrelevant or redundant features in the dataset, and too many features may lead to problems such as model over-fitting and long running time.
Therefore, the s parameters corresponding to each antenna port are extracted separately before training. Afterward, the variance filtering method is used for feature selection. The frequency points with a variance less than the threshold mean the divergence of these features is too weak. Thus, the frequency points with low divergence and low correlation can be filtered out. The results of the five-fold cross-validation after feature selection are given in the next section.
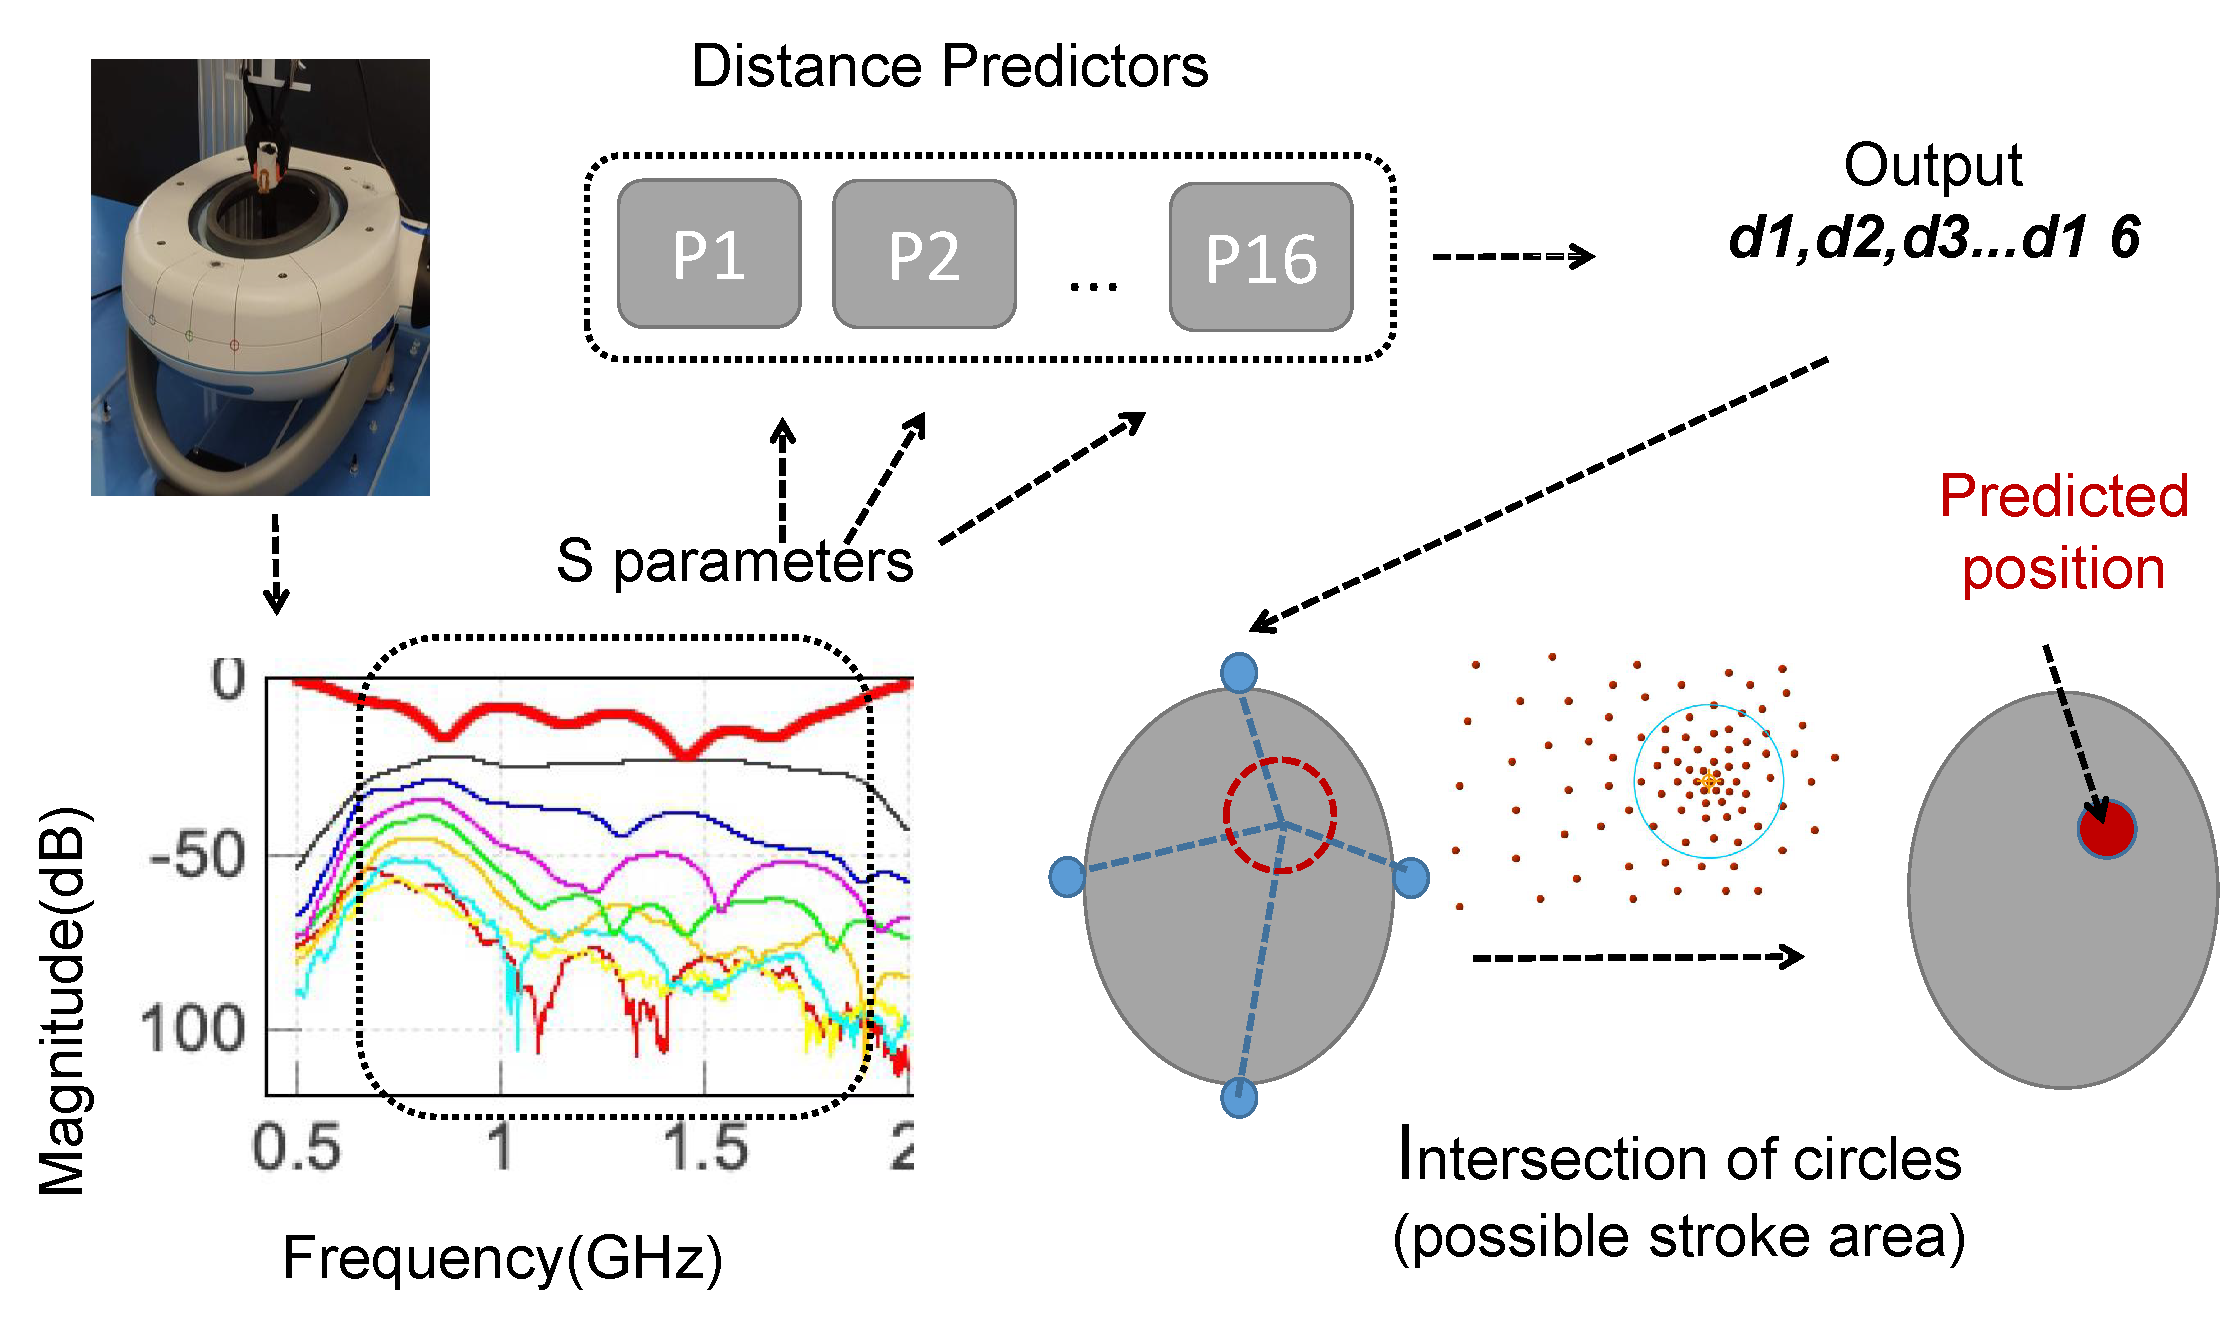
3.3. RRMS Based Localization
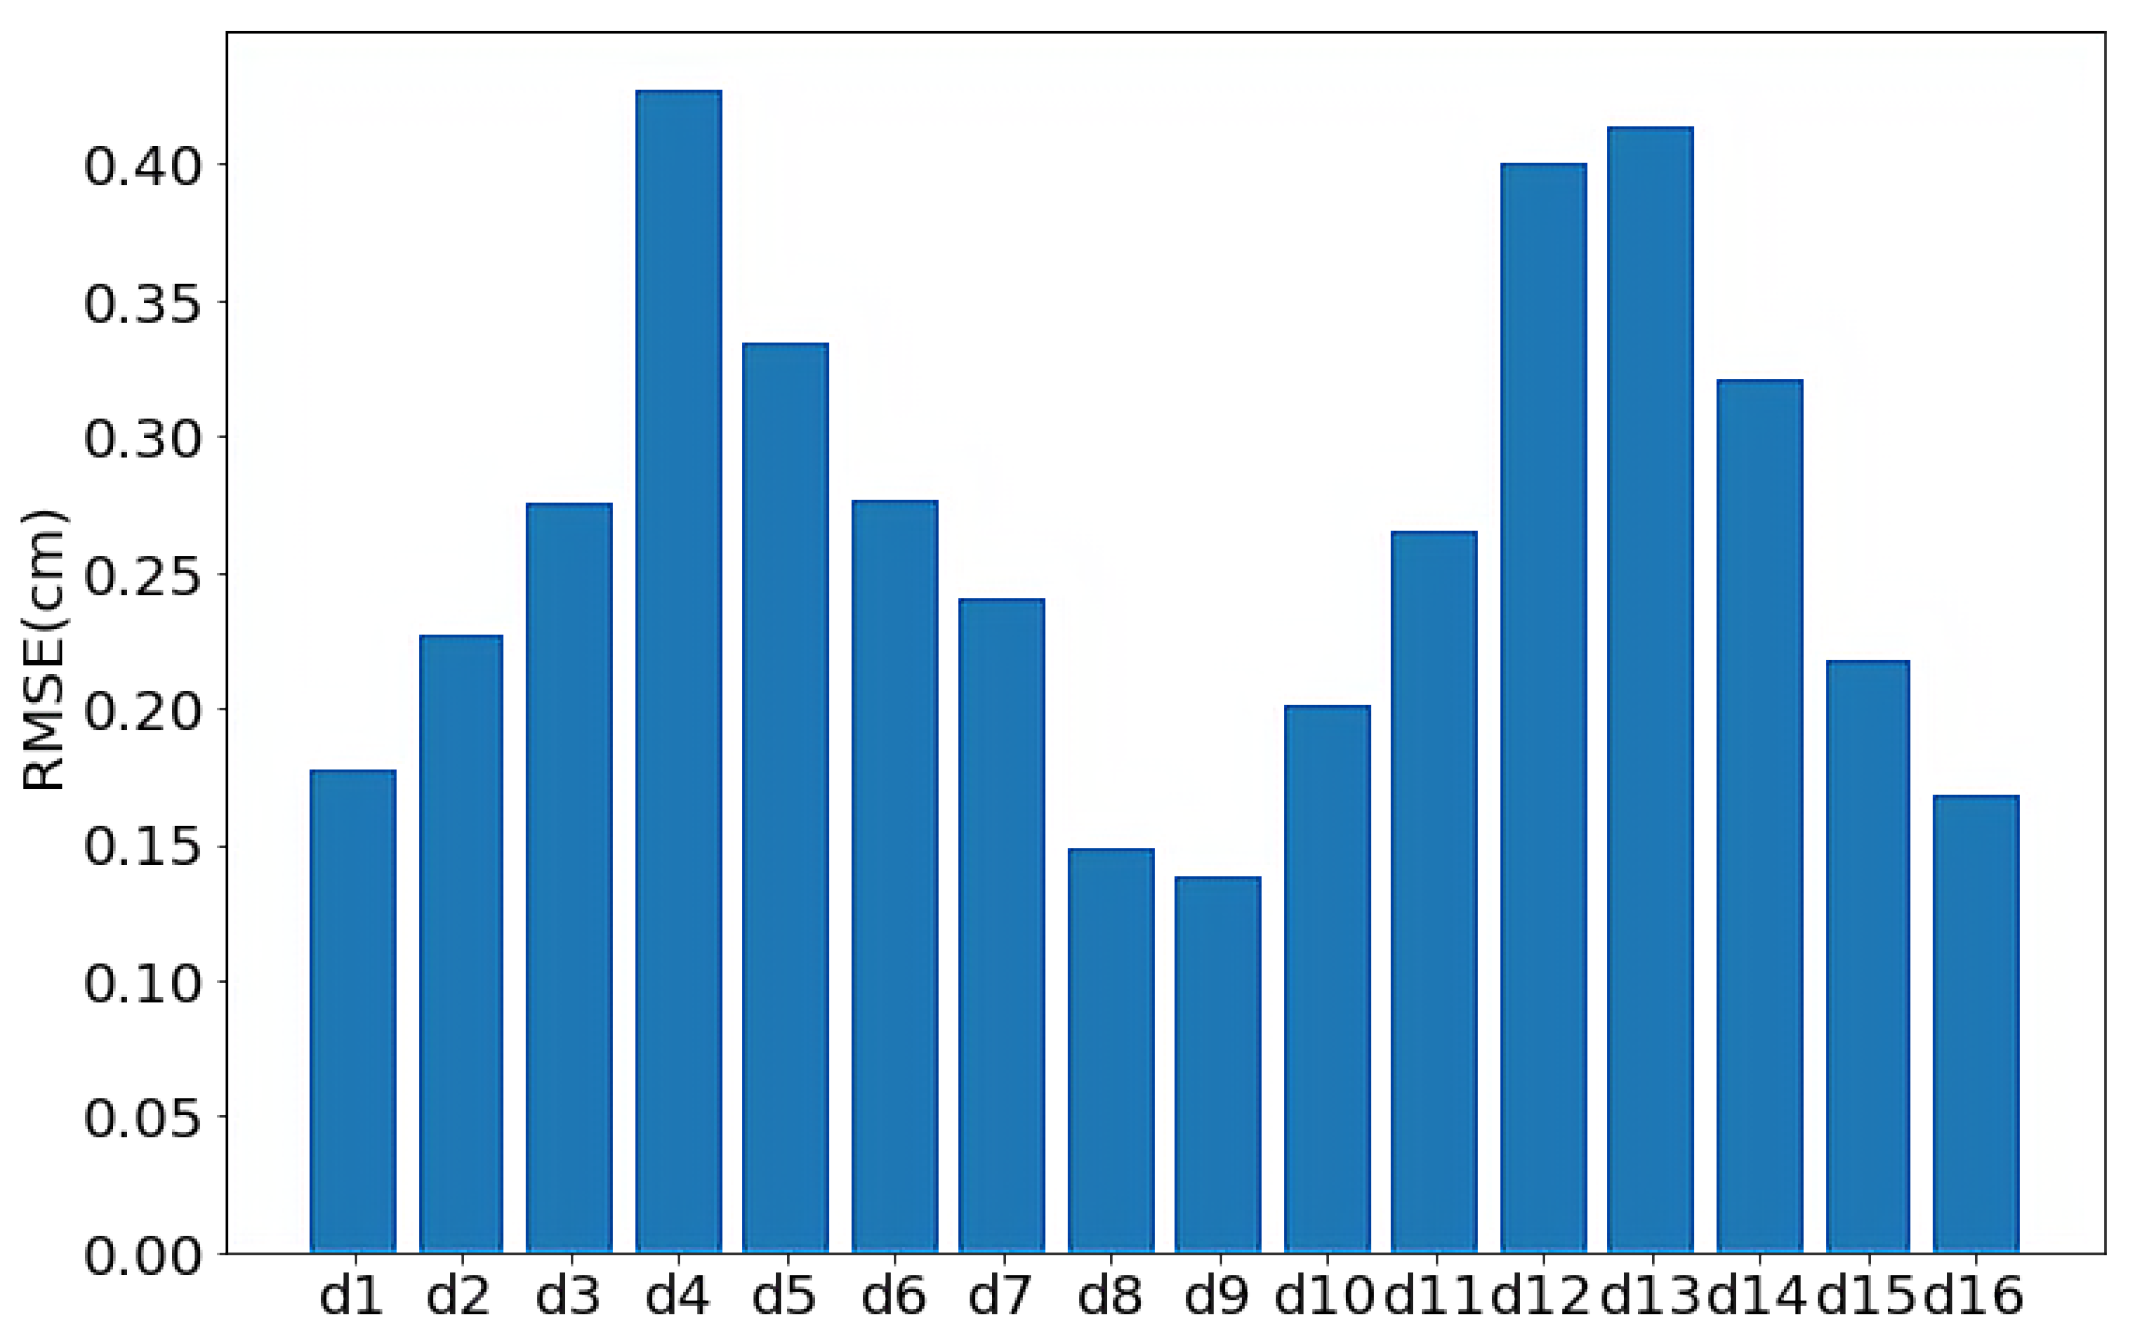
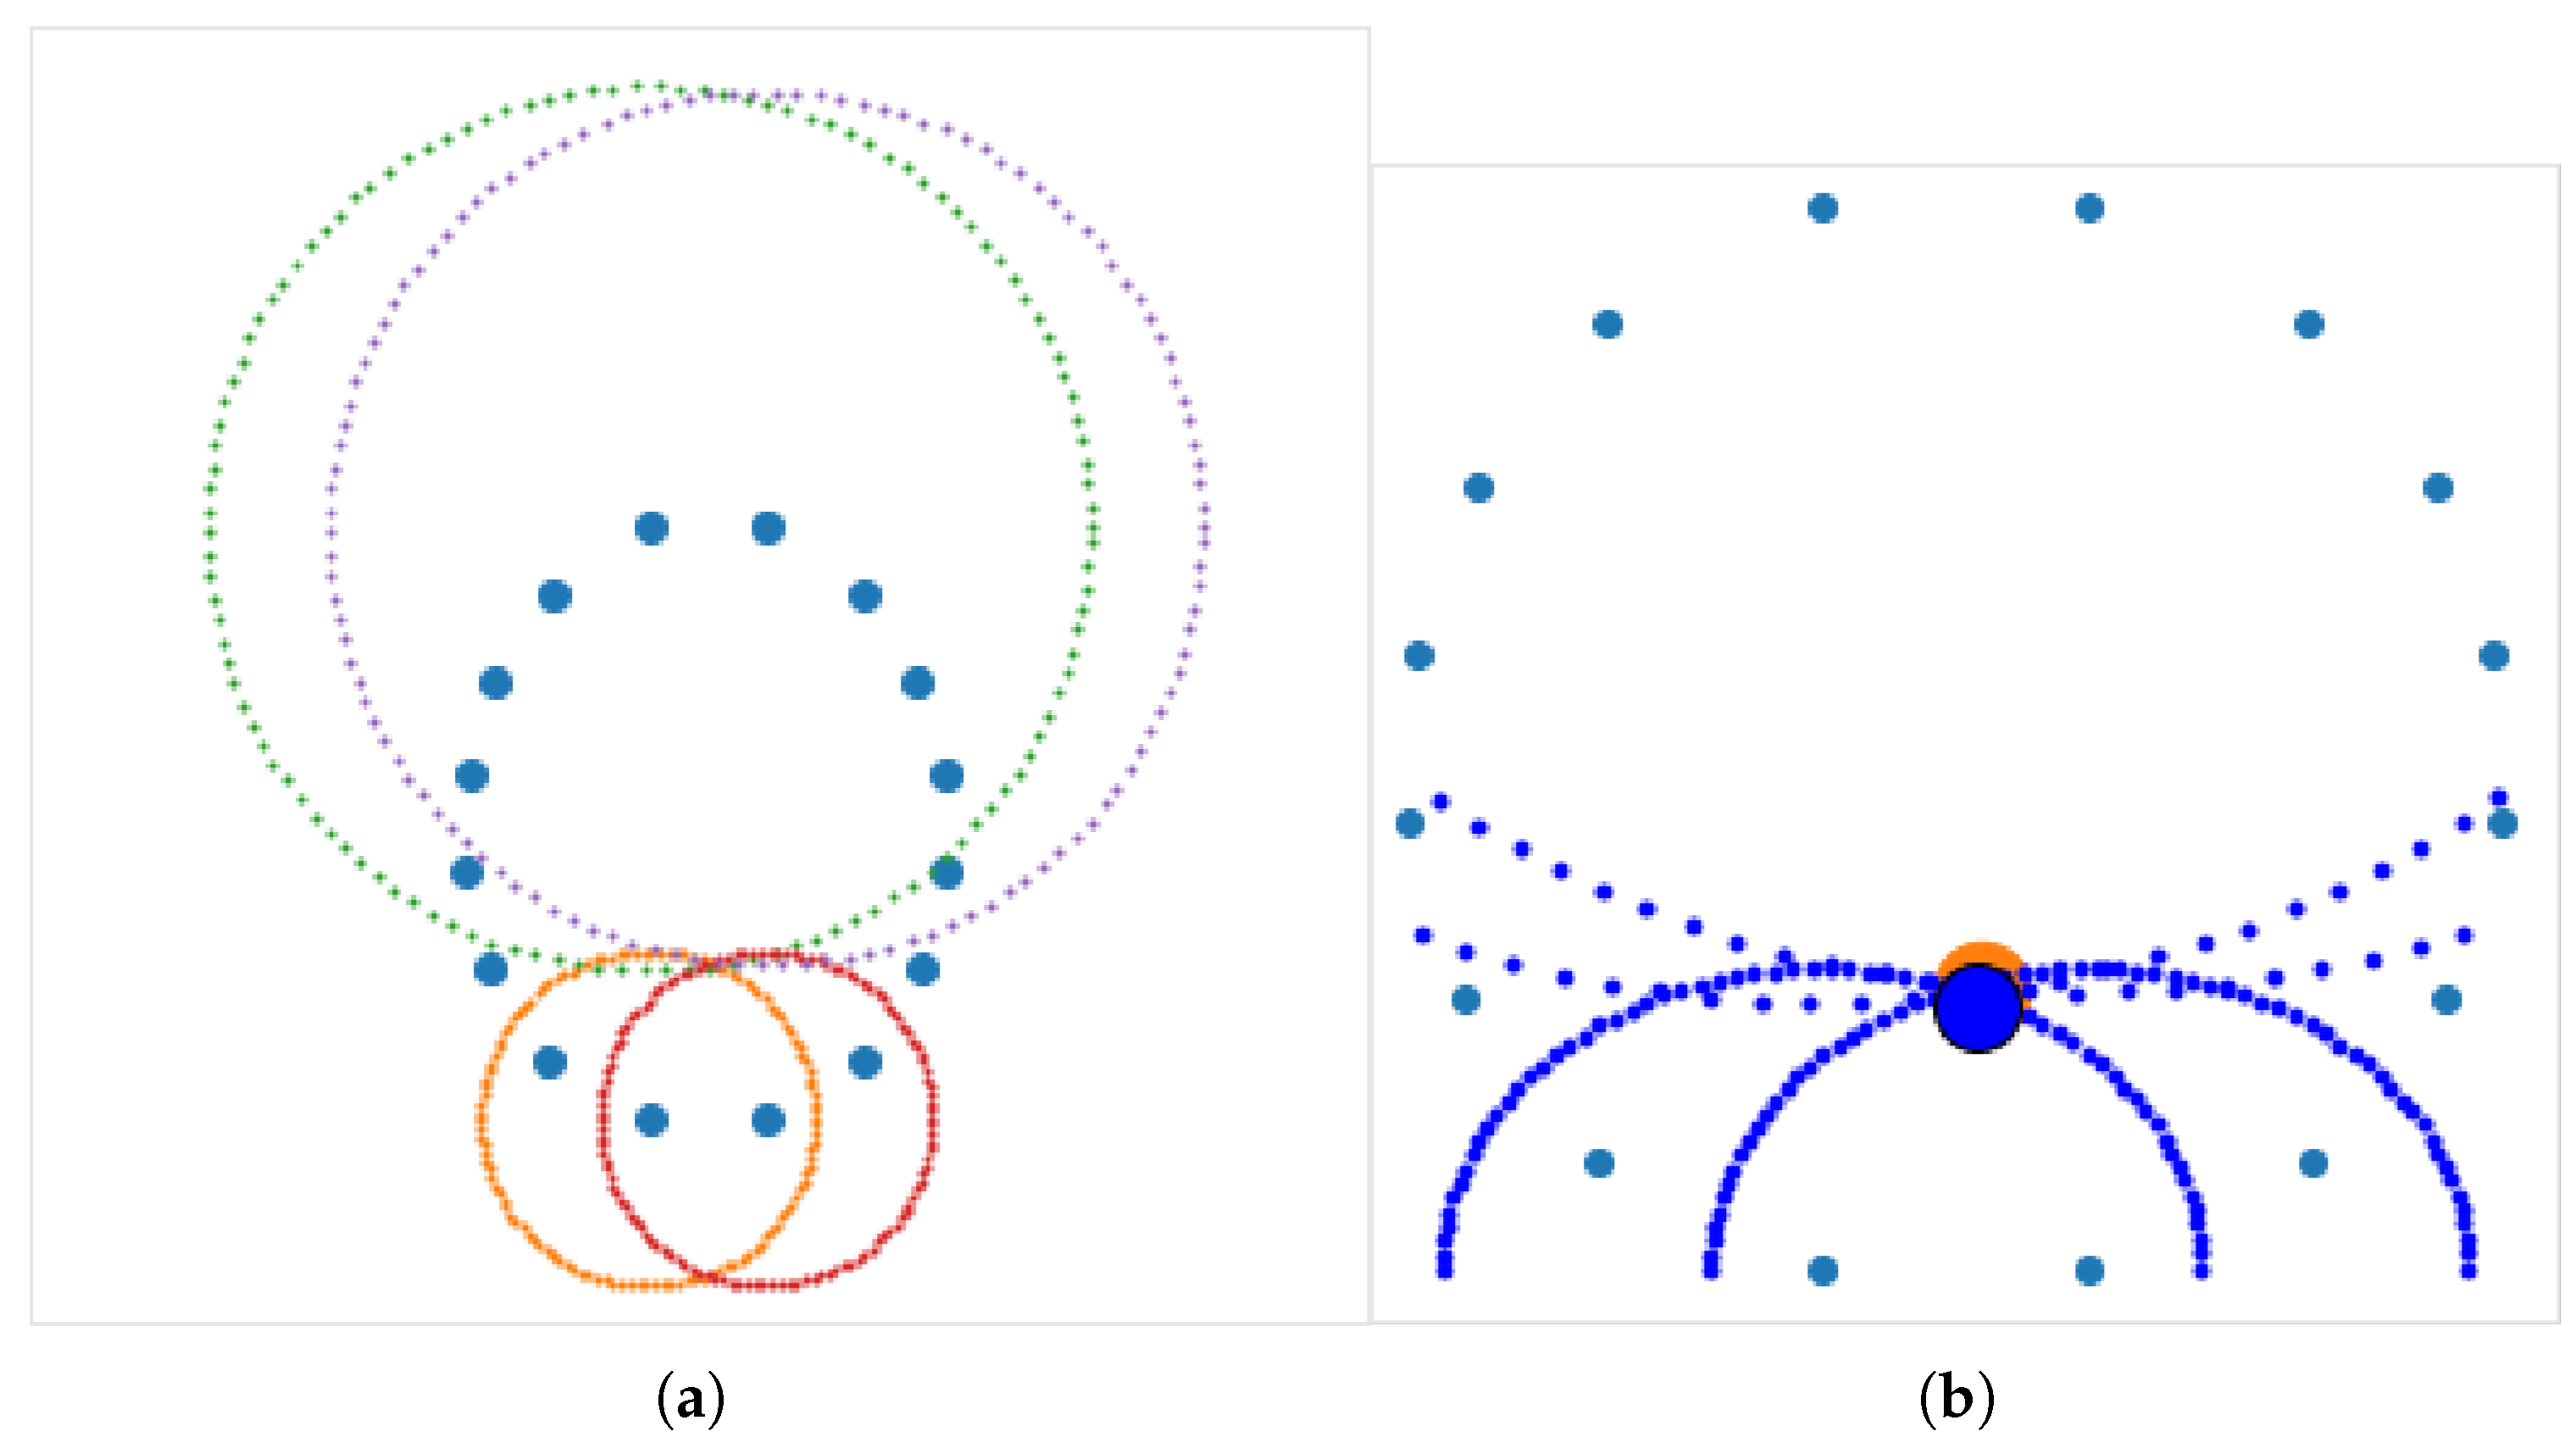
This section presents a two-phase stroke localization method by combining ridge regression (RR) and meanshift clustering (MS) Specifically, RR is used to predict the distance between each antenna and the target in the modeling phase. For each antenna
i, a predictor is built separately. The RR parameter alpha is found through grid search on the training set to find the best parameters. For all predictors, the distances from the target to each antenna are obtained after training, denoted as
,
,
,
…,
. In the localization phase, circular trajectories can be simulated with the center of the antenna
i and the radius of
. MS is used to find the densest trajectories within the target area, which is the predicted target position.
Figure 2 shows the process of the experiment.
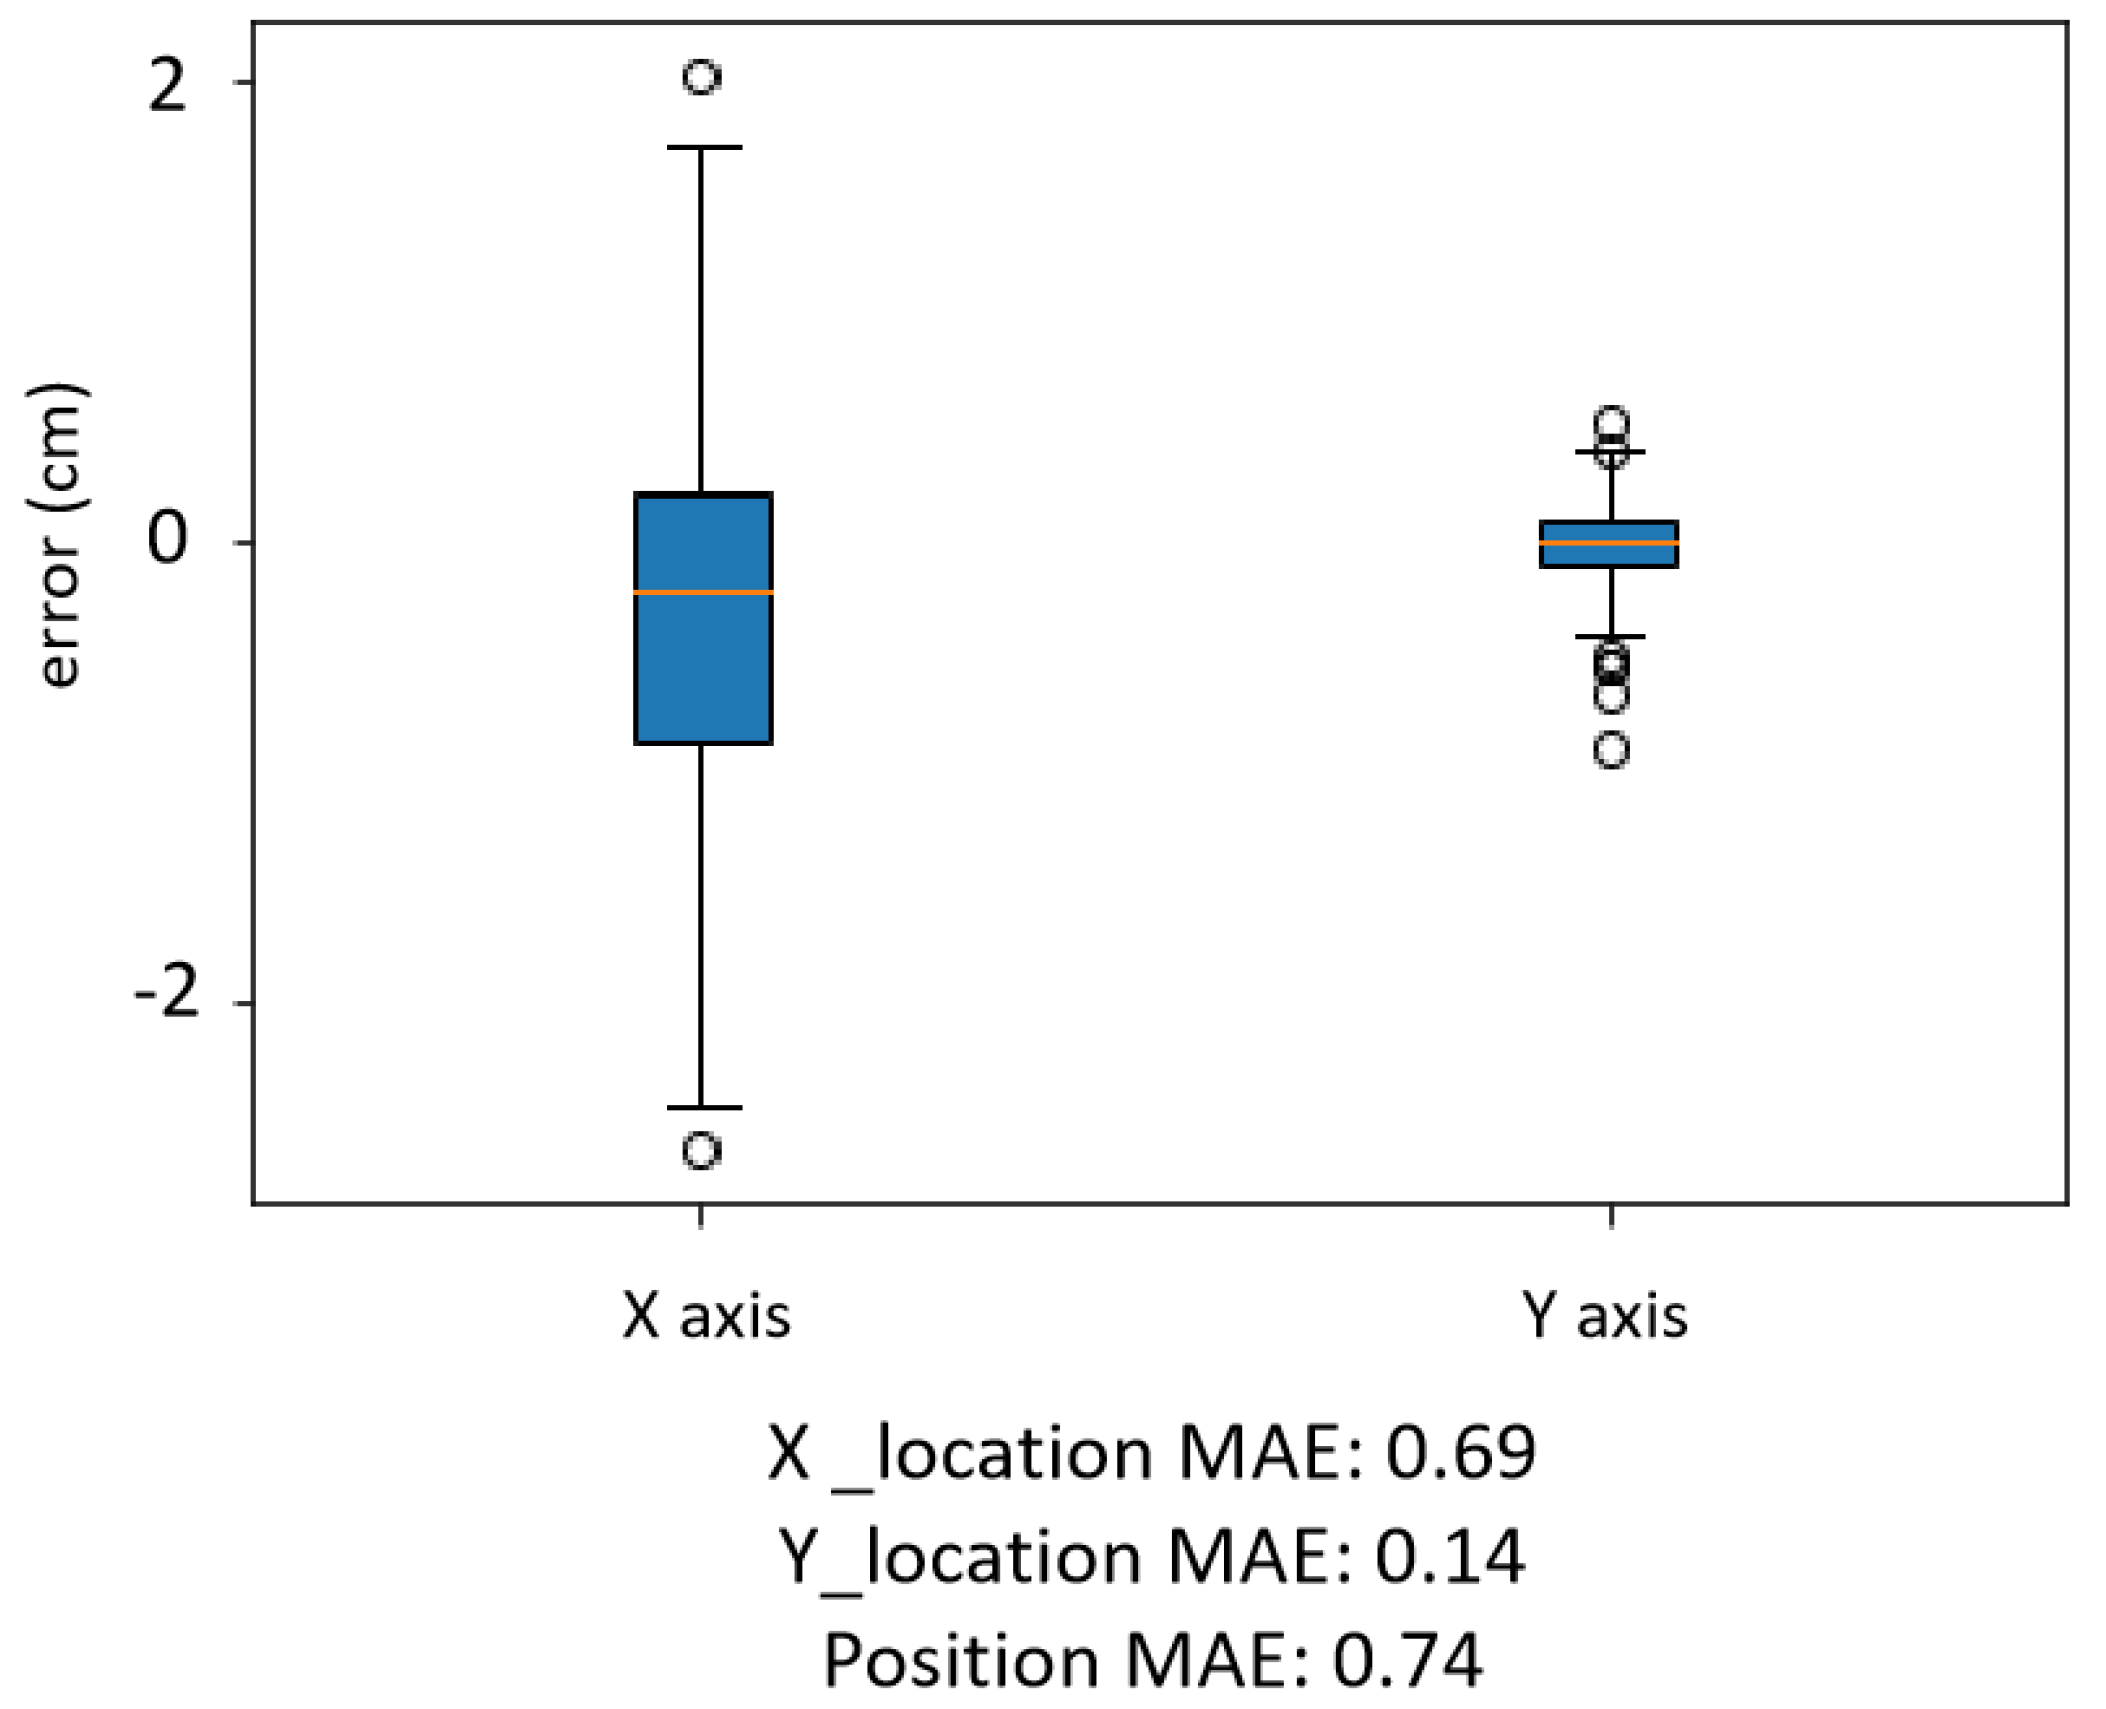
5. Discussion
This work has presented a preliminary experimental evaluation of stroke localization based on the RRMS framework. The system utilizes S-parameters collected within a wide frequency range of 0.5 GHz-2 GHz, and the learning process of stroke location is independent of stroke subtype classification results and stroke phantom size. Specifically, stroke prediction results can be fed back in a short time without prior information. In addition, the microwave facility itself has the advantages of low hardware cost and good portability, which indicate that it is suitable for deployment in mobile clinics, or as a decision-support tool for rapid intervention and treatment in underdeveloped areas.
A comparison of similar studies localizing brain stroke based on EM signals is presented in
Table 3. Wu et al. [
11] convert it to classification by using the interconnection point of two lines that pass the stroke. Similarly, Zhu et al. [
12] use geometric methods to localize ICH stroke which causes an asymmetric response to electromagnetic signals, based on the assumption that the healthy brain is approximately symmetric. In contrast, the proposed method can also be used to localize IS stroke while achieving higher prediction accuracy.
Tobon Vasquez et al. [
15] use the captured scatter signal through a linear imaging algorithm to reconstruct stroke position and size, which is a conventional microwave technique to detect lesions (e.g., stroke, breast cancer). In fact, there is no reliable reconstruction method that can generate high-quality images so far. This is because the electromagnetic inverse scattering problem is ill-conditioned, nonlinear, and multimodal, i.e., it can have multiple local minima during iterative optimization. In addition to this, the localization of stroke should be obtained after image segmentation or dependent on the visual detection of experts. Conversely, the proposed method can directly obtain stroke position in the Cartesian coordinate system, bypassing image reconstruction and other medical procedures that may be required.
It is worth noting that the results reported in this experiment are based on the four highest-scoring predictors of port-0, port-7, port-8, and port-1. This part of future work will further improve localization performance by including all 16 predictors. In addition, the antenna array used in the experiment was placed at the same height as the stroke target during data collection. We are currently exploring a 3D realistic experimental process, that is, introducing Z coordinates to observe whether the change of the scattering data affects this algorithm by changing the height of the stroke phantoms.


