
Evaluating Bank Efficiency in the West Balkan Countries Using Data Envelopment Analysis
 , , , and
Abstract
:1. Introduction
2. Literature Review
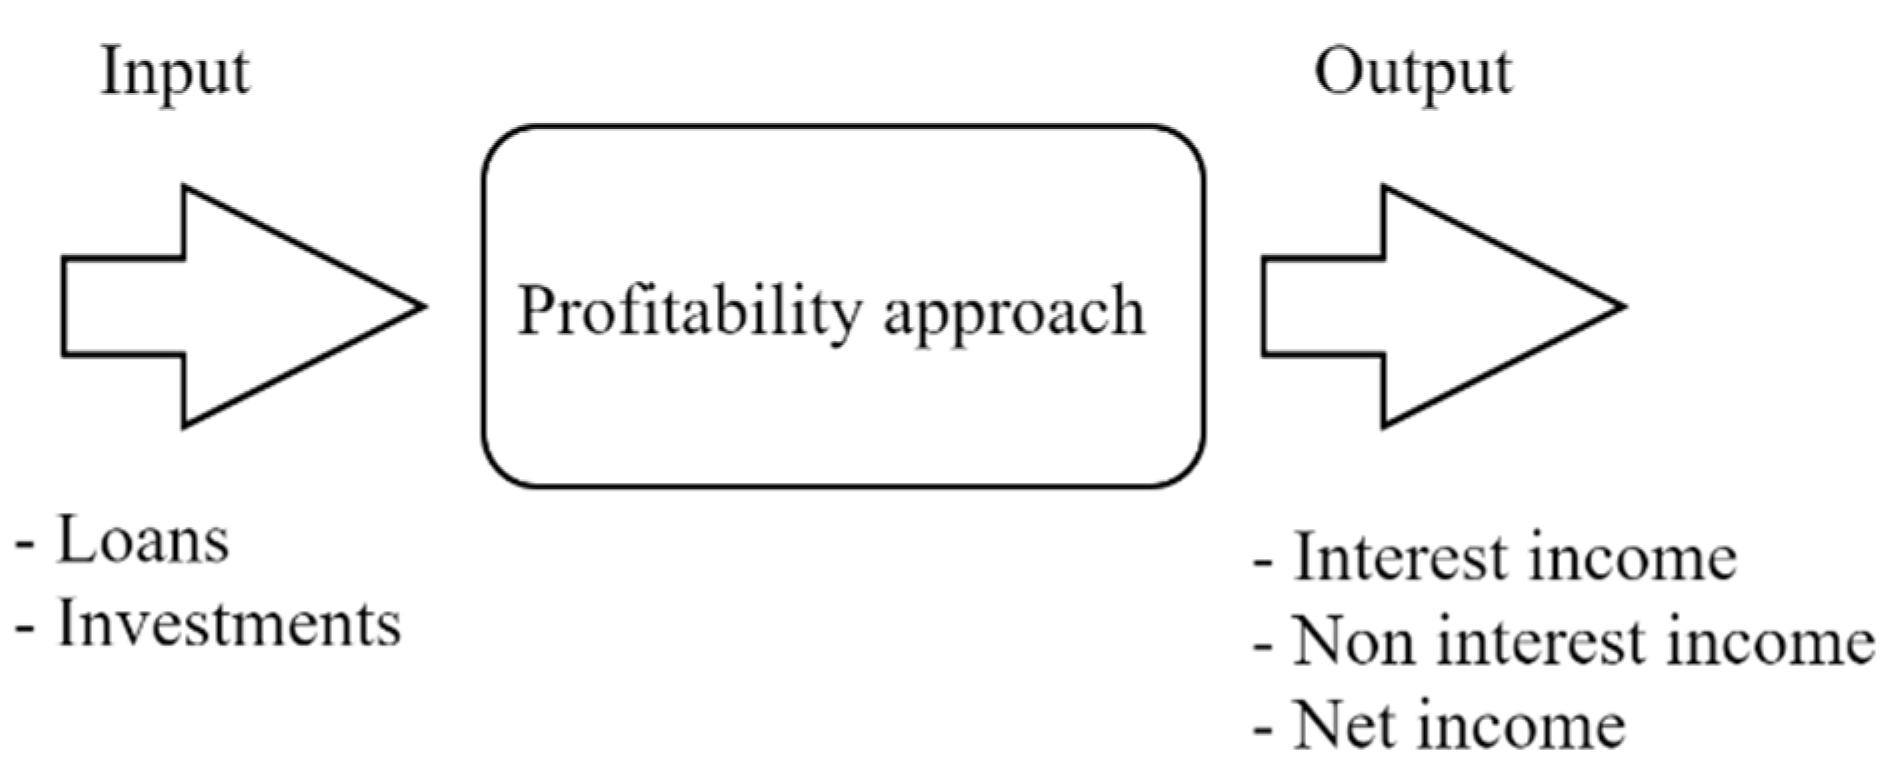
3. Methodology and Data
4. Results and Discussion
5. Concluding Remarks
Author Contributions
Funding
Conflicts of Interest
Appendix A

| 2015 | 2016 | 2017 | 2018 | 2019 | |||||
|---|---|---|---|---|---|---|---|---|---|
| DMU | Score | DMU | Score | DMU | Score | DMU | Score | DMU | Score |
| Albania1 | 1.00 | Albania1 | 0.80 | Albania1 | 0.69 | Albania1 | 0.41 | Albania1 | 0.41 |
| Albania2 | 1.00 | Albania2 | 1.00 | Albania2 | 1.00 | Albania2 | 0.85 | Albania2 | 0.91 |
| Albania3 | 1.00 | Albania3 | 1.00 | Albania3 | 1.00 | Albania3 | 0.78 | Albania3 | 0.69 |
| Albania4 | 1.00 | Albania4 | 1.00 | Albania4 | 1.00 | Albania4 | 1.00 | Albania4 | 1.00 |
| Albania5 | 1.00 | Albania5 | 0.80 | Albania5 | 0.75 | Albania5 | 0.64 | Albania5 | 0.63 |
| Albania6 | 1.00 | Albania6 | 1.00 | Albania6 | 1.00 | Albania6 | 1.00 | Albania6 | 1.00 |
| Albania7 | 0.91 | Albania7 | 0.88 | Albania7 | 0.81 | Albania7 | 0.55 | Albania7 | 0.63 |
| Albania8 | 1.00 | Albania8 | 1.00 | Albania8 | 1.00 | Albania8 | 1.00 | Albania8 | 0.59 |
| Albania9 | 1.00 | Albania9 | 1.00 | Albania9 | 1.00 | Albania9 | 1.00 | Albania9 | 0.74 |
| Albania10 | 0.75 | Albania10 | 0.56 | Albania10 | 0.53 | Albania10 | 0.81 | Albania10 | 0.64 |
| Albania11 | 1.00 | Albania11 | 0.60 | Albania11 | 0.58 | Albania11 | 1.00 | Albania11 | 1.00 |
| Albania12 | 1.00 | Albania12 | 1.00 | Albania12 | 1.00 | Albania12 | 1.00 | Albania12 | 1.00 |
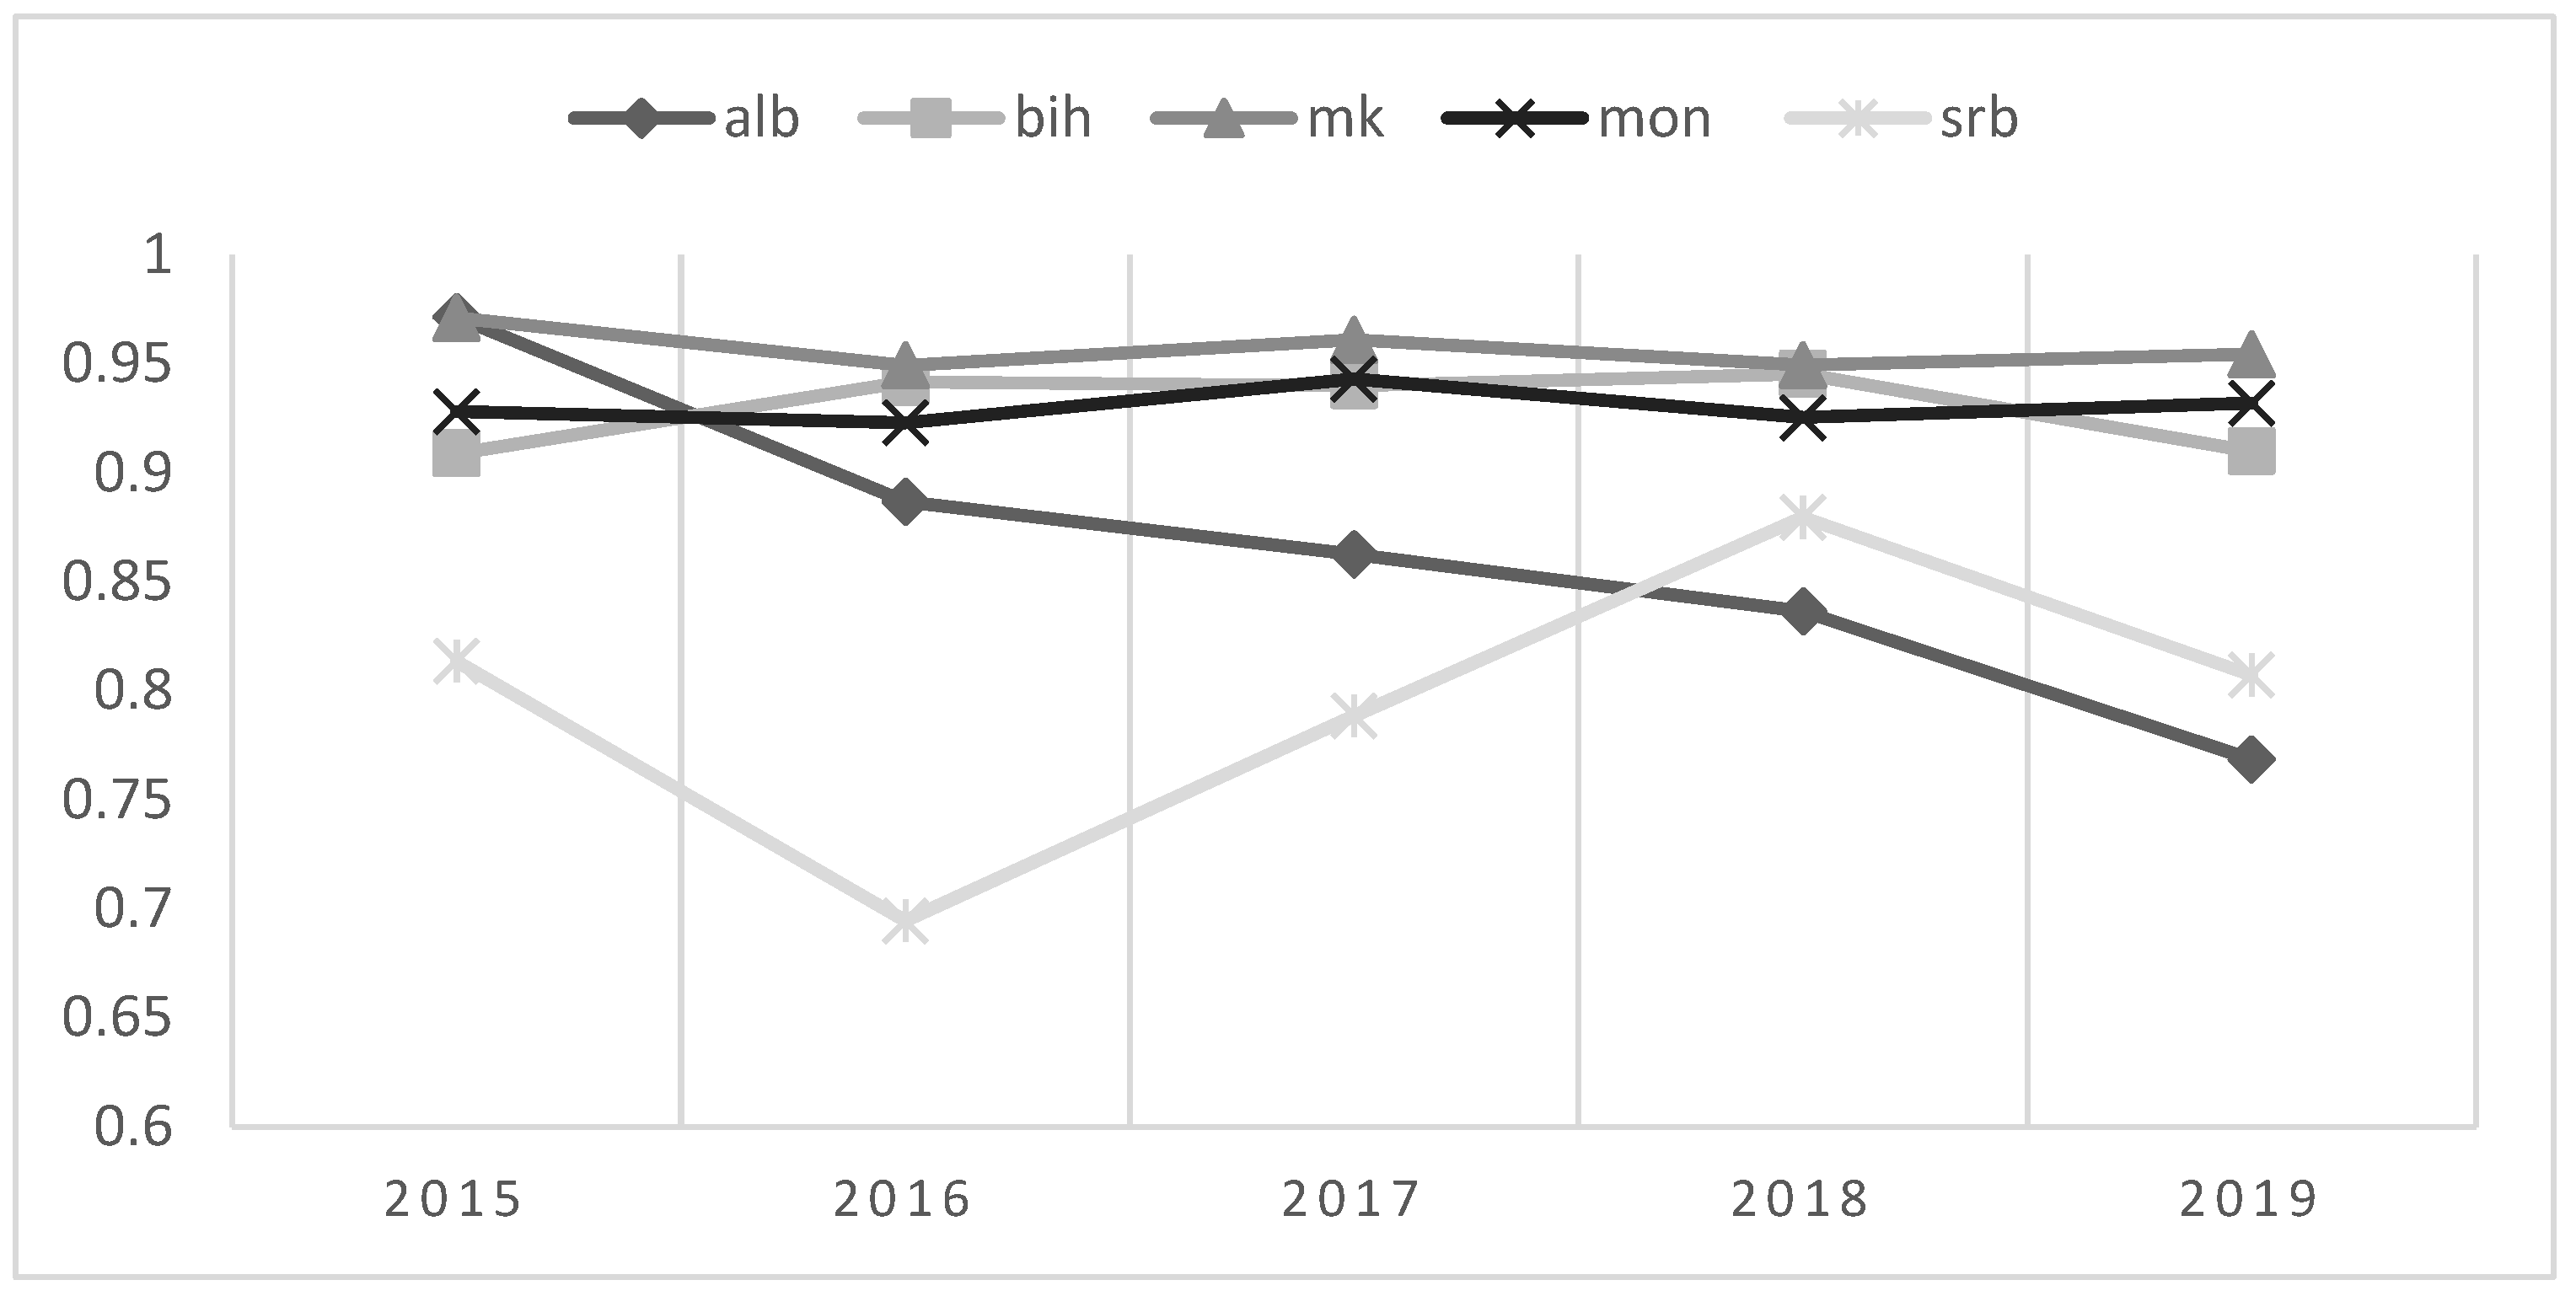
| Average | 0.97 | 0.89 | 0.86 | 0.84 | 0.77 | ||||
| Bosnia & Herzegovina1 | 1.00 | Bosnia & Herzegovina1 | 1.00 | Bosnia & Herzegovina1 | 0.94 | Bosnia & Herzegovina1 | 0.97 | Bosnia & Herzegovina1 | 0.97 |
| Bosnia & Herzegovina2 | 0.92 | Bosnia & Herzegovina2 | 0.74 | Bosnia & Herzegovina2 | 0.89 | Bosnia & Herzegovina2 | 0.89 | Bosnia & Herzegovina2 | 0.86 |
| Bosnia & Herzegovina3 | 1.00 | Bosnia & Herzegovina3 | 1.00 | Bosnia & Herzegovina3 | 1.00 | Bosnia & Herzegovina3 | 0.84 | Bosnia & Herzegovina3 | 1.00 |
| Bosnia & Herzegovina4 | 0.93 | Bosnia & Herzegovina4 | 0.92 | Bosnia & Herzegovina4 | 0.94 | Bosnia & Herzegovina4 | 1.00 | Bosnia & Herzegovina4 | 1.00 |
| Bosnia & Herzegovina5 | 1.00 | Bosnia & Herzegovina5 | 1.00 | Bosnia & Herzegovina5 | 1.00 | Bosnia & Herzegovina5 | 1.00 | Bosnia & Herzegovina5 | 1.00 |
| Bosnia & Herzegovina6 | 0.87 | Bosnia & Herzegovina6 | 0.96 | Bosnia & Herzegovina6 | 0.99 | Bosnia & Herzegovina6 | 0.90 | Bosnia & Herzegovina6 | 0.96 |
| Bosnia & Herzegovina7 | 1.00 | Bosnia & Herzegovina7 | 1.00 | Bosnia & Herzegovina7 | 0.86 | Bosnia & Herzegovina7 | 1.00 | Bosnia & Herzegovina7 | 0.83 |
| Bosnia & Herzegovina8 | 1.00 | Bosnia & Herzegovina8 | 1.00 | Bosnia & Herzegovina8 | 1.00 | Bosnia & Herzegovina8 | 1.00 | Bosnia & Herzegovina8 | 0.89 |
| Bosnia & Herzegovina9 | 1.00 | Bosnia & Herzegovina9 | 1.00 | Bosnia & Herzegovina9 | 1.00 | Bosnia & Herzegovina9 | 1.00 | Bosnia & Herzegovina9 | 1.00 |
| Bosnia & Herzegovina10 | 0.61 | Bosnia & Herzegovina10 | 0.78 | Bosnia & Herzegovina10 | 0.67 | Bosnia & Herzegovina10 | 0.77 | Bosnia & Herzegovina10 | 0.61 |
| Bosnia & Herzegovina11 | 1.00 | Bosnia & Herzegovina11 | 1.00 | Bosnia & Herzegovina11 | 1.00 | Bosnia & Herzegovina11 | 1.00 | Bosnia & Herzegovina11 | 1.00 |
| Bosnia & Herzegovina12 | 0.89 | Bosnia & Herzegovina12 | 0.95 | Bosnia & Herzegovina12 | 0.97 | Bosnia & Herzegovina12 | 0.96 | Bosnia & Herzegovina12 | 0.92 |
| Bosnia & Herzegovina13 | 1.00 | Bosnia & Herzegovina13 | 1.00 | Bosnia & Herzegovina13 | 1.00 | Bosnia & Herzegovina13 | 1.00 | Bosnia & Herzegovina13 | 1.00 |
| Bosnia & Herzegovina14 | 0.86 | Bosnia & Herzegovina14 | 1.00 | Bosnia & Herzegovina14 | 0.90 | Bosnia & Herzegovina14 | 0.85 | Bosnia & Herzegovina14 | 0.69 |
| Bosnia & Herzegovina15 | 0.80 | Bosnia & Herzegovina15 | 0.93 | Bosnia & Herzegovina15 | 1.00 | Bosnia & Herzegovina15 | 1.00 | Bosnia & Herzegovina15 | 1.00 |
| Bosnia & Herzegovina16 | 0.66 | Bosnia & Herzegovina16 | 0.80 | Bosnia & Herzegovina16 | 0.88 | Bosnia & Herzegovina16 | 0.94 | Bosnia & Herzegovina16 | 0.83 |
| Average | 0.91 | 0.94 | 0.94 | 0.95 | 0.91 | ||||
| North Macedonia1 | 1.00 | North Macedonia1 | 0.95 | North Macedonia1 | 1.00 | North Macedonia1 | 1.00 | North Macedonia1 | 1.00 |
| North Macedonia2 | 0.90 | North Macedonia2 | 0.92 | North Macedonia2 | 0.83 | North Macedonia2 | 0.80 | North Macedonia2 | 0.83 |
| North Macedonia3 | 0.97 | North Macedonia3 | 0.88 | North Macedonia3 | 0.87 | North Macedonia3 | 0.76 | North Macedonia3 | 0.82 |
| North Macedonia4 | 1.00 | North Macedonia4 | 1.00 | North Macedonia4 | 1.00 | North Macedonia4 | 1.00 | North Macedonia4 | 1.00 |
| North Macedonia5 | 1.00 | North Macedonia5 | 1.00 | North Macedonia5 | 1.00 | North Macedonia5 | 1.00 | North Macedonia5 | 1.00 |
| North Macedonia6 | 1.00 | North Macedonia6 | 0.68 | North Macedonia6 | 1.00 | North Macedonia6 | 1.00 | North Macedonia6 | 1.00 |
| North Macedonia7 | 1.00 | North Macedonia7 | 1.00 | North Macedonia7 | 1.00 | North Macedonia7 | 1.00 | North Macedonia7 | 1.00 |
| North Macedonia8 | 1.00 | North Macedonia8 | 1.00 | North Macedonia8 | 1.00 | North Macedonia8 | 1.00 | North Macedonia8 | 1.00 |
| North Macedonia9 | 1.00 | North Macedonia9 | 1.00 | North Macedonia9 | 0.79 | North Macedonia9 | 0.78 | North Macedonia9 | 0.81 |
| North Macedonia10 | 0.76 | North Macedonia10 | 0.91 | North Macedonia10 | 1.00 | North Macedonia10 | 1.00 | North Macedonia10 | 1.00 |
| North Macedonia11 | 1.00 | North Macedonia11 | 1.00 | North Macedonia11 | 1.00 | North Macedonia11 | 1.00 | North Macedonia11 | 1.00 |
| North Macedonia12 | 1.00 | North Macedonia12 | 1.00 | North Macedonia12 | 1.00 | North Macedonia12 | 1.00 | North Macedonia13 | 1.00 |
| North Macedonia13 | 1.00 | North Macedonia13 | 1.00 | North Macedonia13 | 1.00 | North Macedonia13 | 1.00 | ||
| Average | 0.97 | 0.95 | 0.96 | 0.95 | 0.95 | ||||
| Montenegro1 | 1.00 | Montenegro1 | 1.00 | Montenegro1 | 1.00 | Montenegro1 | 1.00 | Montenegro1 | 1.00 |
| Montenegro2 | 0.98 | Montenegro2 | 1.00 | Montenegro2 | 1.00 | Montenegro2 | 1.00 | Montenegro2 | 1.00 |
| Montenegro3 | 0.77 | Montenegro3 | 1.00 | Montenegro3 | 0.91 | Montenegro3 | 1.00 | Montenegro3 | 0.82 |
| Montenegro4 | 1.00 | Montenegro4 | 1.00 | Montenegro4 | 1.00 | Montenegro4 | 1.00 | Montenegro4 | 1.00 |
| Montenegro5 | 0.91 | Montenegro5 | 0.91 | Montenegro5 | 1.00 | Montenegro5 | 1.00 | Montenegro5 | 0.97 |
| Montenegro6 | 0.88 | Montenegro6 | 0.84 | Montenegro6 | 0.86 | Montenegro6 | 0.61 | Montenegro6 | 0.72 |
| Montenegro7 | 1.00 | Montenegro7 | 0.91 | Montenegro7 | 1.00 | Montenegro7 | 1.00 | Montenegro7 | 1.00 |
| Montenegro8 | 1.00 | Montenegro8 | 0.42 | Montenegro8 | 0.58 | Montenegro8 | 0.57 | Montenegro8 | 1.00 |
| Montenegro9 | 0.67 | Montenegro9 | 1.00 | Montenegro9 | 0.96 | Montenegro9 | 0.92 | Montenegro9 | 0.94 |
| Montenegro10 | 1.00 | Montenegro10 | 1.00 | Montenegro10 | 1.00 | Montenegro10 | 1.00 | Montenegro10 | 0.74 |
| Montenegro11 | 1.00 | Montenegro11 | 1.00 | Montenegro11 | 1.00 | Montenegro11 | 1.00 | Montenegro11 | 1.00 |
| Montenegro12 | 1.00 | Montenegro12 | 1.00 | Montenegro12 | 1.00 | Montenegro12 | 1.00 | ||
| Average | 0.93 | 0.92 | 0.94 | 0.93 | 0.93 | ||||
| Serbia1 | 0.42 | Serbia1 | 0.46 | Serbia1 | 0.26 | Serbia1 | 0.57 | Serbia1 | 1.00 |
| Serbia2 | 0.51 | Serbia2 | 0.41 | Serbia2 | 0.72 | Serbia2 | 0.79 | Serbia2 | 1.00 |
| Serbia3 | 0.68 | Serbia3 | 0.98 | Serbia3 | 1.00 | Serbia3 | 0.98 | Serbia3 | 1.00 |
| Serbia4 | 1.00 | Serbia4 | 1.00 | Serbia4 | 1.00 | Serbia4 | 1.00 | Serbia4 | 1.00 |
| Serbia6 | 1.00 | Serbia5 | 0.00 | Serbia5 | 1.00 | Serbia5 | 1.00 | Serbia5 | 1.00 |
| Serbia7 | 1.00 | Serbia6 | 1.00 | Serbia6 | 1.00 | Serbia6 | 1.00 | Serbia6 | 1.00 |
| Serbia8 | 1.00 | Serbia7 | 0.89 | Serbia7 | 1.00 | Serbia7 | 1.00 | Serbia7 | 0.67 |
| Serbia9 | 1.00 | Serbia8 | 0.46 | Serbia8 | 0.89 | Serbia8 | 1.00 | Serbia8 | 0.77 |
| Serbia10 | 0.92 | Serbia9 | 1.00 | Serbia9 | 0.87 | Serbia9 | 0.78 | Serbia9 | 0.68 |
| Serbia11 | 1.00 | Serbia10 | 0.70 | Serbia10 | 1.00 | Serbia10 | 1.00 | Serbia10 | 0.73 |
| Serbia12 | 0.70 | Serbia11 | 0.47 | Serbia11 | 1.00 | Serbia11 | 0.66 | Serbia11 | 0.59 |
| Serbia13 | 0.32 | Serbia12 | 0.67 | Serbia12 | 0.77 | Serbia12 | 0.81 | Serbia12 | 0.71 |
| Serbia14 | 1.00 | Serbia13 | 0.30 | Serbia13 | 0.39 | Serbia13 | 1.00 | Serbia13 | 0.53 |
| Serbia15 | 1.00 | Serbia14 | 1.00 | Serbia14 | 1.00 | Serbia14 | 1.00 | Serbia14 | 1.00 |
| Serbia16 | 0.48 | Serbia15 | 0.35 | Serbia15 | 0.26 | Serbia15 | 1.00 | Serbia15 | 1.00 |
| Serbia17 | 0.73 | Serbia16 | 0.40 | Serbia16 | 0.62 | Serbia16 | 0.72 | Serbia16 | 0.69 |
| Serbia18 | 1.00 | Serbia17 | 0.67 | Serbia17 | 0.82 | Serbia17 | 0.78 | Serbia17 | 0.64 |
| Serbia19 | 1.00 | Serbia18 | 1.00 | Serbia18 | 1.00 | Serbia18 | 1.00 | Serbia18 | 0.83 |
| Serbia20 | 1.00 | Serbia19 | 1.00 | Serbia19 | 1.00 | Serbia19 | 1.00 | Serbia19 | 1.00 |
| Serbia21 | 1.00 | Serbia20 | 1.00 | Serbia20 | 0.92 | Serbia20 | 0.69 | Serbia20 | 0.42 |
| Serbia22 | 0.75 | Serbia21 | 1.00 | Serbia21 | 1.00 | Serbia21 | 1.00 | Serbia21 | 0.98 |
| Serbia23 | 1.00 | Serbia22 | 0.59 | Serbia22 | 0.84 | Serbia22 | 0.79 | Serbia22 | 0.60 |
| Serbia24 | 0.20 | Serbia23 | 1.00 | Serbia23 | 0.29 | Serbia23 | 0.76 | Serbia23 | 0.58 |
| Serbia25 | 1.00 | Serbia24 | 0.30 | Serbia24 | 0.36 | Serbia24 | 1.00 | Serbia24 | 0.85 |
| Serbia26 | 0.63 | Serbia25 | 1.00 | Serbia25 | 0.85 | Serbia25 | 0.90 | Serbia25 | 0.93 |
| Serbia26 | 0.41 | Serbia26 | 0.64 | Serbia26 | 0.65 | Serbia26 | 0.79 | ||
| Average | 0.81 | 0.69 | 0.79 | 0.88 | 0.81 | ||||
Appendix B
| DMU | Slack Movement (Loans) | Slack Movement (Investment) | Proportionate Movement (Net Income) | Slack Movement (Net Income) | Proportionate Movement (Interest Income) | Slack Movement (Interest Income) | Proportionate Movement (Noninterest Income) | Slack Movement (Noninterest Income) |
|---|---|---|---|---|---|---|---|---|
| Albania1 | 0.00 | −10,319,445.95 | 202,613.14 | 847,510.25 | 3,481,878.39 | 0.00 | 718,482.59 | 0.00 |
| Albania2 | 0.00 | −27,899,515.18 | 76,750.49 | 0.00 | 292,524.53 | 0.00 | 29,939.40 | 464,962.48 |
| Albania3 | −11,111,297.70 | −51,942,814.93 | 577,021.78 | 307,502.22 | 3,692,202.13 | 0.00 | 676,773.77 | 0.00 |
| Albania4 | 0.00 | 0.00 | 0.00 | 0.00 | 0.00 | 0.00 | 0.00 | 0.00 |
| Albania5 | 0.00 | −57,494,552.35 | 1,024,688.22 | 0.00 | 2,595,880.93 | 0.00 | 511,601.93 | 1,076,794.51 |
| Albania6 | 0.00 | 0.00 | 0.00 | 0.00 | 0.00 | 0.00 | 0.00 | 0.00 |
| Albania7 | 0.00 | −15,110,197.52 | 549,840.32 | 0.00 | 2,234,970.67 | 0.00 | 392,761.91 | 356,585.44 |
| Albania8 | −6,145,130.24 | 0.00 | 0.00 | 456,073.52 | 758,397.49 | 0.00 | 184,096.65 | 0.00 |
| Albania9 | −4,134,606.26 | −47,690,708.77 | 1,070,162.48 | 1,187,914.10 | 2,524,782.20 | 0.00 | 1,188,102.91 | 0.00 |
| Albania10 | 0.00 | −23,745,094.65 | 0.00 | 694,461.18 | 1,296,737.66 | 0.00 | 269,989.03 | 0.00 |
| Albania11 | 0.00 | 0.00 | 0.00 | 0.00 | 0.00 | 0.00 | 0.00 | 0.00 |
| Albania12 | 0.00 | 0.00 | 0.00 | 0.00 | 0.00 | 0.00 | 0.00 | 0.00 |
| Bosnia& Herzegovina1 | 0.00 | −169,260.74 | 216.84 | 0.00 | 888.71 | 0.00 | 499.56 | 192.11 |
| Bosnia&Herzegovina2 | 0.00 | −422.38 | 937.31 | 0.00 | 2639.96 | 0.00 | 1247.68 | 260.28 |
| Bosnia& Herzegovina3 | 0.00 | 0.00 | 0.00 | 0.00 | 0.00 | 0.00 | 0.00 | 0.00 |
| Bosnia& Herzegovina4 | 0.00 | 0.00 | 0.00 | 0.00 | 0.00 | 0.00 | 0.00 | 0.00 |
| Bosnia&Herzegovina5 | 0.00 | 0.00 | 0.00 | 0.00 | 0.00 | 0.00 | 0.00 | 0.00 |
| Bosnia& Herzegovina6 | 0.00 | −59,089.27 | 831.75 | 0.00 | 1920.37 | 1946.13 | 1173.16 | 0.00 |
| Bosnia&Herzegovina7 | 0.00 | 0.00 | 704.68 | 1173.73 | 2416.64 | 0.00 | 1444.03 | 0.00 |
| Bosnia& Herzegovina8 | 0.00 | 0.00 | 94.30 | 4852.05 | 1809.09 | 0.00 | 719.09 | 908.30 |
| Bosnia& Herzegovina9 | 0.00 | 0.00 | 0.00 | 0.00 | 0.00 | 0.00 | 0.00 | 0.00 |
| Bosnia&Herzegovina10 | 0.00 | 0.00 | 232.13 | 2683.05 | 4402.01 | 0.00 | 1124.43 | 3416.21 |
| Bosnia& Herzegovina11 | 0.00 | 0.00 | 0.00 | 0.00 | 0.00 | 0.00 | 0.00 | 0.00 |
| Bosnia&Herzegovina12 | 0.00 | −40,542.07 | 2129.53 | 0.00 | 5046.25 | 0.00 | 2382.05 | 1034.28 |
| Bosnia& Herzegovina13 | 0.00 | 0.00 | 0.00 | 0.00 | 0.00 | 0.00 | 0.00 | 0.00 |
| Bosnia& Herzegovina14 | 0.00 | −170,988.28 | 105.69 | 953.88 | 4864.25 | 0.00 | 1257.39 | 3549.39 |
| Bosnia&Herzegovina15 | 0.00 | 0.00 | 0.00 | 0.00 | 0.00 | 0.00 | 0.00 | 0.00 |
| Bosnia& Herzegovina16 | 0.00 | −3528.42 | 245.54 | 6238.91 | 7206.06 | 0.00 | 2058.61 | 5182.77 |
| Montenegro1 | 0.00 | 0.00 | 0.00 | 0.00 | 0.00 | 0.00 | 0.00 | 0.00 |
| Montenegro2 | 0.00 | 0.00 | 0.00 | 0.00 | 0.00 | 0.00 | 0.00 | 0.00 |
| Montenegro3 | 0.00 | 0.00 | 263.97 | 1373.68 | 2513.59 | 0.00 | 1284.69 | 0.00 |
| Montenegro4 | 0.00 | 0.00 | 0.00 | 0.00 | 0.00 | 0.00 | 0.00 | 0.00 |
| Montenegro5 | 0.00 | 0.00 | 267.22 | 0.00 | 713.34 | 2187.08 | 379.10 | 0.00 |
| Montenegro6 | 0.00 | 0.00 | 392.84 | 339.70 | 2142.50 | 0.00 | 779.84 | 961.87 |
| Montenegro7 | 0.00 | 0.00 | 0.00 | 0.00 | 0.00 | 0.00 | 0.00 | 0.00 |
| Montenegro8 | 0.00 | 0.00 | 0.00 | 0.00 | 0.00 | 0.00 | 0.00 | 0.00 |
| Montenegro9 | 0.00 | 0.00 | 128.42 | 768.92 | 745.61 | 0.00 | 130.88 | 1392.09 |
| Montenegro10 | 0.00 | −16,814.64 | 86.75 | 660.57 | 1242.53 | 0.00 | 577.36 | 1421.85 |
| Montenegro11 | 0.00 | 0.00 | 0.00 | 0.00 | 0.00 | 0.00 | 0.00 | 0.00 |
| Montenegro12 | 0.00 | 0.00 | 0.00 | 0.00 | 0.00 | 0.00 | 0.00 | 0.00 |
| North Macedonia01 | 0.00 | 0.00 | 0.00 | 0.00 | 0.00 | 0.00 | 0.00 | 0.00 |
| North Macedonia02 | 0.00 | 0.00 | 146,061.09 | 430,162.49 | 331,972.08 | 0.00 | 68,967.74 | 86,935.57 |
| North Macedonia03 | 0.00 | 0.00 | 59,105.55 | 156,525.12 | 146,011.86 | 0.00 | 35,403.65 | 12,509.40 |
| North Macedonia04 | 0.00 | 0.00 | 0.00 | 0.00 | 0.00 | 0.00 | 0.00 | 0.00 |
| North Macedonia05 | 0.00 | 0.00 | 0.00 | 0.00 | 0.00 | 0.00 | 0.00 | 0.00 |
| North Macedonia06 | 0.00 | 0.00 | 0.00 | 0.00 | 0.00 | 0.00 | 0.00 | 0.00 |
| North Macedonia07 | 0.00 | 0.00 | 0.00 | 0.00 | 0.00 | 0.00 | 0.00 | 0.00 |
| North Macedonia08 | 0.00 | 0.00 | 0.00 | 0.00 | 0.00 | 0.00 | 0.00 | 0.00 |
| North Macedonia09 | 0.00 | 0.00 | 2343.09 | 161,710.78 | 66,340.97 | 0.00 | 17,981.85 | 0.00 |
| North Macedonia10 | 0.00 | 0.00 | 0.00 | 0.00 | 0.00 | 0.00 | 0.00 | 0.00 |
| North Macedonia11 | 0.00 | 0.00 | 0.00 | 0.00 | 0.00 | 0.00 | 0.00 | 0.00 |
| North Macedonia13 | 0.00 | 0.00 | 0.00 | 0.00 | 0.00 | 0.00 | 0.00 | 0.00 |
| Serbia1 | 0.00 | 0.00 | 0.00 | 0.00 | 0.00 | 0.00 | 0.00 | 0.00 |
| Serbia2 | 0.00 | 0.00 | 0.00 | 0.00 | 0.00 | 0.00 | 0.00 | 0.00 |
| Serbia3 | 0.00 | 0.00 | 0.00 | 0.00 | 0.00 | 0.00 | 0.00 | 0.00 |
| Serbia4 | 0.00 | 0.00 | 0.00 | 0.00 | 0.00 | 0.00 | 0.00 | 0.00 |
| Serbia5 | 0.00 | 0.00 | 0.00 | 0.00 | 0.00 | 0.00 | 0.00 | 0.00 |
| Serbia6 | 0.00 | 0.00 | 0.00 | 0.00 | 0.00 | 0.00 | 0.00 | 0.00 |
| Serbia7 | 0.00 | 0.00 | 560,323.81 | 1,291,718.81 | 1,853,381.76 | 0.00 | 737,386.91 | 0.00 |
| Serbia8 | 0.00 | 0.00 | 50,121.53 | 1,143,246.22 | 698,732.42 | 0.00 | 182,816.64 | 0.00 |
| Serbia9 | 0.00 | 0.00 | 1,234,109.42 | 1,875,636.78 | 3,371,455.34 | 0.00 | 813,799.06 | 876,233.08 |
| Serbia10 | 0.00 | 0.00 | 111,798.84 | 3,922,468.67 | 2,396,254.33 | 0.00 | 723,475.49 | 0.00 |
| Serbia11 | 0.00 | −1,750,533.59 | 0.00 | 191,598.26 | 343,859.14 | 0.00 | 88019.41 | 0.00 |
| Serbia12 | 0.00 | 0.00 | 196,671.04 | 866,503.61 | 875,250.94 | 0.00 | 320,838.47 | 0.00 |
| Serbia13 | 0.00 | 0.00 | 167,069.72 | 0.00 | 560,857.74 | 0.00 | 112,576.01 | 0.00 |
| Serbia14 | 0.00 | 0.00 | 0.00 | 0.00 | 0.00 | 0.00 | 0.00 | 0.00 |
| Serbia15 | 0.00 | 0.00 | 0.00 | 0.00 | 0.00 | 0.00 | 0.00 | 0.00 |
| Serbia16 | 0.00 | −1,499,126.32 | 15,235.21 | 104,133.04 | 258,680.95 | 0.00 | 6646.73 | 2235.07 |
| Serbia17 | 0.00 | 0.00 | 268,816.84 | 1,050,717.76 | 1,349,621.18 | 0.00 | 403,279.15 | 0.00 |
| Serbia18 | 0.00 | 0.00 | 906,321.22 | 3,973,124.26 | 2,342,622.90 | 0.00 | 698,583.66 | 1,482,096.34 |
| Serbia19 | 0.00 | 0.00 | 0.00 | 0.00 | 0.00 | 0.00 | 0.00 | 0.00 |
| Serbia20 | 0.00 | 0.00 | 948,596.91 | 1,559,275.73 | 3,674,282.30 | 0.00 | 1,366,286.83 | 0.00 |
| Serbia21 | 0.00 | 0.00 | 130,012.33 | 849,085.29 | 214,911.28 | 424,774.38 | 92,386.97 | 0.00 |
| Serbia22 | 0.00 | 0.00 | 206,714.98 | 3,172,506.57 | 2,811,632.24 | 0.00 | 1,032,623.53 | 0.00 |
| Serbia23 | 0.00 | −2,042,829.44 | 34,307.21 | 0.00 | 176,959.91 | 0.00 | 72,269.12 | 0.00 |
| Serbia24 | 0.00 | −5,655,027.12 | 0.00 | 160,400.98 | 109,457.94 | 0.00 | 33,175.83 | 0.00 |
| Serbia25 | 0.00 | −94,408,111.64 | 614,570.53 | 1,018,022.62 | 1,023,193.02 | 0.00 | 300,929.77 | 1,642,451.43 |
| Serbia26 | 0.00 | −11,667,424.83 | 1,635,536.91 | 0.00 | 1,612,317.14 | 576,557.60 | 577,392.61 | 0.00 |
Appendix C
| DMU | Projection (Loans) | Projection (Investment) | Projection (Net Income) | Projection (Interest Income) | Projection (Noninterest Income) |
|---|---|---|---|---|---|
| Albania1 | 49,096,090.00 | 7,154,774.05 | 1,188,141.39 | 5,853,698.39 | 1,207,905.59 |
| Albania2 | 30,533,526.00 | 3,925,158.82 | 825,290.49 | 3,145,487.53 | 786,897.87 |
| Albania3 | 92,510,702.30 | 13,863,125.07 | 2,179,335.00 | 11,977,338.13 | 2,195,423.77 |
| Albania4 | 5,924,760.00 | 797,366.00 | 19,144.00 | 273,144.00 | 98,344.00 |
| Albania5 | 75,104,205.00 | 9,425,090.65 | 2,732,562.22 | 6,922,501.93 | 2,441,096.45 |
| Albania6 | 250,782,251.00 | 18,271,935.00 | 17,523,372.00 | 1,752,372.00 | 13,957,406.00 |
| Albania7 | 53,469,389.00 | 7,338,500.48 | 1,476,247.32 | 6,000,595.67 | 1,411,098.35 |
| Albania8 | 19,028,341.76 | 2,288,243.00 | 456,073.52 | 1,830,999.49 | 444,464.65 |
| Albania9 | 125,369,283.74 | 14,778,433.23 | 5,364,893.58 | 9,854,544.20 | 4,637,315.91 |
| Albania10 | 31,179,091.00 | 4,530,881.35 | 694,461.18 | 3,561,298.66 | 741,485.03 |
| Albania11 | 77,358,301.00 | 13,441,040.00 | 710,347.00 | 12,956,243.00 | 1,069,370.00 |
| Albania12 | 550,0594.00 | 386,802.00 | 8778.00 | 321,754.00 | 32,785.00 |
| Bosnia& Herzegovina1 | 54,2571.00 | 26,292.26 | 7506.84 | 30,766.71 | 17,486.66 |
| Bosnia&Herzegovina2 | 332,833.00 | 49,186.62 | 6687.31 | 18,834.96 | 9161.96 |
| Bosnia& Herzegovina3 | 890,239.00 | 613.00 | 11764.00 | 36,643.00 | 13,717.00 |
| Bosnia& Herzegovina4 | 1,587,533.00 | 6134.00 | 33,923.00 | 78,039.00 | 33,208.00 |
| Bosnia&Herzegovina5 | 57,713.00 | 4.00 | 1451.00 | 3323.00 | 3397.00 |
| Bosnia& Herzegovina6 | 872,921.00 | 39,201.73 | 19,385.75 | 46,704.50 | 27,343.16 |
| Bosnia&Herzegovina7 | 290,630.00 | 1184.00 | 5334.42 | 14,268.64 | 8526.03 |
| Bosnia& Herzegovina8 | 398,254.00 | 279.00 | 5739.35 | 17,022.09 | 7674.40 |
| Bosnia& Herzegovina9 | 2,889,431.00 | 27,913.00 | 56,901.00 | 154,930.00 | 96,038.00 |
| Bosnia&Herzegovina10 | 204,752.00 | 992.00 | 3274.18 | 11,210.01 | 6279.64 |
| Bosnia& Herzegovina11 | 973,371.00 | 6936.00 | 10,268.00 | 53,817.00 | 21,382.00 |
| Bosnia&Herzegovina12 | 1,121,611.00 | 118,636.93 | 25,616.53 | 60,702.25 | 29,688.33 |
| Bosnia& Herzegovina13 | 3,552,913.00 | 527,263.00 | 101,071.00 | 186,280.00 | 74,671.00 |
| Bosnia& Herzegovina14 | 256,399.00 | 25,501.72 | 1293.57 | 15,634.25 | 7590.77 |
| Bosnia&Herzegovina15 | 159,766.00 | 28,004.00 | 84.00 | 10,488.00 | 5732.00 |
| Bosnia& Herzegovina16 | 768,248.00 | 12,247.58 | 7700.45 | 42,893.06 | 17,436.38 |
| Montenegro1 | 516,982.00 | 80,086.00 | 3618.00 | 25,988.00 | 18,017.00 |
| Montenegro2 | 249,776.00 | 134,758.00 | 4863.00 | 19,741.00 | 16,989.00 |
| Montenegro3 | 220,571.00 | 32,567.00 | 2853.66 | 14,092.59 | 7202.69 |
| Montenegro4 | 385,757.00 | 23,856.00 | 12,270.00 | 25,643.00 | 7393.00 |
| Montenegro5 | 397,736.00 | 56,772.00 | 8366.22 | 24,520.41 | 11,869.10 |
| Montenegro6 | 101,384.00 | 21,952.00 | 1741.54 | 7645.50 | 3744.71 |
| Montenegro7 | 188,391.00 | 296.00 | 3369.00 | 13,954.00 | 3451.00 |
| Montenegro8 | 103,318.00 | 109,703.00 | 3241.00 | 4570.00 | 7097.00 |
| Montenegro9 | 156,919.00 | 6841.00 | 2777.34 | 11,660.61 | 3438.98 |
| Montenegro10 | 61,620.00 | 29,063.36 | 991.32 | 4737.53 | 3623.21 |
| Montenegro11 | 773,248.00 | 7855.00 | 1216.00 | 35,687.00 | 10,195.00 |
| Montenegro12 | 13,444.00 | 2001.00 | 0.00 | 896.00 | 201.00 |
| North Macedonia01 | 4,375,948.00 | 127,348.00 | 44,318.00 | 194,678.00 | 73,875.00 |
| North Macedonia02 | 38,120,261.00 | 6,852,166.00 | 1,278,216.58 | 1,927,483.08 | 487,373.31 |
| North Macedonia03 | 16,096,746.00 | 2,227,346.00 | 480,252.68 | 799,722.86 | 206,419.06 |
| North Macedonia04 | 1,662,494.00 | 426,020.00 | 17,075.00 | 101,251.00 | 23,094.00 |
| North Macedonia05 | 55,484,418.00 | 16,016,583.00 | 1,826,825.00 | 2,404,765.00 | 998,984.00 |
| North Macedonia06 | 9,407,635.00 | 9072.00 | 18,367.00 | 84,201.00 | 12,104.00 |
| North Macedonia07 | 59,058,925.00 | 16,760,848.00 | 2,023,627.00 | 3,018,006.00 | 921,438.00 |
| North Macedonia08 | 25,119,749.00 | 572,070.00 | 255,980.00 | 626,869.00 | 175,452.00 |
| North Macedonia09 | 6,782,698.00 | 1,026,542.00 | 173,891.86 | 344,888.97 | 93,482.85 |
| North Macedonia10 | 6,439,728.00 | 729,979.00 | 16,968.00 | 291,741.00 | 113,072.00 |
| North Macedonia11 | 68,321,584.00 | 10,460,058.00 | 2,317,114.00 | 3,428,823.00 | 825,790.00 |
| North Macedonia13 | 5,107,178.00 | 1,487,817.00 | 108,369.00 | 268,129.00 | 139,365.00 |
| Serbia1 | 5,077,557.00 | 1,880,122.00 | 0.00 | 187,809.00 | 73,675.00 |
| Serbia2 | 70,363,878.00 | 14,714,723.00 | 1,107,695.00 | 3,584,298.00 | 1,369,682.00 |
| Serbia3 | 136,672,957.00 | 43,478,821.00 | 8,230,318.00 | 6,564,726.00 | 1,349,459.00 |
| Serbia4 | 425,076,129.00 | 114,918,075.00 | 12,329,459.00 | 20,388,188.00 | 7,691,852.00 |
| Serbia5 | 6,516,791.00 | 6,533,676.00 | 33,660.00 | 145,205.00 | 272,338.00 |
| Serbia6 | 81,056,992.00 | 149,179,933.00 | 2,652,546.00 | 7,518,046.00 | 1,520,570.00 |
| Serbia7 | 97,595,144.00 | 97,926,467.00 | 2,981,056.62 | 5,587,818.76 | 2,223,170.91 |
| Serbia8 | 40,104,674.00 | 49,168,974.00 | 1,363,110.75 | 3,065,079.42 | 801,948.64 |
| Serbia9 | 162,436,370.00 | 205,073,415.00 | 5,789,512.19 | 10,692,290.34 | 3,457,129.14 |
| Serbia10 | 136,632,247.00 | 145,775,943.00 | 4,343,117.51 | 9,016,029.33 | 2,722,113.49 |
| Serbia11 | 9,903,623.00 | 10,882,295.41 | 191,598.26 | 843,005.14 | 215,788.41 |
| Serbia12 | 47,257,530.00 | 55,874,736.00 | 1,536,010.65 | 2,979,526.94 | 1,092,197.47 |
| Serbia13 | 13,199,440.00 | 13,775,653.00 | 352,455.72 | 1,183,203.74 | 237,494.01 |
| Serbia14 | 205,586,521.00 | 348,155,504.00 | 8,955,759.00 | 12,605,384.00 | 5,328,996.00 |
| Serbia15 | 3,445,960.00 | 5,506,762.00 | 0.00 | 142,352.00 | 26,559.00 |
| Serbia16 | 7,234,587.00 | 8,665,246.68 | 153,420.25 | 836,854.95 | 23,737.80 |
| Serbia17 | 54,132,640.00 | 63,236,462.00 | 1,805,903.60 | 3,791,484.18 | 1,132,930.15 |
| Serbia18 | 247,185,738.00 | 289,945,144.00 | 9,409,621.48 | 14,052,040.90 | 5,672,496.00 |
| Serbia19 | 14,781,473.00 | 14,956,899.00 | 459,031.00 | 2,220,294.00 | 18,118.00 |
| Serbia20 | 106,413,055.00 | 106,811,468.00 | 3,188,857.63 | 6,312,000.30 | 2,347,125.83 |
| Serbia21 | 185,135,331.00 | 241,835,983.00 | 7,092,980.62 | 10,745,976.66 | 4,436,921.97 |
| Serbia22 | 113,379,767.00 | 133,251,057.00 | 3,685,376.55 | 6,975,797.24 | 2,561,989.53 |
| Serbia23 | 6,755,595.00 | 7,355,079.56 | 80,886.21 | 417,218.91 | 170,389.12 |
| Serbia24 | 9,164,325.00 | 9,753,522.88 | 160,400.98 | 721,225.94 | 218,597.83 |
| Serbia25 | 267,409,838.00 | 282,459,858.36 | 9,906,024.15 | 14,797,555.02 | 5,994,538.20 |
| Serbia26 | 147,945,642.00 | 150,946,713.17 | 7,618,406.91 | 808,6805.74 | 2,689,521.61 |
References
- Fauska, P.; Kryvinska, N.; Strauss, C. The Role of E-Commerce in B2B Markets of Goods and Services. Int. J. Serv. Econ. Manag. (IJSEM) 2013, 4, 41–71. [Google Scholar] [CrossRef]
- Martin, V. Analysis of capital buffers in Serbia. Anal. Ekon. Fak. Subotici 2021, 57, 73–87. [Google Scholar] [CrossRef]
- Milojević, N.; Redžepagić, S. Expected effects of the revised exposure to banks Basel credit risk weighted assets standard. Strateg. Manag. J. Strateg. Manag. Decis. Support Syst. Strateg. Manag. 2021, 26, 49–60. [Google Scholar] [CrossRef]
- Jiménez-Hernandez, I.; Palazzo, G.; Sáez-Fernández, F.J. Determinants of bank efficiency: Evidence from the Latin American banking industry. Appl. Econ. Anal. 2019, 27, 184–206. [Google Scholar] [CrossRef] [Green Version]
- Charnes, A.; Cooper, W.; Rhodes, E. Measuring the efficiency of decision making units. Eur. J. Oper. Res. 1978, 2, 429–444. [Google Scholar] [CrossRef]
- Nourani, M.; Malim, N.A.K.; Mia, M.A. Revisiting efficiency of microfinance institutions (MFIs): An application of network data envelopment analysis. Econ. Res. Istraz. 2021, 34, 1146–1169. [Google Scholar] [CrossRef]
- Chen, Y.; Liang, L.; Zhu, J. Equivalence in two-stage DEA approaches. Eur. J. Oper. Res. 2009, 193, 600–604. [Google Scholar] [CrossRef]
- Chen, Y.; Cook, W.D.; Li, N.; Zhu, J. Additive efficiency decomposition in two-stage DEA. Eur. J. Oper. Res. 2009, 196, 1170–1176. [Google Scholar] [CrossRef]
- Jurčević, B.; Žaja, M.M. Banks and insurance companies efficiency indicators in the period of financial crisis: The case of the Republic of Croatia. Ekon. Istraz. 2013, 26, 203–224. [Google Scholar] [CrossRef] [Green Version]
- Lu, W.-M.; Lo, S.-F. Does Size Matter? Finding the Profitability and Marketability Benchmark of Financial Holding Companies. Artic. Asia Pac. J. Oper. Res. 2006, 23, 229–246. [Google Scholar]
- Paradi, J.C.; Sherman, H.D.; Tam, F.K. Data Envelopment Analysis in the Financial Services Industry; Springer: Berlin, Germany, 2018; Volume 266. [Google Scholar]
- Berger, A.N.; Humphrey, D.B. Efficiency of financial institutions: International survey and directions for future research. Eur. J. Oper. Res. 1997, 98, 175–212. [Google Scholar] [CrossRef]
- Cvetkoska, V.; Savić, G. Efficiency of bank branches: Empirical evidence from a two-phase research approach. Econ. Res. Istraz. 2017, 30, 318–333. [Google Scholar] [CrossRef] [Green Version]
- Boďa, M.; Zimková, E. Efficiency in the slovak banking industry: A comparison of three approaches. Prague Econ. Pap. 2015, 24, 434–451. [Google Scholar] [CrossRef] [Green Version]
- Berger, A.N.; Humphrey, D.B. Measurement and Efficiency Issues in Commercial Banking. In Output Measurement in the Service Sectors; University of Chicago Press: Chicago, IL, USA, 1992; pp. 245–300. [Google Scholar]
- Horvat, A.M.; Milenković, N.; Radovanov, B.; Zelenović, V.; Milić, D. DEA efficiency of Serbian banks- comparison of three approaches. Ann. Fac. Econ. Subot. 2022. [CrossRef]
- Wang, C.N.; Nguyen, N.A.T.; Dang, T.T.; Trinh, T.T.Q. A Decision Support Model for Measuring Technological Progress and Productivity Growth: The Case of Commercial Banks in Vietnam. Axioms 2021, 10, 22. [Google Scholar] [CrossRef]
- Wanke, P.; Barros, C. Two-stage DEA: An application to major Brazilian banks. Expert Syst. Appl. 2014, 41, 2337–2344. [Google Scholar] [CrossRef]
- Liu, W.; Zhou, Z.; Ma, C.; Liu, D.; Shen, W. Two-stage DEA models with undesirable input-intermediate-outputs. Omega 2015, 56, 74–87. [Google Scholar] [CrossRef]
- Seiford, L.M.; Zhu, J. Profitability and marketability of the top 55 U.S. commercial banks. Manage. Sci. 1999, 45, 1270–1288. [Google Scholar] [CrossRef] [Green Version]
- Maghbouli, M.; Amirteimoori, A.; Kordrostami, S. Two-stage network structures with undesirable outputs: A DEA based approach. Meas. J. Int. Meas. Confed. 2014, 48, 109–118. [Google Scholar] [CrossRef]
- Shi, X.; Emrouznejad, A.; Yu, W. Overall efficiency of operational process with undesirable outputs containing both series and parallel processes: A SBM network DEA model. Expert Syst. Appl. 2021, 178, 115062. [Google Scholar] [CrossRef]
- Wang, K.; Huang, W.; Wu, J.; Liu, Y.N. Efficiency measures of the Chinese commercial banking system using an additive two-stage DEA. Omega 2014, 44, 5–20. [Google Scholar] [CrossRef]
- Simar, L.; Wilson, P.W. Two-stage DEA: Caveat emptor. J. Product. Anal. 2011, 36, 205–218. [Google Scholar] [CrossRef]
- Paleckova, I. Cost efficiency measurement using two-stage data envelopment analysis in the Czech and Slovak banking sectors. Acta Oeconomica 2019, 69, 445–466. [Google Scholar] [CrossRef]
- Dar, Q.F.; Ahn, Y.-H.; Dar, G.F. The Impact of International Trade on Central Bank Efficiency: An Application of DEA and Tobit Regression Analysis. Stat. Optim. Inf. Comput. 2021, 9, 223–240, Jan 2021. [Google Scholar] [CrossRef]
- Jackson, P.M.P.; Fethi, M.D. Evaluating the Technical Efficiency of Turkish Commercial Banks: An Application of DEA and Tobit Analysis; University of Leicester: Leicester, UK, 2000. [Google Scholar]
- Sufian, F. Assessing the impact of financial sector restructuring on bank performance in a small developing economy. Ekon. Istraz. 2010, 23, 11–33. [Google Scholar]
- Milenković, N.; Radovanov, B.; Kalaš, B.; Horvat, A.M. External Two Stage DEA Analysis of Bank Efficiency in West Balkan Countries. Sustainability 2022, 14, 978. [Google Scholar] [CrossRef]
- Basílio, M.S.; Clara, M.; Pires, P.; Filipe, J.; Reis, P.; Pt, C.P. Portuguese banks’ performance: Comparing efficiency with their Spanish counterparts. Eurasian Econ. Rev. 2016, 6, 27–44. [Google Scholar] [CrossRef]
- Koisova, E.; Grmanova, E.; Skrovankova, K.; Kostrova, J. Competitiveness of regions in the Visegrad group countries. Eng. Econ. 2019, 30, 203–210. [Google Scholar] [CrossRef]
- Hughes, J.P.; Mester, L.J. Efficiency in Banking: Theory, Practice, and Evidence. In Oxford Handbook of Banking; Oxford University Press: Oxford, UK, 2008. [Google Scholar]
- Holod, D.; Lewis, H.F. Resolving the deposit dilemma: A new DEA bank efficiency model. J. Bank. Financ. 2011, 35, 2801–2810. [Google Scholar] [CrossRef]
- Sufian, F. Benchmarking the efficiency of the Korean banking sector: A DEA approach. Benchmarking 2011, 18, 107–127. [Google Scholar] [CrossRef]
- Barros, C.P.; Chen, Z.; Liang, Q.B.; Peypoch, N. Technical efficiency in the Chinese banking sector. Econ. Model. 2011, 28, 2083–2089. [Google Scholar] [CrossRef]
- Banker, R.D.; Charnes, A.; Cooper, W.W. Some Models for Estimating Technical and Scale Inefficiencies in Data Envelopment Analysis. Manage. Sci. 1984, 30, 1078–1092. [Google Scholar] [CrossRef]
- Coelli, T.; Perelman, S. Comparison of parametric and non-parametric distance functions: With application to European railways. Eur. J. Oper. Res. 1999, 117, 326–339. [Google Scholar] [CrossRef]
- Urikova, O.; Ivanochko, I.; Kryvinska, N.; Strauss, C.; Zinterhof, P. Consideration of Aspects Affecting the Evolvement of Collaborative eBusiness in Service Organizations. Int. J. Serv. Econ. Manag. (IJSEM) 2013, 5, 72–92. [Google Scholar]


| Country | Year | Net Income | Interest Income | Non-Interest Income | Loans | Investment | |
|---|---|---|---|---|---|---|---|
| Albania | 2019 | Average | 2,182,009.00 | 3,964,383.58 | 1,929,458.50 | 69,770,630.75 | 27,533,639.92 |
| Standard deviation | 4,918,637.24 | 3,787,890.24 | 3,899,569.16 | 68,412,563.79 | 24,782,724.68 | ||
| 2015 | Average | 2,430,787.00 | 4,507,287.00 | 645,042.25 | 54,687,810.92 | 20,539,133.17 | |
| Standard deviation | 5,928,260.00 | 4,516,227.76 | 776,113.25 | 60,200,729.41 | 19,404,261.34 | ||
| Bosnia and Herzegovina | 2019 | Average | 17,287.56 | 46,776.06 | 22,055.19 | 931,199.06 | 82,138.75 |
| Standard deviation | 27,159.22 | 52,940.92 | 26,740.54 | 991,735.62 | 138,146.81 | ||
| 2015 | Average | 16,624.06 | 46,637.19 | 16,486.88 | 670,763.75 | 43,664.31 | |
| Standard deviation | 24,452.08 | 54,731.49 | 21,256.36 | 757,178.96 | 104,952.98 | ||
| North Macedonia | 2019 | Average | 633,758.00 | 1,078,852.75 | 320,720.92 | 24,664,780.33 | 4,724,654.08 |
| Standard deviation | 885,471.06 | 1,218,672.80 | 369,819.22 | 24,311,118.89 | 6,290,252.62 | ||
| 2015 | Average | 340,783.00 | 926,206.38 | 297,410.15 | 19,155,675.15 | 3,125,366.77 | |
| Standard deviation | 613,914.54 | 1,081,907.55 | 358,231.48 | 20,811,575.50 | 4,252,714.64 | ||
| Montenegro | 2019 | Average | 3418.75 | 14,965.92 | 7191.17 | 264,095.50 | 43,547.08 |
| Standard deviation | 3593.61 | 10,820.85 | 5961.69 | 219,775.40 | 44,111.54 | ||
| 2015 | Average | 1671.55 | 14,800.36 | 5928.45 | 207,445.73 | 22,525.91 | |
| Standard deviation | 2201.60 | 11,055.29 | 4821.35 | 162,602.50 | 27,174.42 | ||
| Serbia | 2019 | Average | 2,506,483.19 | 4,953,285.12 | 1,618,609.12 | 100,017,838.62 | 103,426,368.69 |
| Standard deviation | 3,560,179.81 | 5,180,549.50 | 1,915,084.06 | 103,560,174.11 | 110,337,709.55 | ||
| 2015 | Average | 1,286,608.04 | 4,685,108.92 | 1,279,458.72 | 46,058,770.68 | 22,386,434.12 | |
| Standard deviation | 2,248,471.17 | 5,216,916.88 | 1,510,680.05 | 57,787,376.98 | 33,011,839.53 |
Disclaimer/Publisher’s Note: The statements, opinions and data contained in all publications are solely those of the individual author(s) and contributor(s) and not of MDPI and/or the editor(s). MDPI and/or the editor(s) disclaim responsibility for any injury to people or property resulting from any ideas, methods, instructions or products referred to in the content. |
© 2022 by the authors. Licensee MDPI, Basel, Switzerland. This article is an open access article distributed under the terms and conditions of the Creative Commons Attribution (CC BY) license (https://creativecommons.org/licenses/by/4.0/).
Share and Cite
Horvat, A.M.; Milenković, N.; Dudić, B.; Kalaš, B.; Radovanov, B.; Mittelman, A. Evaluating Bank Efficiency in the West Balkan Countries Using Data Envelopment Analysis. Mathematics 2023, 11, 15. https://doi.org/10.3390/math11010015
Horvat AM, Milenković N, Dudić B, Kalaš B, Radovanov B, Mittelman A. Evaluating Bank Efficiency in the West Balkan Countries Using Data Envelopment Analysis. Mathematics. 2023; 11(1):15. https://doi.org/10.3390/math11010015
Chicago/Turabian StyleHorvat, Aleksandra Marcikić, Nada Milenković, Branislav Dudić, Branimir Kalaš, Boris Radovanov, and Alexandra Mittelman. 2023. "Evaluating Bank Efficiency in the West Balkan Countries Using Data Envelopment Analysis" Mathematics 11, no. 1: 15. https://doi.org/10.3390/math11010015