1. Introduction
Any software’s usability is a crucial component, and online shopping portals are no exception. Usability refers to a user interface that is straightforward to use, enabling simpler user interaction with a web portal. The user is happy as a result of it. Following ISO 9241-11 specifications, usability is defined as “the degree to which a product may be used by specified users to achieve specified goals with effectiveness, efficiency, and satisfaction in a specified context of use.” The success of many different types of e-business operations depends on how well processes are optimized, how well sales and marketing are boosted, and how well the company is expanded using data and information. The ability of any business operation to manage and safeguard data as a strategic asset, transform it into useful information, and use it as a competitive advantage determines in large part how well that operation performs. This is an even more intriguing task given the rate at which data have recently increased as a result of social networking, the Internet, mobile phones, and a variety of other new technologies that create and capture data. The term “big data” is increasingly being used to describe this phenomenon by the mainstream media, McKinsey Consulting, IBM Research, and numerous other organizations [
1]. Despite the critical role that data plays in the success or failure of e-commerce businesses, there hasnot been enough research on how to use it to provide useful information for management and strategy in e-commerce. The purpose of this Special Issue is to emphasize the need for further research and analysis on this important topic. The study should include a variety of data types, such as quantitative and qualitative data, text, audio, and video data, stocks of previously archived data, streams of real-time data, transaction-based, opinion-related, and temporally-changing data. To fully understand the life cycle of data in organizations, including the highly digital environment of e-commerce enterprises and the operations of other businesses, we also need to conduct additional research [
2,
3]. More than ever before, customers expect personalization from the e-commerce platforms that support the services they use. Who, and to what extent, personalizes. The second paper in the Special Issue has the heading “How to Design Personalization in a Context of Customer Retention”. As described by the writers Kwiseok Kwon and Cookhwan Kim, the method for creating personalization consists of four key constructs: (1) personalization, (2) the level of personalization that is offered (3) the topic of personalization, whether user, customer, or firm-initiated; and (4) the desired learning method for personalization of the business, whether it involves the consumer, the business itself, or a marketing research firm [
4,
5].
In recent years, big data analytics (BDA) has grown in significance for e-commerce. The concept’s continual under-examination hinders the advancement of both theory and application. This position paper discusses BDA in e-commerce based on a comprehensive review of the literature. To examine the definitional components, distinctive characteristics, types, business values, and issues of BDA in the context of e-commerce, this paper offers an interpretive framework [
6]. The report also stimulates broader conversations about potential challenges and opportunities for upcoming theory- and practice-based research. The study’s overall conclusions combine many BDA principles (such as the definition of big data, types, and commercial value, as well as applicable theories) to offer deeper insights into the cross-cutting analytics applications in e-commerce [
7,
8]. The goal of web analytics is to understand visitor experiences by gathering, gauging, monitoring, analyzing, and reporting data on web usage [
9,
10]. Analytics can aid in website optimization to achieve company objectives and/or enhance consumer satisfaction and loyalty [
11,
12,
13].
Web analytics solutions frequently use one of two methods to collect data on web traffic. Both call for client-based page tagging, though only the first one uses server-based log files. The first step in the development of web analytics was the analysis of log files that contained data about web traffic collected by web servers [
14,
15]. Using data mining techniques to extract information from the web is known as web mining. In e-commerce, web mining is used to comprehend customer browsing patterns. The problem with online business is that we donot learn much about our customers until after they make a purchase, at which point the business can access a lot of personal information related to that transaction. This work’s primary objective is to identify a viable option to continue operating a successful online store by better comprehending clients. An analysis of what entices visitors to purchase user goods is the goal of the research project. Web usage mining gives the seller the ability to watch, look at, and identify patterns in collected data to create a fundamental statistical foundation for decision-making [
16,
17].
All or some of the variety of individual quality elements that were measured, including contentment, recall ability, and effectiveness, were combined [
18]. In this paper we are proposing the search for frequent patterns (FPs) in transactional databases is made easier with the help of a high-performance algorithm. By determining the set of enclosed cycles, an iterative sieve approach is used to look for FPs. FPs made up of m elements are formed in each inner cycle of level m. The parameter of the problem, the allocated number of contained cycles, determines the maximum length of the intended FPs. The algorithm’s efficiency is due to its (i) incredibly straightforward logical searching method, (ii) avoidance of recursive processes, and (iii) use of only one-dimensional integer arrays. From the year 2000 to 2018, this study examined the evaluation models used in e-commerce. The study examined elements of usability and security for 11 different models. Each model’s advantages and disadvantages were highlighted. According to this study, there is not a single complete model whereinusability serves as the foundational tenet of e-commerce design [
19]. Usability gauges how simple an interface is to operate. The five quality factors that Nielsen listed are “satisfaction, efficiency, memorability, learnability, and mistake” [
20]. The degree to which a product or service may be used successfully, efficiently, and effectively is known as its usability. Achieve a given aim by a specific user in a specific use situation [
20], Usability is mentioned in another context to measure all the usability factors. as well as the security elements. Creating a system for evaluation that can score the usability, accessibility, and security of e-commerce websites [
21].
This paper is organized as follows:
Section 1 produces an introduction,
Section 2 explores the related published works,
Section 3 outlines the methodology,
Section 4 describes the strengths and weaknesses of each model,
Section 5 provides useful discussion, and the paper finally ends with a conclusion in
Section 5.
The novel contribution of this paper is as follows:
To investigate the usability of e-commerce using web mining;
To use machine learning algorithm for data instance segmentation;
To propose a new hybrid model for e-commerce analytics.
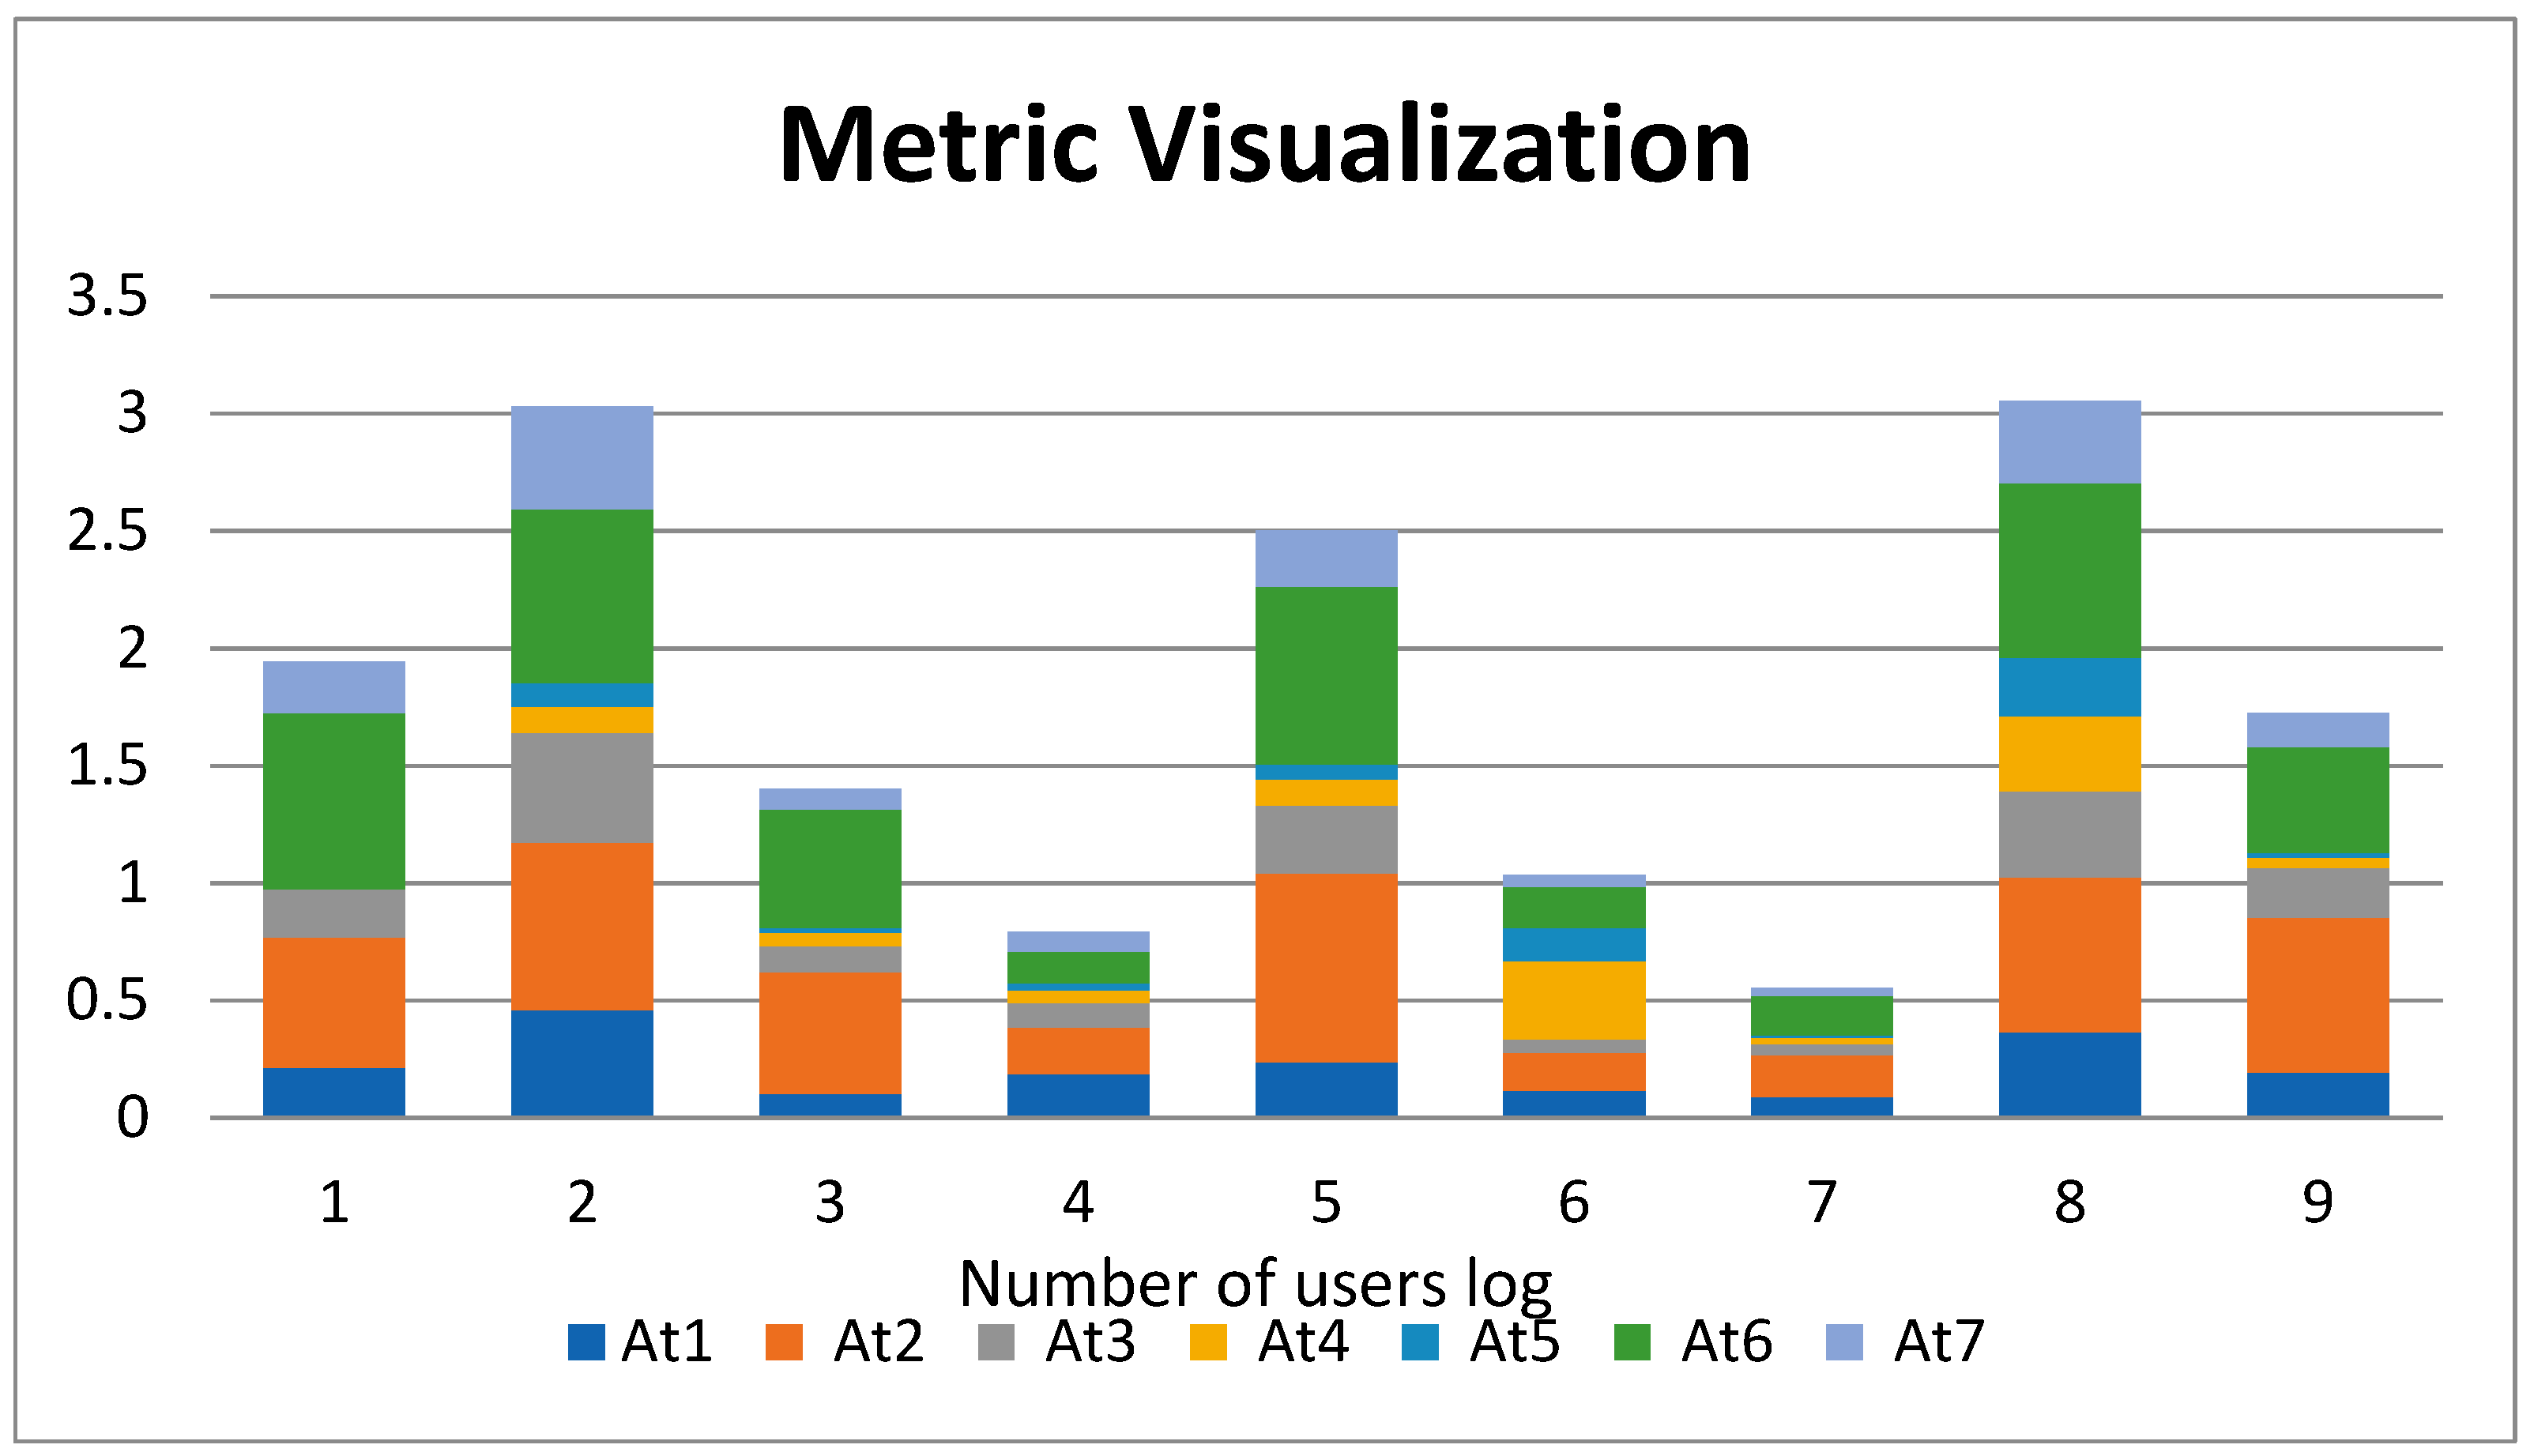
The metrics used to evaluate a site’s overall usability showed that all of the sites may have usability problems with their information architecture. The substantial number of users who visited the websites, but only briefly (their visits did not last longer than three minutes), suggested as much. The significance of the architectural problems on these sites was placed in context by other metrics. For instance, the low usage of the internal search features on sites 1 and 2 (metrics 6 and 7) and the high proportions of visits with medium click depth for sites 1 and 2 (metric 3) offered a potential indication that the architecture of those two sites had fewer problems because users could easily navigate through them.
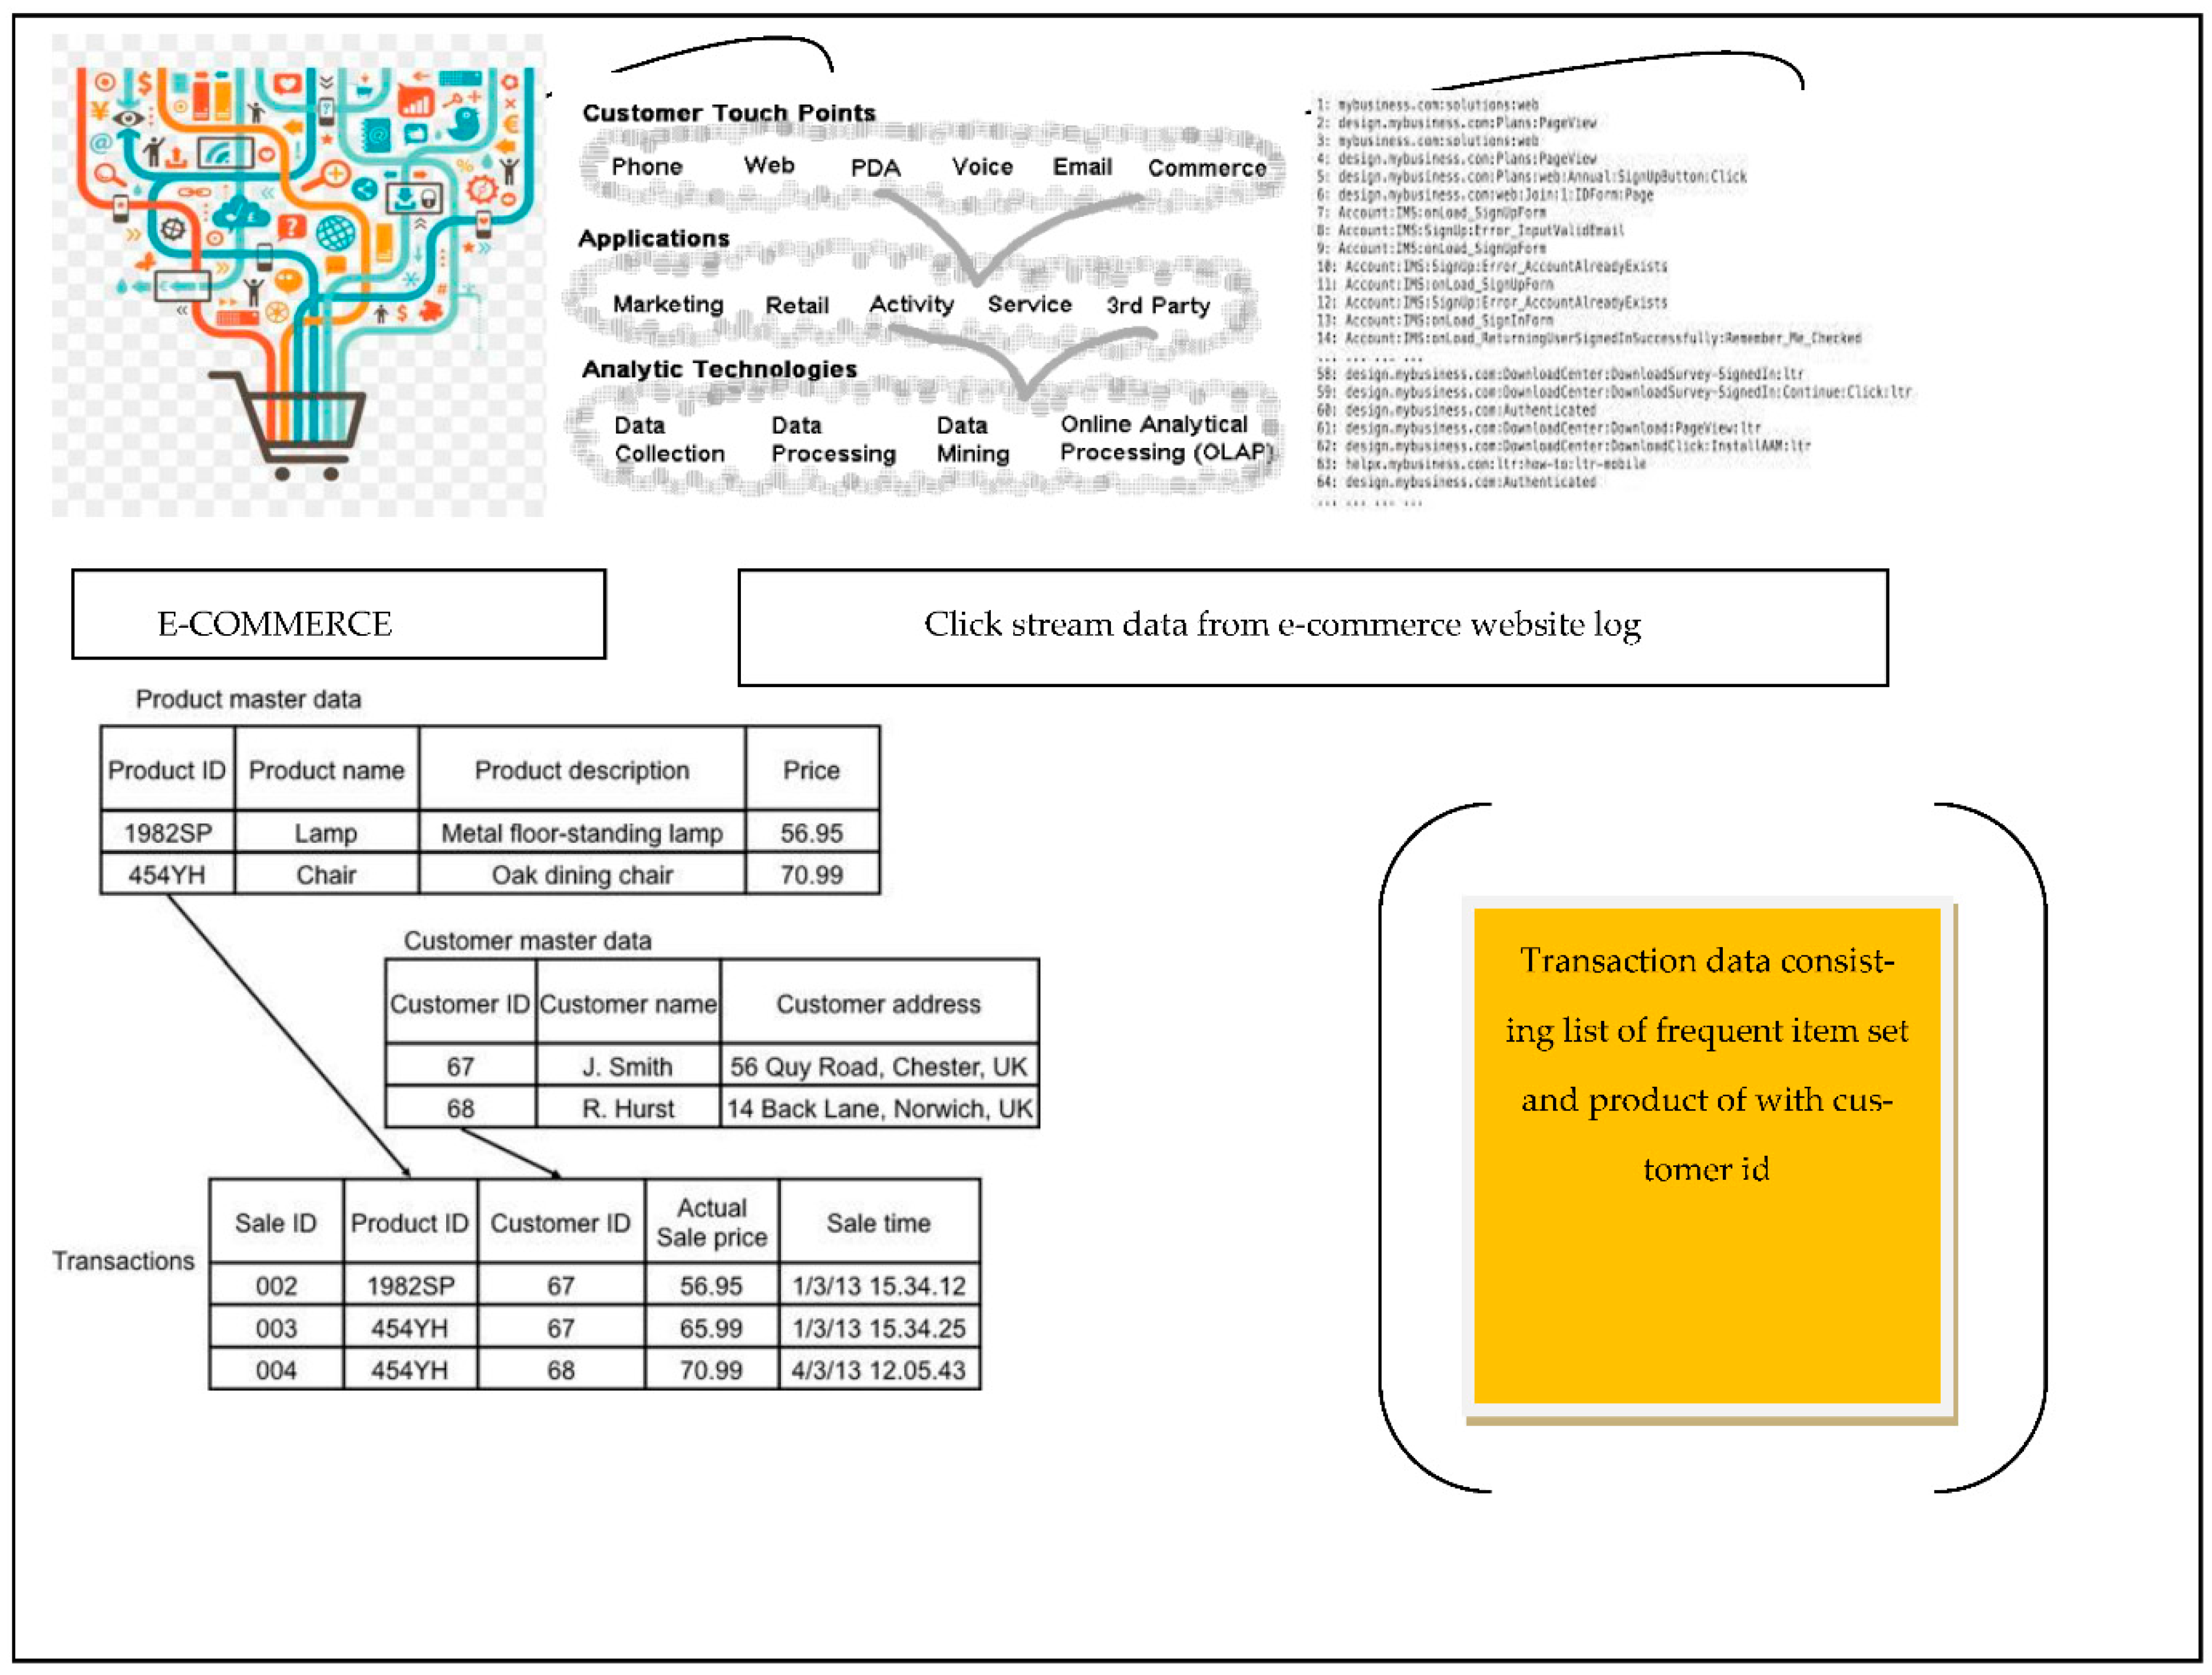
Figure 1 shows the overall model diagram and
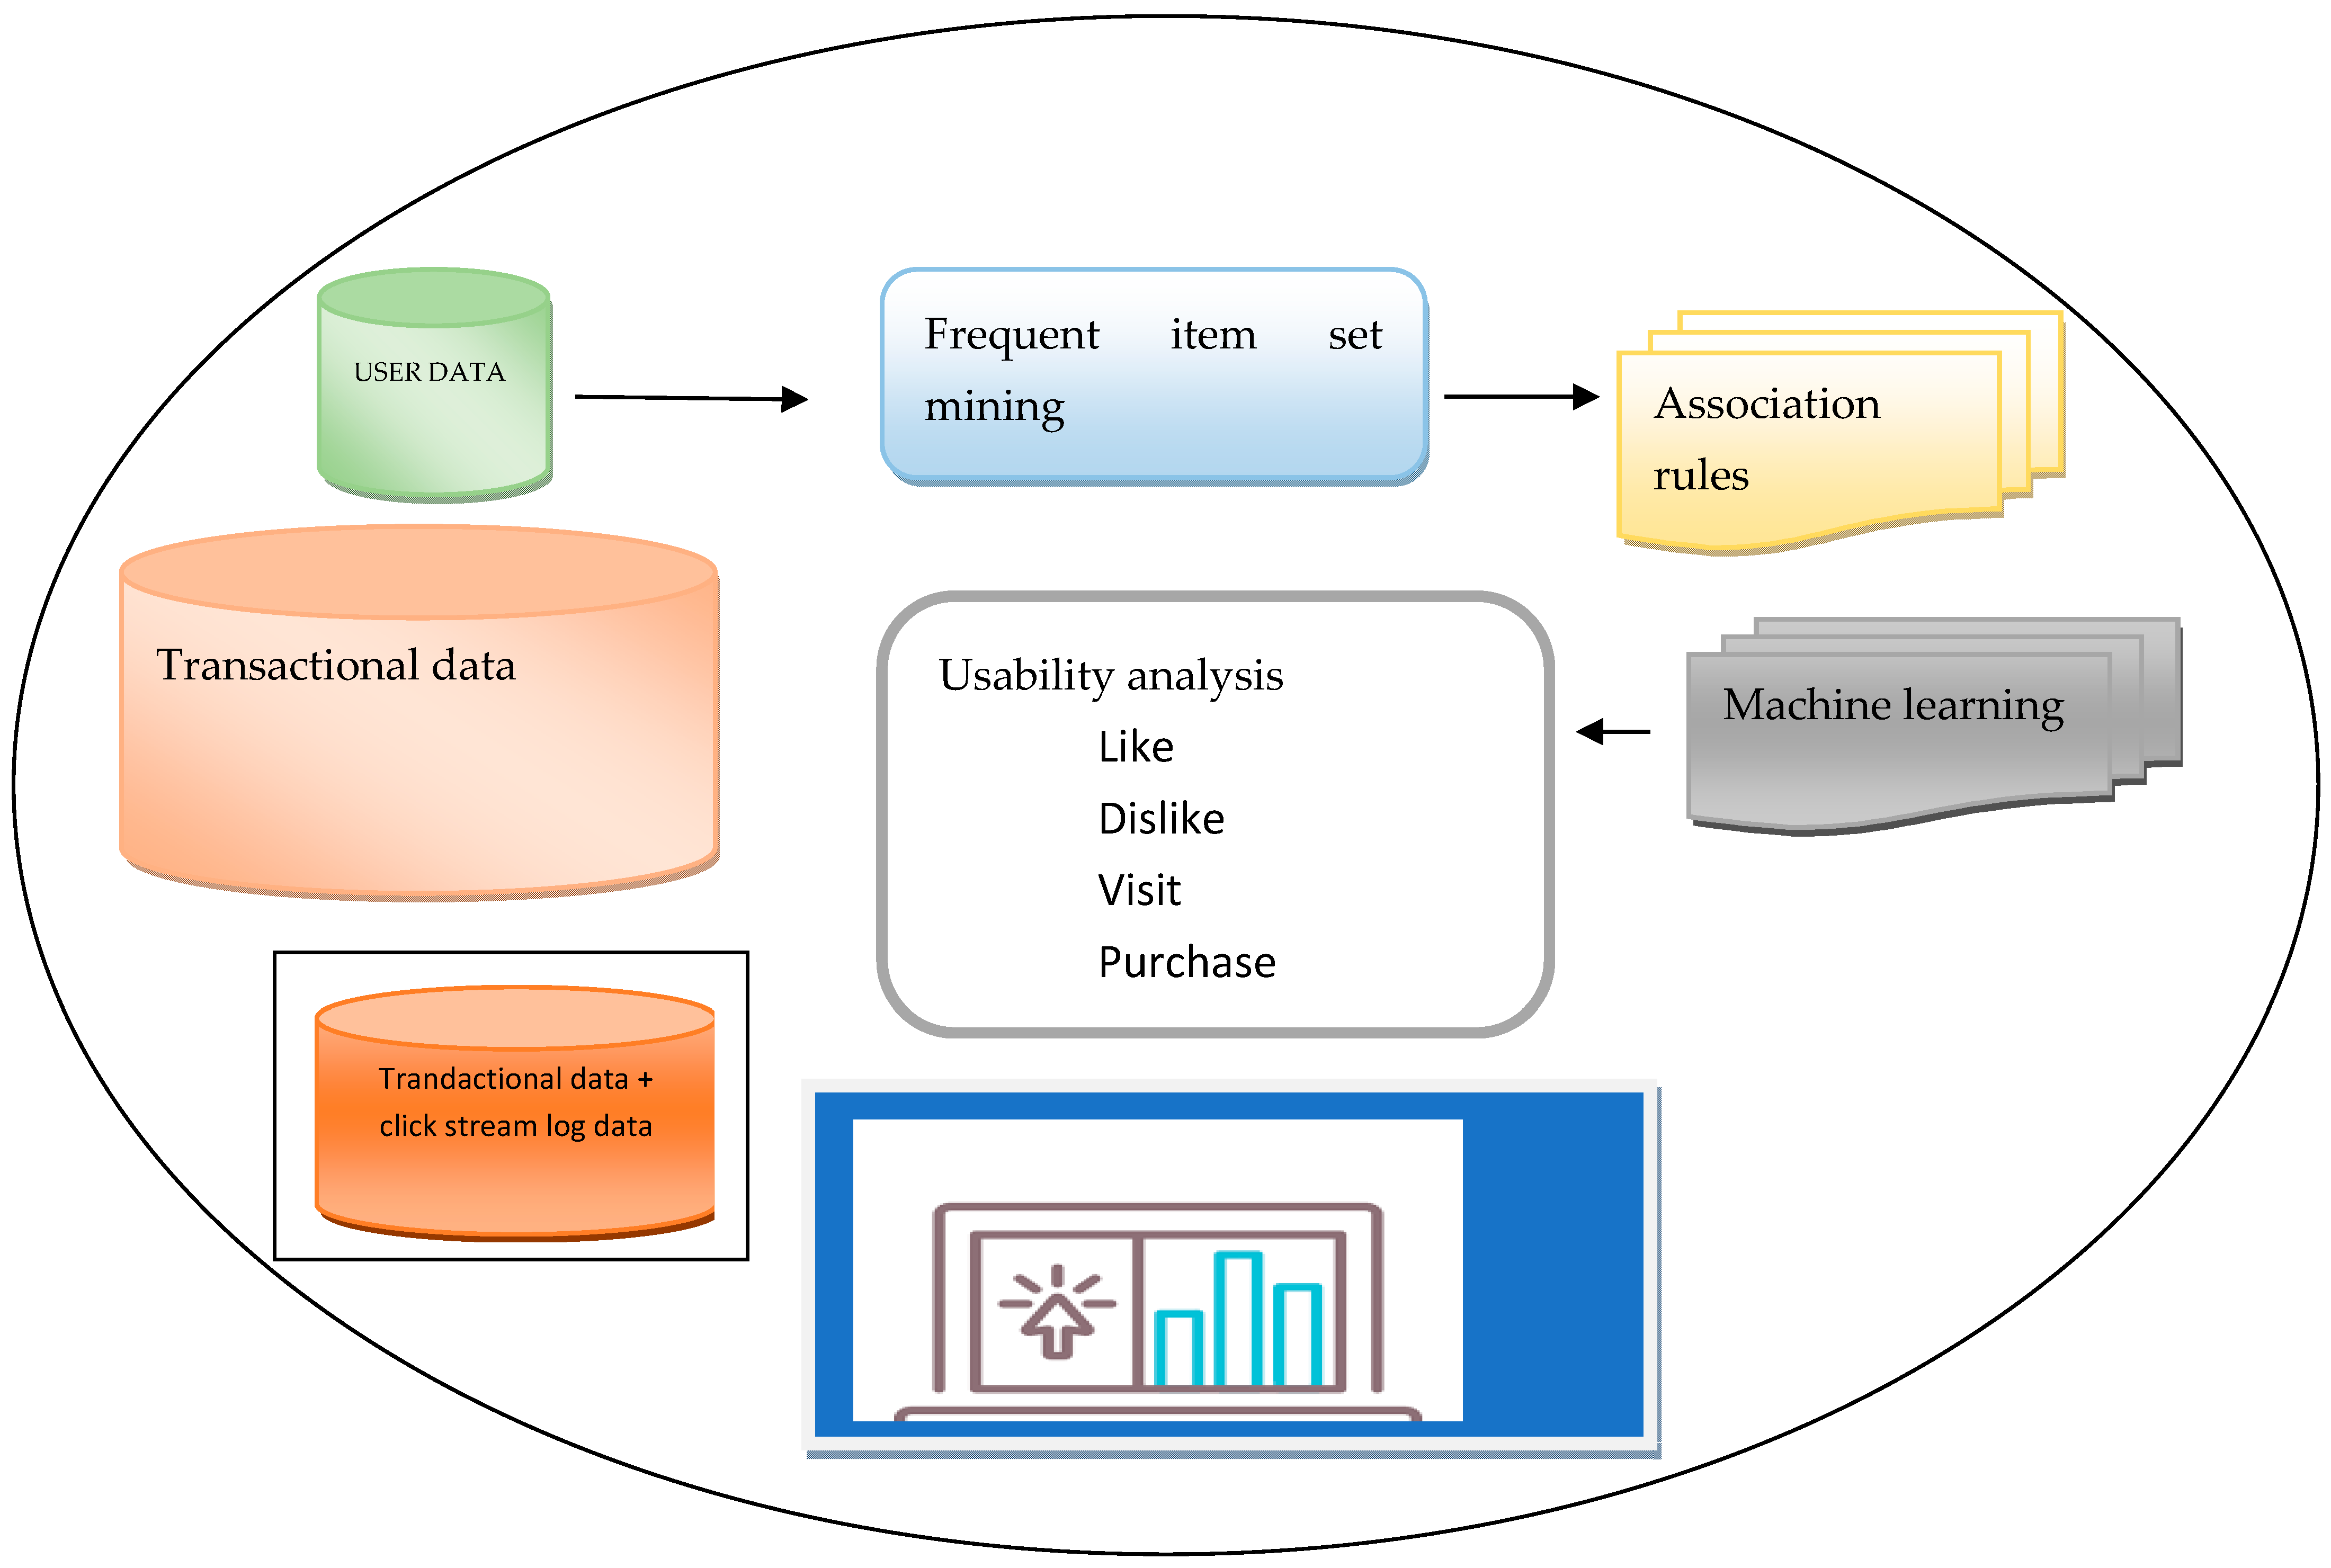
Figure 2 shows the component of e-commerce usability using machine learning and association rule mining.
In
Figure 1 and
Figure 2, based on prior research that identified barriers to the acceptability of such approaches due to a lack of model transparency and actionability [
22], we anticipated finding a significant amount of skepticism toward the use of machine learning-based models for risk assessment. However, the vast majority of practitioners we spoke with were open to the technology. Proof of peer review and increased transparency regarding decision-making thresholds were mentioned as advantageous for the minority of participants who expressed concerns with machine learning models. By identifying patients whose management might change if the model were implemented, stakeholders also created opportunities to make the research more actionable. Although the doctors in our study were generally open to using the simulated dashboard, additional interventions, such as educational campaigns and the identification of analysis of transactional data, will be required to compensate for usability factors.
2. Related Work
The practice of slicing and dicing vast volumes of data to draw enlightening patterns and trends from it is known as data science. Data scientists are tasked with locating complicated truths from an unstructured data network that may be utilized to guide business decisions. The aforementioned duty is carried out by statistical analysts by developing heuristic models and algorithms that can be used for important future purposes. Thanks to the fusion of ideas and technology, data science is now a practical career path for rewarding work. Over the next ten years, data scientists will be in high demand, predicts McKinsey & Company. A few of the industries that are impacted include web development, digital advertising, e-commerce, internet search, banking, and telecommunications [
1]. An important challenge for research and business is to increase the effectiveness of prediction and estimating techniques for use in e-commerce technology. The author of “A New Ensemble Method for Gold Mining Problems: Predicting Technology Transfer”, Ohbyung Kwon, notes that traditional methods have limitations. Generally, ensemble methods outperform single-method methods [
22,
23]. Advanced fourth-generation (4G) mobile technologies will soon be used for mobile commerce. The installation and growth of 4G mobile systems imply the idea of ubiquitous computing, which means that the so-called new economy generated by this technology is everywhere even if the general usage of computing technology is still fast developing. The installation and growth of 4G mobile systems imply the idea of ubiquitous computing, which means that the so-called new economy generated by this technology is everywhere even if the general usage of computing technology is still fast developing everywhere.
The six defining traits or fundamental components of widespread commerce service [
24]: embeddedness, mobility, adaptability, initiative, invisibility, and portability. Mobile commerce is expected to reach an advanced fourth-generation (4G) mobile device [
25]. E-commerce relies heavily on data analytics. The adoption of data analytics has been widespread among e-commerce businesses. Additionally, it facilitates better inventory management, the development of a reliable supply chain, the analysis of data to identify fraud, the forecasting of inventory for the upcoming season, the personalization of customer recommendations, marketing measurement, and enhanced shopping experiences. Various e-commerce companies are used to compete in data analytics [
26].
The analysis is performed using historical and statistical data. According to the study, the properties of the data are expanding and changing daily. As a result, we require new models and algorithms to gather, store, process, analyze, and evaluate data in the field of e-commerce [
27]. One of the major sources of competitive advantage for enterprises in this digital age is the period of e-commerce and the availability of data in every area of business. Utilizing statistical and historical data, the study is conducted. The study claims that the qualities of the data are growing and changing every day. To collect, store, analyze, and assess data in the area of e-commerce, we now need new models and algorithms.
The e-commerce era and the availability of data in every sector of business in a huge volume, which implies big data, are two of the primary sources of competitive advantage for businesses in this digital age. The advertisement helps customers find the best product for their needs and provides useful information for business growth. The investigation of the various advertising strategies used is the main goal of this study. Publishing the advertisement gives useful information for business growth and assists customers in finding the appropriate product for their needs. The primary focus of this study is on the investigation of the various advertising tactics used by businesses to attract customers online. This research project will give a foundation for how Enterprise Resource Planning systems track the targeted audience and present their material, as well as a complete study of user behavior for business or online behavioral advertising [
28].
The study is carried out utilizing historical and statistical data. According to the study, the quality of the data is improving and changing daily. We currently require new models and algorithms in the field of e-commerce to collect, store, analyze, and assess data. Two of the main sources of competitive advantage for businesses in this digital age are the era of e-commerce and the availability of data in every sector of business in a huge volume, which implies big data. The advertisement provides helpful information for business expansion while assisting customers in choosing the best product for their needs. This study’s primary objective was to examine the various advertising tactics currently in use. In order to solve particular issues with problems linked to ease of use, a thorough client testing system (convenient testing, research, and request) and an open source robotized device, such as Camtasia, were utilised. The framework takes into account that client testing is effective for identifying explicit significant ease-of-use issues in four areas: route, plan, purchase cycle, and customer service [
29]. Machine learning is frequently used in e-commerce to track clickstream sessions and assign marketing efforts. Traditional neural learning can explain long-term dependencies in clickstream data, but it ignores marketing research’s theory of numerous purchasing stages in user behavior. In this study, they create a novel, theory-informed machine learning model that accounts for numerous shopping stages as defined in marketing theory. We define ClickstreamDMM in particular as a customized attentive deep Markov model (a Markov model is a stochastic technique for systems with the Markov property, which changes randomly. As a result, the next state is simply reliant on the current state and is independent of everything that occurred in the past at any particular time (refer to page number 11 for more detailed explanation)). For predicting the probability of customers abandoning e-commerce web sessions without making a purchase, our ClickstreamDMM uses two models: (1) an attention network for learning long-term dependencies from clickstream data, and (2) a latent variable model for capturing different purchasing phases [
30]. Web 2.0 and human-computer interaction work very well together. Online designers are being forced to consider new solutions to the challenges with the fastest-growing web technologies and site designs that are good and easy to use. Internet sites are planned to be built with attractive designs to attract visitors who are seeking specific information. E-commerce websites are one of the shopping websites with the most rapid growth products without the hassle of physically being at the store and obtaining things. With the use of user-based collaborative filtering, items that are already of interest to users who are similar to the target user are predicted for them. Let User 1 and User 3 have highly similar preference behavior, as demonstrated in [
26], as an illustration. UBCF may suggest Item A to User 3 if User 1 likes it. To discover the closest neighbors based on user similarities, UBCF uses k-nearest neighbor algorithms and the explicit rating scores of the things that users have explicitly evaluated. Then, using a similarity-weighted average of the rating scores from the neighboring users gives a prediction in terms of items.
In
Table 1, we have shown the comparative analysis of the different state-of-the-art algorithms and methods used, such as what machine learning algorithm is used in click stream-based web mining, in performing usability analysis and decision support in business, which performance metrics was used, and what usability factors were incorporated. Moreover, in this semantic analysis, the state-of-the-art method is shown in the table below.
E-business platforms should be user-friendly, appealing to their demands, emphasizing the distinctiveness of selling proposition, and inspiring trust and understanding. Consequently, here are some current suggestions for improving the usability of online store: concentrate on the human condition, express feelings, and stir up emotions. By using personalized messages and guiding users through the website and the entire purchasing process, the user experience can be improved. When designing an e-commerce platform, it is important to take into account the specific needs of those who have motor, auditory, visual, speech, or cognitive disorders. To set realistic expectations, carefully research the target audience. Visualize the user data that has been gathered. Put as many animations as possible on the website. Enable dual-screen versions of websites so that users are not restricted to using a certain device. Please do not force them to turn left or right. The findings of this study demonstrate that while usability factors such as consistency and interactivity are usability factors that indirectly affect purchase intention, usability factors such as credibility, readability, and telepresence directly affect purchase intention [
31].
3. Methodology
This crucial feature makes use, handling, and search results simple for users. This function offers the user links to explore online pages and conduct needed information searches. The corresponding sub-attributes are as follows: broken links are absent throughout the entire website, misleading links are absent from web portals, clear links are available on each page for easy navigation, and searching is available. Searching returns results quickly for users. We employ various and varied algorithms in machine learning technologies to imbue hardware or machines with intelligence. One of these is the apriori algorithm. To produce the association rules, the apriori algorithm is used. The frequent dataset or the information from the itemset is used to generate the association rules. In general, it is made to function on the various databases that house or support the transactions. The association rules allow us to determine whether the two objects are strongly or weakly connected. The hash tree and breadth-first search are used by the apriori algorithm to calculate the itemset, according to its working mechanism. Calculating the itemset will be done very quickly. The large dataset will offer an iterative method of locating the frequent itemset.
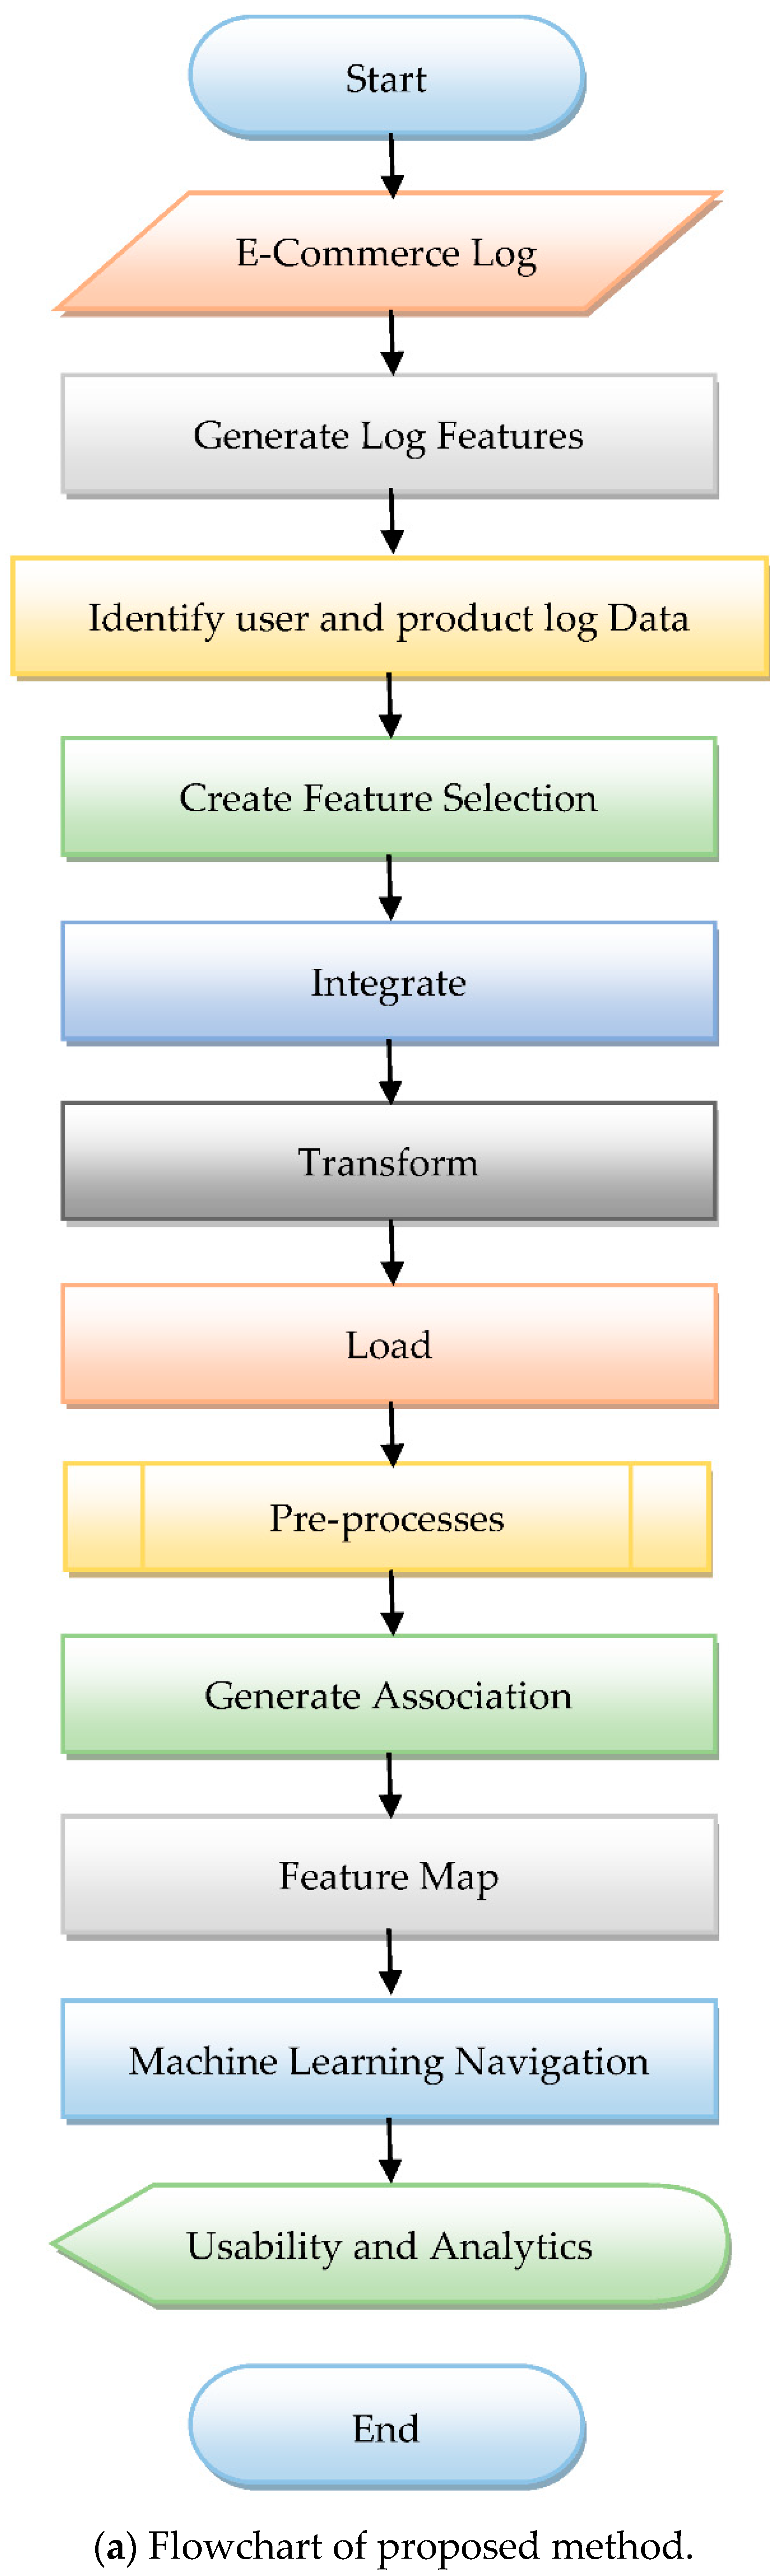
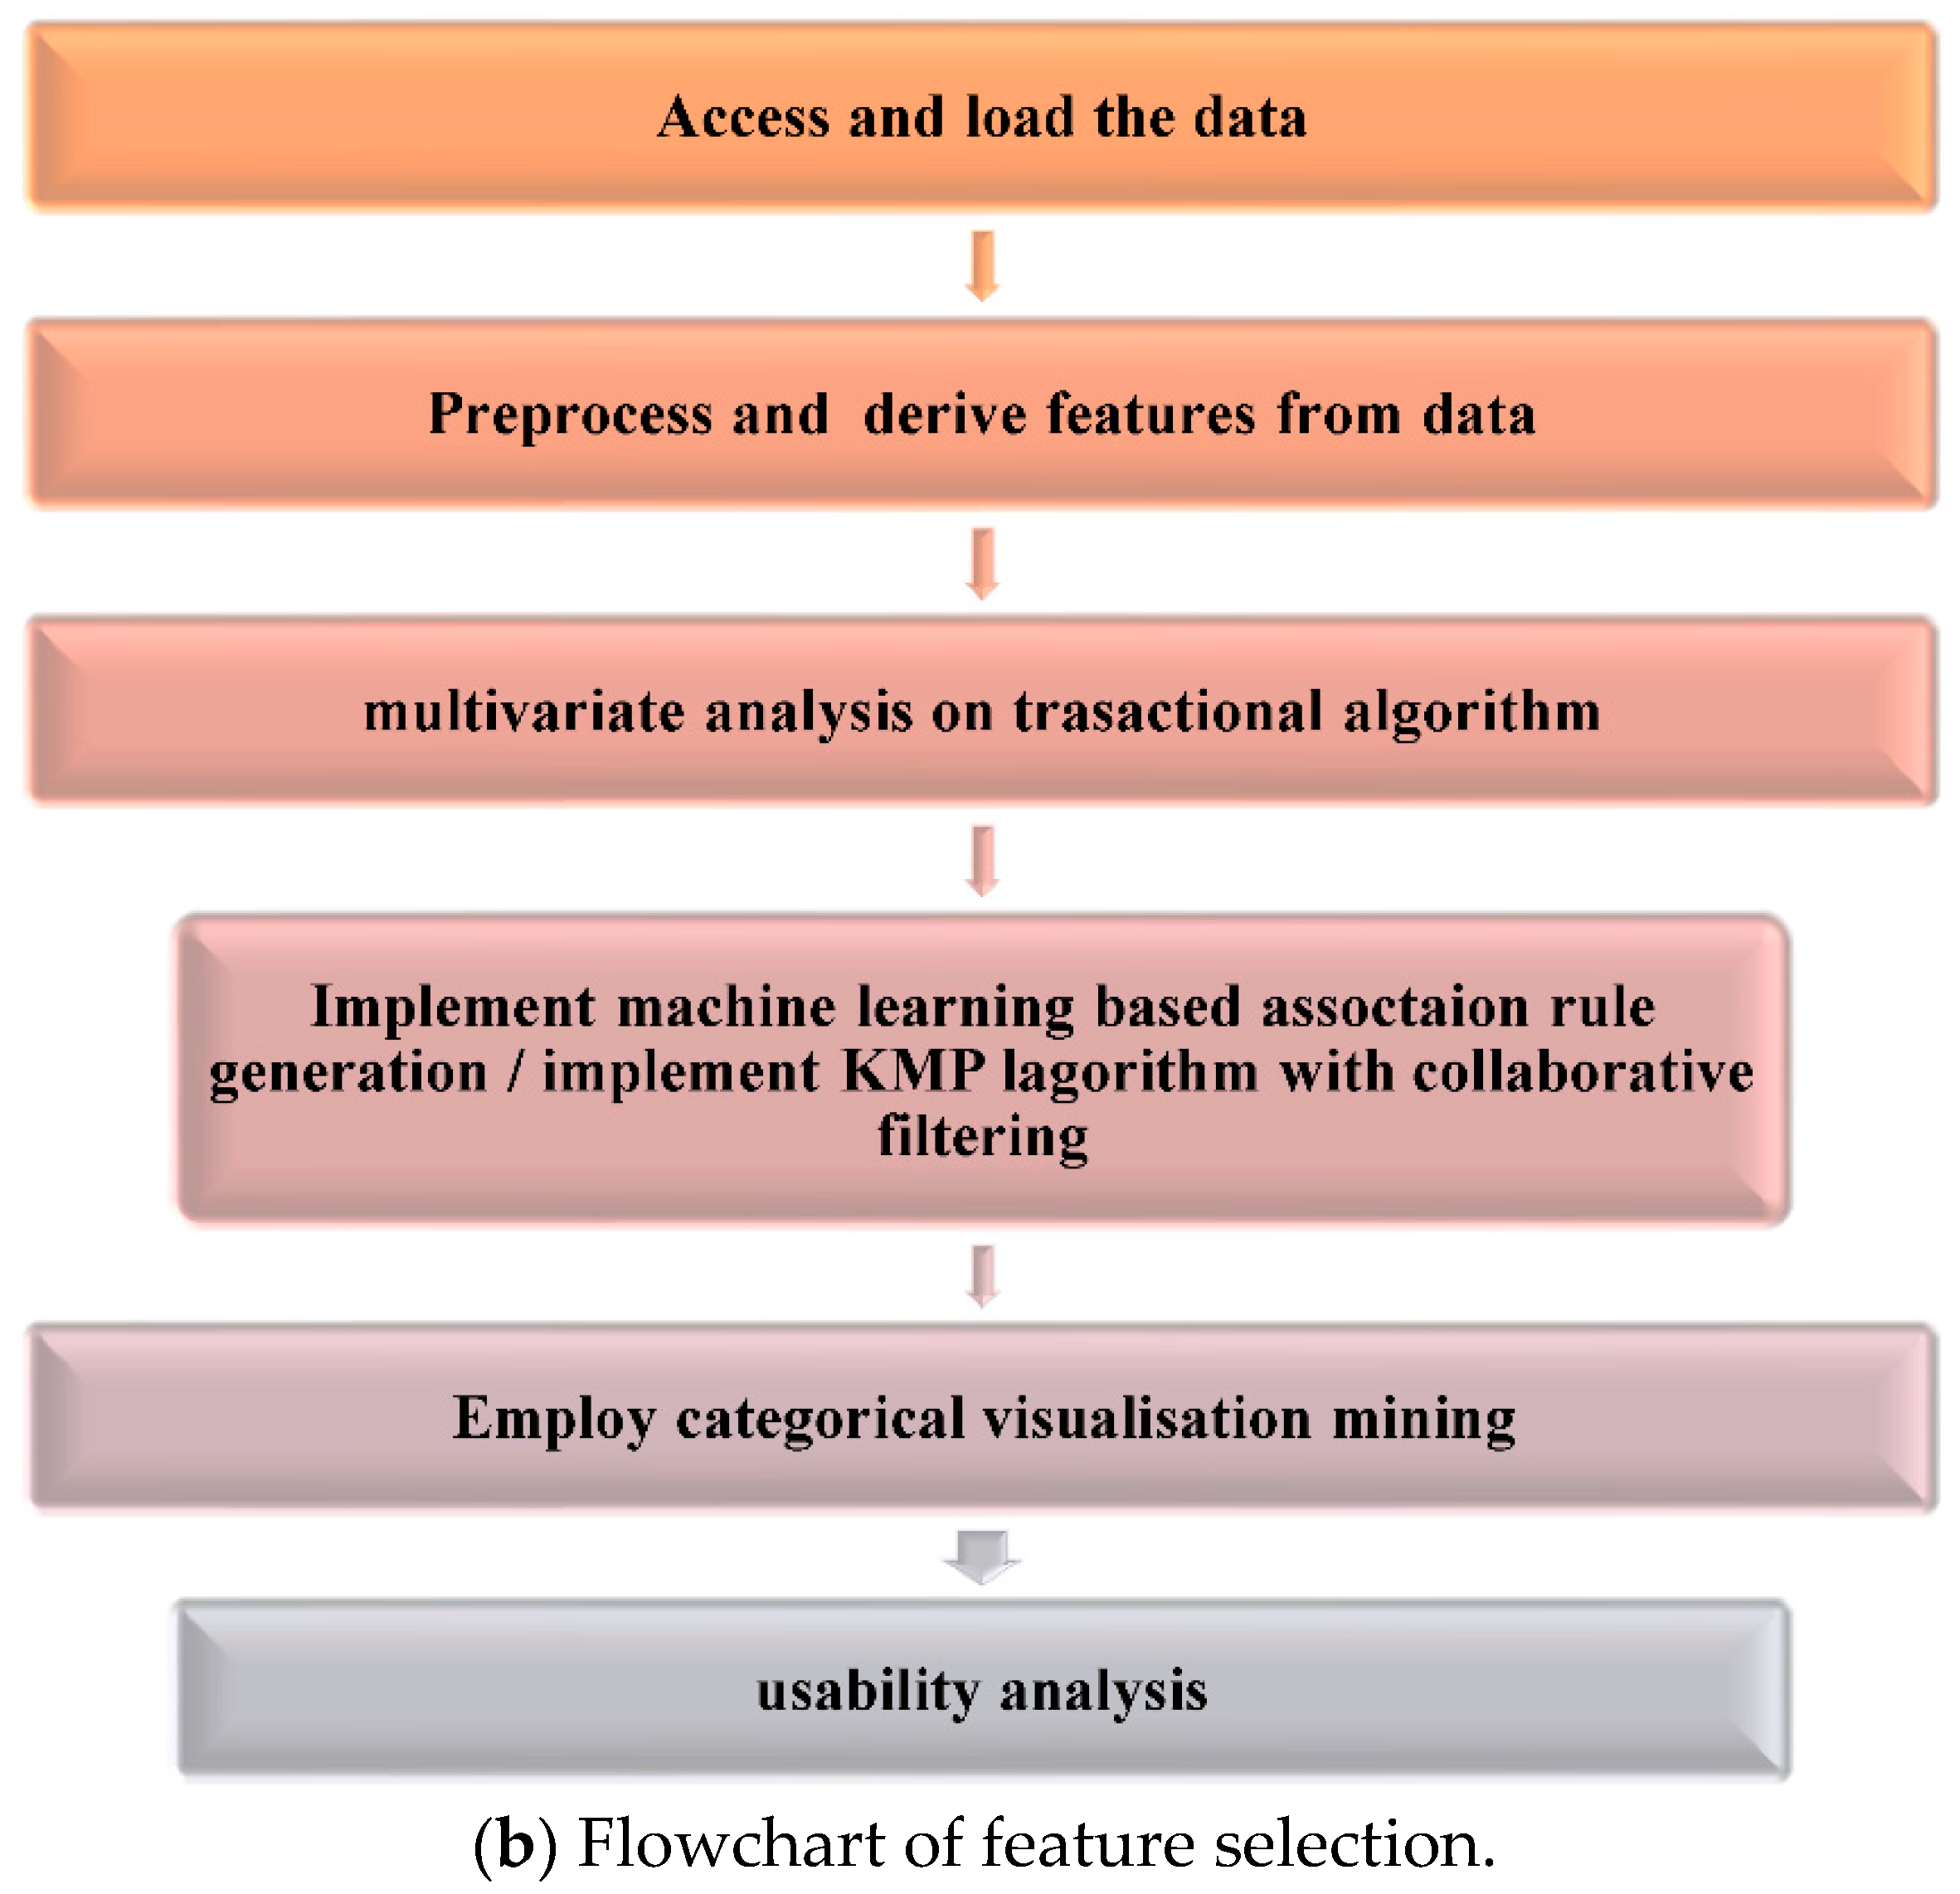
In
Figure 3a,b, we describe a flow chart consisting of the phases of our proposed model:
Consider two transactions: p = 1, 2, 3, 4, 5, and Q = 2, 3, 7. Item sets 2 and 3 are the same in these two transactions. Recall that in the apriori algorithm, the association rules should be our primary concern. We must fully comprehend the support concept and have the confidence to understand the apriori algorithm. The association rules enter the picture at this point. The list of words and phrases that will help comprehend the apriori algorithm is as follows:
Phase 1: To begin, we must locate the list of support itemsets in the transactional databases. Therefore, we must choose minimal support and confidence values.
Phase 2: With the aid of higher support values, we must extract all of the support values from the transaction table. The support value is greater than the minor chosen support value.
Phase 3: We must locate the complete set of rules. According to these rules, the subset values with higher confidence values than the minimum confidence value or the threshold value.
Phase 4: In this step, the set of rules are sorted according to decreasing order.
The next step in this process, in
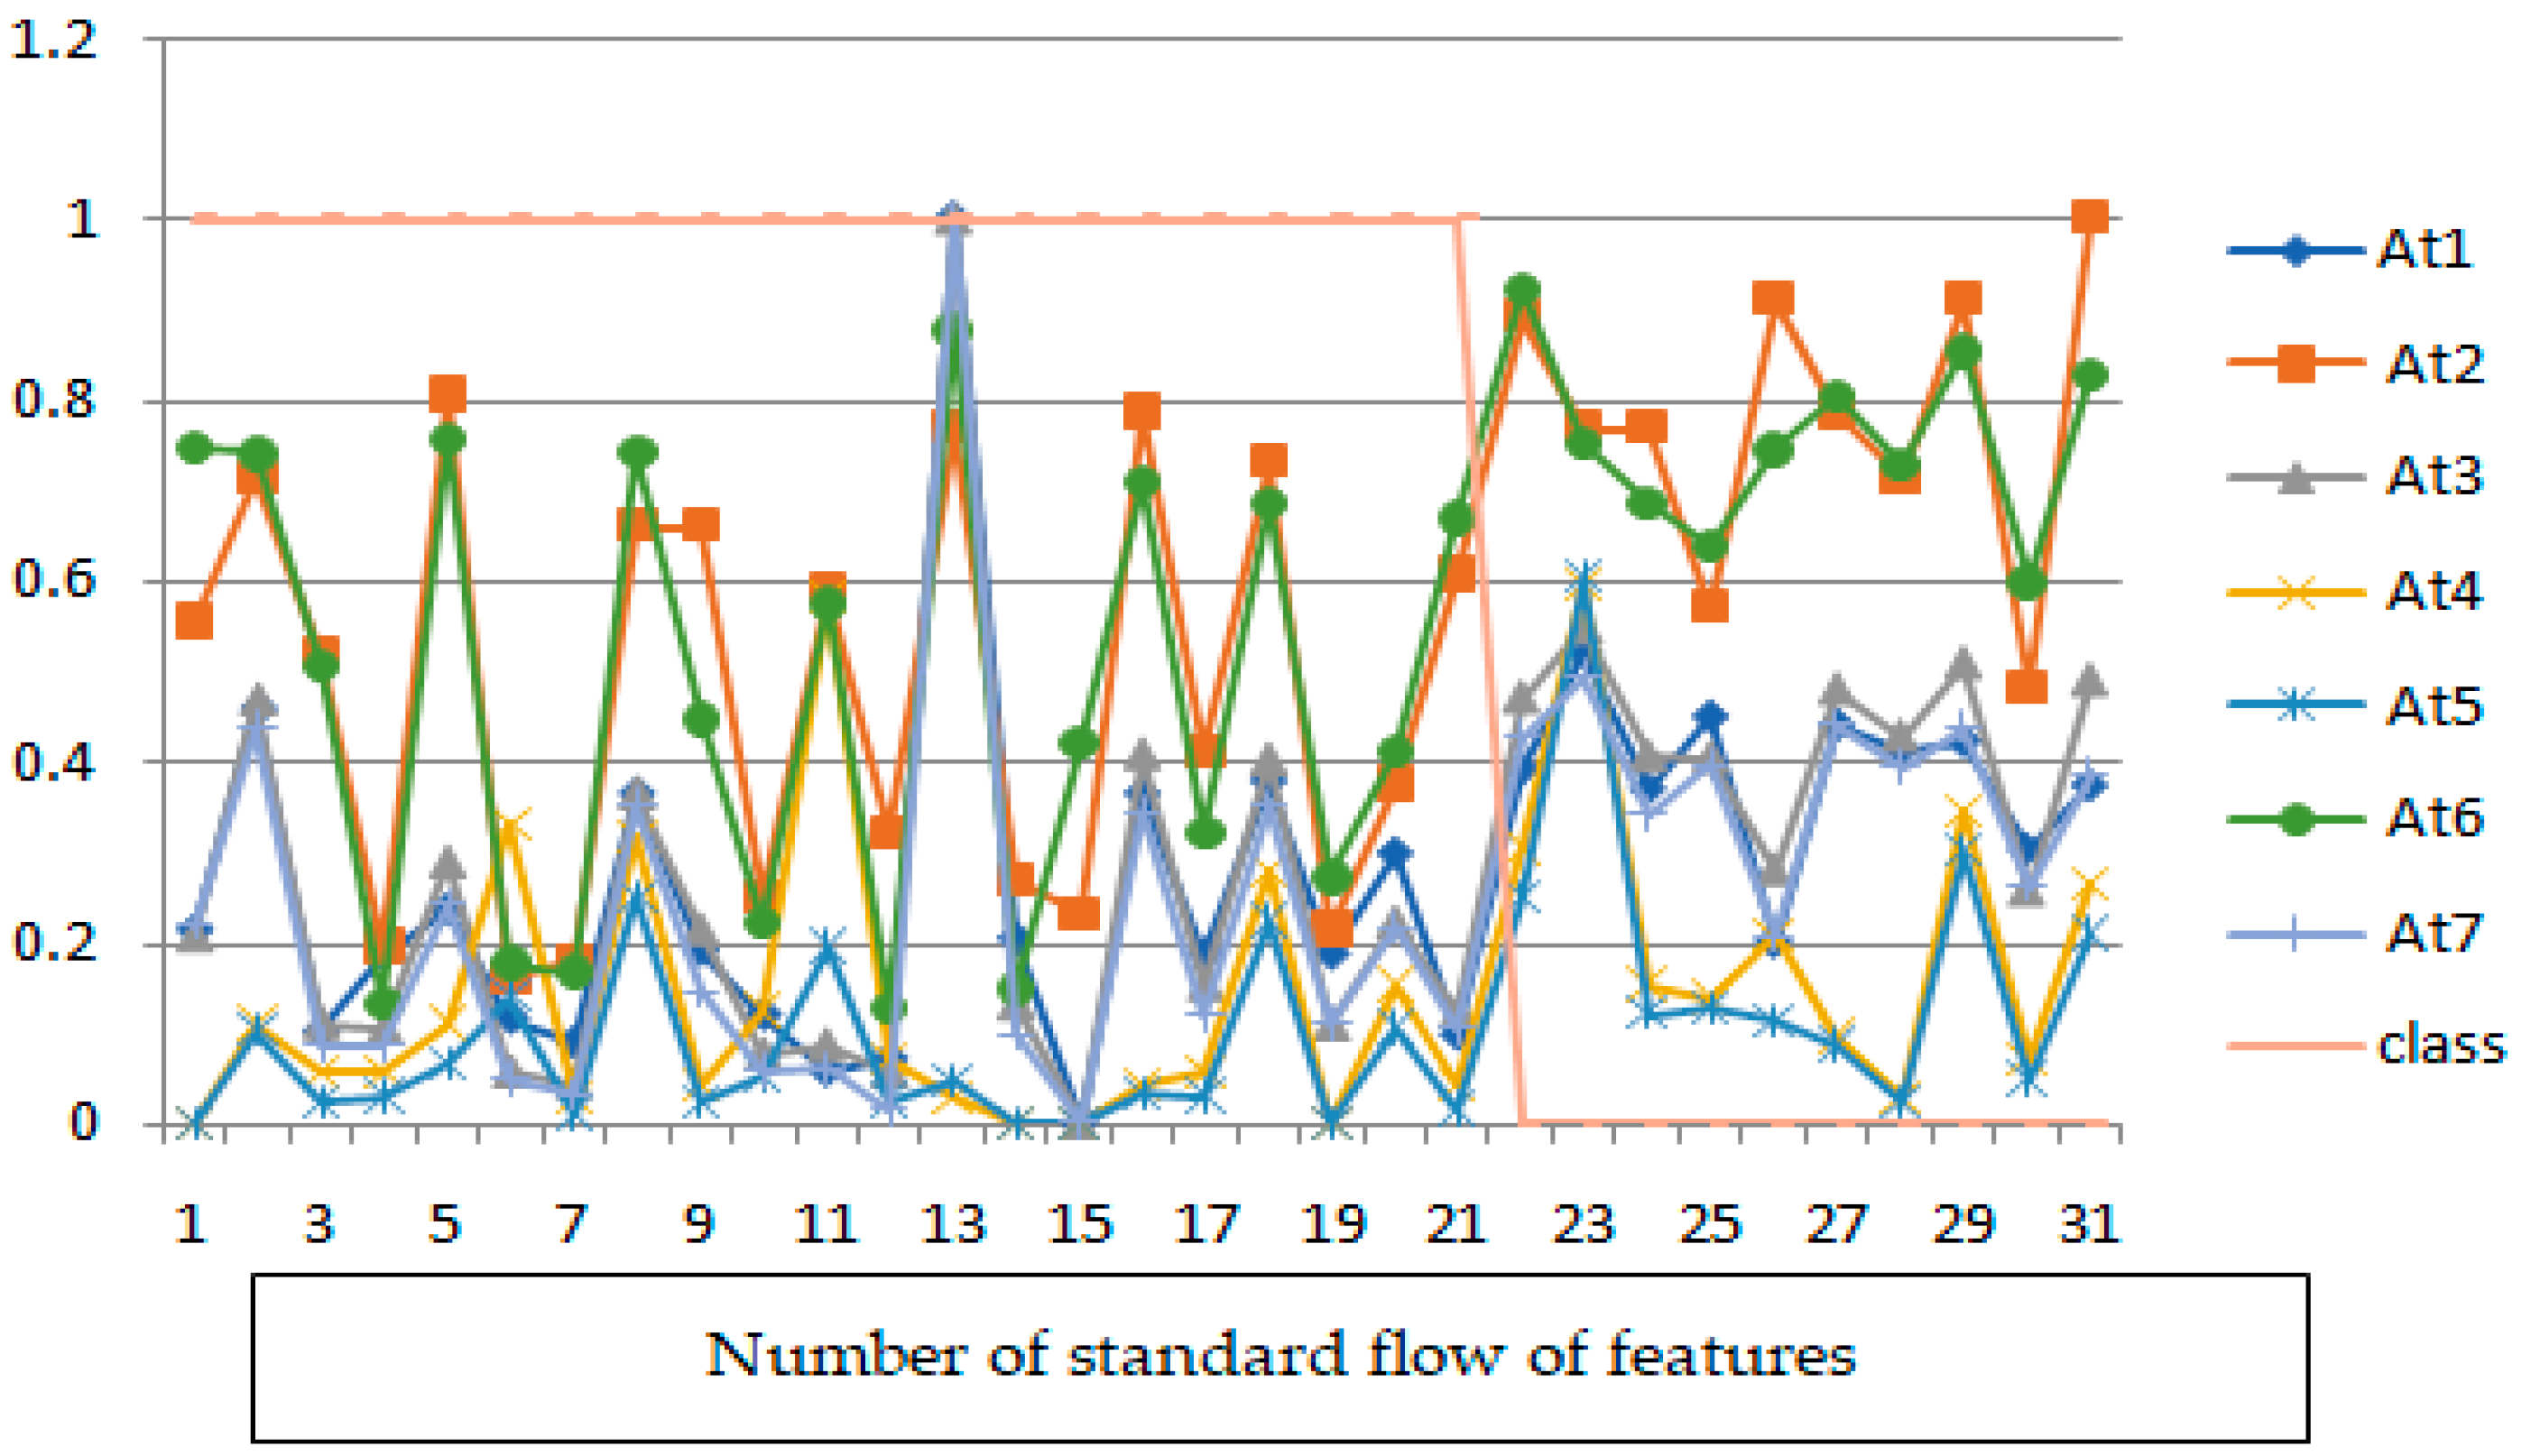
Figure 3b, is to extract data from the target sources, which are typically heterogeneous and include transaction databases, business systems, APIs, sensor data, marketing tools, and more. As we can see, while some of these data types are likely to be semi-structured JSON server logs, others are likely the structured outputs of widely used systems. Several methods of extraction are possible: There are two methods for extracting data: The simplest approach to retrieve the data is by partial extraction, which alerts the user when a record has changed. With update notification, systems can still recognise the records that have changed even though not all of them can send out messages when an update happens. There are many features in the dataset that we encounter while building a machine learning model for a real-life dataset, but not all of these features are always crucial. When training a model, adding unused features causes the model to be biased, more complex, and less accurate overall. Even the adage “Sometimes less is better” applies to the machine learning model. Consequently, one of the crucial steps in creating a machine-learning model is feature selection. Its objective is to identify the ideal combination of features for creating a machine-learning model [
32].
3.1. Markov Chain Model
The Markov chain model is a method for determining the likely location of a point subject to random movements, given the probabilities (which remain the same at each step) of moving that point a specific distance in a specific direction. Random walks, in which future behavior is unrelated to historical behavior, are examples of Markov processes. An illustration of this is the drunkard’s walk, in which a point at the Euclidean plane origin moves a unit every time a unit of time passes, with the direction of motion fluctuating at random along the way. Determining the probability distribution function of the distance between the point and the origin after a set amount of time is the problem at hand. A Markov chain is a stochastic model created by Andrey Markov that illustrates the probability that a sequence of events will occur based on the circumstances of the first occurrence. It is a widely used model that is both well-liked and easy to understand in industries such as finance that deal with sequential data. To determine which links to display first in its search results, even Google’s page rank algorithm employs a type of Markov chain. This mathematical model makes predictions about the future using our data as input.
A Markov chain model needs the transition matrix and beginning state vector, two crucial pieces of information. The symbol for this is “P”. This NxN matrix represents the probability distribution for the state transitions. It is clear that a matrix is stochastic if the probability total in each row is equal to 1. Adirected, linked graph may be used to construct a transition matrix. For an edge linking two nodes, each matrix component would stand in for a probability weight.
The fundamental mathematical assumptions of the model, as well as their inherent simplicity, provide the solution. Every hidden Markov model is based on the premise that the factors or internal states that affect the events we see are not directly visible. This characteristic’s wide applicability is also the origin of the name’s secret element. We simulate the evolution of the aforementioned hidden states over time, but the Markov component results from how we do this. Because we employ the Markov property, a firm presumption that the process of creating the observations is memoryless, so the subsequent hidden state is solely dependent upon the previous one. The probabilities of moving from one state to the next are known as transition probabilities in this type of model, which is also referred to as a Markov chain. Usually, a transition matrix is used to define these probabilities. The transition matrix in our illustration would be Equation (1):
Also, let us add some mathematical notation. We have a series of observations O=O 1, O 2,…, O T for T time steps, or in our example, the number of days speaking to Bob. A, B, and pi, which we can shorten to theta, are the additional three parameters that make up our model. The question, “What is the probability that this particular model generated the given sequence of observations?” can therefore be stated as:
To start answering this question, consider a specific sequence of hidden states
S that generated the sequence of observations. For instance, one possible hidden sequence is
S = ? In light of
S, what is the probability of observing this observational sequence if we have three days’ worth of observations with the formula
O = (PURCHASING HIGH, low, neutral)? We simply need to multiply the odds of seeing a particular observation O given the hidden state at time st:
By looking up the specific emission probability in B for each hidden state in the sequence, this can be easily calculated. This would be for the example
S 3 =:
3.2. Moment Generating Functions
The standard moment-generating functions of random variables and associated probability distributions are known to not exist for all distributions and/or at all sites, according to
Figure 3. However, in the instances when they do exist, exceedingly difficult and drawn-out manipulations are required for the evaluation of greater central and non-central moments. This work proposed the generalized multivariate moment-generating function for a few random vectors/matrices and associated probability distribution functions due to the simplicity and adaptability of traditional/conventional moment-generating functions. The new functions were developed for the multivariate gamma family of distributions, the multivariate normal distribution, and the semantic distribution as a binomial expansion of the expected value of an exponent of a random vector or matrix about an arbitrarily chosen constant. The functions were used to generate moments of random vectors and matrices as well as their probability distribution functions. The results were then compared to those from conventional methods that are currently in use. It was found that the functions produced the same results as the conventional/traditional methods; additionally, they generated both central and non-central moments in the same straightforward manner without necessitating additional laborious manipulations. They also provided more information about the distributions, for example, whereas the conventional method gives skewness and kurtosis values of 0 and 3, respectively, for
p-variate multivariate normal distribution, the new methods gives ((0)) (p1). The functions were used to generate the moments of random vectors, matrices, and their probability distribution functions. After that, the conclusions were contrasted with those from the currently in use traditional approaches. For a continuous multivariate random variable, Y = Xc, about a constant vector or matrix, the generalized moment generating function is designated as G n (c;).
Assume that Y = Xc and cR are two (p, p) square matrices or (p, p) column vectors, respectively.
Equation (1) may be read as the moment-generating function of
about
and may be evaluated with the Maclaurin’s series expansion as in Equations (6) and (7),
The coefficient of in the (n = 0)(t’)n/n coefficient in Equation (2)! The nth moment of the random variable Y = Xc is generated by G n (c), also known as the Multivariate Generalized Moment Generating Function. It can generate any Xc regarding any moment that can be imagined. In the case where c = 1, = 0, and n = 1, Equation (8) clearly produces the first moment of X near zero, also known as the distribution’s mean.
If
,
, and
, we have from Equation (2) that
. That is:
Higher moments of the distribution of
are similarly obtained by varying the value of
accordingly.
In essence, there are two interpretations for this. First, the MGF of X grants each of us X moments. It is referred to as the moment generating function for this reason. Second, the MGF is the only factor that influences the distribution (if one exists). To put it another way, if two random variables have the same MGF, then it follows that they must have the same distribution. The MGF for a random variable may therefore be used to determine how it is distributed. We shall demonstrate the utility of this approach by working with the sums of many independent random variables. Let us examine these in further depth:
Consequently, P(t) is established when E(|t|N). The probability density function can be used to write the probability generating function in a clear and concise manner.
Consider that N has a probability generating function P and a probability density function f. To generate the Generalized Multivariate Moment Generating Functions for the multivariate gamma, normal, and probability distributions, G n (c), we will first develop the distributions themselves. Let X be a multivariate gamma distribution of positive-definite real pp matrices with scale, shape, and scale parameters (a positive-definite real pp matrix). X’s probability density function (PDF) is then provided as in Equations (11) and (12):
Now, applying Equation (3), the generalized moment-generating function for the gamma family of distributions is developed as in Equations (4) and (5).
Where gamma p is a multivariate function, the multivariate gamma distribution decreases to the Wishart distribution with sample size equal to the shape parameter, =/2, and the scale parameter, =2.
As a result, there is a close relationship between the moment generating function of X and the Laplace transform of the probability density function f. Differential equations, in particular, frequently employ the Laplace transform, which bears Pierre Simon Laplace’s name. The basic inversion theorem for moment generating functions asserts that if M(t) for t in an open interval near 0, then M entirely affects the distribution of X. This is similar to the inversion theorem for Laplace transforms. Therefore, if two distributions on R have moment generating functions that are identical (and finite) in an open interval around 0, then the distributions are the same [
33].
As a last step, calculate the mgf for some of the more important (named) random variables. The main tool in the case of a continuous distribution is the fundamental theorem, which we employ with the function
We believe it to be fixed, so that
The coefficient of in Equation (9) is the mean of the distribution while indicates that the dimension (number of variables) of the distribution is .
This collection of things may be mathematically represented as a transaction vector T in an M-dimensional space (where M is the total number of items). The database B0 is made up of some transactions T. The sets of objects in a database serve as representations for the many patterns that exist there. These patterns are frequently prevalent. The FP is described per the format below. One begins by selecting a random occurrence threshold of either 0 or 1. A pattern is considered common if it appears in the database f times but 0 times. The FPs have two distinguishing characteristics. Following conventional definitions [
5], we define a database, Bm, that is dependent on the element mx.The conditional database, Bm, is contained in the database B0 and is constructed according to the following rules: Choose from the database, B0, all columns that contain the element mx (in the row m). Then we remove all rows with numbers i m≤. The set of all possible patterns of elements for the arbitrary database, Bk, will be denoted by [Bk]. By a pattern we denote the tensor product … lj k x xx. The frequency of this pattern in the database, Bk, we define as lj k … f. Then, the set of all patterns, [Bk], can be represented as a sum of flj k l j k …( xx x … ).
A retailer can understand what is frequently purchased together by identifying frequent itemsets. Particularly significant are pairs or bigger groups of things that appear far more frequently than would be anticipated if the items were purchased separately.
For now, let us just think about the search for common itemsets. We will talk more about this part of the problem in
Section 3. This research will show us that many people buy milk and bread together, but this information is uninteresting because we already knew that bread and milk are often consumed separately. There is a chance we will find that many consumers purchase mustard and hot dogs together. Again, those who enjoy hot dogs shouldnot be surprised by that, but it presents the grocer with an opportunity to pull off some creative marketing.
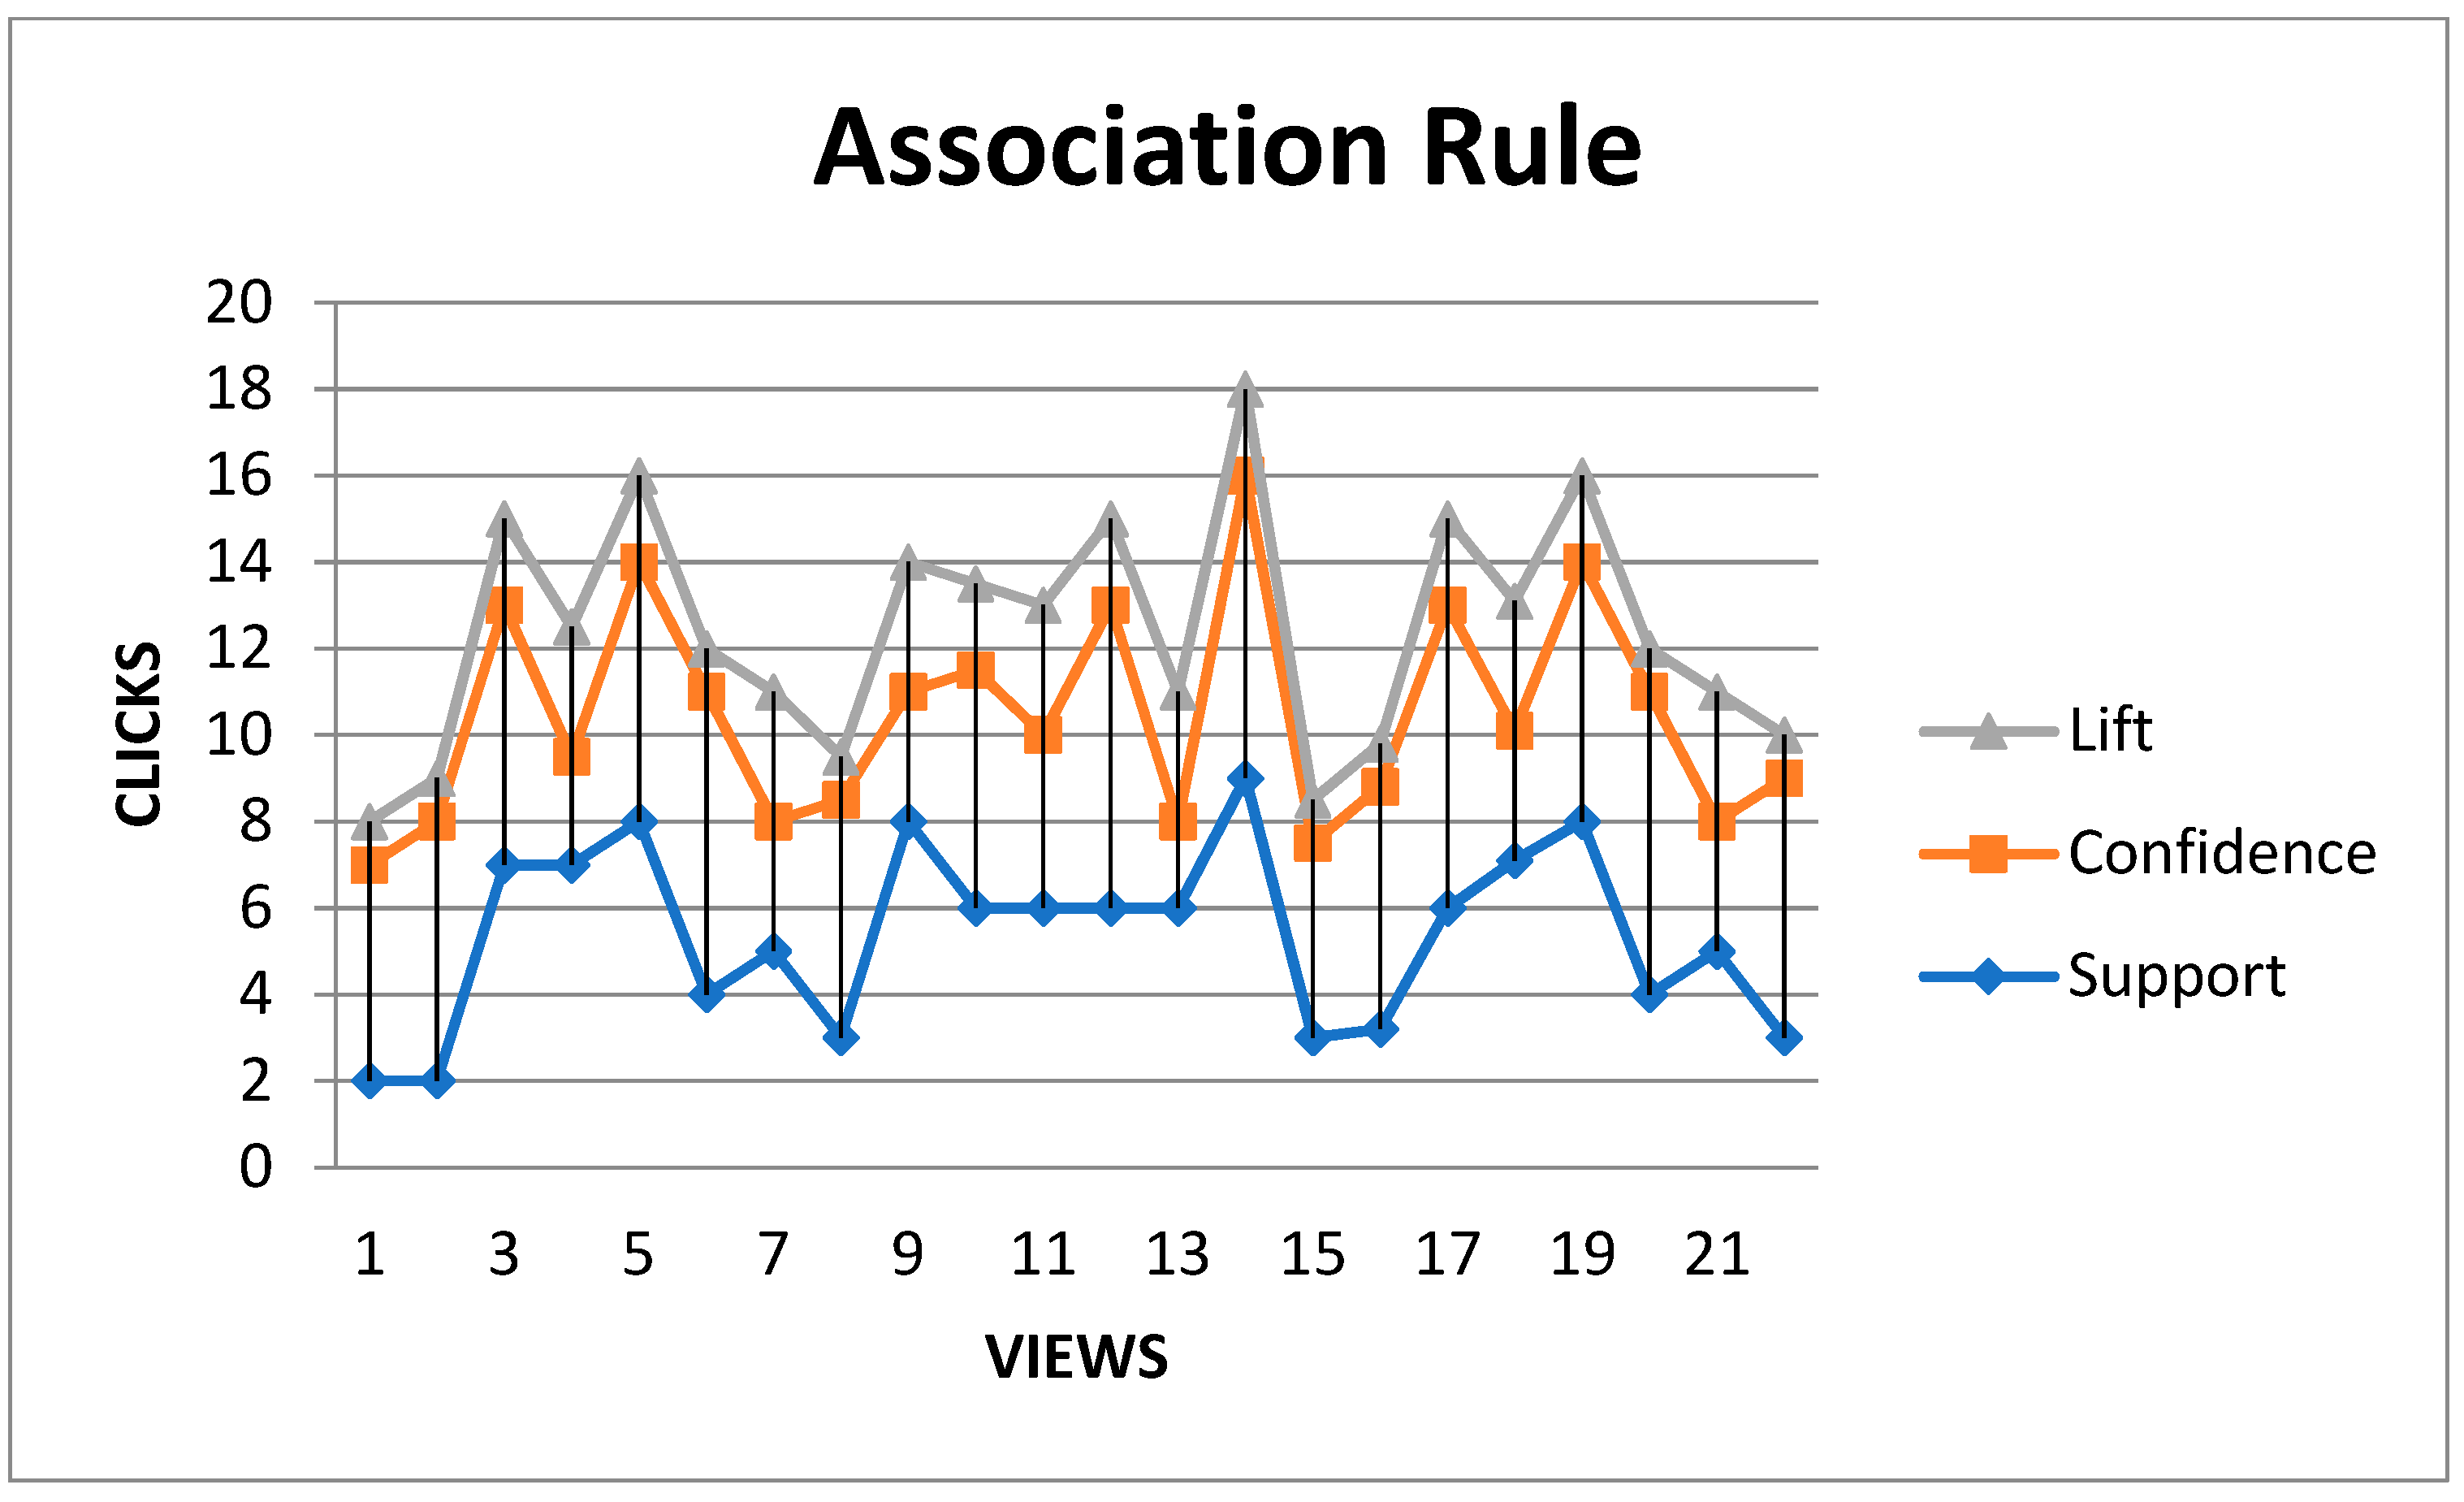
Assume we have identified all itemsets that have support levels that are above a certain threshold and that we have estimated the precise support for each of these itemsets. All of the association rules with strong backing and widespread adoption can be found in them. Specifically, if J is a group of n items that are shown to be common, then for this collection of things there are only n feasible association rules, namely J jj for every j in J. If J is frequent, then J j must also be frequent. Hence, because we previously calculated the support of both J and j, in a common itemset. The confidence in the Jjjj rule is expressed by their ratio [
33].
3.3. The Triples Technique
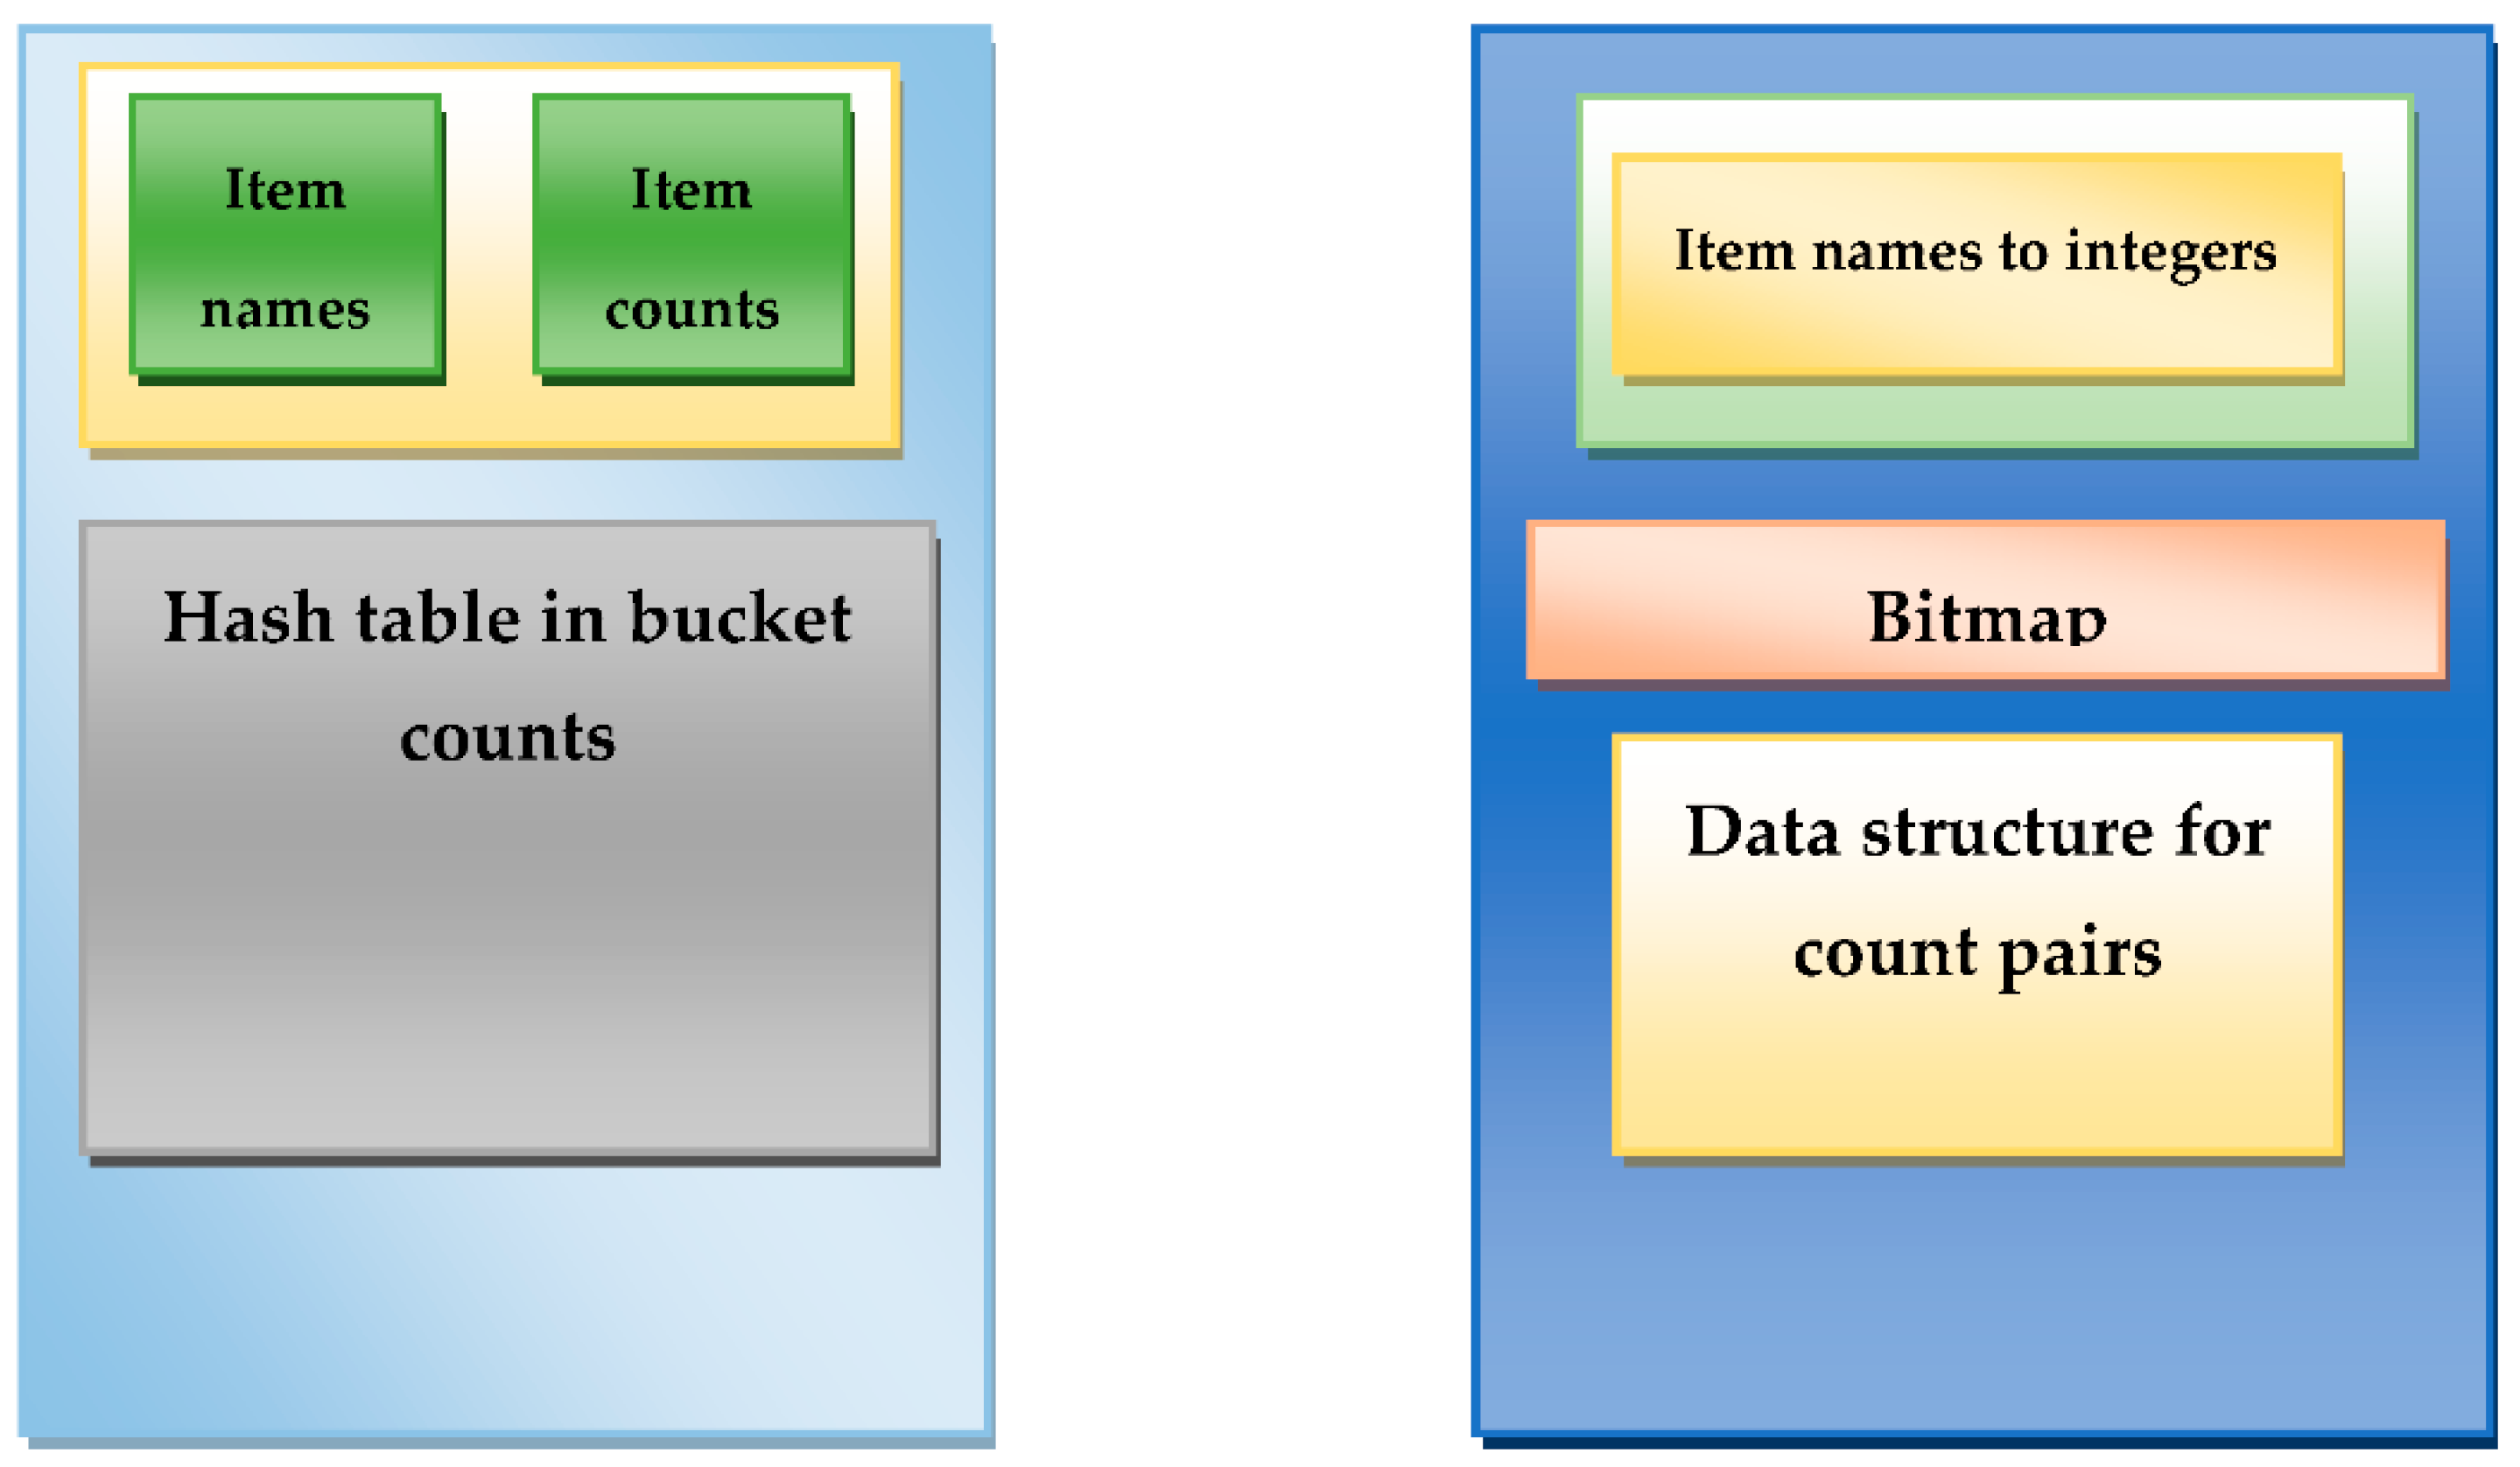
Depending on the percentage of possible pairs of things that actually appear in a basket, another method of storing counts may be more appropriate. Counts can be stored as triples I j, c], which means that the count of a pair I j] with the I j is c. With the help of a data structure, such as a hash table with I and j serving as the search key according to
Figure 4, we may rapidly determine whether a triple exists for a particular pair of I and j. This way of storing counts is known as the triples method.
All of the pairings are generated using a double loop. Each pair is hashed, and the bucket containing the hashed results is then rounded up to 1. It should be noticed that the pair does not affect itself; rather, it only affects the single integer in the bucket. After the first pass, each bucket has a count, which is the sum of the counts for each pair that hashes into that bucket. A frequent bucket is one whose size exceeds the support threshold s whenever a bucket’s count is incorrect. Regarding the pairs that hash to a bucket frequently, however, the candidate pairings are not counted in the multistage’s second run. Instead, it uses a different hash function and another hash table in the main RAM that is available. The second hash table has nearly as many buckets as the first since the bitmap from the first hash table consumes 1/32 of the available main memory [
34].
Let us say that the hash keys are positive integers. Picking h(x) = x mod B, or the remainder after dividing x by B, is a popular and straightforward hashing operation. If population of hash keys only contains positive numbers, then that option works nicely. Each of the buckets will receive 1/Bth of the integers [
35,
36].
However, it is assumed that B is equal to 10 if the population consists of even numbers. Only the buckets 0, 2, 4, 6, and 8 can then be the value of h(x), and the behavior of the hash function is nonrandom. However, if we used B = 11, we would discover that 1/11th of the even integers is transmitted to each of the 11 buckets. In this case, the hash function would be effective. Let us approach this right now from a completely different angle. Instead of examining the features of the products to gauge how comparable they are, we focus on how similar the customer reviews are for the two products. We use a product’s utility matrix column as its vector rather than the item profile, in other words. Furthermore, rather than using their rows to represent people, we generate a profile vector for each user. Some claim that users can be compared if they have vectors that are close to one another as measured by a distance such as a cosine or Jaccard distance. Users who are most similar to you are then utilized to develop you from this network of individuals. Advertising goods that these customers want to buy while retaining skepticism Having grouped things to a degree, we can reexamine the utility grid so the segments address groups of things, and the section for client U and bunch C is the typical rating that U provided for those individuals from bunch C that U evaluated.
We can utilize this amended utility framework to group clients, again utilizing the distance measure we consider generally proper. Utilize a grouping calculation that again leaves many bunches, e.g., half however many groups there are clients. Revise the utility lattice, so the columns compare to groups of clients, and the segments relate to bunches of things. Concerning thing bunches, process the section for a client group by averaging the evaluations of the clients in the bunch. Presently, this cycle can be rehashed a few times on the off chance that we like. That is, we can bunch the thing groups and again consolidate the sections of the utility grid that have a place with one bunch. We can then go to the clients once more, and bunch the client groups. The cycle can rehash until we have an instinctively sensible number of bunches of every sort [
37].
To reach a local minimum given a starting value for U and V, we must choose which order to visit the U and V elements. It is simplest to choose a row-by-row arrangement for the elements of U and V. and alternate between each of them. Remember that just because we improved once does not mean we will not be able to obtain a better value for it later on after other aspects have changed. So, until there is no longer any reason to believe that there is room for improvement, we must frequently revisit some areas. Alternatively, we can select the component to be optimized from a variety of optimization pathways [
38].
From Algorithm 1, most rows are of type Z since the matrix is sparse. But SIM(S1, S2) and the likelihood that h(S1) = h are both determined by the ratio of the types X and Y rows (S2). Let us assume that there are x rows of type X and y rows of type Y. SIM(S1, S2) is thus equal to x/(x + y). The cause is that S1 S2 has a size of x, and S1 S2 has a size of x + y. Consider the likelihood that h(S1) = h now (S2) shown in algorithm lines 1 to 4. If we start at the top and pretend that the rows are randomly rearranged, the likelihood that we will encounter a row of type X before a row of type Y is equal to x/(x + y). Alternatively, if the first row we see is a type Y row rather than a type Z row, the set with a 1 receives that row as its MinHash value shown in algorithm line 5–8. The set with a 0 in that row, however, will undoubtedly move down the permuted list by one row. So, if we encounter a type Y row first, we can infer that h(S1) 6 = h(S2). We come to the conclusion that the Jaccard similarity of S1 and S2 and the likelihood that h(S1) = h(S2) is x/(x + y).
| Algorithm 1: Pseuducode of transactional association with minimized error rate using KMP algorithm |
Input: N (Department ID, Product ID) float number < 1
Output: User and product segmentation based on search pattern (n = 1.2.2…)
Procedure
Initialize Pre- processing
KMP search {n − 1}
While for every search Association of item 1,2…n)
Execute (Apriori algorithm)
Init. Grouping and clustering
For every Manhattan and Eucledian distance vector (x + 1).
Calculating Number of views, number of visit, number of purchase, number of product recommendations
Initialize collaborative filtering algorithm.
Sort products
n- length (10,10),
While q/0 = I = 1
Print ‘pattern occurs’ |
3.4. KMP Algorithm
The prefix function’s values can only rise by a maximum of one, which is the first crucial finding. Indeed, then we can delete the final character from this suffix ending and place it in position with the length. As a result, we obtain a contradiction and a suffix ending in position with the length, which is preferable.
The illustration that follows shows this contradiction. The longest appropriate suffix in the position that also serves as a prefix is, and that suffix is of length. The string is therefore equal to the string, implying that both the strings are equal and must therefore be. We write a string that contains a separator that is not seen in either or. Let us find the prefix function for this string. Think about the meaning of the prefix function’s values now, excluding the first entry. By definition, the value shows the substring that is the longest and ends at the same place as the prefix. Here, we talk about two issues simultaneously. The first variant of the issue asks us to count the instances of each prefix in the same string. A different text is given in the second iteration of the issue, and we are asked to count the instances of each prefix [
39]. We start by fixing the first issue. Think about the positional value of the prefix function. By definition, this signifies that there is not a larger prefix that comes after this definition; instead, the prefix of the string’s length starts at the position and stops there. Additionally, shorter prefixes may finish in this location. Now suppose that cannot be divided by. We demonstrate that this indicates the duration of the response. Contradiction serves as proof. If the query has a response and the compression is long (divides). Consequently, the final prefix function value must be bigger than, meaning that the suffix will only partially cover the first block. Now take a look at the string’s second block. All of the characters in the block must be the same because the prefix and suffix are equal according to
Figure 5; they both cover this block, and their displacement from one another does not split the block length (does otherwise). A single character is then repeated throughout the string [
39].
4. Results and Discussion
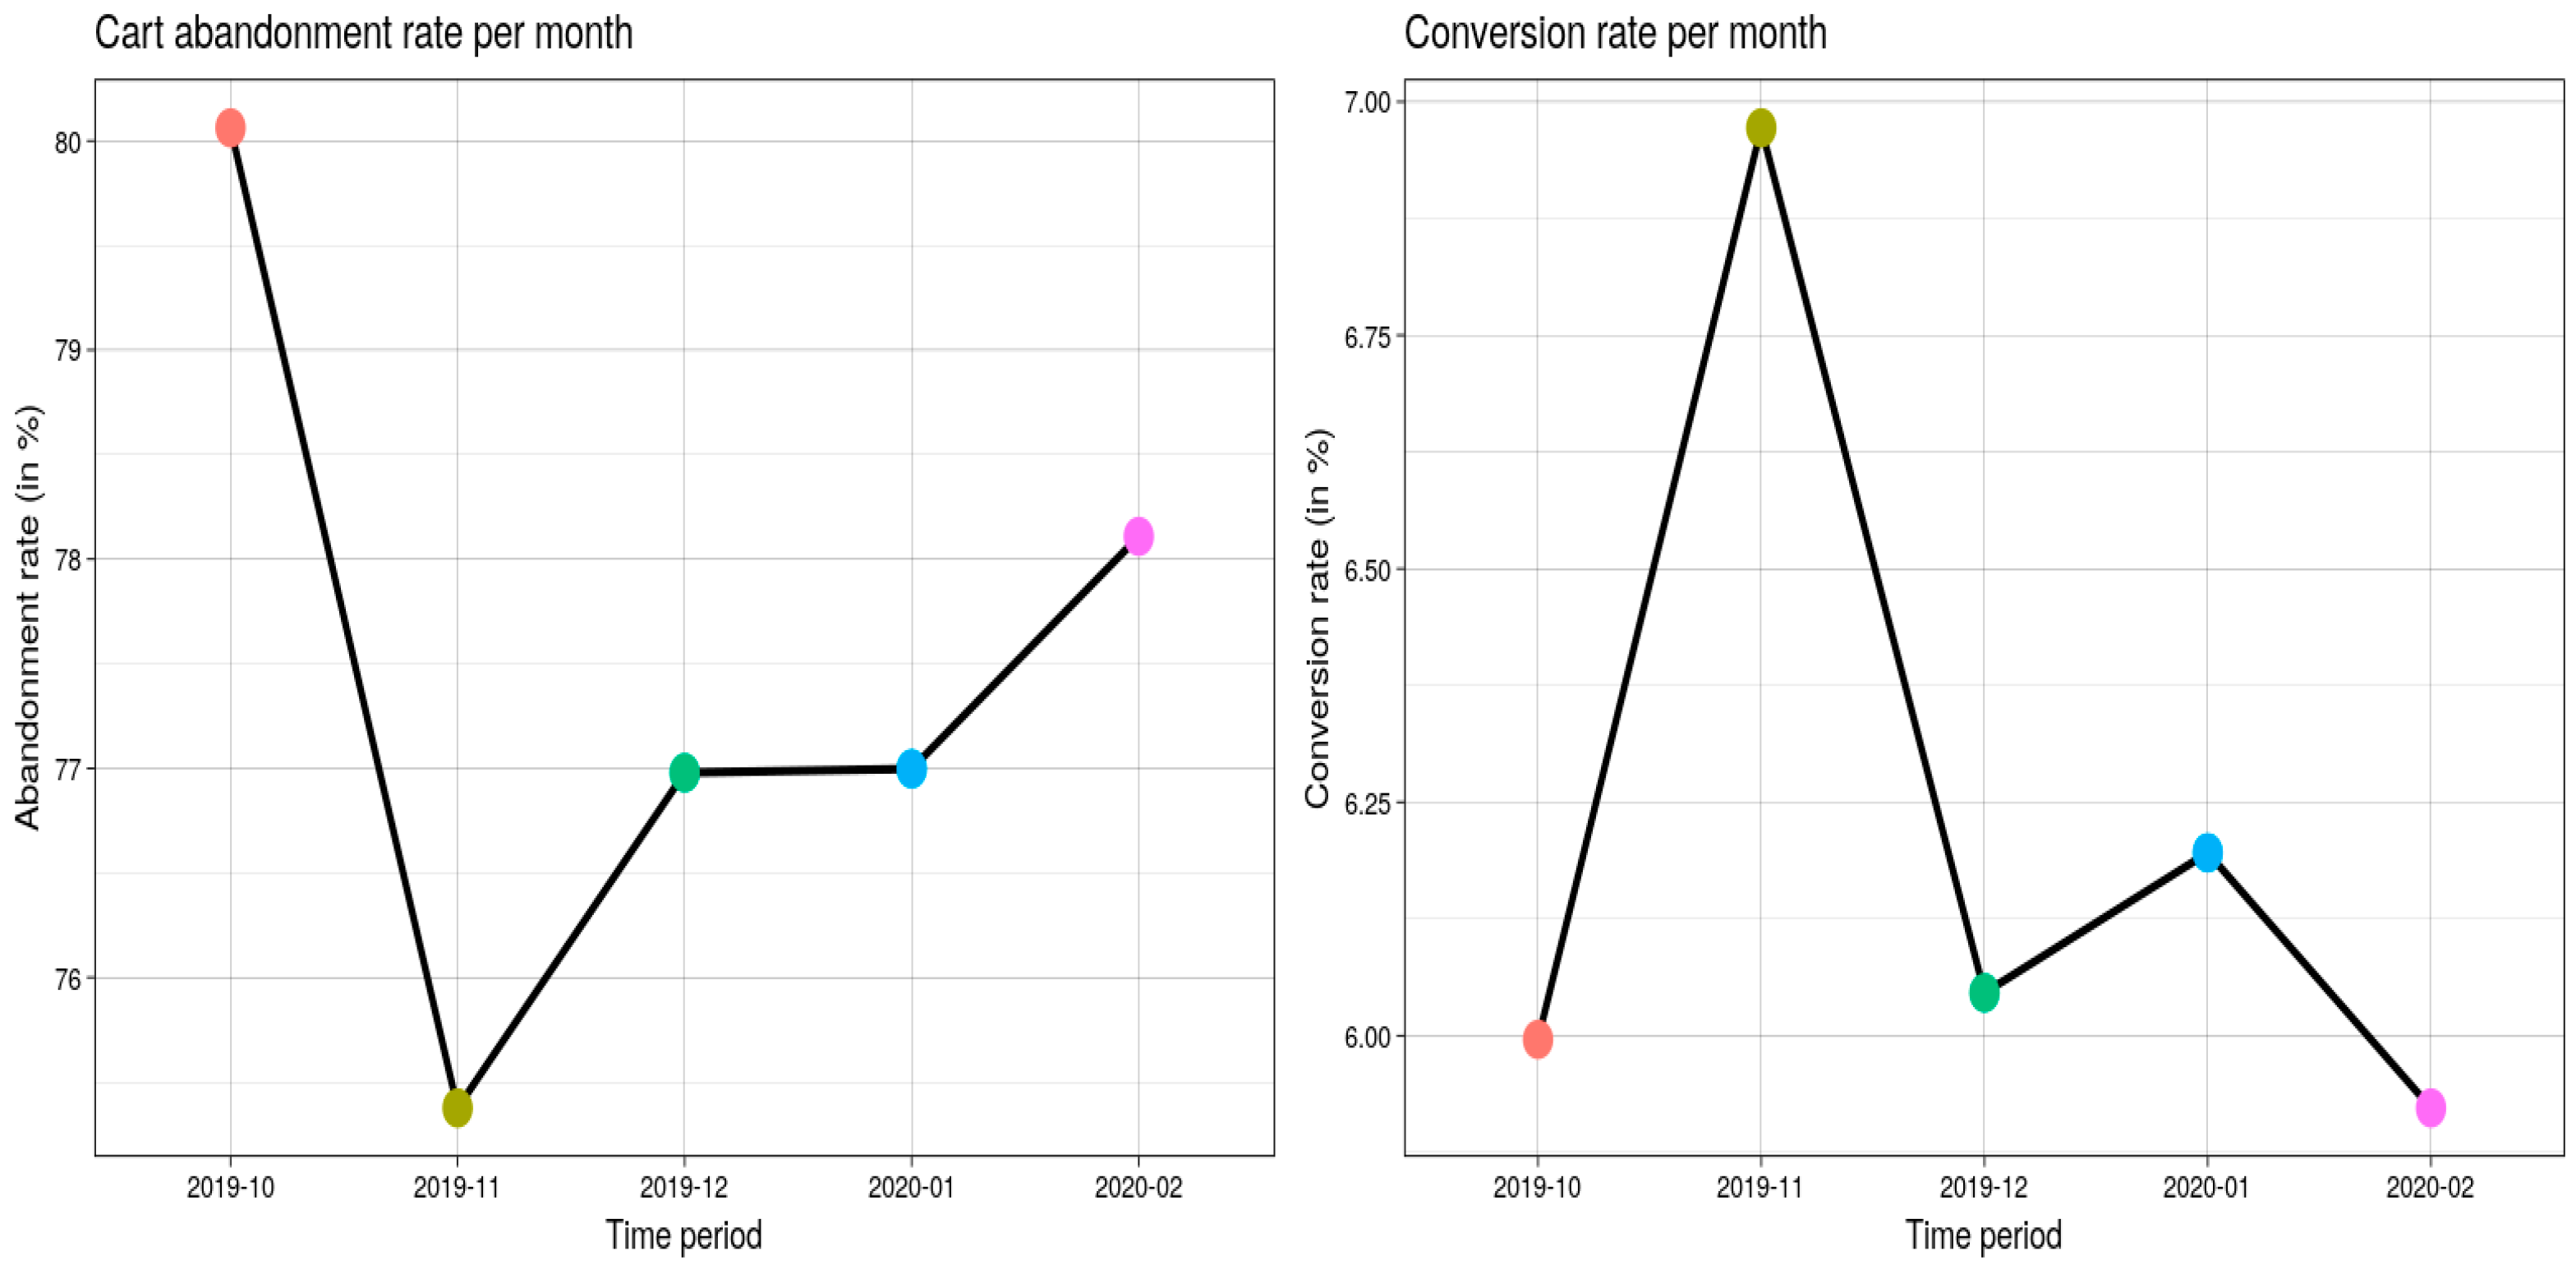
The “shopping cart abandonment rate 1” measures the proportion of customers who added items to their carts but removed them before making a purchase, and it represents potential customers who were almost at the top of the sales funnel before giving up for whatever reason. This pricing serves as an example of the checkout process’s possible benefits. The conversion rate 2 is the overall proportion of website visitors who stayed and successfully finished a transaction. According to
Figure 3, the typical conversion rate and cart abandonment rate for the cosmetics industry are 5.2% and 67%, respectively.
From
Figure 6, there is a reasonable expansion in transformation rates (6% to 6.9%) and a decline in cart surrender rate (80–72.5%) from October to November 2019. The pattern appears to change post-November, decisively. The cart deserting rate expanded before very long; however it did not cross the 80% good grade and rather remained at 78% as of Feb 2020, while the transformation rate had fallen beneath the record-breaking low towards somewhat above 5.75%. The general pattern of better-than-expected transformation rates could be because of different reasons, one of which could be a medium-estimated business would receive lower traffic yet somewhat more steadfast clients. Large companies exhibit this trend, such as Taobao, whose conversion rate is about 1% even though it is one of the world’s largest online commercial organizations with a strong customer base. The next step is to reduce the rate of cart abandonment, which indirectly affects change rates. This high rate may indicate a less seamless insight into the examination method, a high shipping cost, a week’s advancement in remarketing, or the absence of visitor examination capacity as shown in
Figure 7.
The use of inferential statistics or measures of statistical significance is a final point to think about when comparing web metrics across referring site types. Since these analyses compare sums and averages across categories, it may be tempting to employ
t-tests, ANOVAs, chi-square tests of independence, and other statistical tests that allow researchers to conclude larger populations of data (such as all URLs that referred to web traffic) from a smaller sample. These kinds of statistics, however, are inappropriate if all sites have been categorized in a web analytics report on unpaid referrals because it is not working with a sample but rather a census of every single site that sent visitors to the organization’s website. Inferential statistics would only be required in one circumstance in these studies as shown in
Figure 8 [
40,
41].
From the following customers, each user may be distinguished by a key (tabular data). For the top 10 clients who brought in the most money, plots are displayed in
Figure 9. More than INR3500 was produced throughout the course of the 5 months. Over the course of five months, customers’ average willingness to spend over INR 1000 suggests that the business has a solid client retention strategy. Retention analysis is equally as important as conversion rate in terms of maintaining clientele and transforming the company to the “new norm”.
From the following
Figure 10, we can conclude the effect of the price of the product on each of the funneling sectors. It is evident that customers generally view high-range products but purchases always take place within the lower-range products. This speaks of what a customer eyes but is not able to purchase due to factors indicating high selling prices, suggesting either that these products are extremely overpriced or that they are all high-end products. This viewed product has the potential to bring in higher conversion rates and retention rates if offered in an eye-catching manner.
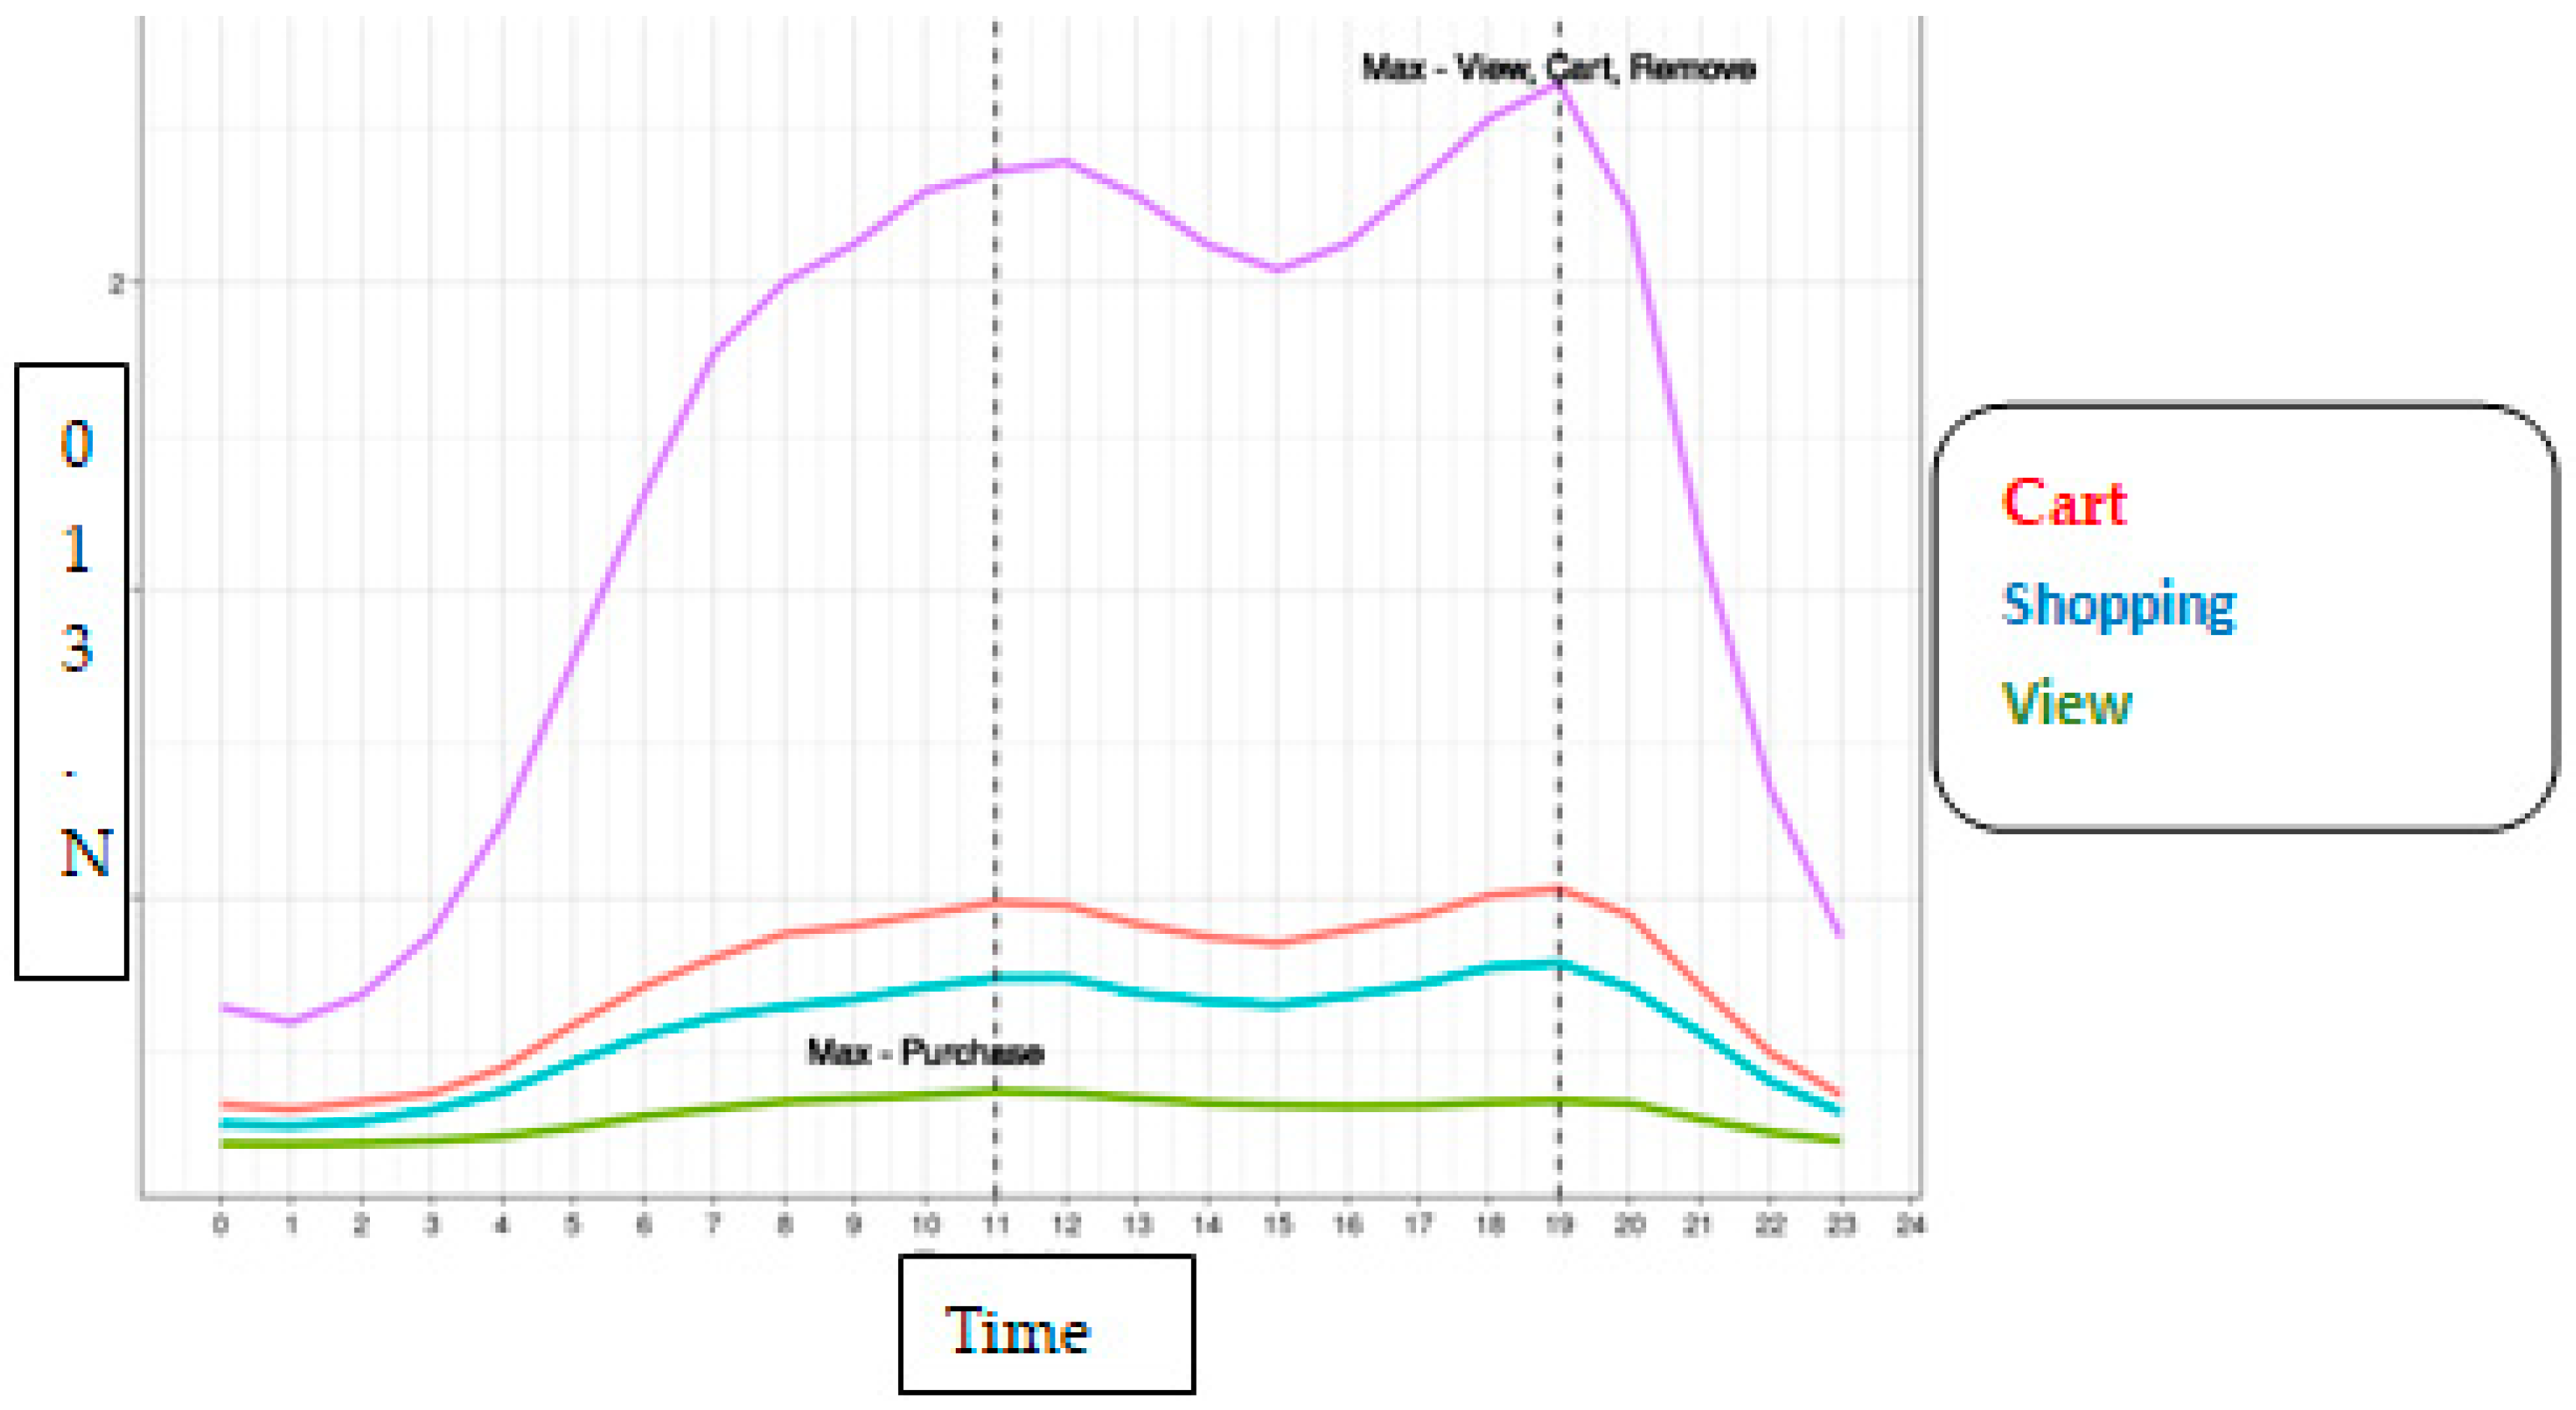
Additionally, it is surprising to see that most products are viewed, removed from the cart, and added to the cart at 7 pm, whereas the purchase is made at 11 am, suggesting that the morning hours especially during weekdays are reserved only to purchase the product and no other funneling sectors [
42,
43].
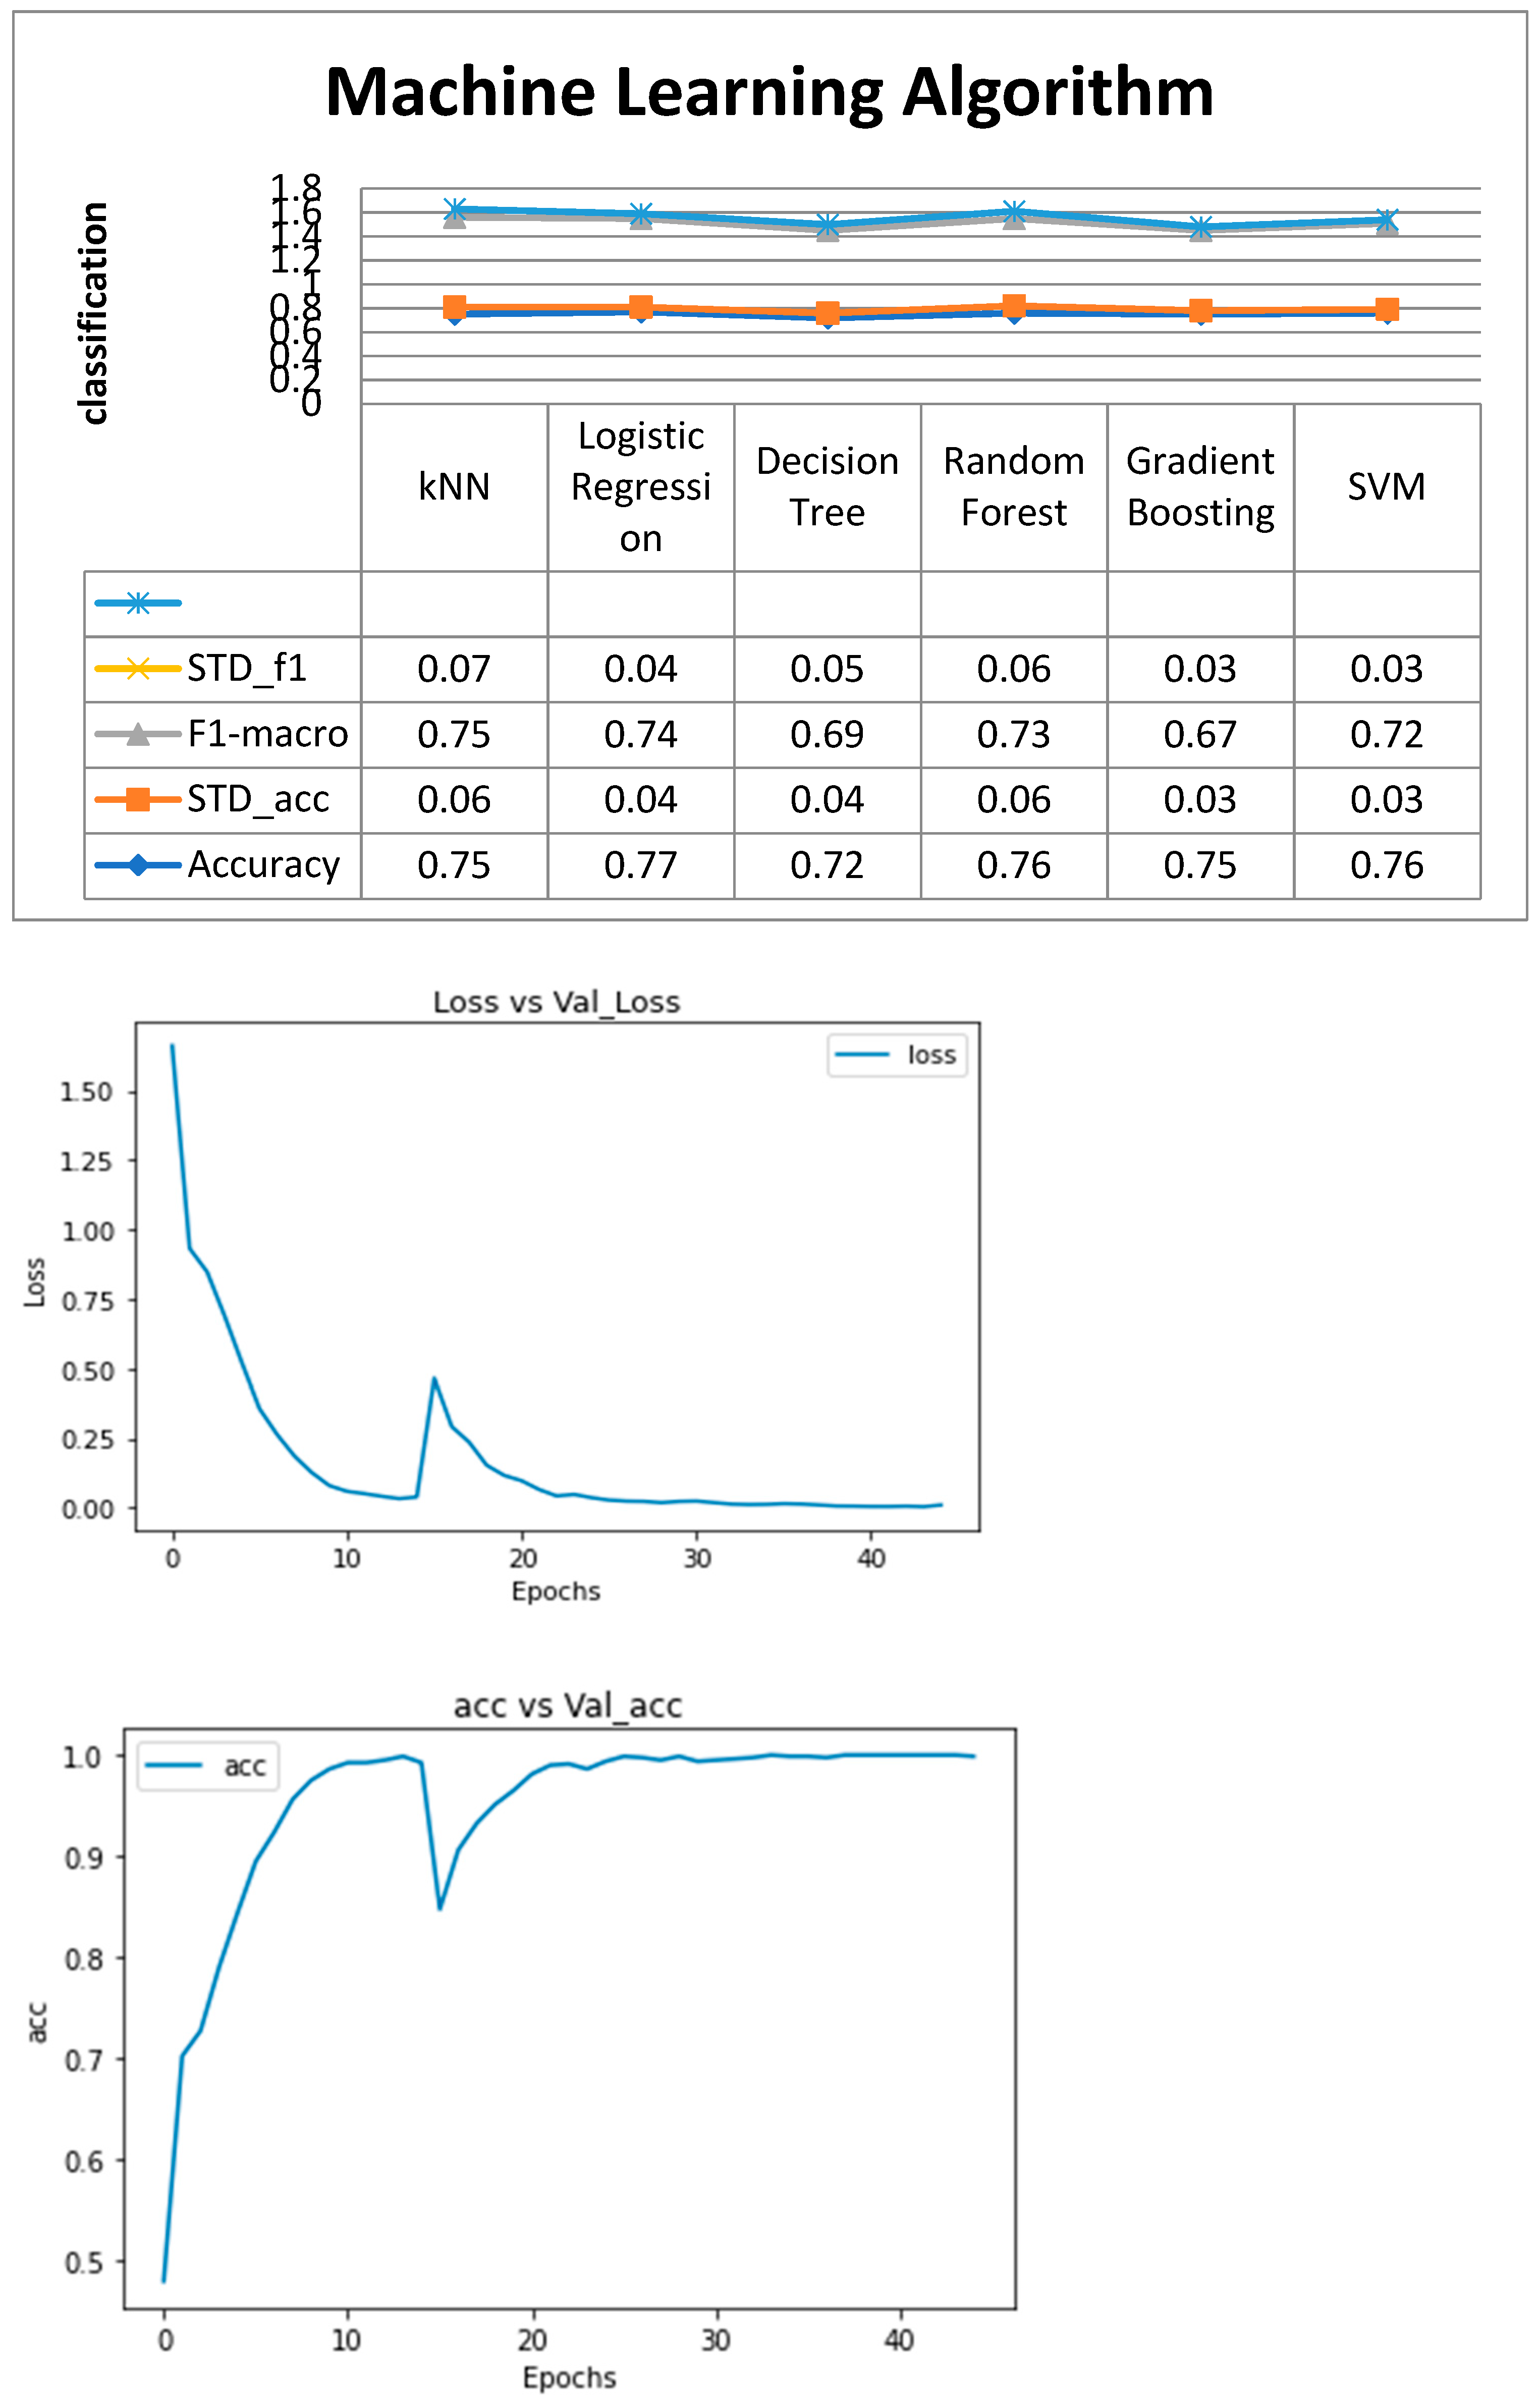
From
Figure 11, similar to linear regression, logistic regression is a good place to start when developing classification algorithms. Despite the label “regression” appearing, it is a classification model rather than a regression model. The binary output model is constructed using a logistic function. The logistic regression’s output will be a probability (0 × 1) that may be used to forecast whether the output will be a binary 0 or 1 (if x0.5, the output will be 0; otherwise, the output will be 1). We employ a non-linear sigmoid function at the end, thus we cannot utilize mean squared error as a loss function (such as linear regression). The gradient descent algorithm may be impacted by local minimums introduced by the MSE function.
So, in this case, loss function is cross entropy. For y = 1 and y = 0, two equations will be applied. The fundamental tenet of this argument is that if my prediction is wildly off (for instance, when y′ = 1 and y = 0), the cost will be −log(0), which equals infinite. The fundamental idea behind KNN is to look around the area, presumptively compare the test data points to them, and then determine the result. When using KNN, we find k neighbors and make a forecast.
While the k nearest data points are subject to a majority vote in KNN classification, the result in KNN regression is the mean of the k nearest data points. We choose odd numbers as k as a general rule. KNN is a lazy learning model in which computations are only performed when necessary. Regression and classification problems are solved using the decision tree, a tree-based technique. For generating the output, an inverted tree is built with those branches from a homogeneously distributed root node to a very heterogeneous leaf node. When a dependent variable has continuous values, regression trees are employed, and when the dependent variable has discrete values, classification trees are used. We employ information gain and entropy to determine the next characteristic for the Iterative Dichotomiser 3 algorithm. Entropy and information gain are represented in the equation below by H(s) and IG(s), respectively. The difference in entropy between parent and child nodes is calculated using information gain. As the next internal node, the attribute with the greatest information gain is picked. In
Table 2 we are showing a comparison of model with the existing state of the art based on a technique used and data set compatibility, the accuracy of the model, and inference which depicts use case compatibility. Fortunately, most website and digital ad designers can develop, execute, and run statistical analyses using a variety of software programs that are either free or relatively affordable (Google Website Optimizer is a popular example). The need for out-of-the-box software solutions to conduct complex statistics for websites and advertisements is partly due to the high level of experimental control over each variable (e.g., text, color, etc.) that is not available with offline PR. Instead, PR pros must rely on information that appears online “naturally” and credit or categorize it according to certain criteria (e.g., messages, themes, sentiment, word count, etc.). This indicates that, in comparison to other types of marketing, linking PR activities to web data requires a considerably more complex approach. The “encoding” is fixed by choosing a certain model to train on a set of data as a result of that model choice. Gerald Friedland, co-founder and CTO of Brainome, stated that an uncommon result of an experiment is more unexpected than a regular result of an experiment. All outcomes have the same surprise if they are all equally likely to occur. Many information-coding techniques, such as associating longer strings with more uncommon outcomes for compression, take advantage of Shannon’s explanation of quantification in bits. Each machine learning (ML) model that is applied should cover the following four areas: (1) training protocol and evaluation, (2) method, including method-specific hyperparameters (a method-specific parameter whose value is predetermined before training, such as the kernel or number of iterations), (3) optimization strategies and generalization techniques, and (4) replication, external validation, and testing. Many machines learning (ML) techniques are based on conventional statistical techniques, and the main distinction between a conventional statistical predictive model and ML analysis is frequently how a model is repeatedly trained with the goal of improving generalizability and performance. The original idea behind ML was to create tools that would automatically improve over time. Although this is still an ideal and not always the case, ML models still offer a tone of flexibility and can also combine in the
Table 2 comparison. Regardless of the technique employed, the features chosen for inclusion in the ML analysis and the criteria used to make those decisions should be reported for each data set. The number of subjects who were excluded from the analysis should also be made very clear. Reporting subject and feature disposition may take the form which clearly shows, starting with the entire cohort that is available, the number of patients excluded based on each criterion, the approach used at each stage, and the resulting subjects and features included in the analysis. Even if a data set contains all of the available features, the final set of features used in the analysis should be disclosed for complete transparency at the very least in the data supplement or analysis environment.
5. Conclusions and Future Scope
In the preceding paper, we showed how to forecast an e-commerce site’s usability using a variety of features and attributes, such as sorting, effectiveness, and engagement, as well as other quality and web stream mining attributes, such as the volume of frequent visitors and the number of visits. Analytics and the number of movies in the website’s event log both indicate that there were two movies. In this specific case of a cart, the suggested technique is 6% more accurate than the other sets of funds and the web-based mining big data predictive analytics algorithm. Users who use various supervised learning and quality methods, such as random forest, logistic regression, and naive bias, can achieve a 98.9 percent accuracy rate. Utilizing a variety of performances at risk evaluation techniques, the total log loss and entropy gain have been calculated. The various outcomes of the visibility criteria are displayed using a variety of visualization techniques. Measure score, recall, and accuracy have been used as benchmarks for the projected state of the art method. The reputation of the research field is maintained for the foreseeable future by this specific research area. For researching and analyzing the usability of e-commerce, a variety of inventive algorithms can be created. Deep neural networks and enhanced heuristic-based hybrid algorithms can be created to obtain a more accurate outcome based on the KMP algorithm. A website’s success cannot be determined by web analytics data alone. Those values need to be scrutinized further as KPIs and added to dashboards for a more thorough understanding, including considering factors other than the most fundamental ones, such as the number of website views and visitors, and instead the purpose and motivation for the website. Because it provides insight into how engaged visitors are, as well as whether or not they are behaving and moving in the manner anticipated, the evaluation of conversions will be encouraged. Integration of web analytics with other data silos will provide full 1:1 marketing performance. Historical and statistical data are used to conduct the analysis. This study found that the properties of the data are growing and changing every day. As a result, we need new models and algorithms to collect, store, process, analyze, and evaluate data in the area of e-commerce. The era of e-commerce and the availability of data in every sector of business in an enormous volume, which implies big data, are two of the key sources of competitive advantage for businesses in this digital age. To disclose the usability matrix representation form table is deduced where the matrix is sparse and the majority of the rows are of type Z. However, the ratio of the types X and Y rows determines SIM(S1, S2) as well as the likelihood that h(S1) = h. Suppose there are x rows of type X and y rows of type Y. x/(x + y) is the same as SIM(S1, S2). The size of S1 S2 is x, and S1 S2 is x + y, which is the cause. How likely is it that the algorithm line 1 to 4’s h(S1) = h (S2)? The likelihood that a row of type X will be encountered before a row of type Y is high if we begin at the top and assume that the rows are randomly rearranged.


