1. Introduction
We consider a finding of the minimum of a nonnegative transcendental function of several variables. This problem is solved in the case of approximation of experimental points by the least squares method in the class of nonlinear functions of several variables. Tasks of this kind are quite complex, and a possible way to solve them is to use one of the Monte Carlo methods [
1,
2]. In this case, we explore the entire area in which the global extremum is being searched. In the case of directed smooth optimization methods, the search is carried out only in a certain neighborhood of the extremum, which may not be global, but only local [
3,
4]. Therefore, for Monte Carlo methods, the probability of finding a global extremum is higher than for smooth optimization methods. Monte Carlo methods can be defined as numerical methods for solving mathematical problems by modeling random variables and statistical evaluation of their characteristics [
5,
6].
With this definition, Monte Carlo methods include stochastic approximation and random search. Monte Carlo methods are used in various optimization problems, including the problems of finding the global extremum [
7,
8,
9,
10].
We use a method based on a simple random search algorithm [
7]. In this case, the unknown parameters of the transcendental function are uniformly distributed in a limited subset of the Euclidean space.
The corresponding method of mathematical modeling of the behavior of the strength properties of organic polymers containing photoactive low-dimensional nanoparticles during the initial stage of photostimulated degradation of the material is discussed.
Organic polymeric nanocomposites now substitute for many traditional materials, such as steels, metals, wood, and ceramics, in various applications. Moreover, we could not have found better materials for use in space exploration, motorcar construction, and medicine [
11,
12].
Given polymers comprise inorganic low-dimensional nanoparticles in the bulk or at the surface [
11]. The modification of polymeric materials by metal oxides nanoparticles makes it possible to manipulate optical and electrophysical properties and subsequently to find new application fields. For instance, titanium dioxide (TiO
) or titanates such as BaTiO
, SrTiO
, etc. are used to remove the effects of UV and IR parts of sunlight [
13]. Changes in mechanical properties owing to light absorption by oxide nanoparticles are not always taken into account. We could meet an utmost opinion that the energy of absorbed solar light, including near UV-part, is dissipated within a material bulk, and insignificant heating observed in this case does not appreciably affect strength properties [
14]. At the same time, the semiconductor oxide nanoparticles are photochemically active in the sense that the absorption of light energy initiates, by means of inner photoelectrical effect, a chemical reaction. Shortly after, light energy absorbed by the semiconductor is transformed in the energy of electrically charged species—photogenerated electrons and holes, and they participate in reduction and oxidation chemical reactions within the polymer matrix (note that this descriptive scheme is very similar to the scheme of such phenomenon as the semiconductor photocatalysis [
15]). The key parameter is the semiconductor energy band gap. In our case, the energy band gap interval for the photochemical active semiconductor has an upper bound limited by energy of UV solar quanta incident on Earth’s surface (∼4 eV) and a lower bound limited by an energy required for concrete chemical reaction. Typical pigments such as titanium dioxide, zinc oxide, ferric oxide, etc., satisfy these conditions, taking into account the quantum-dimensional effect which increases the band gap value.
In addition, nanocomposite polymers are successfully studied as potential photocatalysts of oxidative decomposition of water and air organic pollutants [
16,
17,
18]. Construction and production of easily decomposed and utilized polymeric materials with satisfactory mechanical properties are the attractive aim of the ecological community. The complete decomposition could take place under ambient factors: sunlight, moisture, and air oxygen action. In this way, the method for photocatalytic degradation is developed for plastic waste utilization [
19].
Degradation mechanisms are not completely ascertained: most likely, both photothermal and photocatalytic ways are possible. We considered published experimental data arrays on the sunlight effect on nanocomposite polymers. We found that a very limited group of research communications [
20,
21,
22] reported time dependencies of strength properties changes under solar light irradiation, far before complete material destruction. Physicochemical mechanisms are shown in null representation and mathematical models are quite absent.
Obviously, correct physical description and mathematical modeling of the initial stage of photostimulated destruction of nanocomposite polymers could give basic worthwhile information for new materials’ development. On this basis, two types of function materials could be elaborated: stable structural polymers, and action polymers, easily decomposed under ambient factor.
Pigment additives effect on polymers photodestruction is considered in known classical transactions [
23,
24,
25]. Ambiguous conclusions given in these works are based on the experimental data obtained in 60–70 s of the past century in relation with attempts to use inorganic additives (TiO
, ZnO, etc.) for elimination of destructive UV light action on polymers. Emanual and Buchachenko [
25] concluded that many problems of polymer photodegradation and photostabilization are reduced to the problems of light=assisted thermo-oxidative destruction, complicated by specific photophysics issues.
Ranby and Rabek [
23] paid attention to a possibility of inner photoeffect realization in semiconductor substances of pigment additives and, consequently, of initiation of photocatalytic destructive processes in polymer, supposing their redox character. In summary, three possible mechanisms of photostimulated nylon destruction in the presence of titanium dioxide were assumed: (a) free radical mechanism, (b) through formation of peroxide species responsible for subsequent oxidation reactions under moisture and/or oxygen action, and (c) by means of energy transfer.
A few articles were cited in this relation. However, only Egerton’s [
26,
27] works give some information on considered photostimulated processes. Specifically, Egerton has shown a decreasing of tensile strength under solar light or simulating irradiation in the case of cotton and nylon 6.6 yarn, viscose, and acetate rayon covered by titanium dioxide or zinc oxide films. Appreciable effects were observed when humidity was increased. This fact was taken on the basis of conclusion that the polymer surface reactions with water and oxygen are responsible for material destruction, and these reactions are initiated by photo-exited semiconductors.
We note that mathematical modeling has been widely used in recent years to classify new polymer materials, describe their properties and application prospects, and predict approaches to environmentally friendly methods of their synthesis [
28,
29].
2. Photodegradation of Polymers and Metals Fatigue
Undoubtedly, the mathematical models describing changes in strength of the considered materials independent of light intensity and exposure time will be claimed.
Let us compare the process of photocatalytic degradation of polymeric nanocomposites with photoactive components and the process of high cycle fatigue in metals. In the case of polymeric nanocomposites, we suggest the photocatalyst nanoparticles as the initiation points of dislocations. Stress concentrations originate from these dislocations. If we consider an abstract metallic sample, we would find local dislocations within it. These dislocations would cause the material structure distortion. Dislocations would drift under the action of cyclic external load, novel dislocations would appear under a certain critical value of stress, and novel microscopic cracks would be generated [
30]. Finally, a fatigue macrocrack would be formed within a highly tense area, which will increase before material destruction [
31,
32]. Several various theories of fatigue destruction exist this time [
33,
34,
35,
36]. However, experiments and theory show that the formation of local stress concentration is one of the basic factors responsible for generation and enlargement of fatigue cracks [
37].
We will assume that the considered photodegradation processes would be, to some extent, similar to fatigue changes in metals with concentrated stress under high cycle fatigue.
We propose to name as “photocatalytic fatigue” the specific case of composite polymer photodegradation when (i) some decrease in strength properties of a sample is observed, (ii) the process is initiated by incident light interacting with semiconductor nanoparticles of polymer composite. A similarity of the experimental curves typical for composite polymer with photoactive additives’ photodegradation processes [
20,
22] and Wöhler’s curves for metal multicycle fatigue [
34,
37] permits us to apply this term here.
Kamrannejad et al. [
20] presented data on the photocatalytic degradation of nanocomposites based on polypropylene which were prepared using carbon-coated TiO
nanoparticles and commercially available TiO
nanoparticles (Degussa, P25). The test showed a decrease in the ultimate tensile strength value. The photocatalytic properties of TiO
(internal photoelectric effect on a semiconductor) caused chain-breaking reactions and, as a result, the formation of cross-links and, ultimately, the destruction of polypropylene. The authors also showed that the presence of carbon nanoparticles (putative traps for photogenerated charge carriers) can reduce the degree of degradation [
20].
Similar results for polypropylene were obtained by Wiener et al. [
22], who measured ultimate tensile strength at different exposures to UV irradiation. Intensity of UV light on the sample surface was 40.4 mW cm
of UVA and 4.1 mW cm
of UVB. Aeroxide P25 Degussa (nano-TiO
) that contains 70% anatase and 30% rutile was used in this study. The mean diameter of the used nanoparticles was 21 nm. Using electron microscopy, TiO
nanoparticles were visualized and the surface roughness of the fibers was estimated. It was noted that TiO
nanoparticles damaged the surface of polypropylene fibers; an increase in surface roughness was observed due to its local decomposition. The authors conclude that, upon irradiation, ultraviolet light penetrates deeply into the polymer mass, and the polymer composition changes because of a chemical reaction, which causes a decrease in the mechanical strength of the fibers. With the addition of TiO
nanoparticles, the absorption of UV light on the fibers’ surface becomes more efficient, which increases the level of their damage [
22].
It should be noted that the procedures of the experiments under consideration and the descriptions of the investigated objects are not sufficiently presented in the article texts to be reproduced in laboratory conditions. At the same time, we propose to admit that the lack of information does not prevent the presented data from being used as model data for implementation of computational experiments.
Prolypropylene samples with or without TiO
showed identical behaviors: UV light induced a decrease of the ultimate tensile strength (
Table 1).
Wiener et al. [
22] also measured the strength of polyester fibers. The ultimate tensile strength decrease under UV-irradiation was observed for polyester fibers with or without TiO
nanoparticles (
Table 2).
3. Derivation of the Equation of the “Photocatalytic Fatigue” Curve
Without loss of generality, we can consider only symmetric high cycle loading, i.e., cases when the maximum stress value and the minimum stress value are equal in absolute value and opposite in sign.
In the theory of metal fatigue, high cycle fatigue is understood as a process in which each loading cycle occurs within the limits of elastic deformation, i.e., is strictly less than the yield strength. If we assume by definition that then for symmetrical loading
There is a value of the stress at which the material can withstand an unlimited number of cycles. Such a stress is called an endurance limit, and is denoted by Endurance strength is defined as the maximum value of the stress that a material can withstand N loading cycles. For the case of symmetrical loading, the following notation is used: , i.e., the sample withstands N cycles of symmetrical loading at maximum stress Another important value is the limit of limited endurance for basic durability, when the number of cycles is known in advance (usually cycles). In this case, the notation is used for symmetrical loading.
The results of tests of high cycle fatigue are usually presented graphically in the form of a fatigue curve (Wöhler curve). It approximates the experimental points having two coordinates on the Cartesian plane. On the abscissa axis—the number of loading cycles that the sample withstood before failure. On the ordinate axis—the values of the limits of limited endurance (maximum cycle stress) at which the sample is tested.
Usually, one of three models is used to derive the high cycle fatigue equation: one-term, two-term, or exponential. For the case taking into account the stress concentration, these models have the following form:
where
,
,
is the stress concentration factor,
—experimental parameters.
The paper [
37] considers the equation of the high cycle fatigue curve of specimens with stress concentration on the basis of a one-term model. The resulting equation finally has the following form:
where
is the endurance strength of samples with stress concentration,
is the endurance strength without stress concentration.
The empirical equation for samples without stress concentration is
where
is the endurance strength without stress concentration for basic durability and
are the experimental parameters.
A possible approach to mathematical modeling of the “photocatalytic fatigue” of polymer nanocomposites with photoactive components can be the use of Equations (
2) and (
3). In these equations, the number of loading cycles should be replaced by the irradiation time.
Denote by the ultimate tensile strength of a fiber of a polymer nanocomposite of a fixed diameter (fixed thickness for a nanofilm) with photoactive components at exposure time t and some fixed illumination value . By , denote the ultimate tensile strength of the same fiber under the same conditions, but without photoactive additives. Let S denote the ultimate tensile strength at the time .
Note that when modeling high cycle fatigue of metals, the value of the argument of the decimal logarithm in Equations (
2) and (
3) changes within
–
. In our case, the maximum value of the exposure time does not exceed 600 minutes. Therefore, it is necessary to introduce one more experimental parameter,
, which is added to the argument of the decimal logarithm. Taking into account this remark and by analogy with (
2), we write the equation of “photocatalytic fatigue” for polymer nanocomposites with photoactive components.
By analogy with (
3), the equation of downward strength for the same polymer, with the same irradiation parameters, but without photoactive nanoparticles, will be
Substituting (
5) into Equation (
4) and replacing
S with
, where
, and
—ultimate tensile strength of polymer with photoactive nanoparticles at time
, we obtain
where
is the stress concentration factor;
—experimental parameters characterizing a type of polymer.
4. Calculation of the Experimental Parameters for the Equations of “Photocatalytic Fatigue” by the Monte Carlo Method
To determine the values of the experimental parameters and the stress concentration factor from Equation (
6), we use the Monte Carlo method.
We will use the relative standard deviation as a criterion for the accuracy of the approximation of the experimental strength values:
where
m is the number of experiments,
is the experimental strength values, and
is the calculated strength values [
37].
The
can be considered as a function of seven variables
since the values of
in (
7) are calculated according to (
6), i.e.,
where
t is the time,
is the stress concentration factor, and
are the experimental parameters of the model.
We will introduce the notation , and distinguish between the constant —random error of the model and the random variable —relative standard deviation.
To determine the values of the experimental parameters and the value of the stress concentration factor from Equation (
6), it is necessary to solve the extreme problem of finding the minimum of the non-negative function
.
Denote by
X the solution of this problem, then
Let us apply a variant of the Monte Carlo method based on the simple random search algorithm, when the unknown parameters of the functions are uniformly distributed in some region of the Euclidean space .
In each experiment of the Monte Carlo method, the components of the random vector are specified using a pseudorandom number generator. Let us set the initial value of the random error of the model, and calculate the relative standard deviation with fixed components of the random vector . If is smaller than the current value of the random error of the model, we will replace with . Again, we calculate the random vector area using a pseudorandom number generator and calculate the relative standard deviation . If is smaller than the , we will replace with , etc. Thus, we obtain a strictly monotonically decreasing sequence of random errors of the model. This sequence corresponds to a monotonically decreasing sequence of sets .
Each and Obviously, for , because if , then all the more .
The sequence of random model errors is limited from below, for example, by zero. If we introduce a time limit for choosing the components of the random vector , then we can always determine the minimum value for the sequence of random model errors. Denote by this as the minimum value of random model error. This value of the random error will correspond to the set . By construction, this set is not empty.
Let us remark that, to obtain a solution of the problem of finding the minimum of a non-negative function using the Monte Carlo method, it is necessary to perform a series of statistical tests (for example, 50 times) with a minimum value of the random error of the model. Then we calculate the stress concentration factor , and the experimental parameters as the arithmetic mean of the corresponding components of the random vector .
The problem being solved has one peculiarity. To determine the unknown parameters of the function , two sets of experimental data can be used: the strength of the nanopolymer without TiO and the value strength of the same polymer with TiO.
By choosing a dataset with the strength values of the nanopolymer without TiO
, one can calculate the values
using the Formula (
5), and, using the algorithm described, calculate the values for the
, and
. The values
k and
are calculated as natural numbers, and the parameters
a and
b are calculated as rational numbers up to the fourth decimal place.
After that, we can finally solve the problem of finding the minimum of
. Take the dataset containing values of the experimental strength
for a nanopolymer with photoactive TiO
nanoparticles. The Formula (
6) is used to calculate the values of
, if the parameters
, and
are already known. At the final stage of solving the extreme problem, the values of the
, and the stress concentration factor
are specified using a pseudorandom number generator. The exponent
takes natural values, while
and
c take rational values up to the fourth decimal place.
In the case under consideration, the problem of finding the global minimum remains open. Nevertheless, without loss of generality, we can assume that if the random error of the model does not exceed 3–4%, the results of approximating the experimental values of the strength of nanopolymers with photoactive additives can be considered quite satisfactory. It is true even if the calculated values of the components of the vector correspond to a local minimum that is not a global one.
5. Equations of the “Photocatalytic Fatigue”
Phenomenological models describe the empirical relationships of phenomena to one another in such a way that they are consistent with, but not directly derived from, fundamental theory. In our case, verification of the adequacy of the mathematical model of “photocatalytic fatigue” is possible by comparing the results of numerical simulation with the results of real photophysical experiments. As model data, consider the digitized graphs of the decrease of the ultimate tensile strength for wet polypropylene and polyester fibers (
Table 1 and
Table 2) obtained by Wiener et al. [
22].
The calculations were carried out using the original program written in the Visual Basic programming language in the Visual Studio Community 2019 integrated development environment.
We assume, as a first approximation, that the natural values of the random parameter are uniformly distributed from 1 to 100.
The initial values of the remaining six experimental parameters are estimated on the basis of the results obtained in the article [
37]. At the first stage of application of the Monte Carlo method for both polypropylene and polyester-based samples, they are evenly distributed in the following intervals:
—from 1 to 50 on the set of rational numbers.
a—from 0.1 to 10 on the set of rational numbers.
b—from 1 to 20 on the set of rational numbers.
c—from 1 to 200 on the set of rational numbers.
k—from 1 to 10 on the set of natural numbers.
—from 1 to 10 on the set of natural numbers.
5.1. Phenomenological Equation for Polypropylene
Using the tabular data for polypropylene fibers without TiO
(
Table 1) and Equation (
5), we determine the experimental parameters
, and
.
At the first stage of stochastic tests, the values of the random error of the model are gradually reduced. In this case, the values of the parameters and stabilize. As the random error of the model decreases, it reaches its minimum possible value . The test results for the specified value of give insignificant variations in the random values of the parameters a and b. With repeated stochastic tests (50 times), the average values of these parameters are equal to and .
After substituting the obtained values of the parameters
to the Formula (
6), it will take the following form:
At the second stage of the stochastic tests, one can proceed to the final determination of the form of the equation for the “photocatalytic fatigue” curve for polypropylene fibers with TiO photocatalyst nanoparticles.
With a successive decrease in the values of the random error of the model, the value of the exponent is stabilized.
Further statistical tests are carried out at a fixed value of the parameter
and successive reduction of the random error of the model to the value
. At the same time, computational experiments give insignificant variations in the values of the parameter
c and the stress concentration factor
. With repeated stochastic tests (50 times), the average values of these quantities are equal to
and
. Then
is the solution of the extreme problem for polypropylene. Substituting these values into the Formula (
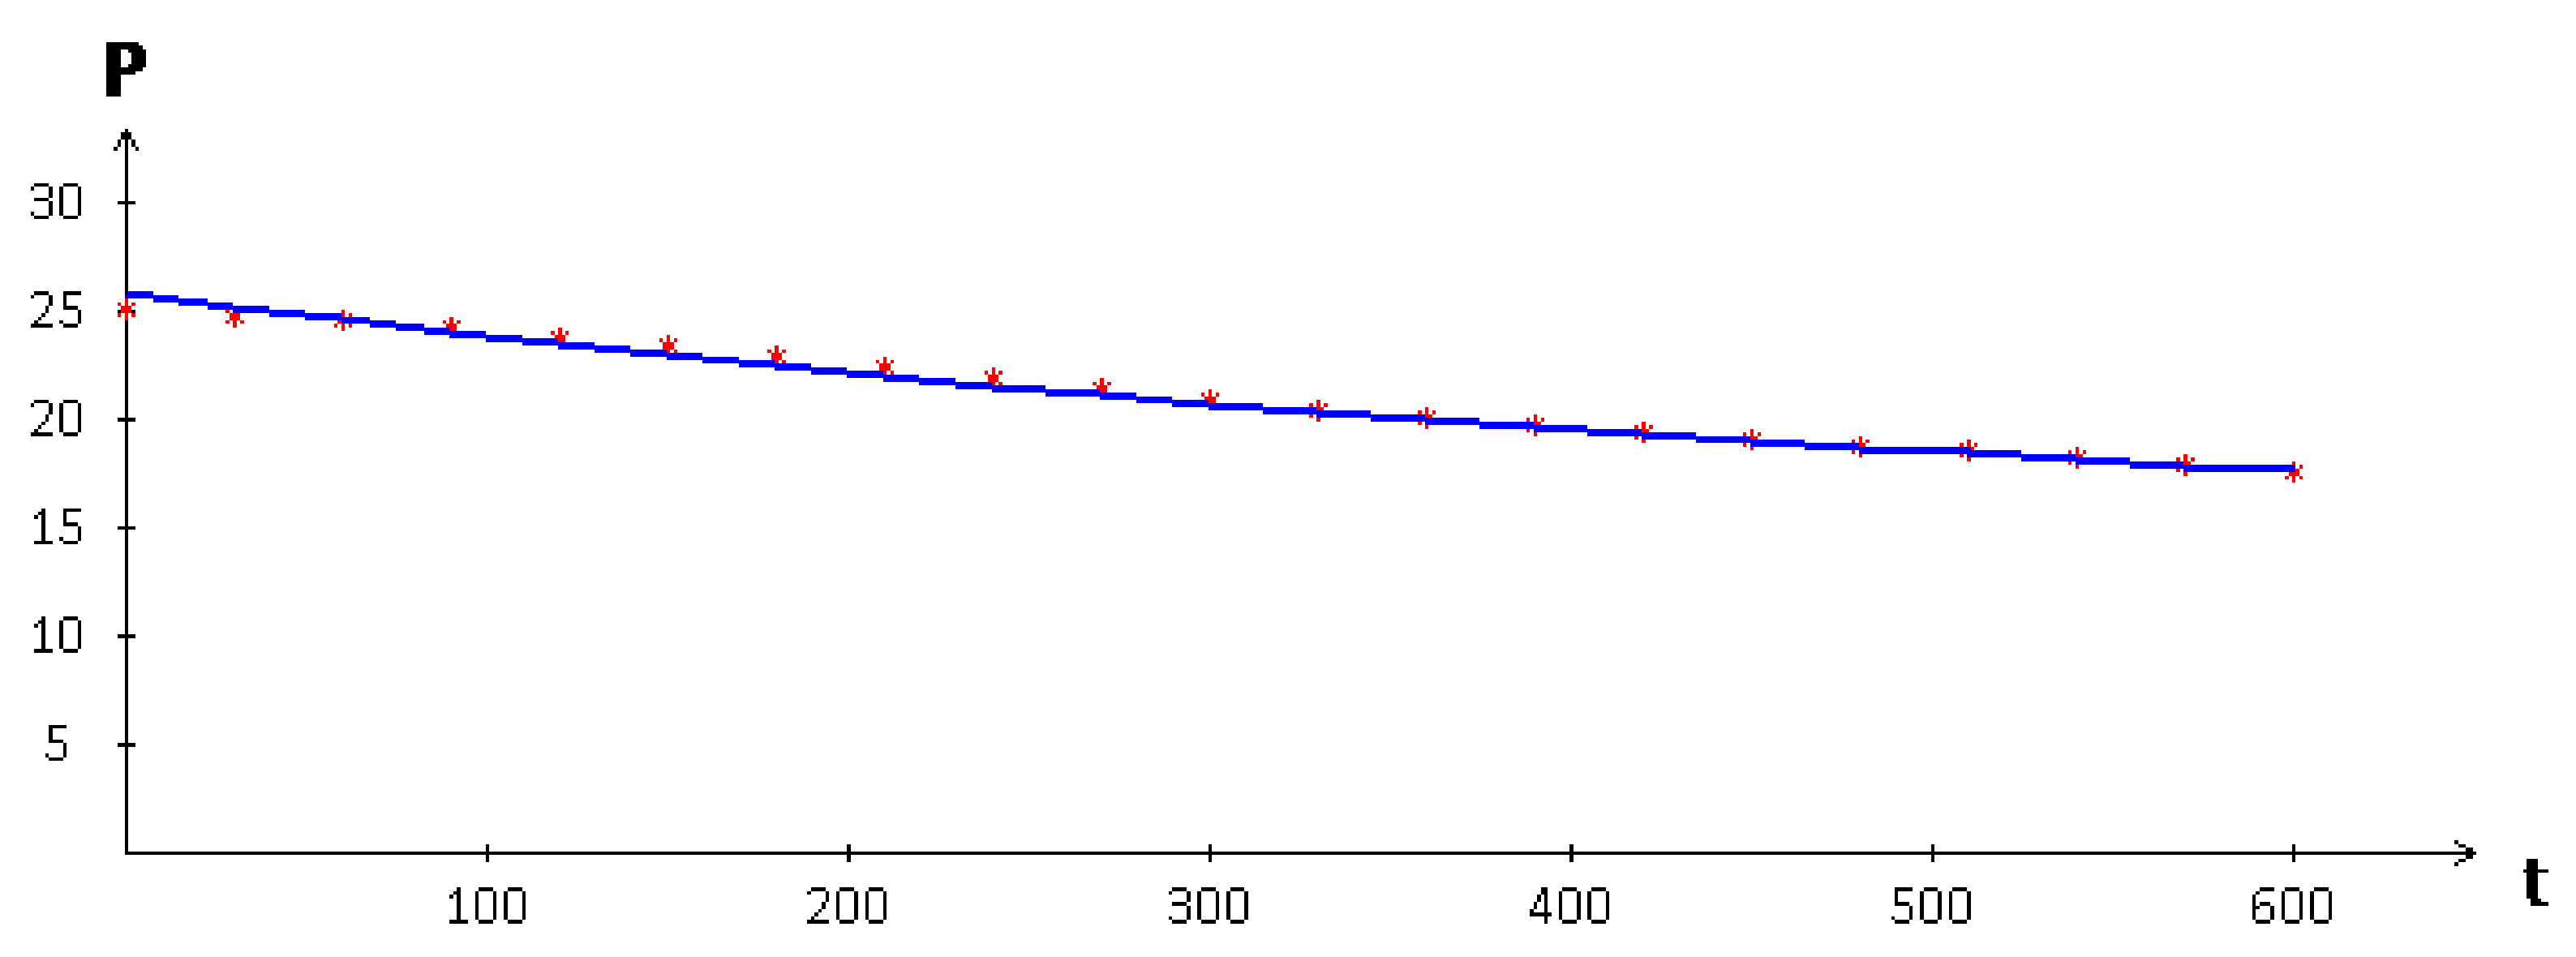
9), we obtain the final form of the equation of the “photocatalytic fatigue” curve for the model values of the strength of polypropylene fibers with TiO
photocatalyst nanoparticles,
The graph of the curve approximating the model values of the strength of polypropylene with TiO
photocatalyst nanoparticles at the above parameters is shown in
Figure 1.
5.2. Phenomenological Equation for Polyester
Using tabular data for polyester fibers without TiO
(
Table 2), and Equation (
5), the experimental parameters
, and
are computed.
At the first stage of stochastic tests, the values of the random error of the model are gradually reduced. In this case, the values of the parameters and are stabilized. As the random error of the model decreases further, it reaches its minimum possible value . The test results for the specified value of show insignificant variations in the random values of the parameters a and b. With repeated stochastic tests (50 times), the average values of these parameters are equal to and .
After substituting the obtained values of the parameters
into the Formula (
6), it will take the following form:
At the second stage of carrying out stochastic tests, one can proceed to the final determination of the form of the equation of the “photocatalytic fatigue” curve for polypropylene fibers with TiO photocatalyst nanoparticles.
With a successive decrease in the values of the random error of the model, the value of the exponent is stabilized.
Further statistical tests are carried out at a fixed value of the parameter
and successive reduction of the random error of the model to the value
. At the same time, computational experiments give insignificant variations in the values of the parameter
c and the stress concentration factor
. With repeated stochastic tests (50 times), the average values of these quantities are, respectively,
and
. Then,
is the solution of the extreme problem for polyester. Substituting these values into the Formula (
11), we obtain the final form of the equation of the “photocatalytic fatigue” curve for the model values of the strength of polyester fibers with TiO
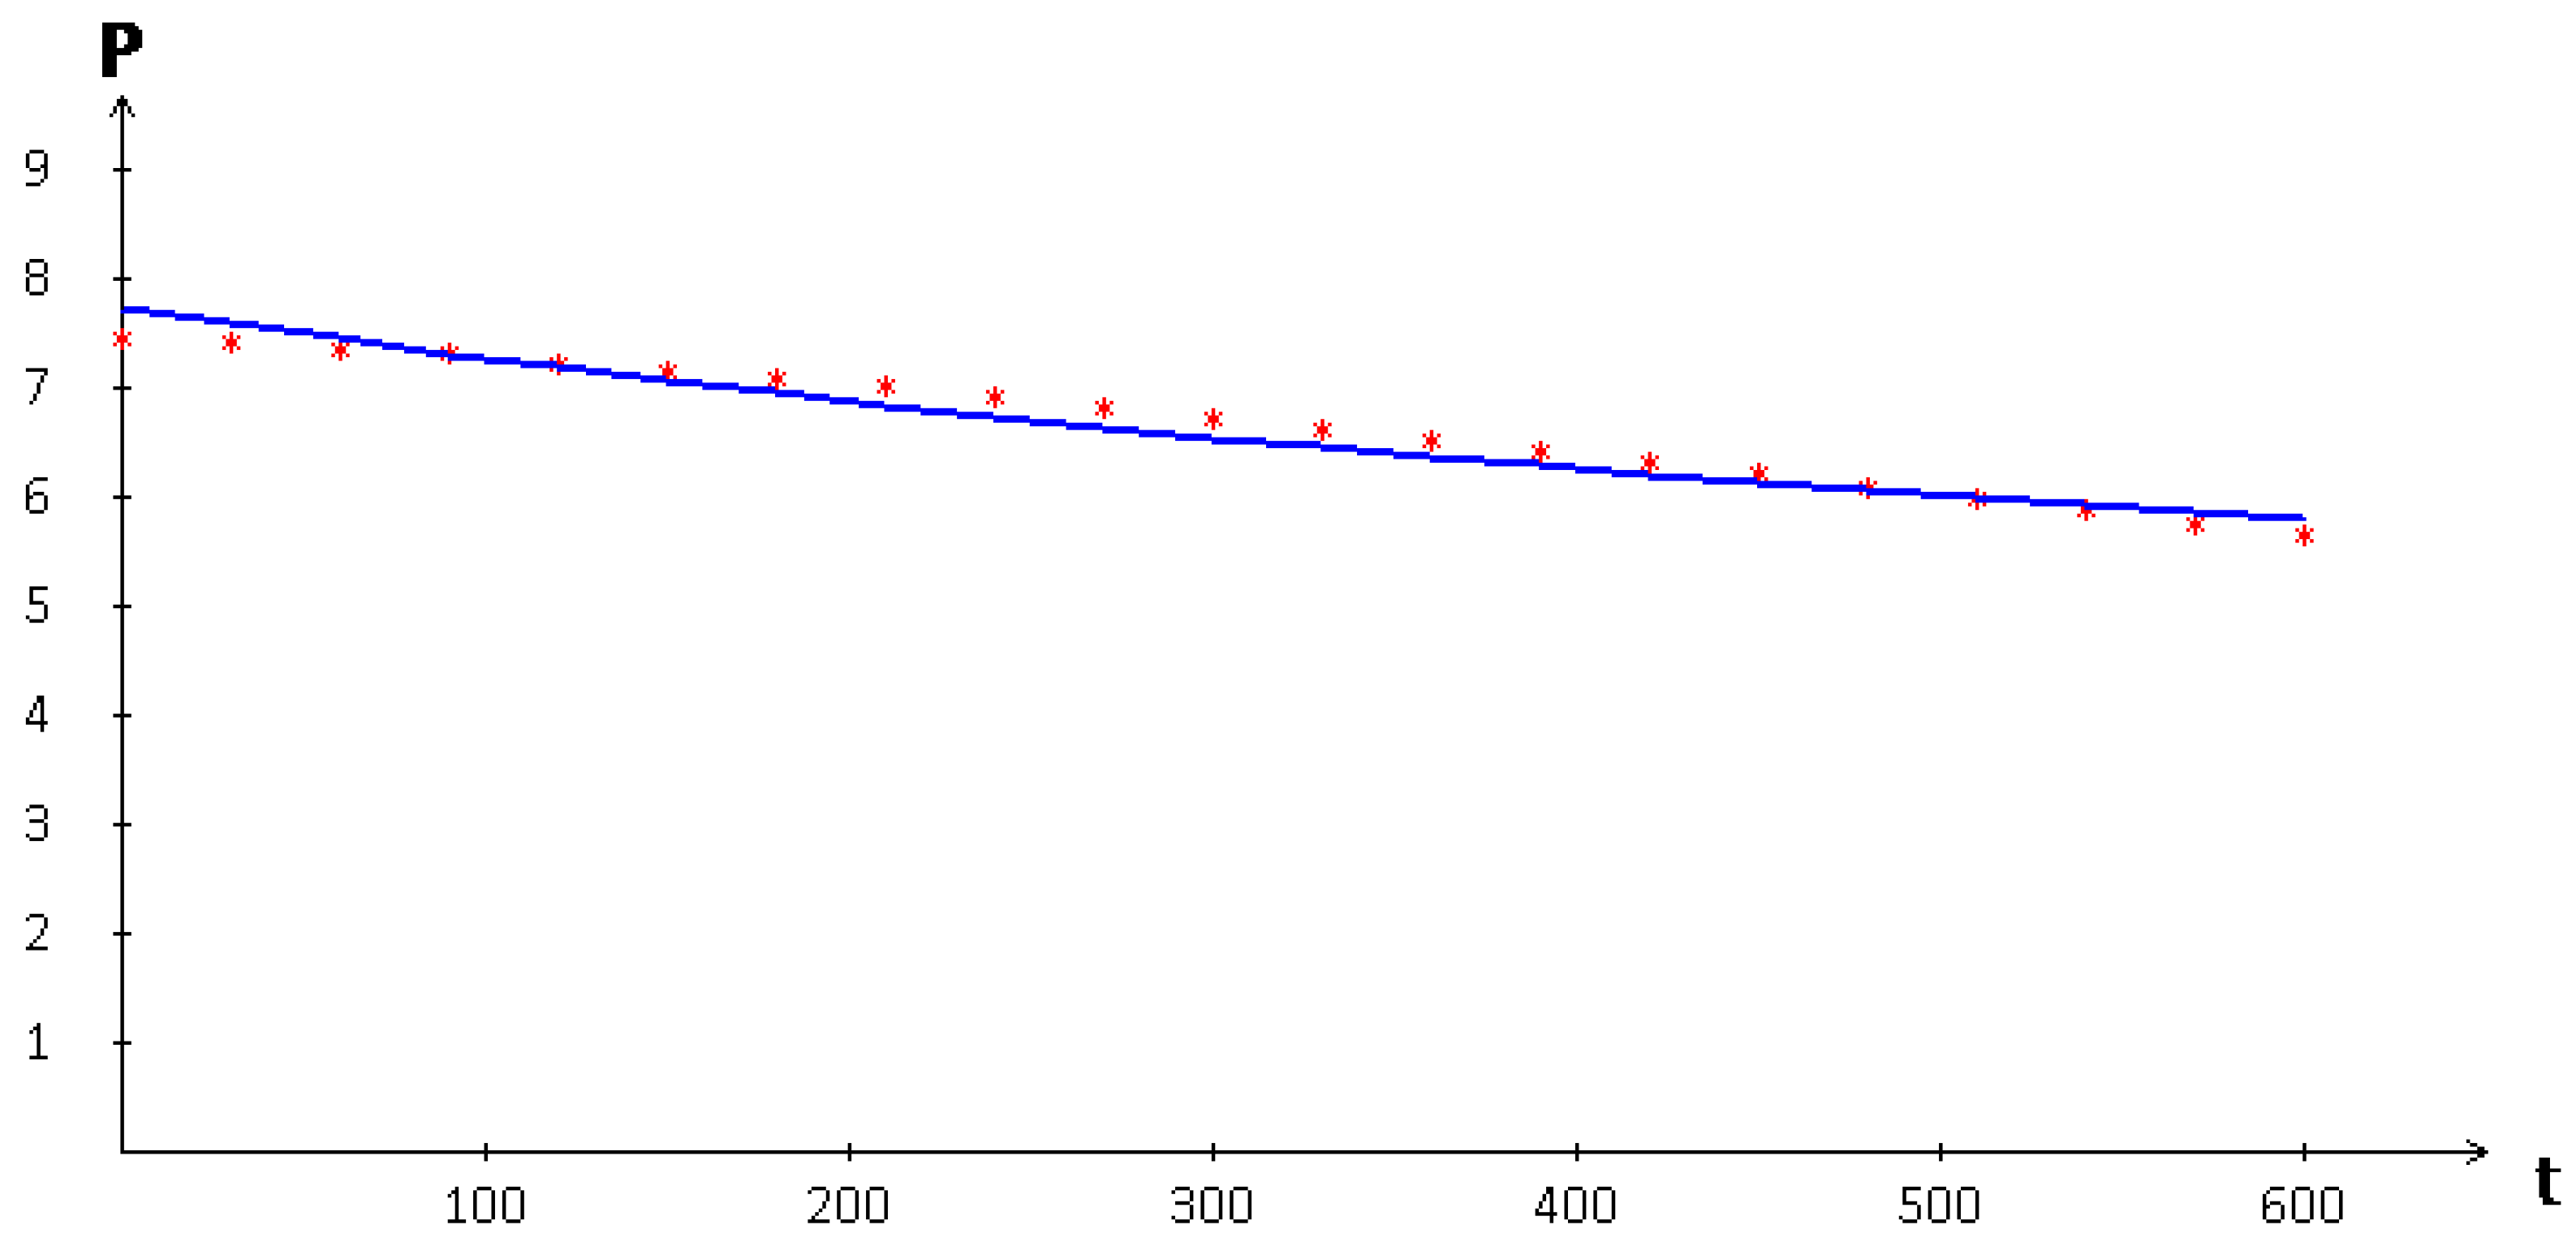
photocatalyst nanoparticles
The graph of the curve approximating the model values of the strength of polyester with TiO
photocatalyst nanoparticles at the above values of parameters is shown in
Figure 2.
6. Discussion
The phenomenological equations of photocatalytic fatigue for polypropylene and polyester with photoactive TiO nanoparticles demonstrate that the proposed mathematical model is adequate for these materials. The relative standard deviation (random error of the model) for polypropylene is , for polyester—. The principal feature is that their strength monotonically decreases with increasing irradiation time.
Note that in the paper [
22], in addition to polypropylene and polyester, the data are given on the ultimate tensile strength of cotton and polyamide fibers at different exposures to UV radiation. It follows from the text that the introduction of TiO
nanoparticles leads to some increase in the strength of cotton fiber samples for the first hours of irradiation, and only after 300 min of irradiation is a decrease in the strength of the cotton fiber observed. In the case of polyamide, the behavior of the samples is similar to that of cotton fibers. With UV radiation up to 300 min, the strength of polyamide fibers increases, but with an increase in exposure time, it begins to decrease. However, it should be noted that the strength of the polyamide sample after UV radiation for 600 min is greater than that of the sample before irradiation. The effect of ultraviolet on polyamide samples containing nano-TiO
is similar to the effect on cotton fibers.
In other words, for cotton and polyamide, a monotonous decrease in the tensile strength of the samples is violated, which, in turn, indicates the impossibility of using the mathematical model proposed above for these materials. As an example, let us consider polyamide fibers.
Table 3 shows data on the change in their ultimate tensile strength.
Using the strength values for polyamide fibers without TiO
and Equation (
5), we determine the experimental parameters
, and
. At the first stage of stochastic tests, the values of the
random error of the model are gradually reduced. In this case, the values of the parameters
and
are stabilized.
As the random error of the model decreases further, it reaches its minimum possible value, . The test results for the specified value of give insignificant variations of the random values for the parameters a and b. With repeated stochastic tests (50 times), the average values of these parameters are equal to and . We can pay attention to the qualitative change in the values of the parameters a and b. Parameter a, in contrast to polypropylene and polyester, takes values greater than one, and b, on the contrary, is almost equal to one. Therefore, the error in the approximation of experimental strength values increases.
After substituting the obtained values of the parameters
into the Formula (
6), it will take the following form:
At the second stage of stochastic tests, with a successive decrease in the values of the random error of the model, the value of the exponent is stabilizing. Further statistical tests are carried out at its fixed value, as well as successive reduction of the random error of the model to the value . With repeated stochastic tests (50 times), we obtain the average values of two more unknown quantities, and , which differ by an order of magnitude from the corresponding values for polypropylene and polyester. The solution of the extreme problem for polyamide has the form
Substituting these values into the Formula (
13), we obtain the final form of the equation for the model values of the strength of polyamide fibers with TiO
photocatalyst nanoparticles:
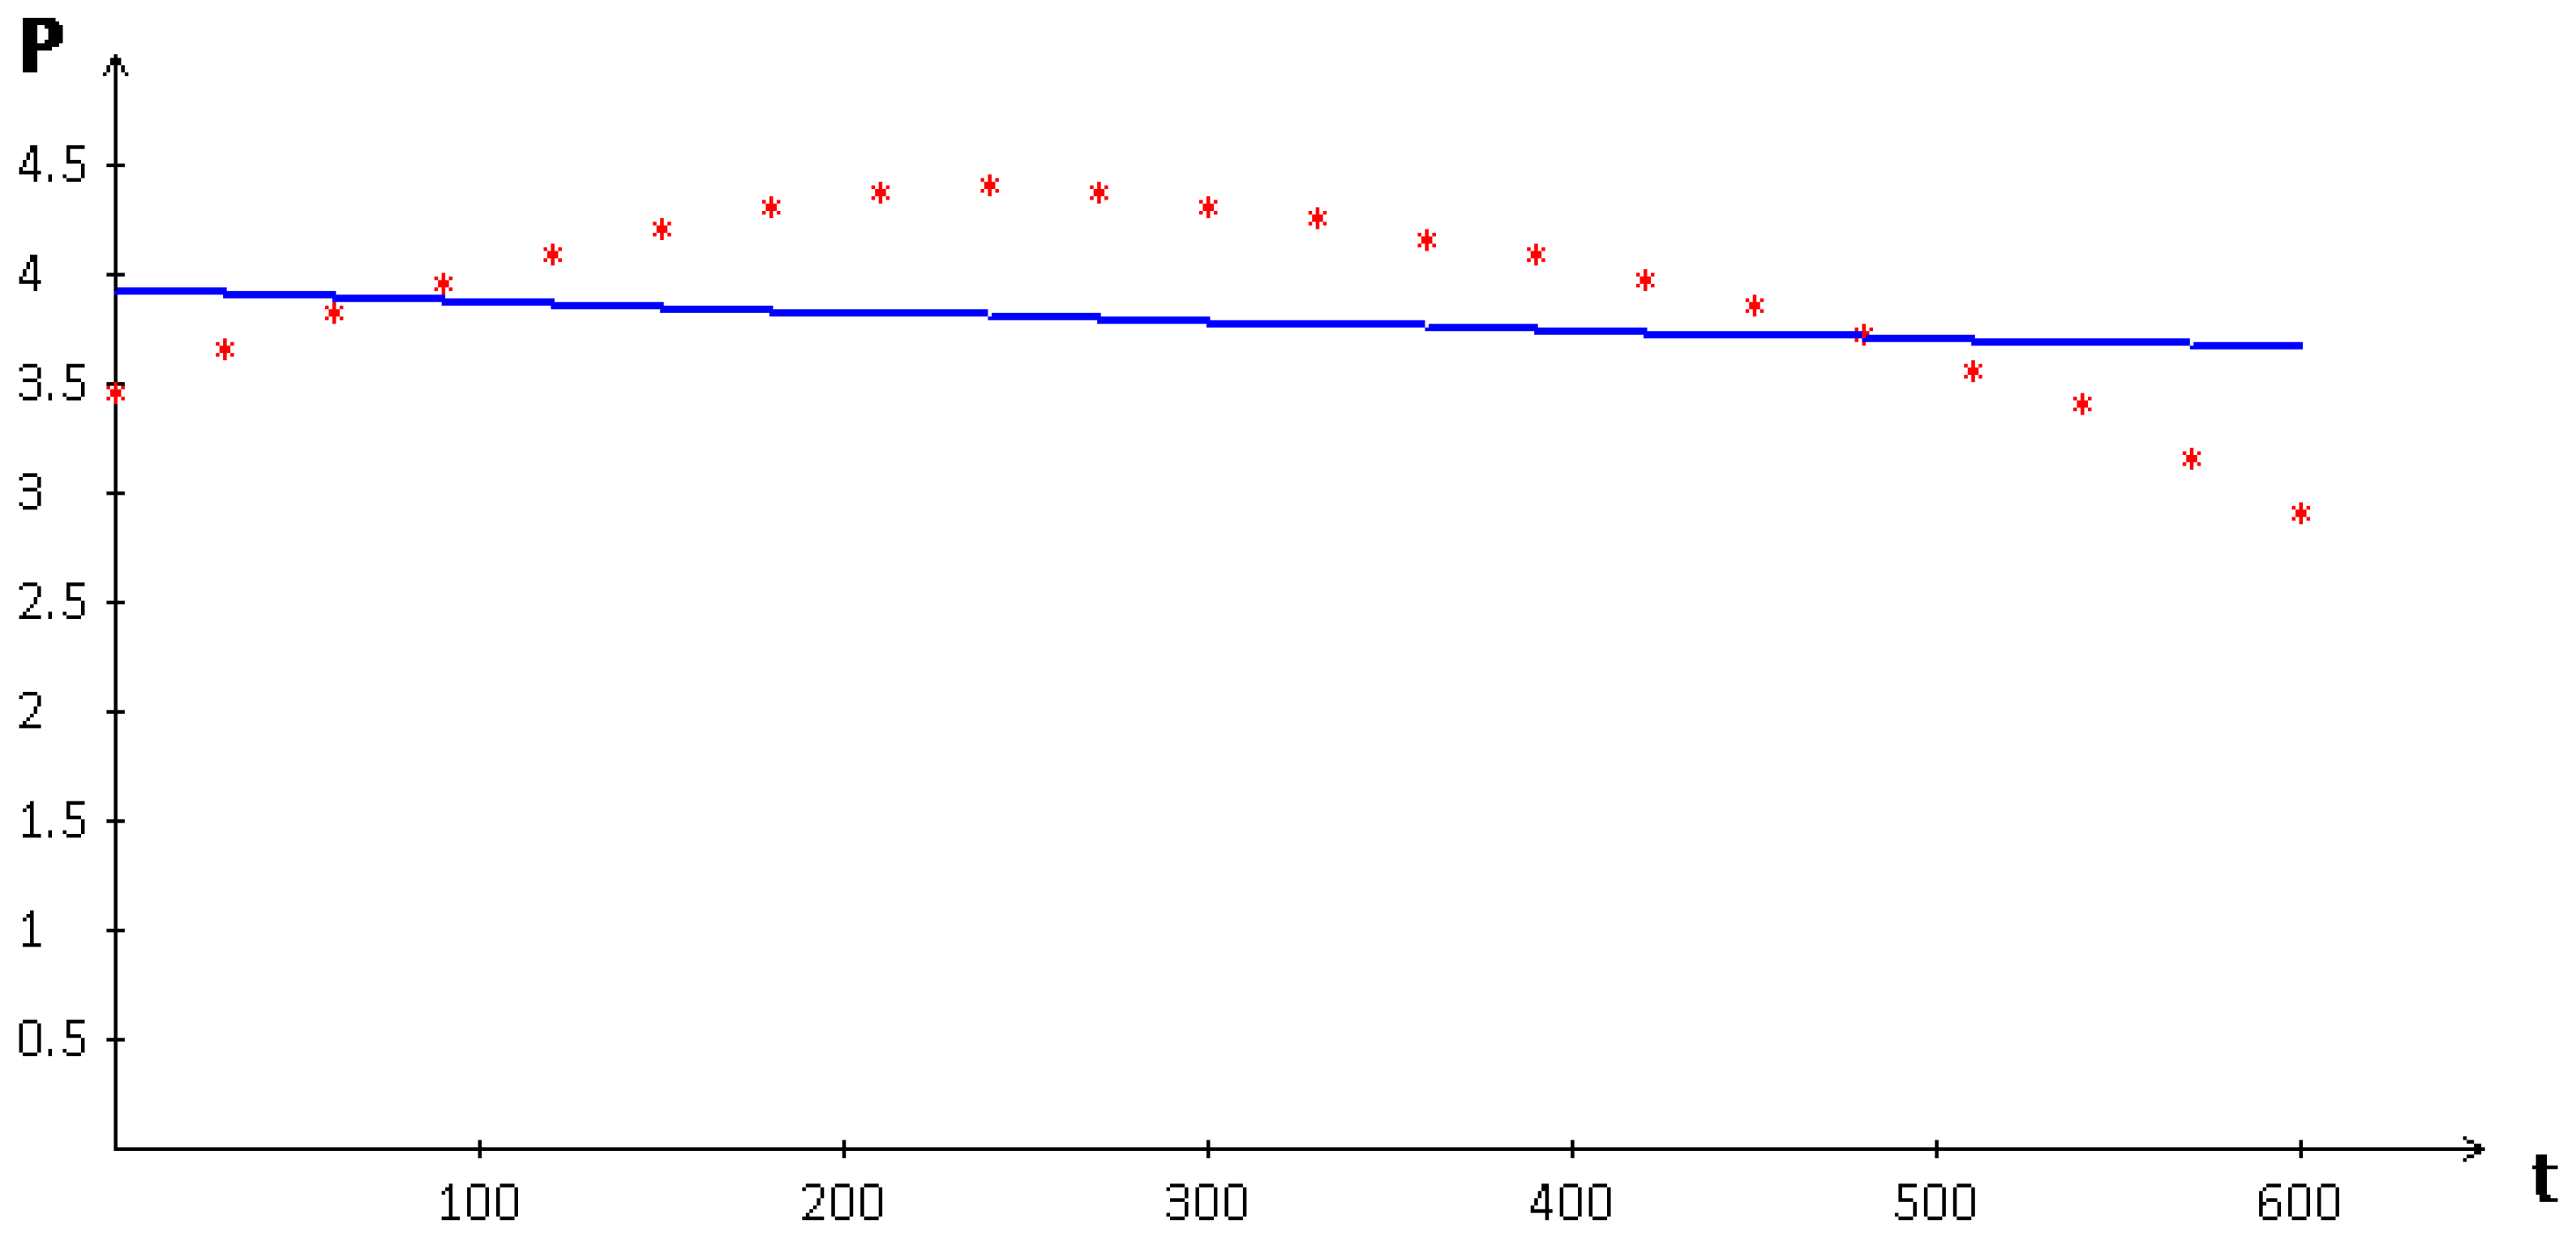
In the considered case, the approximation error exceeds 10%, which indicates that a further refinement is required for the mathematical model of “photocatalytic fatigue” of polymer nanocomposites with photoactive additives for materials with the property of short-term strengthening upon irradiation.
The graph of the curve approximating the model values of the strength of polyamide with nanoparticles of the TiO
photocatalyst, with the above values of the experimental parameters, is shown in
Figure 3.
The meaning of the one-term fatigue model lies in the fact that the right side of the equation describing the Wöhler curve consists of two factors: a constant equal to the initial strength value and a factor which is slightly less than unity and very slowly decreases. As a result, a strictly monotonically decreasing nonlinear function is obtained, which models the decrease in the strength of the material.
The problem that arose in connection with the phenomenon of short-term strengthening of polymers under light irradiation can be solved in two ways. First, with help of a two-term model, in the form of a difference. The minuend increases rapidly at first, and then its growth slows down. Vice versa, the subtrahend slowly increases, so that the difference is greater than unity up to a certain moment, and then this difference becomes less than unity and very slowly decreases as a factor of the one-term model. Second, another approach is possible, in which a much longer exposure interval is chosen in the photophysical experiment. The irradiation of the polymer should be such in duration that the time of the strengthening period is insignificant compared to the total exposure time.
Some scientific articles and monographs contain conclusions and experimental data analysis on mechanical fatigue of polymer materials. For instance, the reference book [
38] contains a (set) collection of graphical and tabular data covering fatigue and tribology of plastics and polymers. This information is useful for engineers and projectors in the producing polymeric techwares. Any strength decrease is usually treated as mechanical fatigue, in other words, as an accumulation of micro-damages in the material sample. In this book, the concept of fatigue is very straightforward: if an object is subjected to a stress or deformation, and it is repeated, the object becomes weaker. This weakening of plastic material is called fatigue. We investigated the fatigue generated by photophysical action on polymeric materials with photoactive components. The results obtained were mainly determined by the availability of required experimental data.
Obviously, the results of every experimental investigation are of a stochastic nature. Consequently, the statistical techniques for the data treatment must be exploited if the functional smooth dependencies would be found. In this case, the discrete numerical magnitudes of required values must have specified confidence intervals. By analogy with [
39], we present confidence intervals in the
Table 4 for some experimental parameters of Equations (
10), (
12), and (
14).
At the end of the discussion, we note that the results obtained were mainly determined by the availability of required experimental data. To continue the study, specific photophysical–photochemical experiments with nanocomposite polymers containing photocatalyst nanoparticles are needed. In that time, the function approximating photocatalytic fatigue process would be considered as a function depending not only on exposition time but on physicochemical features of nanocomposite polymers. In particular, we must consider geometric sizes of film or fiber sample, bulk or surface distribution of photoactive nanoparticles, chemical composition of the polymer, light absorption characteristics, and so on. Irradiation conditions must also be taken into account, an intensity of incident light flux, for instance. Moving in this way, it will be possible to become closer to developing a more general model of photocatalytic fatigue.
7. Conclusions
A mathematical model of “photocatalytic fatigue” of polymer nanocomposites containing photoactive semiconductor additives is considered.
This model is an analogue of the equation for the Wöhler curve of multicycle fatigue of metals with stress concentrations. Experimental parameters of the phenomenological equations of “photocatalytic fatigue” for polypropylene and polyester with photoactive TiO nanoparticles are calculated using one of the Monte Carlo methods, which is based on a simple random search algorithm. The computational scheme consists of solving the extreme task of finding the minimum of a non-negative transcendental function of seven variables, which is the relative standard deviation of the calculated values of the strength of the polymer nanocomposite from the corresponding experimental values.
The applicability of the “photocatalytic fatigue” model for polymer nanocomposites with photoactive nanoparticles is confirmed by the example of approximation of model data for polymers with monotonic strength reduction. For polypropylene samples, the approximation error of experimental strength values was less than 1.22%. For polyester samples, the approximation error of the experimental strength values was less than 1.99%. The proposed method makes it possible to extrapolate the values of changes in the strength of such polymers when designing structural materials with known durability and consumer polymers with a predicted decomposition period under the influence of the external environment.
The proposed model is not universal and does not cover all possible forms of strength behavior of polymers with photoactive additives under the sunlight action. For example, it is necessary to create at least one more mathematical model for changing the strength of samples based on cotton or polyamide, for which some hardening is observed in the initial period of UV light irradiation.


