Article

Natural Gas Scarcity Risk in the Belt and Road Economies Based on Complex Network and Multi-Regional Input-Output Analysis

1
Center of Energy Development and Environmental Protection, Jiangsu University, Zhenjiang 212013, China
2
School of Mathematical Sciences, Jiangsu University, Zhenjiang 212013, China
*
Author to whom correspondence should be addressed.
Mathematics 2022, 10(5), 788; https://doi.org/10.3390/math10050788
Submission received: 18 January 2022 / Revised: 21 February 2022 / Accepted: 22 February 2022 / Published: 1 March 2022
(This article belongs to the Special Issue Modeling and Analysis of Complex Networks)

Abstract

:
Natural gas scarcity poses a significant risk to the global economy. The risk of production loss due to natural gas scarcity can be transferred to downstream economies through globalized supply chains. Therefore, it is important to quantify and analyze how natural gas scarcity in some regions affects the Belt and Road (B&R) economies. The embodied natural gas scarcity risks (EGSRs) of B&R economies are assessed and the EGSR transmission network is constructed. The built network shows a small-world nature. This illustrates that any interruption in key countries will quickly spread to neighboring countries, potentially affecting the global economy. The top countries, including Turkey, China, Ukraine, and India are identified in EGSR exports, which also have relatively high values of closeness centrality. The findings illustrate that the shortage of natural gas supply in these countries may have a significant impact on downstream countries or sectors and the resulting economic losses spread rapidly. These countries are critical to the resilience of the B&R economies to natural gas scarcity. The top nations, including Turkmenistan, Macedonia, and Georgia are also identified in EGSR imports, highlighting their vulnerability to natural gas scarcity. Further, the community analysis of the network provides a fresh perspective for formulating fair and reasonable allocation policies of natural gas resources and minimizing the large-scale spread of economic losses caused by natural gas scarcity.

1. Introduction

In the past 20 years, a series of phenomena such as global warming, melting glaciers, rising sea levels, and haze weather have shown that climate change is seriously affecting the future survival of mankind. With the increasing attention of countries around the world to climate change, more than 130 countries have pledged to achieve net-zero emissions [1]. The total GDP of these countries accounts for 90% of the world’s total GDP. The world is moving towards a low-carbon future. Climate constraints have contributed to the acceleration of the global energy transition. The global energy transition requires both the development of non-fossil energy and the clean utilization of fossil energy. As the most environmentally friendly energy among fossil energy resources, natural gas can be used as a raw material in the chemical industry, as a fuel in the industrial field, in the field of power generation, and in the domestic gas consumption of residents, etc. It is becoming an important force in promoting the global energy transformation.
China’s “Belt and Road Initiative” (B&R Initiative) proposed in September 2013, aims to accelerate sustainable development and provide a new paradigm for win-win cooperation at the global and regional levels [2]. The B&R Initiative forms the core of China’s foreign policy and future foreign cooperation, and energy cooperation undoubtedly constitutes an important component in the B&R Initiative [3]. For countries along the B&R, there have been some studies to identify the spatial distribution pattern of energy and explore the mechanism to achieve energy sustainability [3,4,5]. These are useful for solving problems of determining the spatial distribution of energy of B&R nations. Recently, with the acceleration of the global energy transition process, there is a broad awareness that natural gas is playing an increasingly important role in the global economy [6]. Natural gas resources are very abundant in the countries along the Belt and Road. By the end of 2019, the proven natural gas reserves of B&R economies were about 159.6 trillion cubic meters, accounting for 80.3% of the world’s total natural gas reserves. These countries produce about 1.98 trillion cubic meters of natural gas, accounting for 53.7% of global production [7]. The global demand for natural gas has steadily increased, resulting in an imbalance between production and consumption. It threatens the security of natural gas supply, especially in natural gas scarce regions. The inequality of economic development has exacerbated the complexity of this issue. Although it is urgent to solve the problem of supply security in regions with gas shortages, it is also important to characterize their impact on the entire economic system.
The multi-regional input-output (MRIO) model is a commonly used method that can reflect the commodity and service flows within and between countries at the sectoral level [8]. In view of regional characteristics and sectoral disparities, the MRIO model is exploited to study regional heterogeneity [9,10]. To better understand how economic trade affects the use of local resources, the MRIO model is further used to track the virtual transfers of water, energy sources, and carbon emissions embodied in cross-regional trade [11,12,13]. For example, Kan used MRIO analysis to determine the use of natural gas from primary suppliers to final consumers through the relationship of producers in the world economy [6]. White applied the MRIO method to study the water footprint of the inter-regional trade in the Haihe River Basin and its impact on the hydro system [13]. Previous studies have revealed that due to the intertwined global economy, the economic activities of one region (sector) will leave a deep mark on the resource utilization of another region (sector). In this way, although virtual water (energy) trade has saved water (energy) resources in a certain region, it has brought resource pressure on other regions.
Many regions (sectors) are connected due to increasingly close trade relations. Therefore, the economic loss in one region (sector) due to scarcity of resources will cross geographical boundaries through international trade and transmit the potential economic loss to other regions (sectors). Recently, water scarcity risk has aroused widespread attention [14,15,16,17,18,19]. Due to the close trade ties and increasing lack of water resources, the water scarcity risk is considered to have a chain effect [15,16]. Qu studied the impact of local water scarcity risk on the global trading system from 1995 to 2009 to understand the vulnerability of the global economy to water scarcity [17]. Zhao incorporated water scarcity into the MRIO model to investigate how climate change may affect the global economy via reducing available water resources in some regions [18]. However, most previous studies did not consider the indirect effects and network amplification effects, ignored the potential interactions between risk sources and destinations, and lacked research from a systematic and dynamic perspective. Since the trade relations between countries have formed an intricate system, numerous embodied resource flows in the system have gradually formed, and resource scarcity risk will be transferred with it. Network analysis provides a systematic way to understand the basic laws and characteristics of the complex system [20].
As an effective analytical tool, complex network theory has been applied to the structural analysis of complex giant systems [21,22,23,24] and has been widely used in many scientific fields, including social networks [25,26], energy networks [27,28], climate networks [29,30] and other aspects [31,32]. Recently, many research scholars have combined the MRIO analysis with a complex network approach to reveal the structural characteristics of embodied water, energy, metals, and other resource flows networks at national, regional, and sectoral levels [33,34,35,36]. Liang applied complex network theory to study the structural characteristics of the global embodied metal flow network [34]. Wang built an embodied rare earth flow network and explored the outflow of China’s embodied rare earths [35]. Recently, a network-based framework was proposed to evaluate the water/energy scarcity risk nexus in China’s trading system.
Based on the above, previous studies have explored the embodied transfers of energy, water, and carbon dioxide through trade, but have ignored the problem of economic losses caused by the shortage of resource supply, that is, the resource scarcity risk. As regions are intertwined through increasingly close international trade, direct local economic losses may spread through supply chains to other distant regions, with indirect economic impacts for regions that do not directly experience resource scarcity. This is the result of the indirect and amplified effects of complex systems. Therefore, it is of great significance in this study to explore how natural gas scarcity in some regions affects the B&R economies, and to quantify the natural gas scarcity risk and transfer relationship. The contributions of the study are two-fold: First, with the smooth transition of the world to a low-carbon energy structure, natural gas occupies a key position in the energy supply. Globalization has catalyzed the ever-increasing indirect energy flows between B&R economies. To the best of our knowledge, there exist no studies on the embodied natural gas scarcity risk (EGSR) transmission of the B&R economies. Second, the initial natural gas scarcity risk (IGSR) and cross-region transfer relationship of EGSR are evaluated, and the EGSR transmission network is established for the B&R economies. The network amplification effect has been considered to fill the research gap in the holistic assessment of natural gas scarcity risk at a system scale. Table 1 compares recent studies on virtual transfers in terms of methodology, research scope, and main focus.
The remainder of the paper is organized as follows: Section 2 introduces the methods and data sources used in this study, and Section 3 presents the results of the regional and sectoral features of the EGSR transmission network. Section 4 draws the conclusions and highlights the validity of the proposed framework in revealing the network amplification effect of natural gas scarcity risk, which may provide a network-based systematic insight to strengthen the resilience of the B&R economies.

2. Materials and Methods

2.1. The Multi-Regional Input-Output Model (MRIO)

A multi-regional input-output (MRIO) model is used to study the interdependence of inputs and outputs between various sectors in the economic system [8]. MRIO analysis facilitates the tracking of energy resources or environmental impacts of economic activities to their origin or to where they are utilized through a complex inter-regional supply chain [38]. The MRIO table provides a useful way to reveal the interconnections among sectors and regions. The basic structure of the MRIO table is shown in Table 2. The goods or serviced import from Economy i to Economy j can serve either as intermediate use ( x i j ) or value added ( v i j ). Thus, the total input in Economy j, denoted by x j , is the sum of intermediate inputs and the value added, which is shown in Equation (1),
x j = i = 1 n x i j + i = 1 n v i j .
The direct consumption coefficient b i j reflects the required quantity of imports from Economy i per unit input Economy j, which is expressed as:
b i j = x i j x j .
The matrix expression of the basic form of MRIO model is obtained as follows:
X = V + B X .
Thus, we get:
X = V I B 1 ,
where X is a 1 × n row vector representing the total input of each sector, V is a 1 × n vector representing the value added of each sector. The elements in matrix B are the direct output coefficients, which are defined as the distribution ratio of products from one sector to others. ( I B ) 1 is the Ghosh inverse matrix, of which the elements of a row represent the direct and indirect total output of sectors caused by unitary value added to the sector demonstrated by this row [39].

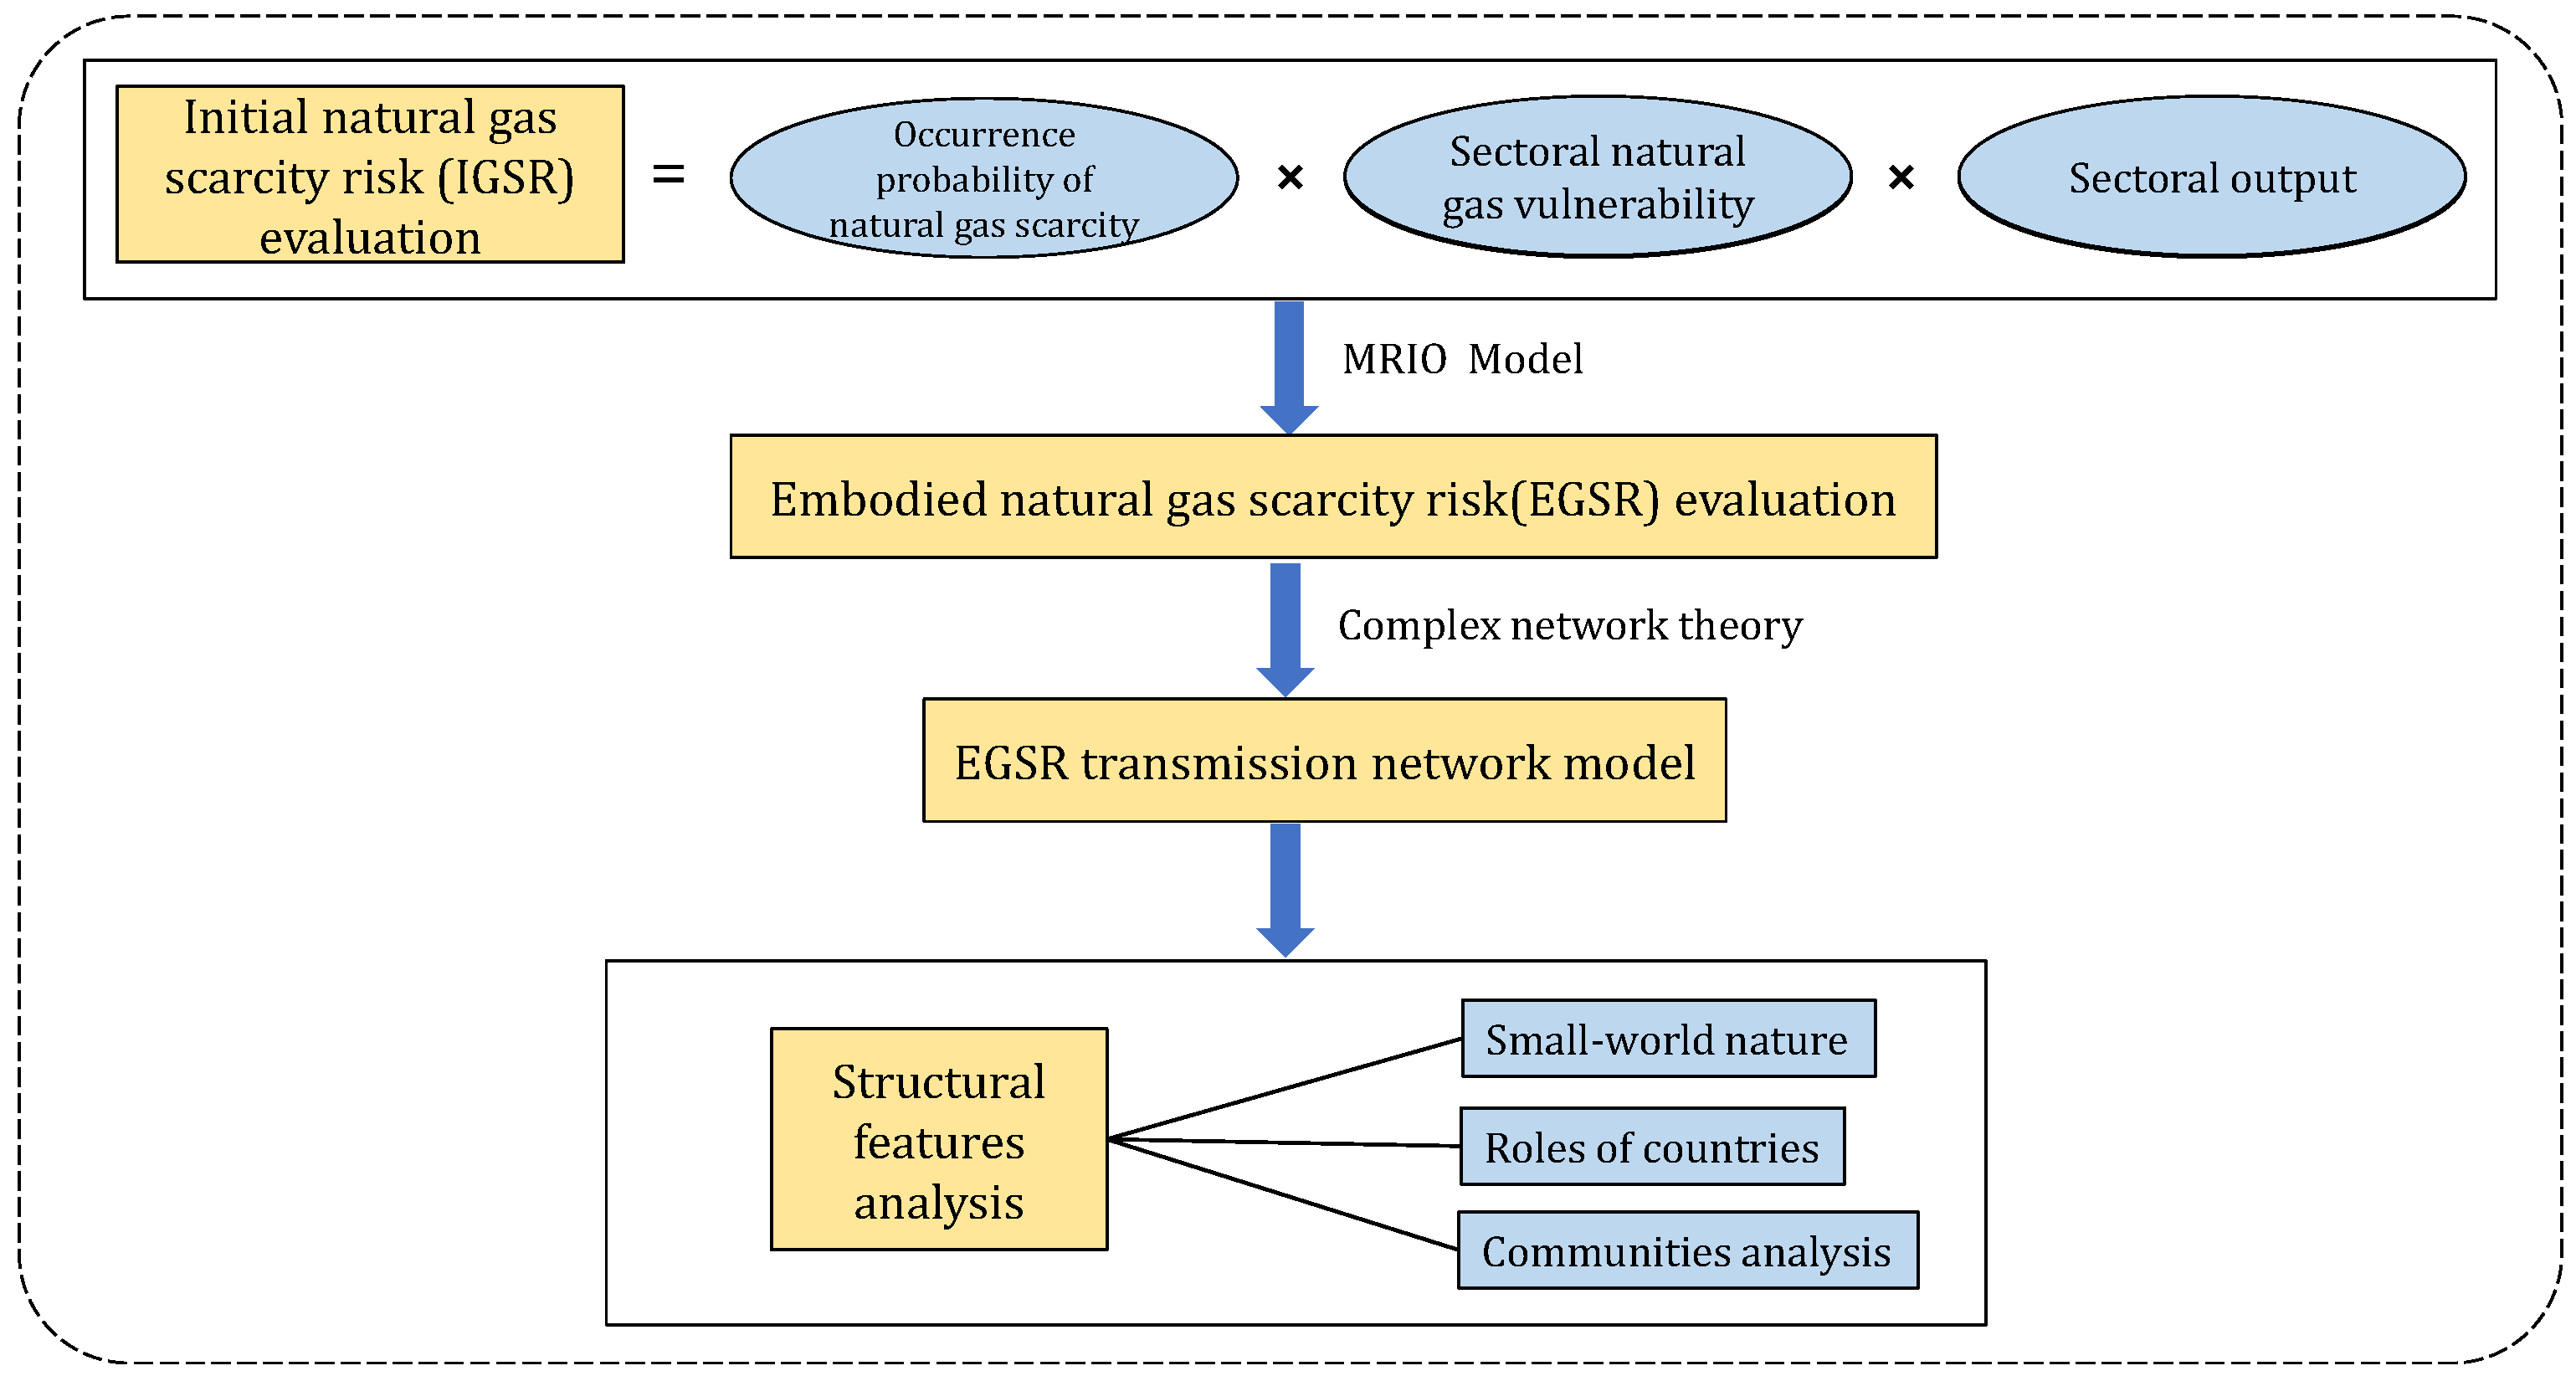
2.2. Natural Gas Scarcity Risk (GSR)

In this study, natural gas scarcity risk (GSR) refers to the potential loss of economic output due to natural gas scarcity. GSR consists of the initial natural gas scarcity risk (IGSR) and embodied natural gas scarcity risk (EGSR). A method based on the framework proposed by Qu [17] is applied to quantify the IGSR and EGSR. This section elaborates on the methodology to quantify IGSR and EGSR of the B&R economies.

2.2.1. Initial Natural Gas Scarcity Risk (IGSR)

The Occurrence probability of natural gas scarcity (GP) evaluates the fraction of a country’s potential reduction due to a shortage of natural gas resources, lying in the interval [0, 1]. The occurrence probability of natural gas scarcity for country c ( G P c ) is evaluated as follows [37]:
G P c = f μ c ; σ = 0 1 1 x x σ 2 π exp ln x μ c 2 π σ 2 d x ,
where μ c = ln 1 G S I c , and σ is a parameter governing the heterogeneity of G P c among countries. Natural gas stress index (GSI) is defined as the ratio of net natural gas imports to natural gas consumption, which reflects a country’s dependence on foreign natural gas resources. By comparing different σ values, we take σ = 1 in this study.
Sectoral natural gas vulnerability ( G V s ) assesses the proportion of sectoral output reduction caused by a 1% reduction in natural gas consumption. The Logistic function is used to transform a sector’s natural gas intensity ( G I s ) into the sectoral natural gas vulnerability [18], as shown in Equation (6):
G V s = g G I s ; α = 1 1 + e α G I s 1 0.001 1 ,
where G I s is the natural gas intensity of sector s, which is the ratio of natural gas consumption to unitary economic output. Parameter α is used to adjust the critical value of G I s curve. By comparing different α values, α = 0.1 is finally chosen for the main results.
Based on the above, the initial natural gas scarcity risk I G S R s , c can be estimated by multiplying the occurrence probability of natural gas scarcity G P c , sectoral natural gas vulnerability G V s , and economic output of each sector x s , c , as shown in Equation (7) [17]:
I G S R s , c = G P c × G V s × x s , c .

2.2.2. Embodied Natural Gas Scarcity Risk (EGSR)

The embodied natural gas scarcity risk (EGSR) is computed by diagonalizing vector I G S R first, and then multiplying it by the Ghosh inverse matrix [18], as shown in Equation (8). The elements in a column reflect the output losses of the specific sector induced by the IGSR of each sector represented by the row.
E G S R = diag I G S R × I B 1 .
Therefore, E G S R imports and E G S R exports for country i are calculated by Equations (9) and (10):
E G S R i i m = j i E G S R j i ,
E G S R i e x = i j E G S R i j .

2.3. EGSR Transmission Network Construction and Analysis

The natural gas scarcity risk flows embodied in the B&R economies form the EGSR transfer network. The complex network model G = ( V , E ) contains a series of nodes and edges [40], where G represents the network, V and E respectively represent the set of nodes and the set of edges in the network. In this work, the countries (sectors) are the nodes, and the EGSR flows are edges with direction. For any given pair of nodes i , j V , if there is a directed edge connecting from i to j, then e i j = 1 . Otherwise, e i j = 0 . A = ( e i j ) n × n ) is the adjacency matrix. For a weighted and directed network, the weighted adjacency matrix W = ( w i j ) n × n ) , where w i j represents the weight of edge e i j .

2.3.1. Small-World Nature

Average clustering coefficient and average path length are usually chosen to evaluate the small world nature of a network [41,42]. The clustering coefficient measures the degree to which the neighboring nodes of a node gather together to form a cluster (complete graph). It can be expressed as the ratio of the actual number of edges between the neighboring nodes of one node to the number of all possible edges. The average clustering coefficient C is the average of the clustering coefficients of all nodes in the network, which can be calculated by Equation (11):
C = 1 N i = 1 N c i ,
where c i = e i k i ( k i 1 ) , k i is the degree of node i, e i is the number of actual edges between the neighboring nodes of node i, and N is the number of nodes in the network. It reflects the concentration of EGSR transmission network. A larger value indicates a closer connection between nodes in the network.
The shortest path between nodes i and j in the network is the path with the least number of edges connecting i and j. The average shortest path length L is computed as Equation (12):
L = 1 N ( N 1 ) i j d i j ,
where d i j is the number of edges connecting i and j on the shortest path of a given network. In this paper, it reflects the efficiency of EGSR transfer in countries along the BRI.
The small world quotient σ is obtained by comparing the clustering and path length of a given network to an equivalent random network with the same average degree, which can be calculated by Equation (13):
σ = C C r L L r ,
where C r and L r represent the average clustering coefficient and the average shortest path length of the equivalent random network, respectively.

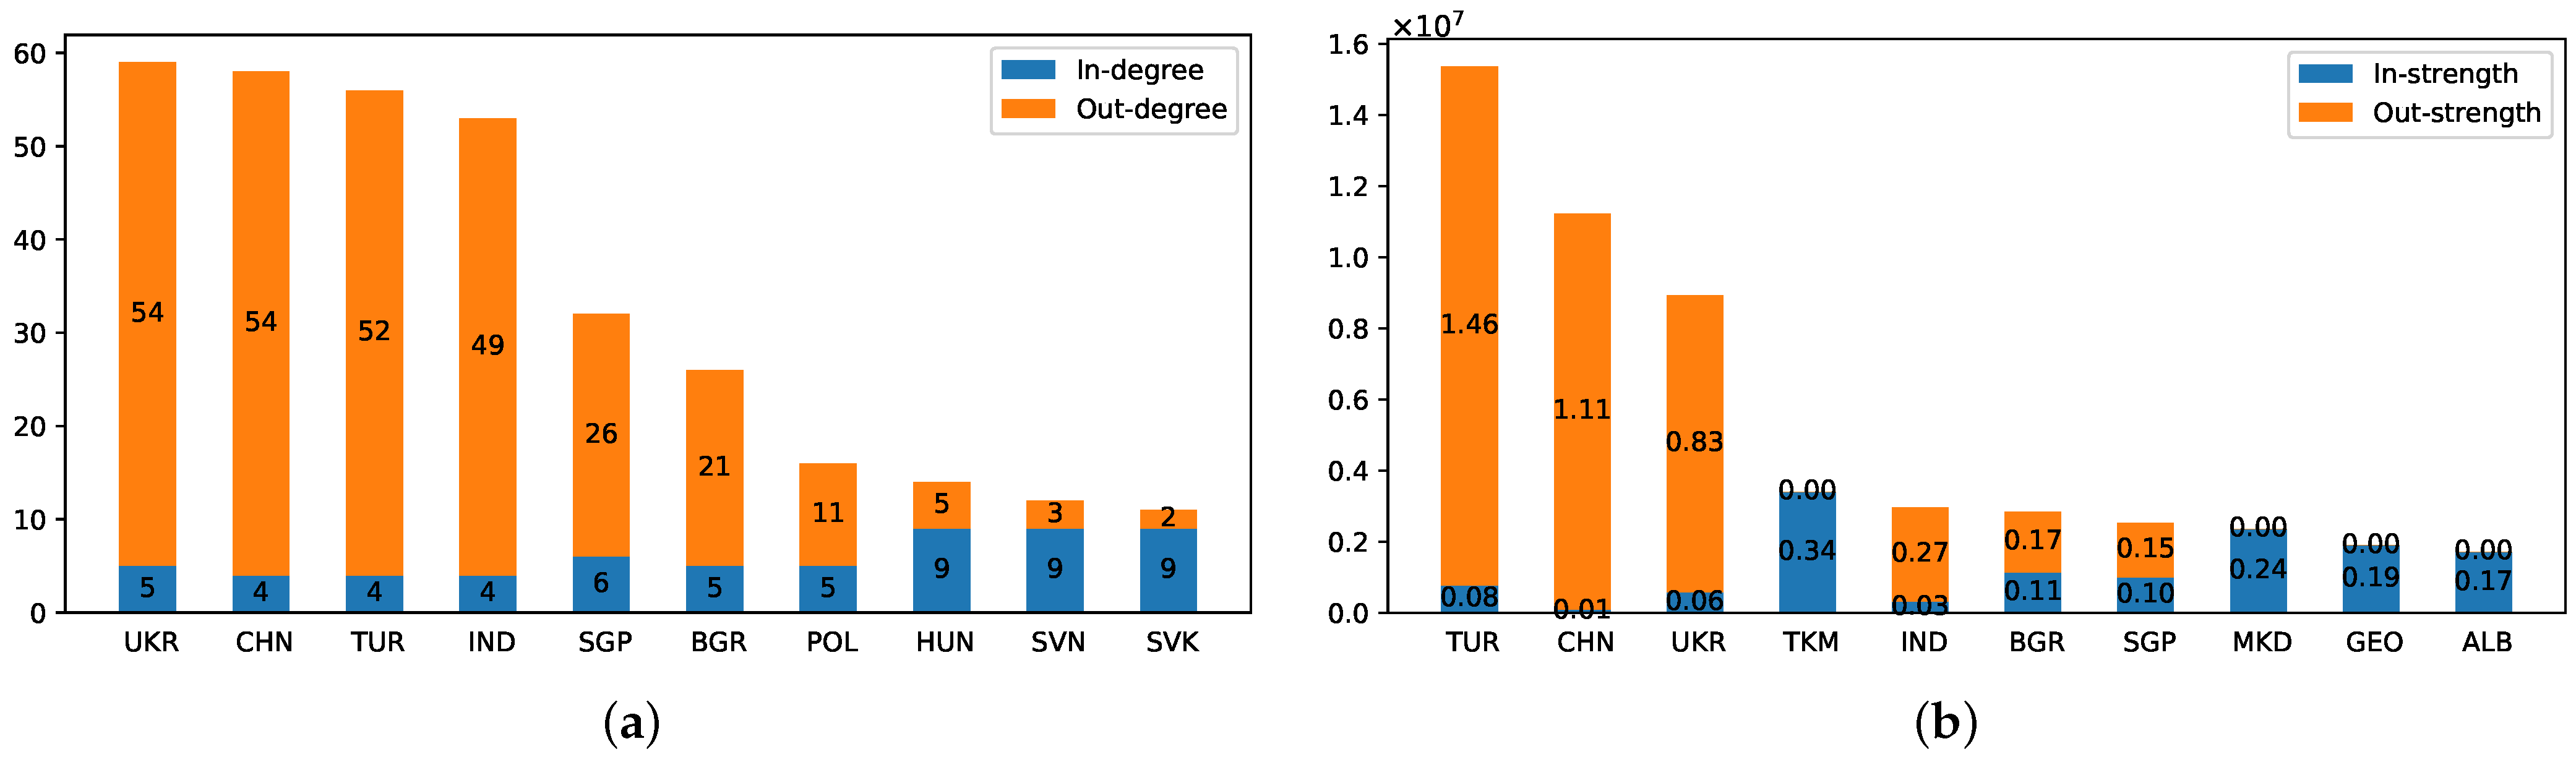
2.3.2. Degree and Strength Analysis
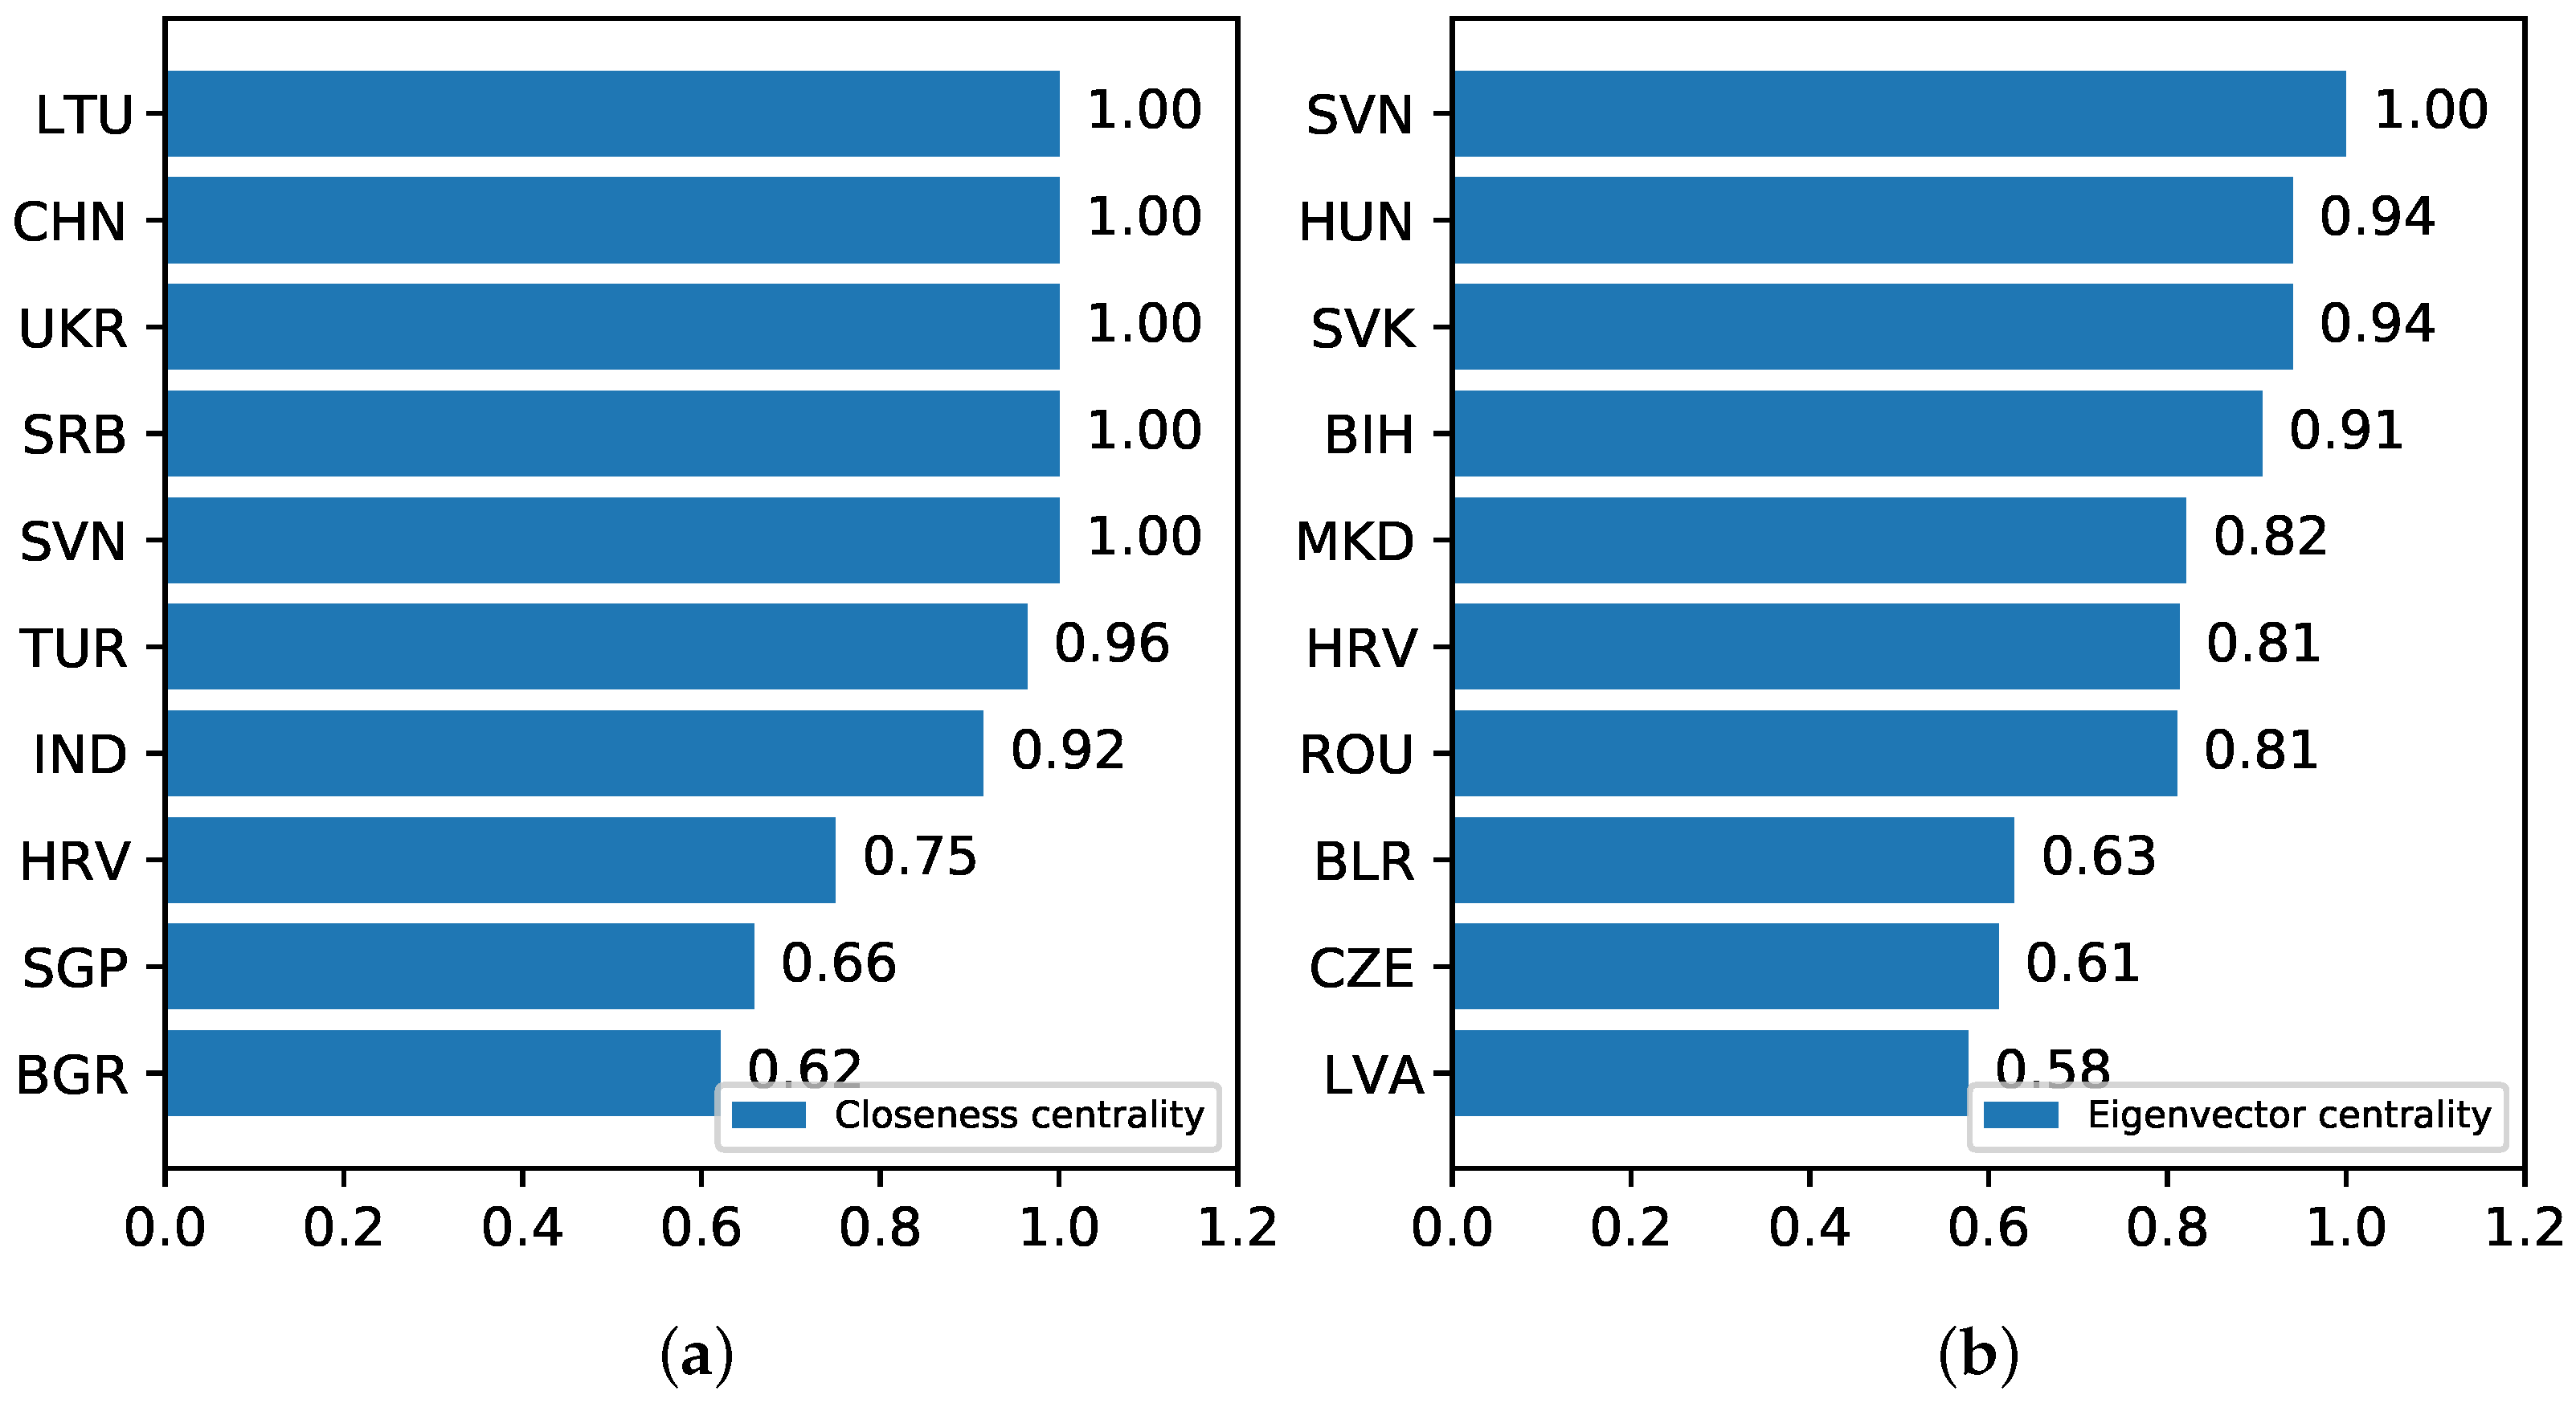
The degree of country i represents the number of risk transmission channels that the country has [43]. Degree contains two indexes: the in-degree and the out-degree. The in-degree of country i D i i n indicates the number of import risk channels of i, and the out-degree D i o u t refers to the export risk channels. The formulas are as follow:
d i i n = j i e j i ,
d i o u t = j i e i j .
The strength of country i denotes the total amount of risk transmitted by country i in the network [29]. It can also be divided into two indexes: the in-strength and the out-strength. The in-strength of country i represents the amount of risk that country i imports, and the value of the out-strength reflects the amount of risk that country i exports. They are calculated as follows:
s i i n = j i w j i ,
s i o u t = j i w i j .

2.3.3. Centrality

The node centrality measures its relative importance in a network, so the nodes with high centrality form the main framework of a network. In this section, closeness centrality and eigenvector centrality are used for further analysis.
Closeness centrality is used to measure the average shortest-path length for a country to establish a link with other countries, reflecting its distance from other countries [40]. In the EGSR transmission network, a country with a high value of closeness centrality can easily access risk. The following equation is used to calculate the closeness centrality of node i:
C C i = N 1 j = 1 N d i j ,
where N is the number of countries, d i j represents the shortest-path length from country i to country j.
Eigenvector centrality is another indicator to calculate the centrality of a node in a network [44]. It states that the importance of a node depends both on the number of other nodes and on the importance of each neighbor node. In the EGSR transmission network, a country with a high value of eigenvector centrality is an important risk spreader, and the countries connected to it also have a large amount of risk transmission. The eigenvector centrality of node i is calculated as:
E C i = 1 λ j N i ω i j E C j ,
where λ is a constant, N i is the set of neighbor nodes of node i, and ω i j is the risk exported from i to j.

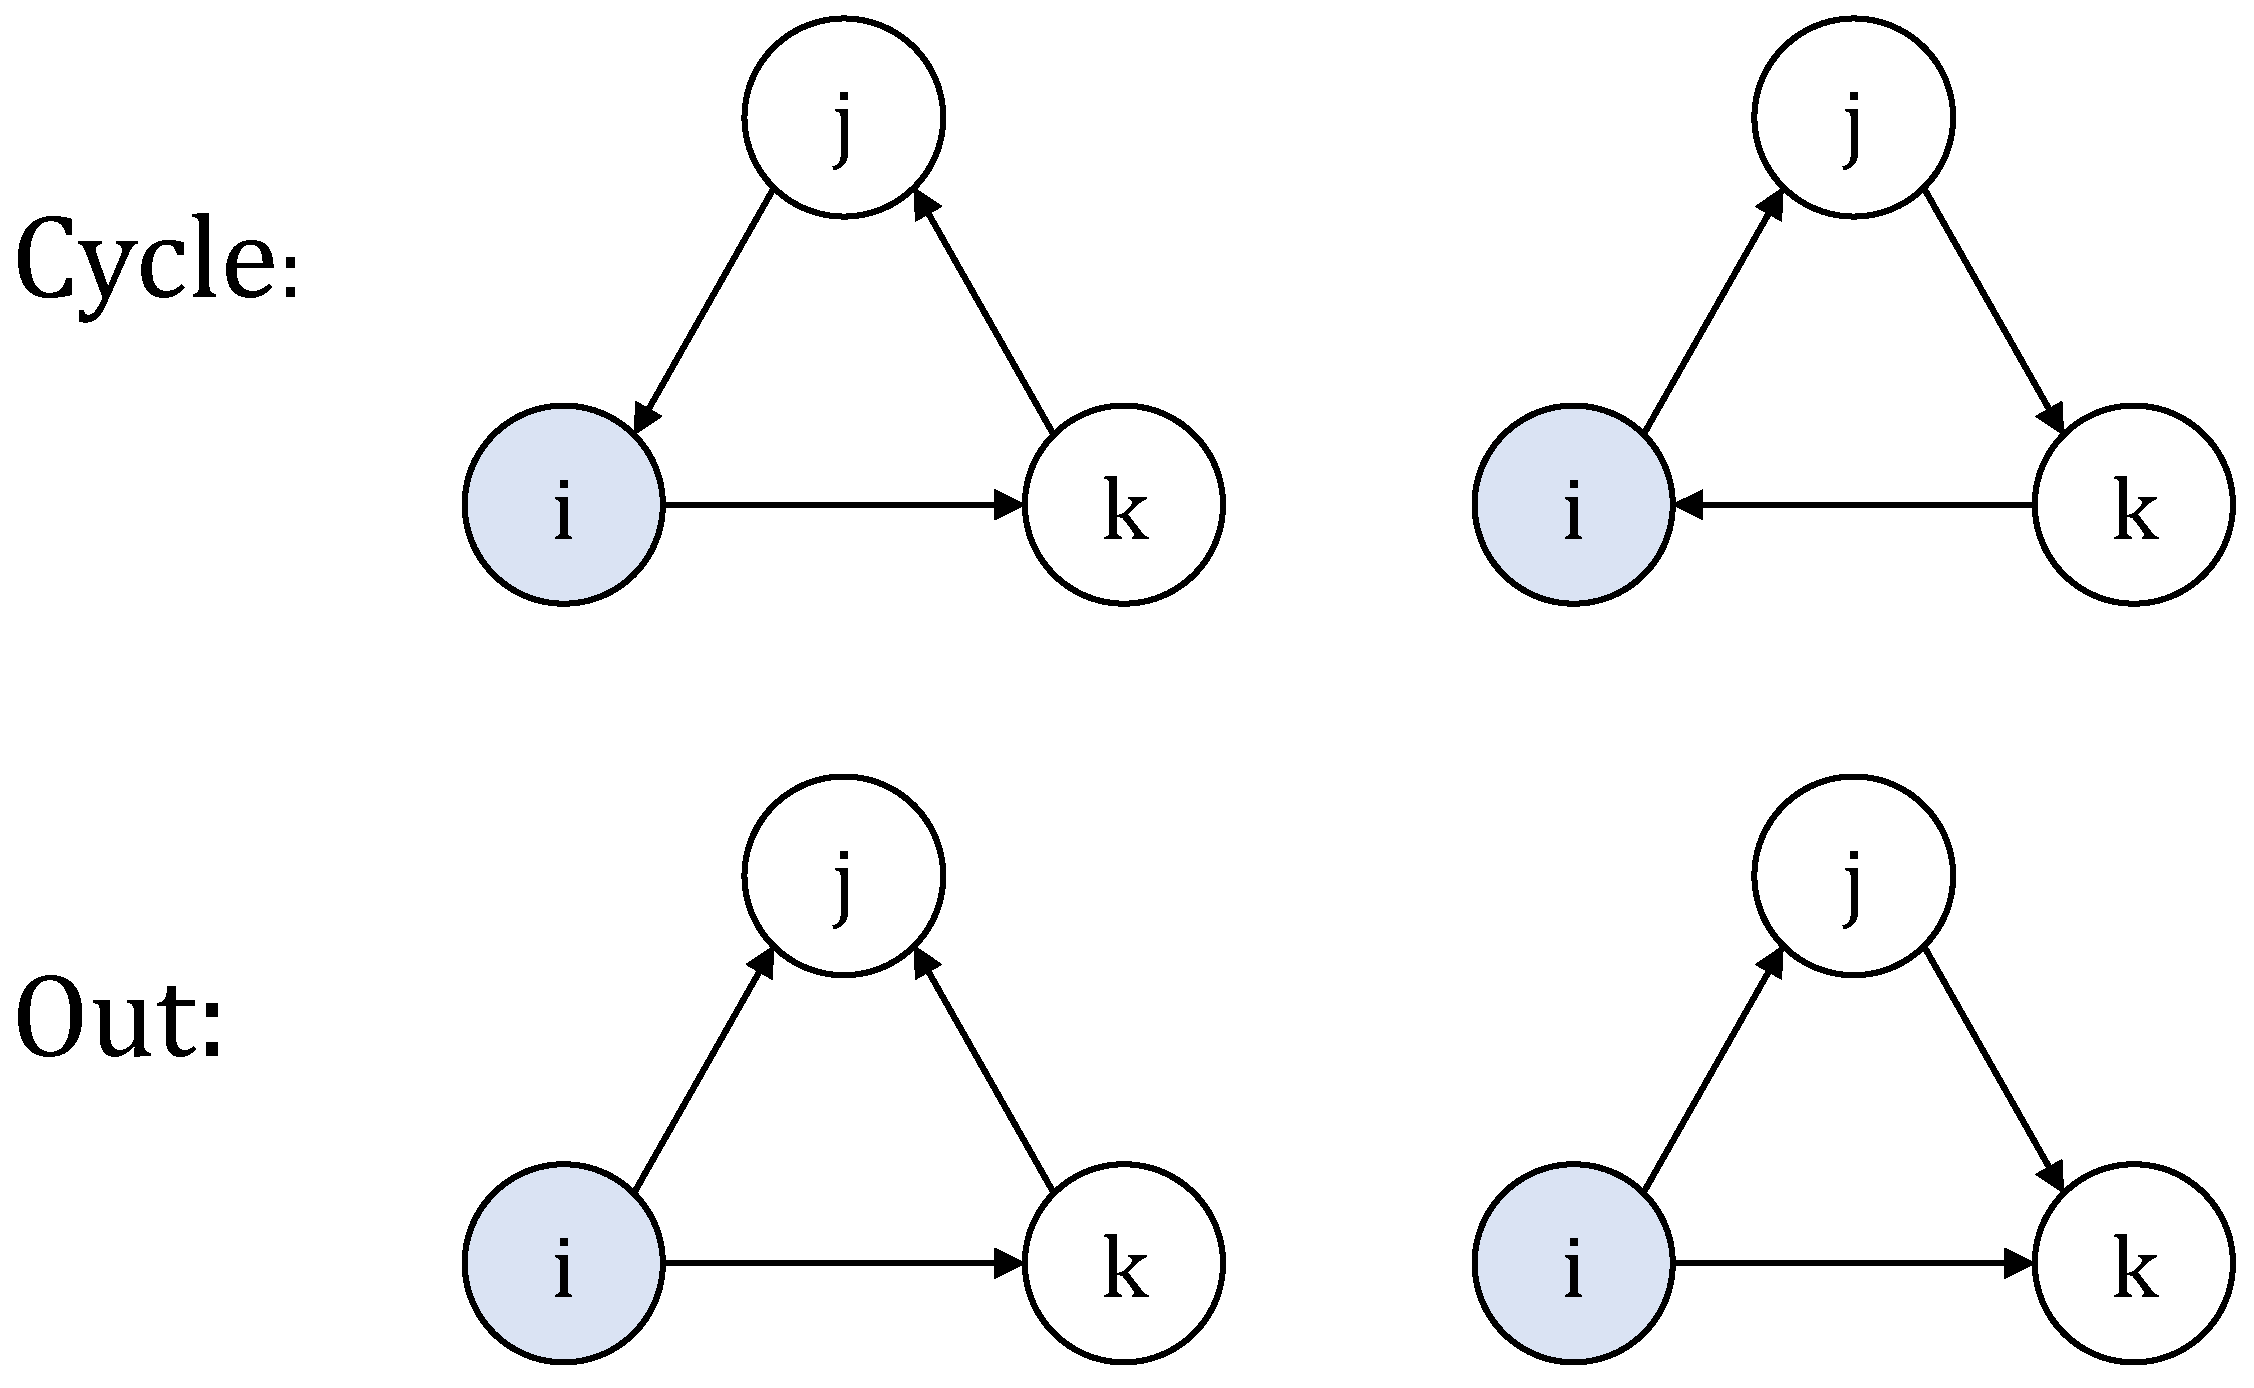
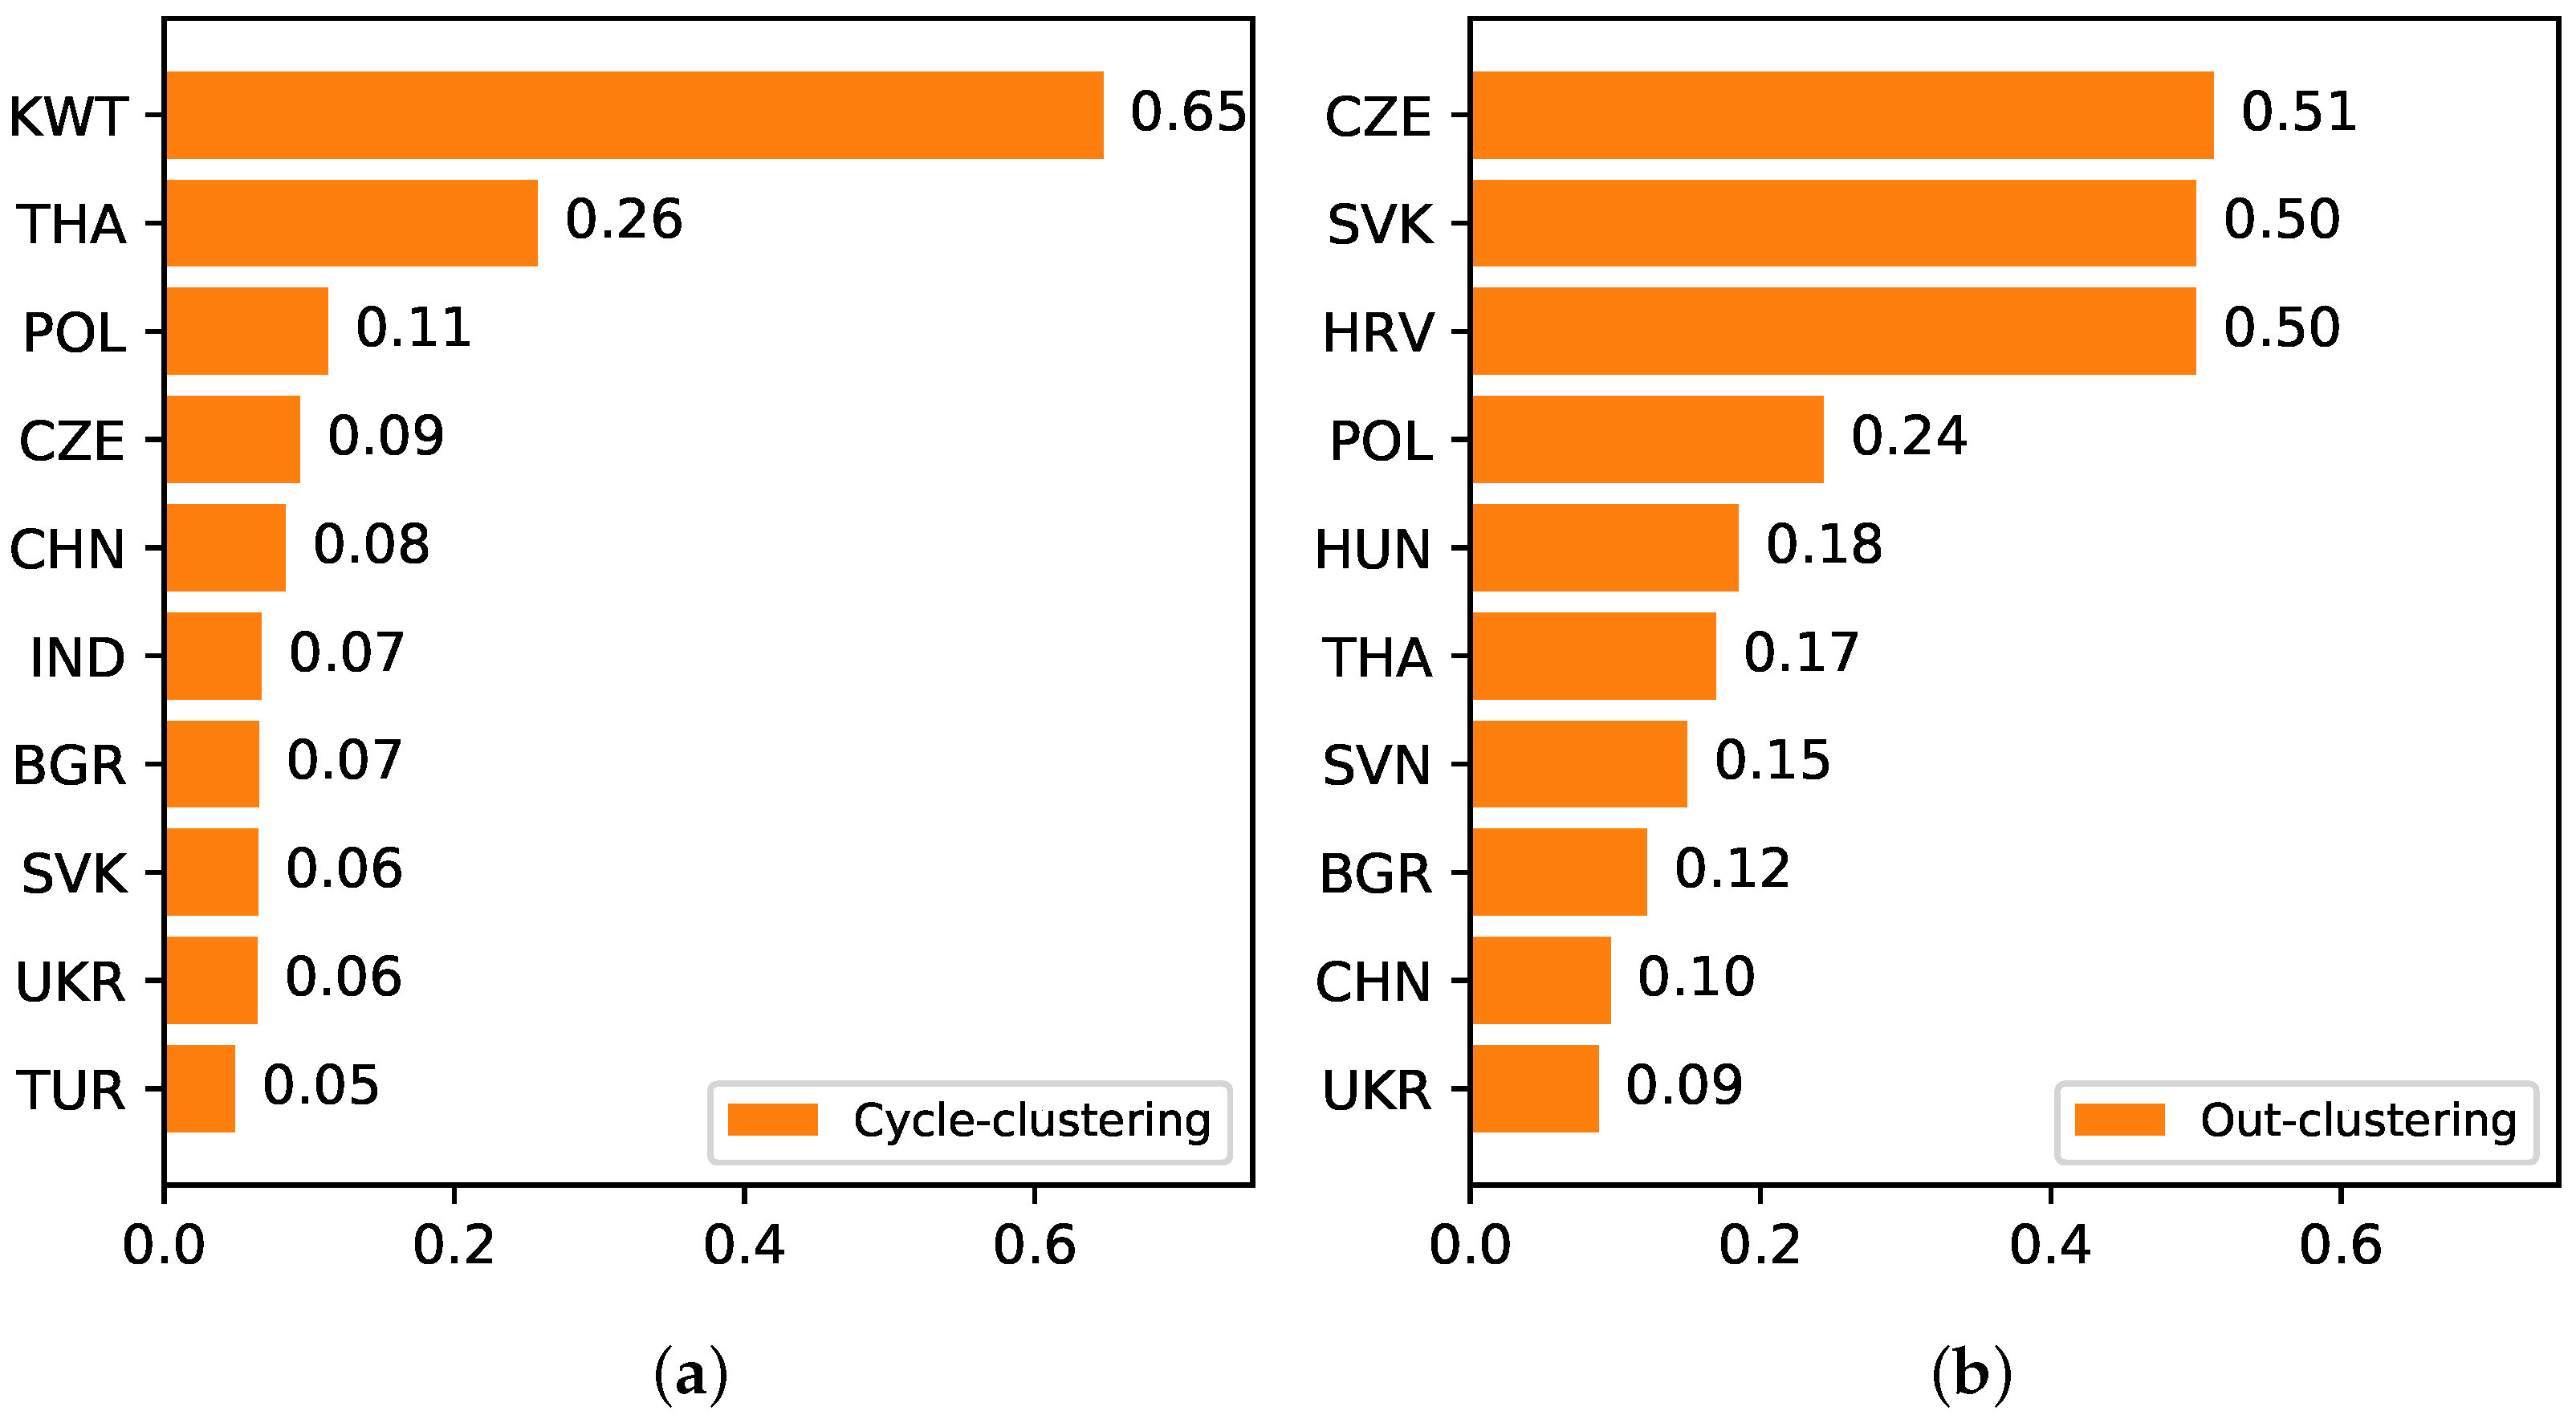
2.3.4. The Weighted and Directed Clustering Coefficients

In a directed and weighted EGSR transmission network, the weighted and directed clustering coefficients proposed by Clemente [45] are used to evaluate the tendency of nodes to gather together. The local cycle-clustering coefficient of node i counts the triangles of which the directed edges form a cycle. The local out-clustering coefficient of i is the proportion of triangles that have two edges from i pointing to j and k and an edge linking j and k in either direction. A schematic diagram of these two types of triangles is shown in Figure 1. The formulae of the local cycle-clustering coefficient and the local out-clustering coefficient are respectively expressed as follows:
C i c y c = ( A A T + W A T A ) i i ( s i i n d i o u t + s i o u t d i i n ) ( A W + W A ) i i ,
C i o u t = [ W T ( A + A T A ] i i 2 s i o u t ( d i o u t 1 ) ,
where A T is the transpose of A, and ( A ) i i denotes the i-th element on the diagonal of A.

2.3.5. Communities

It has been observed that many real networks appear as edges concentrated in special groups of nodes called communities (or clusters). The nodes in the community have some common functional properties. Therefore, community analysis of a given network helps to detect some hidden features of its topology. The algorithm developed by Lyu [46] is introduced to divide the network into communities. The algorithm is based on a variable called modularity, which can be calculated as:
Q = 1 2 W i , j w i j s i s j 2 W × δ C i , C j ,
where W is the total strength of the network. s i = s i i n + s i o u t , and δ C i , C j is 1 if nodes i and j are in the same community and 0 otherwise.
The analysis framework of this work is shown in Figure 2.

2.4. Data Sources

The global MRIO model has been chosen for revealing the EGSR flows between regions (or sectors). The MRIO data is taken from Eora [47,48]. Each global input-output table contains 189 countries and regions and 26 sectors in each country. The import, export, and consumption of natural gas in each country are provided by The World Factbook of Central Intelligence Agency [49]. The BRI is an open international economic cooperation network that is not restricted to a specific spatial scope. Due to missing data, 55 B&R economies are considered, including 35 Asian countries, 19 European countries, and 1 African country, listed in Appendix A Table A1. This study was conducted for the year 2015 for which most recent data are available.

3. Results

3.1. Small-World Nature

In complex network theory, a small-world network is a special complex network structure, in which more than half of the nodes are not neighbors, but most of the nodes can be accessed after a few steps [41]. This relationship can be quantified by the average clustering coefficient and the average path length. In the EGSR transmission network, the average clustering coefficient is 0.745, and the average path length is 2.043. The result indicates that more than half of the partners of a node are likely to be partners of other nodes. The average EGSR transmission length from one node to another takes about two steps. The existence of the small-world nature is verified by calculating the small-world quotient far greater than 1 [50]. The small-world quotient of the EGSR transmission network is 9.168, which proves that the network has small-world characteristics. Due to the sensitivity of small-world network, natural gas scarcity risks that occur in highly connected regions or sectors will quickly spread to distant regions or sectors and may lead to economic losses throughout the trade chain.

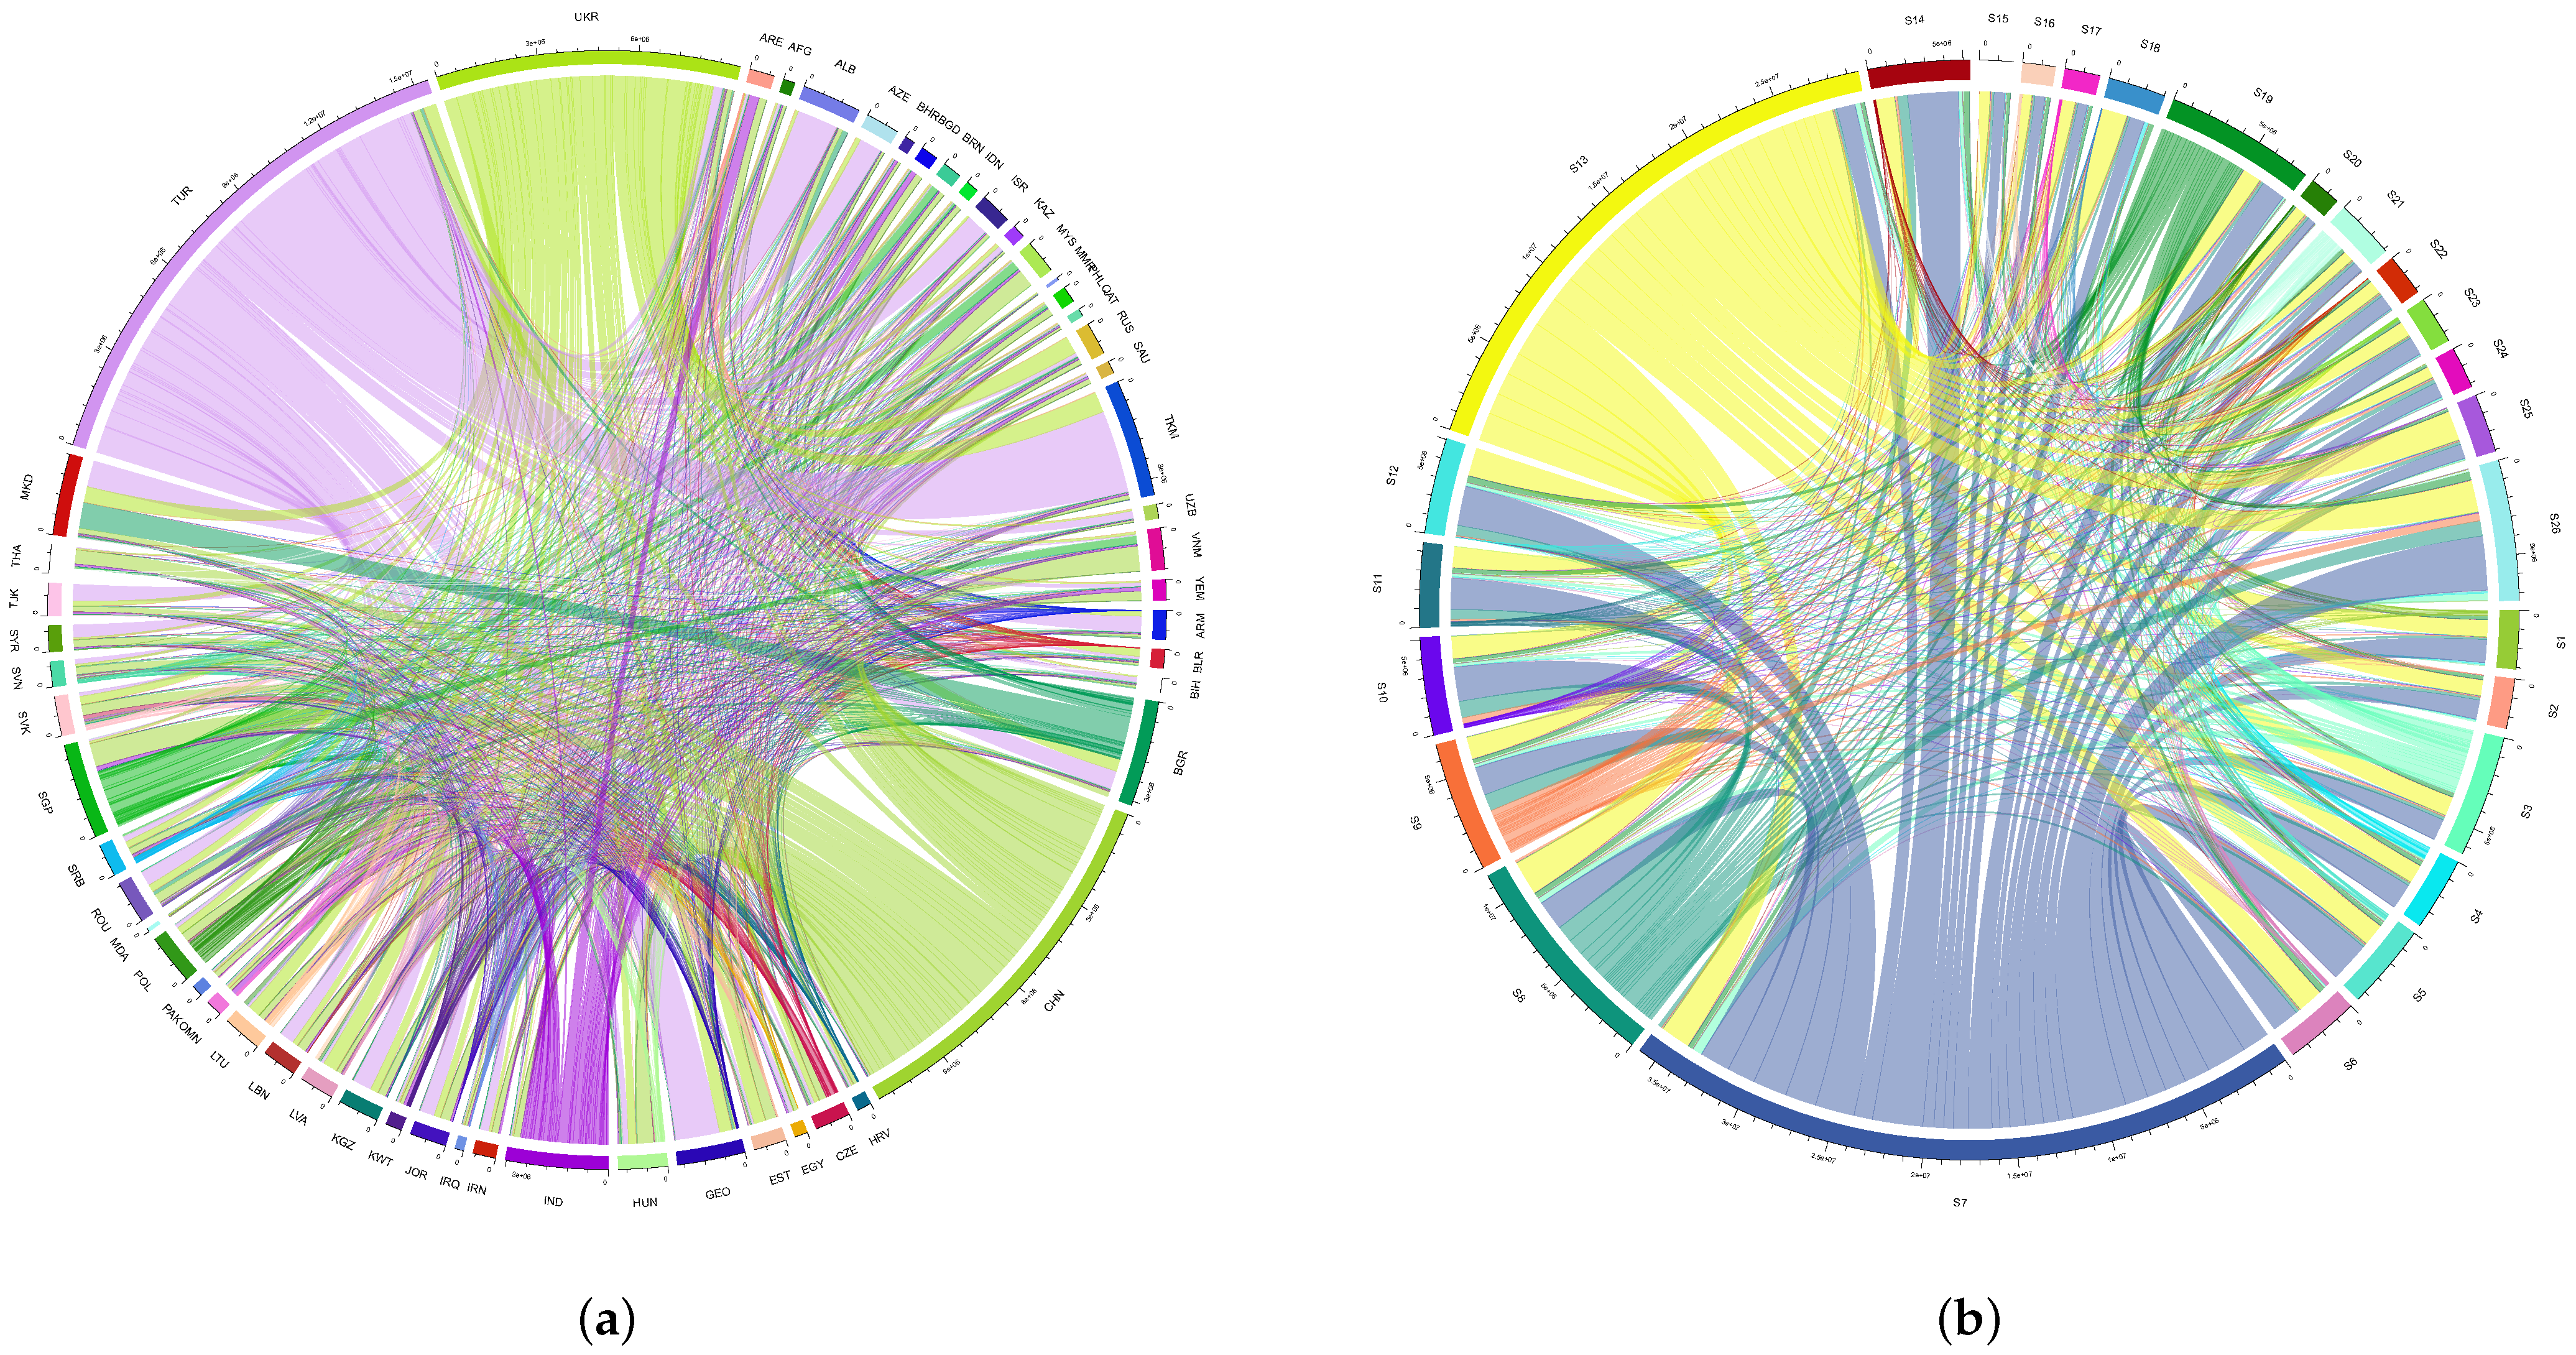
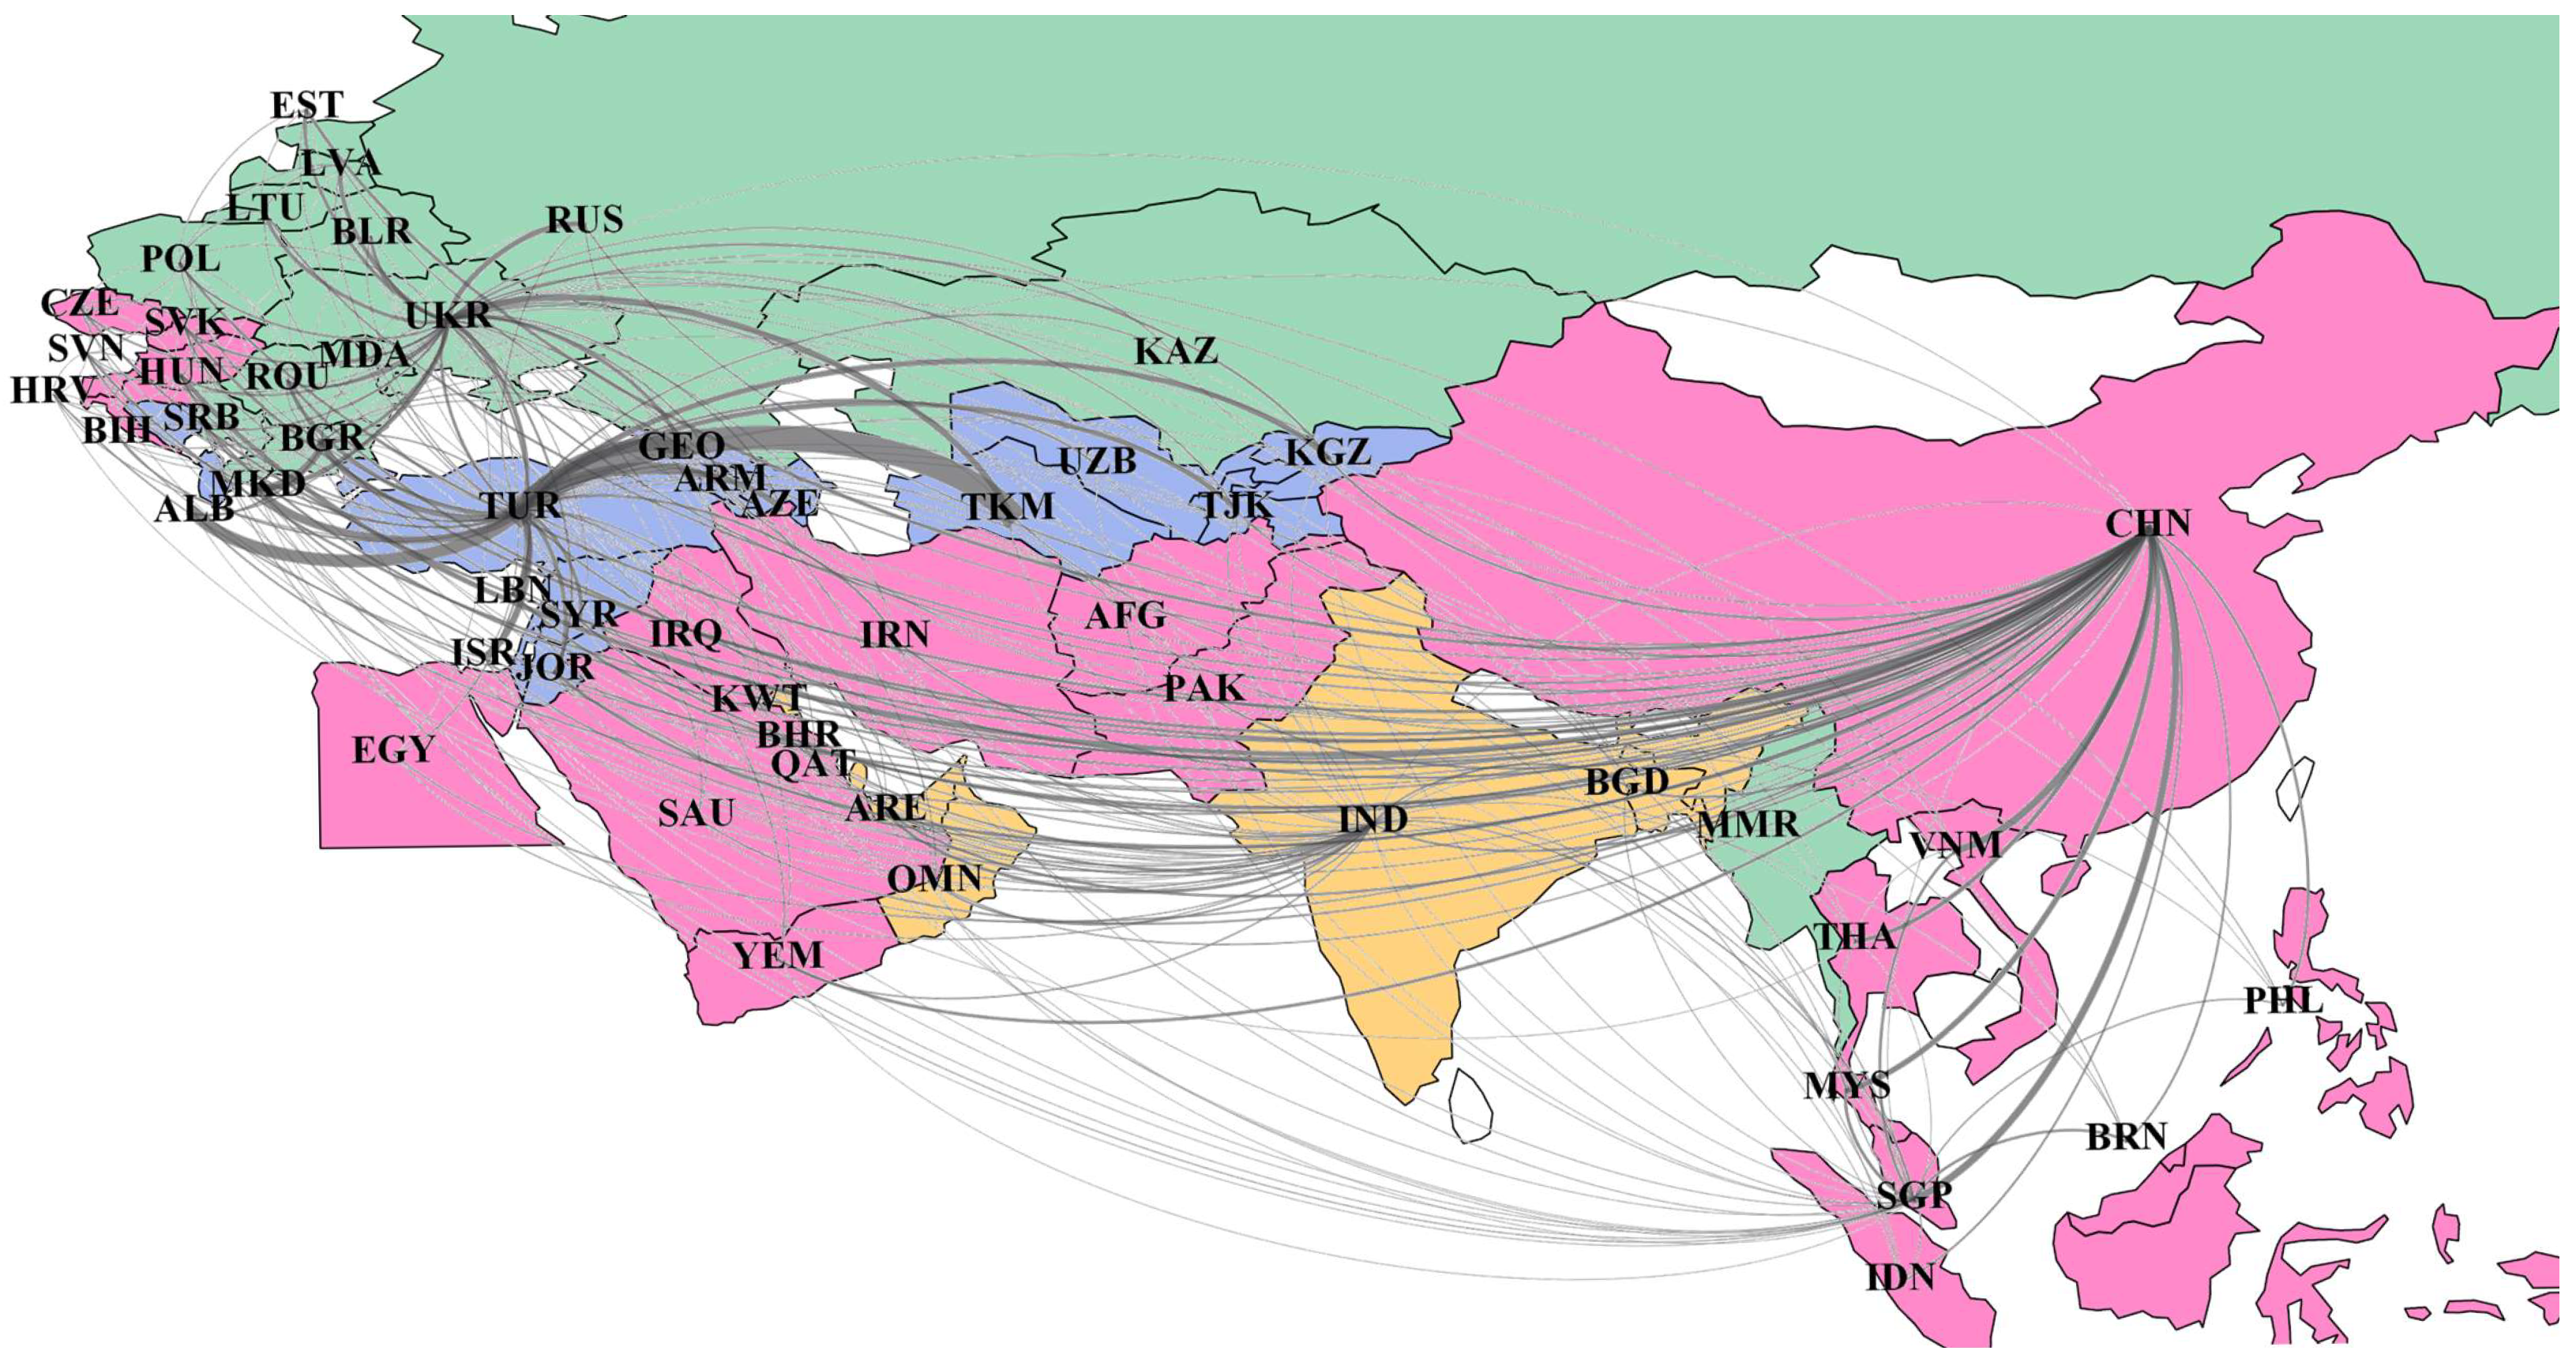
3.2. Major EGSR Flows

The chord plots of the EGSR transmission networks aggregated by economies and sectors are shown in Figure 3a,b, respectively. In Figure 3a (Figure 3b), the outer arcs of different colors represent different economies (sectors), and the arc length represents the sum of EGSR imports and exports. The chord from one arc to another represents the EGSR transfer flow from the corresponding economy (sector) to another. Its width is proportional to the EGSR transfer volume, and its color is consistent with that of the source.
Table 3 shows the top 10 EGSR flow relationships at the national level. The main sources of EGSRs transfer are Turkey, China, Ukraine, and Bulgaria, with total exports of 35.9 million US dollars. It accounts for 82.7% of the total EGSR exports. If natural gas resources in these countries are in short supply, the economic losses caused could have a noticeable impact on downstream countries. The GSRs from these countries are mainly transferred to Turkmenistan, Georgia, Macedonia, etc. They are vulnerable when faced with a shortage of natural gas resources in upstream economies.
Table 4 lists the top 10 EGSR flow relationships at the sectoral level. The petroleum, chemical, and non-metallic mineral products sector in countries with scarce natural gas, such as Turkey and Bulgaria, account for 30.9% of the EGSR exports, which causes serious risks to downstream sectors of other countries through trade. For imports, considering that the petroleum, chemical, and non-metallic mineral products, as well as Re-export and Re-import sectors, are the main importers, their economies are sensitive to the GSR of upstream sectors of the supply chain.

3.3. Roles of Countries

In this section, several indicators are introduced to measure the different structural roles of the countries. Figure 4a shows the degree, in-degree, and out-degree of all BRI economies. As shown in Figure 4a, Ukraine ranks first in the degree measurement with 59 EGSR transfer relations, followed by China, Turkey, and India. Moreover, it can be found that the in-degrees of all countries are not much different. Countries with a higher degree also have a higher out-degree. Many downstream countries in the supply chain regard them as the main EGSR sources. Figure 4b shows the strength, in-strength, and out-strength of all BRI economies. The top three countries with high strength also have particularly high out-strength, including Turkey, China, and Ukraine. They contribute significantly to the transfer of EGSR as exporters. There are also countries with higher strength due to higher in-strength, such as Turkmenistan and TFYR Macedonia. This shows that the economic sectors of these countries are largely dependent on imports from countries with scarce natural gas.
Closeness centrality describes how easy it is for a node to access other nodes. In the EGSR transmission network, closeness centrality reflects the transmission speed of EGSR from one country to the others. As shown in Figure 5, the closeness values of China, Ukraine, Serbia, Turkey, and India are relatively large, indicating that the embodied natural gas scarcity risk transfers fast and is transmitted to other countries through relative short paths. Eigenvector centrality is used to measure the importance of one node’s neighbors. Figure 5 also shows that the eigenvector values of Slovenia, Hungary, and Slovakia are relatively high. The result indicates that these countries have important transmission partners, and these partners have many EGSR transmission relationships and transmission volumes.
Figure 6 shows two special types of weighted and directed clustering coefficients for 14 countries and 0 for the remaining countries. The out-clustering coefficients of Czech Republic, Croatia, and Slovakia are significantly higher than other countries. This indicates that EGSR transfer is prone to occur between their downstream countries. Kuwait has a larger cycle-clustering coefficient, followed by Thailand, Poland, Czech Republic, etc., which indicates that the transfer chain of EGSR is easily formed between these countries.

3.4. Communities

Figure 7 visualizes the community structure of the EGSR transmission network. It can be found that the network is divided into four communities. Community 1-CA-SE is centered in Turkey and is composed of Central Asia (CA) and South Europe (SE). Community 2-WSEA-CE is formed by countries in West Asia (WA), Southeast Asia (SEA), and Central Europe (CE), and is centered around China. Community 3-EE-NSA is composed of Eastern Europe (EE), North Asia (NA), and South Asia (SA), and is centered around Ukraine. India leads Community 4-SA, which is mainly composed of South Asian countries.
The amount of EGSR transfer within Community 1-CA-SE is more than twice that of EGSR imports and nearly 1.5 times that of EGSR exports. The amount of EGSR transfer within Community 2-WSEA-CE is more than the EGSR imports and is more than 1.5 times the EGSR exports. The results imply that the EGSRs transfer of Community 1-CA-SE and Community 2-WSEA-CE are more regionally concentrated, so these two communities should consider implementing strict community-based strategies to reduce risk transmission within the community. The amount of EGSR transfer within Community 3-EE-NSA is almost the same as that of EGSR imports and EGSR exports. Both the EGSR imports and EGSR exports of Community 4-SA are more than twice the amount of EGSR transmission within the community, indicating that the EGSR transmission of Community 4-SA mainly occurs with other communities. In other words, the high mitigation responsibilities of Community 1-CA-SE and Community 2-WSEA-CE are mainly attributable to themselves, while Community 4-SA is more so suggested by its internal EGSR transfer relationship.

4. Discussion and Conclusions

This study adopted MRIO analysis and complex network theory to explore the characteristics and laws of the EGSR transmission system of B&R countries. Firstly, the initial natural gas scarcity risk (IGSR) of different countries was estimated by combining the natural gas stress index, natural gas intensity, and economic output. Then, the transmission matrix of embodied natural gas scarcity risk (EGSR) was obtained by combining IGSR and the input-output relationship between various regions. After constructing the EGSR network, the characteristics of the network were analyzed.
The small-world nature of the network provides insights into the risk transfer relationship from a regional perspective. Any disruption to key nodes can quickly spread to other nodes via the supply chain, leading to large-scale changes in the function of the system. The EGSR transmission network has a small-world nature, which shows that the system is robust when faced with random disturbances, but is prone to collapse under targeted attacks. On the export side of EGSR, Turkey, China, Ukraine, and India have large EGSR exports and more transfer partners, and their closeness centrality is also ranked first. The results show that the shortage of natural gas resources in these countries may have a non-negligible impact on downstream countries or sectors, and the resulting economic losses spread quickly. At the sectoral level, EGSR mainly flows from Petroleum, Chemical and non-metallic Mineral Products sector and Electricity, Gas and Water, Metal Products, Machinery sector to Petroleum, Chemical and non-metallic Mineral Products and other sectors. These sectors are mainly energy-intensive industries. It shows that the EGSR transmission between energy-intensive sectors is quite frequent. Therefore, political makers should focus on these energy-intensive industries to improve energy efficiency and accelerate the transformation of energy consumption behavior. On the import side, Turkmenistan, Macedonia, and Georgia imported more EGSRs than other countries. This reflects the characteristics of the local economy, which depends on importing products from countries or sectors with scarce natural gas. Their economies are sensitive to the natural gas scarcity risk in upstream countries or sectors in the supply chain. Moreover, the eigenvector centrality defines the centrality of a node based on the importance of the connection relationship of the node. It can be found that Slovenia, Hungry, and Slovakia occupy a central position in connecting to countries with higher EGSR transfer volume and transfer partners. Czech Republic, Croatia, and Slovakia have high out-clustering coefficients, indicating that their downstream countries have a relatively high proportion of EGSR transmission. Countries such as Kuwait, Thailand, and Czech Republic with high cycle-clustering coefficients, indicate that a triangular chain of EGSR transmission is easily formed between these countries. It is precise because of the structural superiority of these countries and sectors in the EGSR transmission network, as they have great potential in alleviating the losses caused by the natural gas scarcity in the B&R economies. Furthermore, the EGSR transmission network is separated by four clusters, and most countries are centered around the local center, which is the major EGSR exporters, such as Turkey, China, Ukraine, and India. Community analysis revealed that the community 1-CA-SE and community 2-WSEA-CE should focus more on mitigation goals within the community. Community 4-SA should strengthen trade management with other communities to effectively avoid the spread of GSRs.
In summary, since the transmission of EGSRs has a huge impact on the global economy, the structural analysis of the EGSR transmission network can enable governments and enterprises to better understand the EGSRs they may face and help them develop strategies to mitigate such risks. On the import side, governments and decision makers downstream of the supply chain should optimize the local consumption structure and reduce the consumption of natural gas-intensive products. On the import side, downstream countries should optimize their local consumption structure and consume less natural gas-intensive products. This in turn encourages upstream suppliers to improve the efficiency of natural gas use and minimize the negative consequences of natural gas scarcity risks. In addition, four regional communities centered on major exporters were identified. Community structure analysis suggests that countries in the same community can form a GSR mitigation club to promote technological upgrading and trade structure adjustment. We also call for the establishment of a collaborative management mechanism for natural gas resources between communities to promote the rational allocation of resources and avoid the large-scale spread of economic losses caused by the shortage of natural gas.

Author Contributions

R.D.: conceptualization, methodology. Q.W.: software, writing—original draft. Z.N.: visualization, writing—original draft. G.D.: methodology, writing—review and editing. L.T.: supervision, writing—review and editing. F.W.: investigation, data curation. All authors have read and agreed to the published version of the manuscript.

Funding

This research was financially supported by the National Natural Science Foundation of China (Grant Nos. 71974080, 61973143, 11731014, 51876081), the Major Program of National Natural Science Foundation of China (Grant No. 71690242), and the National Key Research and Development Program of China (Grant No. 2020YFA0608601).

Institutional Review Board Statement

Not applicable.

Informed Consent Statement

Not applicable.

Data Availability Statement

Not applicable.

Acknowledgments

This research was financially supported by the National Natural Science Foundation of China, the Major Program of National Natural Science Foundation of China, National Key Research and the Development Program of China. G.D. thanks Young backbone teachers of Jiangsu Province.

Conflicts of Interest

The authors declare no conflict of interest.

Appendix A

Table A1. Countries, codes, and continents.
CountryCodeContinentCountryCodeContinent
AfghanistanAFGAsiaLithuaniaLTUEurope
AlbaniaALBEuropeMalaysiaMYSAsia
ArmeniaARMAsiaMoldovaMDAEurope
AzerbaijanAZEAsiaMyanmarMMRAsia
BahrainBHRAsiaOmanOMNAsia
BangladeshBGDAsiaPakistanPAKAsia
BelarusBLREuropePhilippinesPHLAsia
Bosnia and HerzegovinaBIHEuropePolandPOLEurope
BruneiBRNAsiaQatarQATAsia
BulgariaBGREuropeRomaniaROUEurope
ChinaCHNAsiaRussiaRUSEurope
CroatiaHRVEuropeSaudi ArabiaSAUAsia
Czech RepublicCZEEuropeSerbiaSRBEurope
EgyptEGYAricaSingaporeSGPAsia
EstoniaESTEuropeSlovakiaSVKEurope
GeorgiaGEOAsiaSloveniaSVNEurope
HungaryHUNEuropeSyriaSYRAsia
IndiaINDAsiaTajikistanTJKAsia
IndonesiaIDNAsiaTFYR MacedoniaMKDEurope
IranIRNAsiaThailandTHAAsia
IraqIRQAsiaTurkeyTURAsia
IsraelISRAsiaTurkmenistanTKMAsia
JordanJORAsiaUAEAREAsia
KazakhstanKAZAsiaUkraineUKREurope
KuwaitKWTAsiaUzbekistanUZBAsia
KyrgyzstanKGZAsiaViet NamVNMAsia
LatviaLVAEuropeYemenYEMAsia
LebanonLBNAsia

References

  1. Sasse, T.; Rutter, J.; Norris, E.; Shepheard, M. Net Zero: How Government Can Meet Its Climate Change Target; Institute for Government: London, UK, 2020. [Google Scholar]
  2. Zhang, C.; Fu, J.; Pu, Z. A study of the petroleum trade network of countries along “The Belt and Road Initiative”. J. Clean. Prod. 2019, 222, 593–605. [Google Scholar] [CrossRef]
  3. Zhao, Y.; Liu, X.; Wang, S.; Ge, Y. Energy relations between China and the countries along the Belt and Road: An analysis of the distribution of energy resources and interdependence relationships. Renew. Sustain. Energy Rev. 2019, 107, 133–144. [Google Scholar] [CrossRef]
  4. Bompard, E.; Corgnati, S.; Grosso, D.; Huang, T.; Mietti, G.; Profumo, F. Multidimensional assessment of the energy sustainability and carbon pricing impacts along the Belt and Road Initiative. Renew. Sustain. Energy Rev. 2022, 154, 111741. [Google Scholar] [CrossRef]
  5. Cheshmehzangi, A.; Xie, L.; Tan-Mullins, M. Pioneering a Green Belt and Road Initiative (BRI) alignment between China and other members: Mapping BRI’s sustainability plan. Blue-Green Syst. 2021, 3, 49–61. [Google Scholar] [CrossRef]
  6. Kan, S.; Chen, B.; Wu, X.; Chen, Z.; Chen, G. Natural gas overview for world economy: From primary supply to final demand via global supply chains. Energy Policy 2019, 124, 215–225. [Google Scholar] [CrossRef]
  7. BP Statistical Review of World Energy. 2020. Available online: https://www.bp.com/en/global/corporate/energy-economics/statistical-review-of-world-energy/natural-gas.html (accessed on 1 October 2021).
  8. Acquaye, A.; Feng, K.; Oppon, E.; Salhi, S.; Ibn-Mohammed, T.; Genovese, A.; Hubacek, K. Measuring the environmental sustainability performance of global supply chains: A multi-regional input-output analysis for carbon, sulphur oxide and water footprints. J. Environ. Manag. 2017, 187, 571–585. [Google Scholar] [CrossRef] [PubMed]
  9. Yuan, R.; Rodrigues, J.F.; Behrens, P. Impact of non-fossil electricity on the carbon emissions embodied in China’s exports. J. Clean. Prod. 2018, 192, 582–596. [Google Scholar] [CrossRef]
  10. Li, Z.; Pan, L.; Fu, F.; Liu, P.; Ma, L.; Amorelli, A. China’s regional disparities in energy consumption: An input–output analysis. Energy 2014, 78, 426–438. [Google Scholar] [CrossRef]
  11. Ewing, B.R.; Hawkins, T.R.; Wiedmann, T.O.; Galli, A.; Ercin, A.E.; Weinzettel, J.; Steen-Olsen, K. Integrating ecological and water footprint accounting in a multi-regional input–output framework. Ecol. Indic. 2012, 23, 1–8. [Google Scholar] [CrossRef] [Green Version]
  12. Chen, W.; Wu, S.; Lei, Y.; Li, S. Interprovincial transfer of embodied energy between the Jing-Jin-Ji area and other provinces in China: A quantification using interprovincial input-output model. Sci. Total Environ. 2017, 584, 990–1003. [Google Scholar] [CrossRef] [PubMed]
  13. White, D.J.; Feng, K.; Sun, L.; Hubacek, K. A hydro-economic MRIO analysis of the Haihe River Basin’s water footprint and water stress. Ecol. Model. 2015, 318, 157–167. [Google Scholar] [CrossRef]
  14. Yang, H.; Pfister, S.; Bhaduri, A. Accounting for a scarce resource: Virtual water and water footprint in the global water system. Curr. Opin. Environ. Sustain. 2013, 5, 599–606. [Google Scholar] [CrossRef]
  15. Hoekstra, A.Y. Water scarcity challenges to business. Nat. Clim. Chang. 2014, 4, 318–320. [Google Scholar] [CrossRef]
  16. Rushforth, R.R.; Ruddell, B.L. The vulnerability and resilience of a city’s water footprint: The case of Flagstaff, Arizona, USA. Water Resour. Res. 2016, 52, 2698–2714. [Google Scholar] [CrossRef] [Green Version]
  17. Qu, S.; Liang, S.; Konar, M.; Zhu, Z.; Chiu, A.S.; Jia, X.; Xu, M. Virtual water scarcity risk to the global trade system. Environ. Sci. Technol. 2018, 52, 673–683. [Google Scholar] [CrossRef] [PubMed]
  18. Zhao, H.; Qu, S.; Guo, S.; Zhao, H.; Liang, S.; Xu, M. Virtual water scarcity risk to global trade under climate change. J. Clean. Prod. 2019, 230, 1013–1026. [Google Scholar] [CrossRef]
  19. Zhao, H.; Qu, S.; Liu, Y.; Guo, S.; Zhao, H.; Chiu, A.C.; Liang, S.; Zou, J.P.; Xu, M. Virtual water scarcity risk in China. Resour. Conserv. Recycl. 2020, 160, 104886. [Google Scholar] [CrossRef]
  20. Zhang, X.; Zhao, T.; Wang, J.; Wei, Y. The embodied CO2 transfer across sectors of cities in Jing-Jin-Ji region: Combining multi-regional input–output analysis with complex network analysis. Environ. Sci. Pollut. Res. 2021, 28, 44249–44263. [Google Scholar] [CrossRef] [PubMed]
  21. Wang, Y.; Lei, Y.; Fan, F.; Li, L.; Liu, L.; Wang, H. Inter-provincial sectoral embodied CO2 net-transfer analysis in China based on hypothetical extraction method and complex network analysis. Sci. Total. Environ. 2021, 786, 147211. [Google Scholar] [CrossRef] [PubMed]
  22. Dong, G.; Fan, J.; Shekhtman, L.M.; Shai, S.; Du, R.; Tian, L.; Chen, X.; Stanley, H.E.; Havlin, S. Resilience of networks with community structure behaves as if under an external field. Proc. Natl. Acad. Sci. USA 2018, 115, 6911–6915. [Google Scholar] [CrossRef] [PubMed] [Green Version]
  23. Liu, Y.; Sanhedrai, H.; Dong, G.; Shekhtman, L.M.; Wang, F.; Buldyrev, S.V.; Havlin, S. Efficient network immunization under limited knowledge. Natl. Sci. Rev. 2021, 8, nwaa229. [Google Scholar] [CrossRef] [PubMed]
  24. Dong, G.; Wang, F.; Shekhtman, L.M.; Danziger, M.M.; Fan, J.; Du, R.; Liu, J.; Tian, L.; Stanley, H.E.; Havlin, S. Optimal resilience of modular interacting networks. Proc. Natl. Acad. Sci. USA 2021, 118, e1922831118. [Google Scholar] [CrossRef] [PubMed]
  25. Zareie, A.; Sheikhahmadi, A. A hierarchical approach for influential node ranking in complex social networks. Expert Syst. Appl. 2018, 93, 200–211. [Google Scholar] [CrossRef]
  26. Raducha, T.; Gubiec, T. Coevolving complex networks in the model of social interactions. Phys. A Stat. Mech. Its Appl. 2017, 471, 427–435. [Google Scholar] [CrossRef] [Green Version]
  27. Du, R.; Dong, G.; Tian, L.; Wang, Y.; Zhao, L.; Zhang, X.; Vilela, A.L.; Stanley, H.E. Identifying the peak point of systemic risk in international crude oil importing trade. Energy 2019, 176, 281–291. [Google Scholar] [CrossRef]
  28. Du, R.; Wang, Y.; Dong, G.; Tian, L.; Liu, Y.; Wang, M.; Fang, G. A complex network perspective on interrelations and evolution features of international oil trade, 2002–2013. Appl. Energy 2017, 196, 142–151. [Google Scholar] [CrossRef]
  29. Jiang, M.; An, H.; Gao, X.; Liu, S.; Xi, X. Factors driving global carbon emissions: A complex network perspective. Resour. Conserv. Recycl. 2019, 146, 431–440. [Google Scholar] [CrossRef]
  30. Fan, J.; Meng, J.; Ashkenazy, Y.; Havlin, S.; Schellnhuber, H.J. Network analysis reveals strongly localized impacts of El Niño. Proc. Natl. Acad. Sci. USA 2017, 114, 7543–7548. [Google Scholar] [CrossRef] [PubMed] [Green Version]
  31. Shanmukhappa, T.; Ho, I.W.H.; Tse, C.K. Spatial analysis of bus transport networks using network theory. Phys. A Stat. Mech. Its Appl. 2018, 502, 295–314. [Google Scholar] [CrossRef]
  32. Duan, C.; Chen, B. Energy–water nexus of international energy trade of China. Appl. Energy 2017, 194, 725–734. [Google Scholar] [CrossRef]
  33. Sun, X.; An, H.; Gao, X.; Jia, X.; Liu, X. Indirect energy flow between industrial sectors in China: A complex network approach. Energy 2016, 94, 195–205. [Google Scholar] [CrossRef]
  34. Liang, X.; Yang, X.; Yan, F.; Li, Z. Exploring global embodied metal flows in international trade based combination of multi-regional input-output analysis and complex network analysis. Resour. Policy 2020, 67, 101661. [Google Scholar] [CrossRef]
  35. Wang, X.; Yao, M.; Li, J.; Ge, J.; Wei, W.; Wu, B.; Zhang, M. Global embodied rare earths flows and the outflow paths of China’s embodied rare earths: Combining multi-regional input-output analysis with the complex network approach. J. Clean. Prod. 2019, 216, 435–445. [Google Scholar] [CrossRef]
  36. Deng, G.; Lu, F.; Wu, L.; Xu, C. Social network analysis of virtual water trade among major countries in the world. Sci. Total Environ. 2021, 753, 142043. [Google Scholar] [CrossRef] [PubMed]
  37. Liu, Y.; Chen, B. Water-energy scarcity nexus risk in the national trade system based on multiregional input-output and network environ analyses. Appl. Energy 2020, 268, 114974. [Google Scholar] [CrossRef]
  38. Zhang, W.; Fan, X.; Liu, Y.; Wang, S.; Chen, B. Spillover risk analysis of virtual water trade based on multi-regional input-output model-A case study. J. Environ. Manag. 2020, 275, 111242. [Google Scholar] [CrossRef] [PubMed]
  39. Manresa, A.; Sancho, F. A follow-up note on the plausibility of the Leontief and Ghosh closed models. Econ. Syst. Res. 2020, 32, 166–172. [Google Scholar] [CrossRef]
  40. Tulu, M.M.; Hou, R.; Younas, T. Identifying influential nodes based on community structure to speed up the dissemination of information in complex network. IEEE Access 2018, 6, 7390–7401. [Google Scholar] [CrossRef]
  41. Song, S.; Chen, X.; Zhang, G. Structure of small world innovation network and learning performance. Math. Probl. Eng. 2014, 2014, 860216. [Google Scholar] [CrossRef]
  42. Buldú, J.M.; Busquets, J.; Martínez, J.H.; Herrera-Diestra, J.L.; Echegoyen, I.; Galeano, J.; Luque, J. Using network science to analyse football passing networks: Dynamics, space, time, and the multilayer nature of the game. Front. Psychol. 2018, 9, 1900. [Google Scholar] [CrossRef] [Green Version]
  43. Jiang, M.; Gao, X.; Guan, Q.; Hao, X.; An, F. The structural roles of sectors and their contributions to global carbon emissions: A complex network perspective. J. Clean. Prod. 2019, 208, 426–435. [Google Scholar] [CrossRef]
  44. Pastor-Satorras, R.; Castellano, C. Eigenvector localization in real networks and its implications for epidemic spreading. J. Stat. Phys. 2018, 173, 1110–1123. [Google Scholar] [CrossRef] [Green Version]
  45. Clemente, G.P.; Grassi, R. Directed clustering in weighted networks: A new perspective. Chaos Solitons Fractals 2018, 107, 26–38. [Google Scholar] [CrossRef] [Green Version]
  46. Lyu, D.; Wang, B.; Zhang, W. Large-Scale Complex Network Community Detection Combined with Local Search and Genetic Algorithm. Appl. Sci. 2020, 10, 3126. [Google Scholar] [CrossRef]
  47. Lenzen, M.; Kanemoto, K.; Moran, D.; Geschke, A. Mapping the structure of the world economy. Environ. Sci. Technol. 2012, 46, 8374–8381. [Google Scholar] [CrossRef] [PubMed]
  48. Lenzen, M.; Moran, D.; Kanemoto, K.; Geschke, A. Building Eora: A global multi-region input–output database at high country and sector resolution. Econ. Syst. Res. 2013, 25, 20–49. [Google Scholar] [CrossRef]
  49. Central Intelligence Agency. 2020. Available online: https://www.cia.gov/the-world-factbook/ (accessed on 1 October 2021).
  50. Zhang, Q.; Zeng, Q. Analyzing the shipping network of the maritime silk road (MSR) based on a complex network. J. Coast. Res. 2019, 98, 344–349. [Google Scholar] [CrossRef]
Figure 1. Schematic diagram of the two types of triangles.
Mathematics 10 00788 g001
Figure 2. Framework of this work.
Mathematics 10 00788 g002
Figure 3. Embodied natural gas scarcity risk flows in the EGSR transmission network in 2015. (a) International flow. (b) Inter-sectoral flow.
Mathematics 10 00788 g003
Figure 4. Top 10 countries in the EGSR transmission network in terms of (a) degree and (b) strength. (Unit of strength: dollars).
Mathematics 10 00788 g004
Figure 5. Top 10 countries in the EGSR transmission network in terms of (a) closeness centrality and (b) eigenvector centrality.
Mathematics 10 00788 g005
Figure 6. Top 10 countries in the EGSR transmission network in terms of (a) out-clustering coefficient and (b) cycle-clustering coefficient.
Mathematics 10 00788 g006
Figure 7. Communities of the EGSR transmission network.
Mathematics 10 00788 g007
Table 1. Research on virtual transfers in recent years.
TopicMethodsScopeMain FocusSource
Virtual
transfers
of water/
energy/metal
MRIOGlobalAssessment and tracking of global embodied natural gas flows[6]
MRIOGlobalEcological and water footprint accounting[11]
MRIOChinaQuantitative estimation of the embodied energy transfer[12]
MRIO Complex networkGlobalCalculating the global embodied energy flows; uncovering the structure of embodied energy flow network[33]
MRIO Complex networkGlobalCalculating the embodied metal flows; structural characteristics analysis of the global embodied metal flow network[34]
Resource
scarcity risk
transmission
MRIOGlobalMeasuring the local water scarcity risk and international virtual water scarcity risk in the global trade system[17]
MRIOChinaQuantifying the local water scarcity risk and international virtual water scarcity risk in China[19]
MRIO Network environs analysisGlobalAssessment and tracking the transmission of water-energy scarcity risk[37]
MRIO Complex networkB&R economiesQuantifying the natural gas scarcity risk; revealing the structural feature of the EGSR transmission networkOur work
Table 2. Fundamental structure of MRIO table.
Intermediate UseFinal UseTotal Output
Economy 1Economy n
Economy 1
Intermediate input x i j f i j x i
Economy n
Value added v i j
Total input x j
Table 3. Top 10 EGSR flow relationships at the national level.
Source Target
TurkeyTurkmenistan
TurkeyGeorgia
TurkeyAlbania
TurkeyTFYR Macedonia
BulgariaTFYR Macedonia
ChinaViet Nam
ChinaSingapore
TurkeyAzerbaijan
TurkeyIsrael
UkraineTurkmenistan
Table 4. Top 10 EGSR flow relationships at the sectoral level.
Source Target
Turkey—Petroleum, Chemical and Non-Metallic Mineral ProductsTurkmenistan—Petroleum, Chemical and Non-Metallic Mineral Products
Turkey—Petroleum, Chemical and Non-Metallic Mineral ProductsGeorgia—Petroleum, Chemical and Non-Metallic Mineral Products
Turkey—Petroleum, Chemical and Non-Metallic Mineral ProductsAlbania—Petroleum, Chemical and Non-Metallic Mineral Products
Turkey—Petroleum, Chemical and Non-Metallic Mineral ProductsTurkmenistan—Electricity, Gas and Water
Bulgaria—Petroleum, Chemical and Non-Metallic Mineral ProductsTFYR Macedonia—Re-export and Re-import
Ukraine—Metal ProductsTurkey—Other Manufacturing
Turkey—Petroleum, Chemical and Non-Metallic Mineral ProductsTurkmenistan—Fishing
Turkey—Petroleum, Chemical and Non-Metallic Mineral ProductsTajikistan—Petroleum, Chemical and Non-Metallic Mineral Products
Ukraine—Metal ProductsLithuania—Metal Products
China—Electrical and MachineryHungary—Electrical and Machinery
Publisher’s Note: MDPI stays neutral with regard to jurisdictional claims in published maps and institutional affiliations.

