1. Introduction
The rapid environmental degradation and climate change over the past several years have garnered the attention of policymakers to take suitable actions to lower the emission of harmful gases, and evade devastating consequences on human life and the ecosystem. The innovation in cleaner sources of energy is considered a revolutionary move toward decarbonization and environmental sustainability. Previous studies highlighted that massive investment is needed to convert from a high carbon economy to a low carbon economy [
1]. For instance, according to the United Nations’ Intergovernmental Panel on climate change,
$3 trillion investments are required every year until 2050 to limit the temperature increase by two centigrade [
2]. In context to the above investment concern, Baker et al., 2018, advocated that green bonds could play a prominent role in channelizing funds toward such environmentally friendly projects. Green bonds are similar to fixed income securities, but the only difference is that the proceeds of green bonds are employed to fund sustainable projects. In 2007, the first green bond was issued; in the initial years, the price of green bonds recorded a slow growth, but later on, due to the Paris Agreement and the Sustainable Development Goals, green bond prices witnessed exponential growth. It is estimated by the Climate Bonds initiative that the value of the green bond market will reach
$ I trillion by 2023 [
3].
Furthermore, since the global financial crisis in 2008, economic uncertainty prompted investors to search for alternative investments tools to diversify risk, and provide hedging facilities. Due to the above benefits globally, the green bond has also emerged as a potential risk-diversifying and hedging investment option for investors. Green bonds are becoming more popular among investors than other conventional assets, since they address the issue of financial resources and environmental sustainability [
4]. As the green bond complements government plans for environmental sustainability, they are considered a more stable investment tool. In addition, the formation of Green Bond Principles (GBP) by the International Capital Markets Association in 2014 also instilled confidence to invest in green bonds among the investors. Thus, due to the benefit of diversification, and the growing interest in environmental projects, green bonds are an ideal investment avenue among investors [
5]. Similar to green bonds, cryptocurrencies have also emerged as an alternative investment option. Cryptocurrencies are an ideal choice for risky investors, given the likelihood of high profits in a short period of time, and a shift away from conventional assets. Cryptocurrencies are binary data used for digital exchange. Since 2009, cryptocurrencies have captured a sizeable market share. According to the world bank, the market share of cryptocurrencies has reached US
$364.5 billion in 2020. Previous studies show that since the last decade, cryptocurrencies (bitcoins) have witnessed exponential growth. The value of one bitcoin has increased from
$1 in 2009 to around
$60,000 in 2021 [
6]. Despite high volatility and return, the future of cryptocurrencies is still unclear. A strand of literature described cryptocurrencies more as a speculative tool, bubble event, or a technologically driven product rather than a medium of exchange [
7,
8]. In the recent past, a vast body of literature advocated that cryptocurrencies have a spillover effect on the conventional stock market performance. A few studies reported a positive relationship between cryptocurrencies and stock market performance, whereas others concluded a negative relationship between the two variables [
9,
10]. In addition, there is another strand of literature that highlights cryptocurrencies and the stock market are unrelated [
11]. Based on these interrelation and transmission effects of investment products, the current study attempts to explore the probable relationship between cryptocurrencies, preferable bitcoins, and green bond markets. The above variables are incorporated, since they are new financial investment products that provide diversification and hedging benefits. Besides, both of them have also captured a sizable market share in a quick span of time. Past literature reveals that there are sufficient studies on the relationship between the conventional financial market and green bonds [
12,
13]. However, there are limited studies that have examined the above relationship. In addition, the studies have only explored the symmetric impact of cryptocurrencies on green bond markets [
14,
15]. The literature, on the other hand, suggests that the relationship between explanatory and outcome variables can be both symmetric and asymmetric [
16]. Thus, against this backdrop, we have explored the asymmetric impact of bitcoins on the green bond market.
In addition to the above analysis, we have also explored the impact of the U.S. economic policy uncertainty (EPU) on the green bond. EPU is an independent risk associated with the interaction of the financial system, fiscal policy, monetary policy, and other regulatory policies. Previous studies have highlighted that it is easier to diversify security-specific risk, but it is difficult to avoid systematic risk such as EPU. Global financial integration and several financial crises over the years, such as the global financial crisis and the eurozone crisis, had a transmission effect on the economic policy uncertainty. These economic disturbances have a magnified impact on the functioning of varied industries; the finance and investment industries are no exception. During the recent pandemic, we have again witnessed similar economic uncertainty. As previously stated, green bonds are considered stable investment options due to their environmental goals and government support. Therefore, it is worth investigating whether high and low EPU has a symmetric and asymmetric impact on the performance of green bonds in the U.S., or if green bonds are immune to the EPU. The clean energy index and oil prices, which are relevant to the study, are also included for empirical analysis. The clean energy index is included because the production of clean energy complements sustainable goals. Therefore, improvement in the clean energy stock can also enhance the performance of the green bond and vice versa. Furthermore, we have included oil prices in our empirical analysis to re-establish the theoretical assumption that an increase in oil prices surges the purchase of green bonds. An increase in oil prices necessitates the diversification of energy sources, especially for oil-importing economies. Likewise, a decrease in oil prices might have a decreasing influence on the issuance of green bonds, as there is less pressure to encourage renewable energy resources [
17].
The current study contributes to the extant literature in the following ways. Initially, this is the first study that explores the asymmetric long-run and short-run relationship between EPU, bitcoins, and green bonds. There are a few studies that have explored the above relationship; however, the previous studies have only explored the one side movement of time-series analysis, but the present study examines how the negative and positive shocks of explanatory variables (bitcoins and U.S. EPU) influence the outcome variables (green bonds), thus adding to the literature void. The question we try to address is whether uncertainty in the U.S. EPU helps to explain risk spillover on green bonds, and likewise, whether bitcoin volatility drives the movement of green bonds, and if the clean energy index or oil prices have any association with green bond volatility. Analyzing the empirical interrelationship between the green bond and other investment options over a different period is important for the various economic agents. From the viewpoint of investors, it is also worthwhile to know the suitability of green bonds as a hedging or diversifying instrument over other asset classes. Besides, the study also explores whether green bonds are resilient to financial market shocks and economic volatility due to their involvement in the sustainable financial system that increases the effectiveness of governments’ climate policies. Second, in the present study, we have also explored the consequences of structural breaks on the robustness of the results by employing a Brock, Dechert, and Scheinkman (BDS) test. Thus, identifying structural breaks induced by financial crisis and pandemics will also add to the methodological novelty of the study. Third, the sample country also adds to the existing literature. We have included the United States in our empirical analysis because it is one of the fastest developed economies in the world. Due to the tag of a developed country, the U.S. economy act as the growth engine of the world economy. The United States has a trading or economic tie with every country across the globe. Therefore, any disturbance in its economic policies has a transmitting effect on the world economy, which we have already witnessed during the global financial recession. Another justification for including the U.S. in our empirical analysis originates from the fact that the United States accounts for the highest value of the investment in the green bond market globally, amounting to 36.7 billion dollars. Therefore, empirically analyzing how these explanatory variables influence the U.S. green bond market will give significant policy-oriented recommendations for emerging and developing economies. In addition, due to the negative consequences of COVID-19, the US GDP shrank by 1.22 percent in the first quarter of 2020. As a corollary, examining how economic policy uncertainty in the United States affects green bond markets will considerably contribute to the existing literature on the relationship between EPU and sustainable indices. Finally, we included energy stocks, such as the clean energy index and oil prices, in our empirical analysis to assess the relationship between green bond performance, oil price volatility, and the clean energy index.
The rest of the paper proceeds as follows.
Section 2 discusses the previous literature,
Section 3 highlights the data and methodology,
Section 4 reports empirical findings, and the last section focus on the concluding remarks.
2. Literature Review
Over the years, the environmental crisis, and the need for generating investment for sustainable development, have attracted the interest of investors toward green bonds. Since the world bank issue in 2008, the green bond market has grown significantly, from
$11 billion in 2013 to
$167 billion in 2018 [
18]. Regardless of the rapid growth in the green bond market, only a few studies have estimated the transmission effect of other modern financial assets on green bonds [
19]. A few recent studies projected that the interdependency between green bonds and other financial and energy stocks might vary due to the heterogeneity of the magnitude of investors who interact in these indices [
1]. Investors deal in different time frames, ranging from a day to several years, because of their varied needs, risk appetite, preferences, information asymmetry, and monetary constraints. Such diverse alternatives and information asymmetry lead to abrupt responses to the market news, and economic uncertainty. In this reference, Berger and Czudaj [
20] advocated that negative news and economic environments compel short-term investors to sell, and creates an opportunity to buy for long-term investors. Likewise, Park et al. [
21], while exploring green bonds’ asymmetric volatility, revealed that green bonds have a unique character whose volatility is sensitive to positive shocks, unlike other financial assets. Importantly, they also affirmed that the green bond and financial markets have several spillover effects, and neither of them responds remarkably to markets’ negative shock. Drawing inferences from these conceptual arguments, we can predict that economic and financial shocks can be transmitted asymmetrically across financial markets; the green bond market is not an exception. Thus, studying the short-run and long-run asymmetric connectedness between green bonds, cryptocurrencies (bitcoin), and economic policy uncertainty will assist in answering the unanswered questions, and contribute to the existing literature void. The subsequent section delves into the specifics of the existing literature on the above interrelationship between green bonds and other economic and financial agents.
Chiappini et al. [
22] conducted one of the recent studies on the interaction of sustainable indexes with COVID-19 lockdown. The study intends to examine how the sustainable indexes react to market distress. They conclude that sustainable indexes in the US and Europe are susceptible to COVID-19-induced lockdown and uncertainty. However, the sustainable indexes are less volatile compared to the other traditional assets. Likewise, Huynh et al. [
4] examined the role of artificial intelligence, green bonds, bitcoins, and robotics stocks on portfolio diversification during policy uncertainty. The authors report that the probability of joint losses is high during high economic uncertainty. In addition, the author also reveals that although the above classes of the asset are a good source of return, these assets are shock senders, and fluctuation and volatility are remarkably high in these assets. Considering the relationship between traditional assets and green bonds, Hung [
19] empirically investigates the influence of commodity and energy indexes on the green bond market performance. Using the Quantile and Quantile method, the author reveals a positive interaction between the performance of the explanatory and the outcome variables. Likewise, Park et al. [
21] explored the volatility dynamics and spillovers between green bonds and equity markets. The author advocated that similar to conventional assets, the green bond also shows asymmetric responses. The volatility of green bonds is more sensitive toward positive market shocks than negative market shocks.
Nguyen et al. [
23] added to the existing literature by exploring the relationship between green bonds and other asset classes, such as stock, commodities, and conventional bonds. The authors concluded a strong correlation between the asset classes, which peaked during the global financial recession. The authors also highlighted the diversification properties of green bonds, due to their low correlation with conventional stock markets. Pham and Nguyen [
24] also strengthen the above findings by highlighting the hedging properties of green bonds. They investigated the influence of oil volatility, EPU, and stock returns on green bonds, and concluded that the impact of policy uncertainty on the green bond is time-varying and state-dependent. Furthermore, the author also suggested that as EPU and green bonds are weakly related, green bonds can be used as a perfect hedging tool during such uncertainty. In another study on the interaction between green bonds and stock markets, Baulkaran [
25] concluded that the issue of green bonds at a higher coupon rate exerts a negative response on the conventional stock market performances. In context to the influence of traditional and fixed-income markets on green bonds, Reboredo [
13] advocated that the transmission influence of the fixed-income market is high on green bonds, and green bonds are less sensitive to energy and stock market fundamentals. Contrary to the above findings, Liu et al. [
26], while examining the spillover relationship between green bonds and clean energy stock, commented that there is a positive tail dependence between clean energy stocks and green bonds. Hammoudeh et al. [
27] and Jin et al. [
28] also strengthen the above findings, and conclude a direct and significant association between carbon emission stocks and green bonds. Further, they also added that green bonds are the perfect substitute for carbon futures, and they perform well even during crisis periods. Other studies which reported similar findings are Zerbib [
29] and Nguyen et al. [
23].
We can infer that, considering the importance of green bonds, there are still limited studies conducted on this topic. Few empirical studies have examined the relationship of green bonds with conventional stocks markets (for example, Pham et al. [
30], Broadstock et al. [
31], Reboredo et al. [
32]). Another strand of literature has examined the interaction of green bonds with commodities, cryptocurrencies, and the traditional bond market (for example, Naeem et al. [
33], Bouri et al. [
34]). In addition, a more recent strand of literature has also highlighted the hedging and diversification properties of green bonds over other conventional assets (for instance, Guo and Zhau [
35], Arif et al. [
36]). In the previous literature, although the behavior of green bonds relative to other financial assets has been analyzed from multiple angles, there is a literature void in context to the asymmetric relationship between the green bond market, economic policy uncertainty, and other innovative financial assets such as bitcoins. Against this backdrop, the current study examines the asymmetric influence of the U.S. EPU, and bitcoins, in addition to measuring the impact of the clean energy index and oil prices on the Standard and Poor (S&P) green bonds.
3. Data Description and Empirical Model
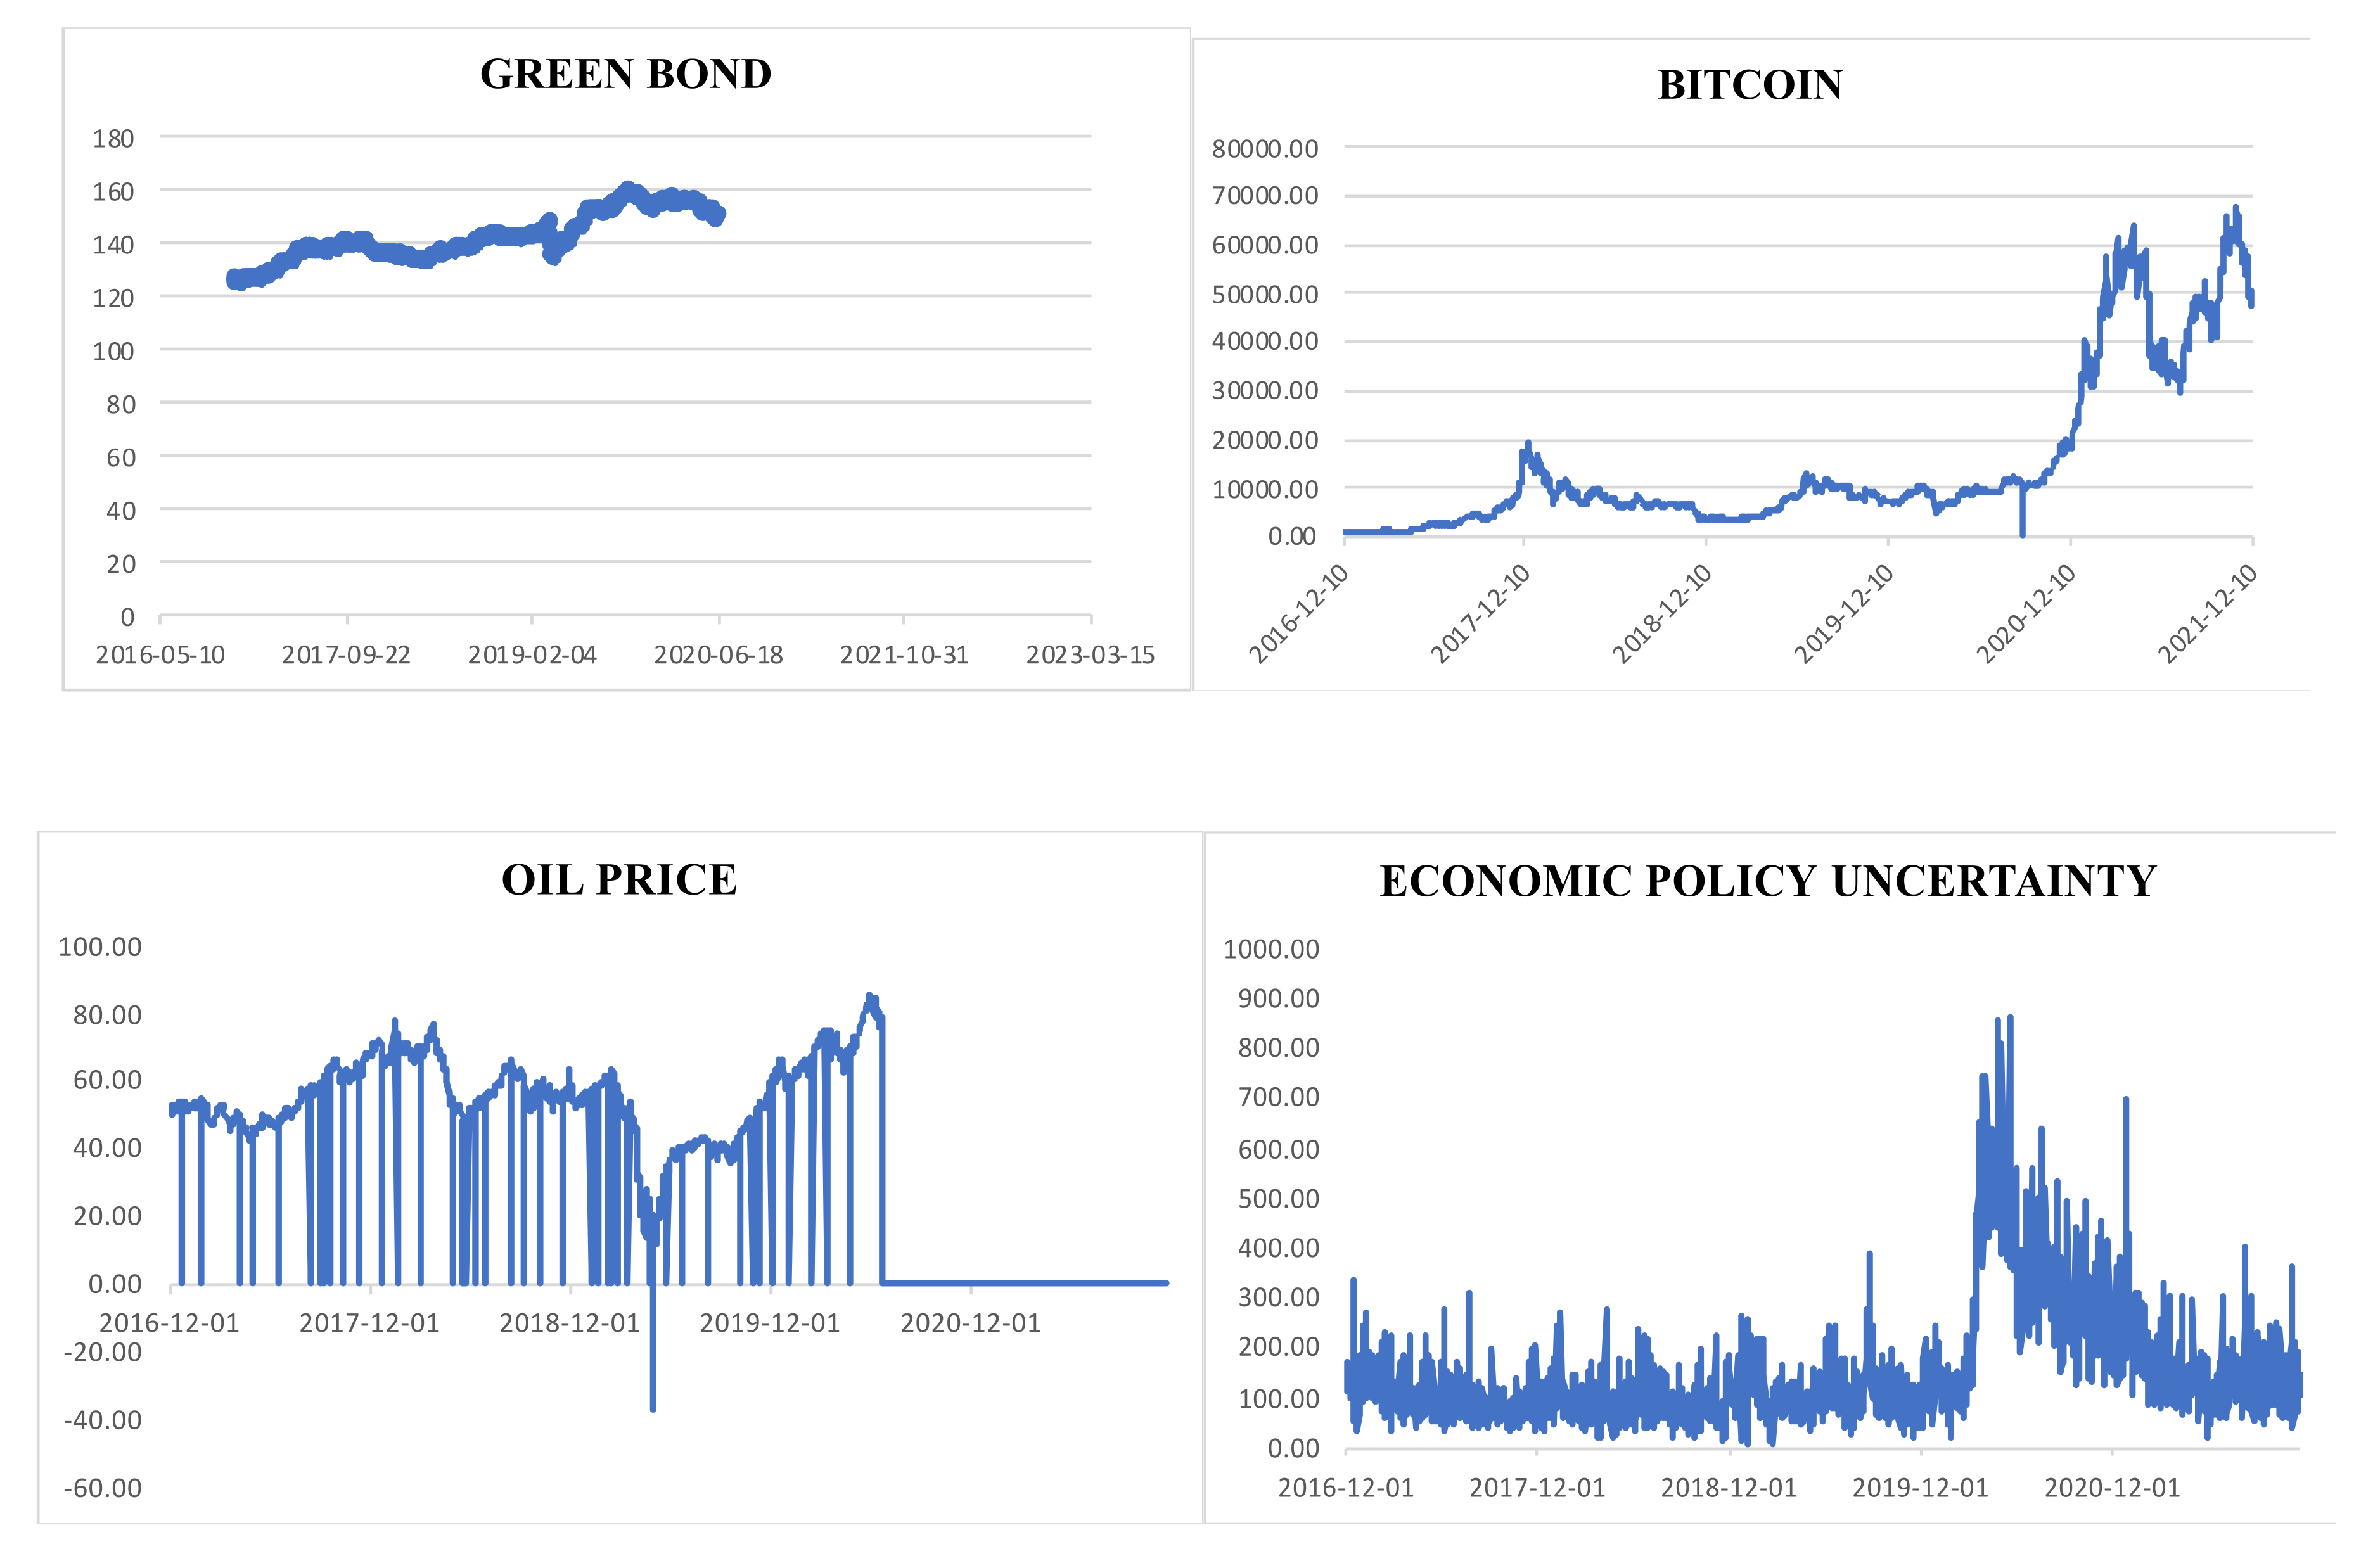
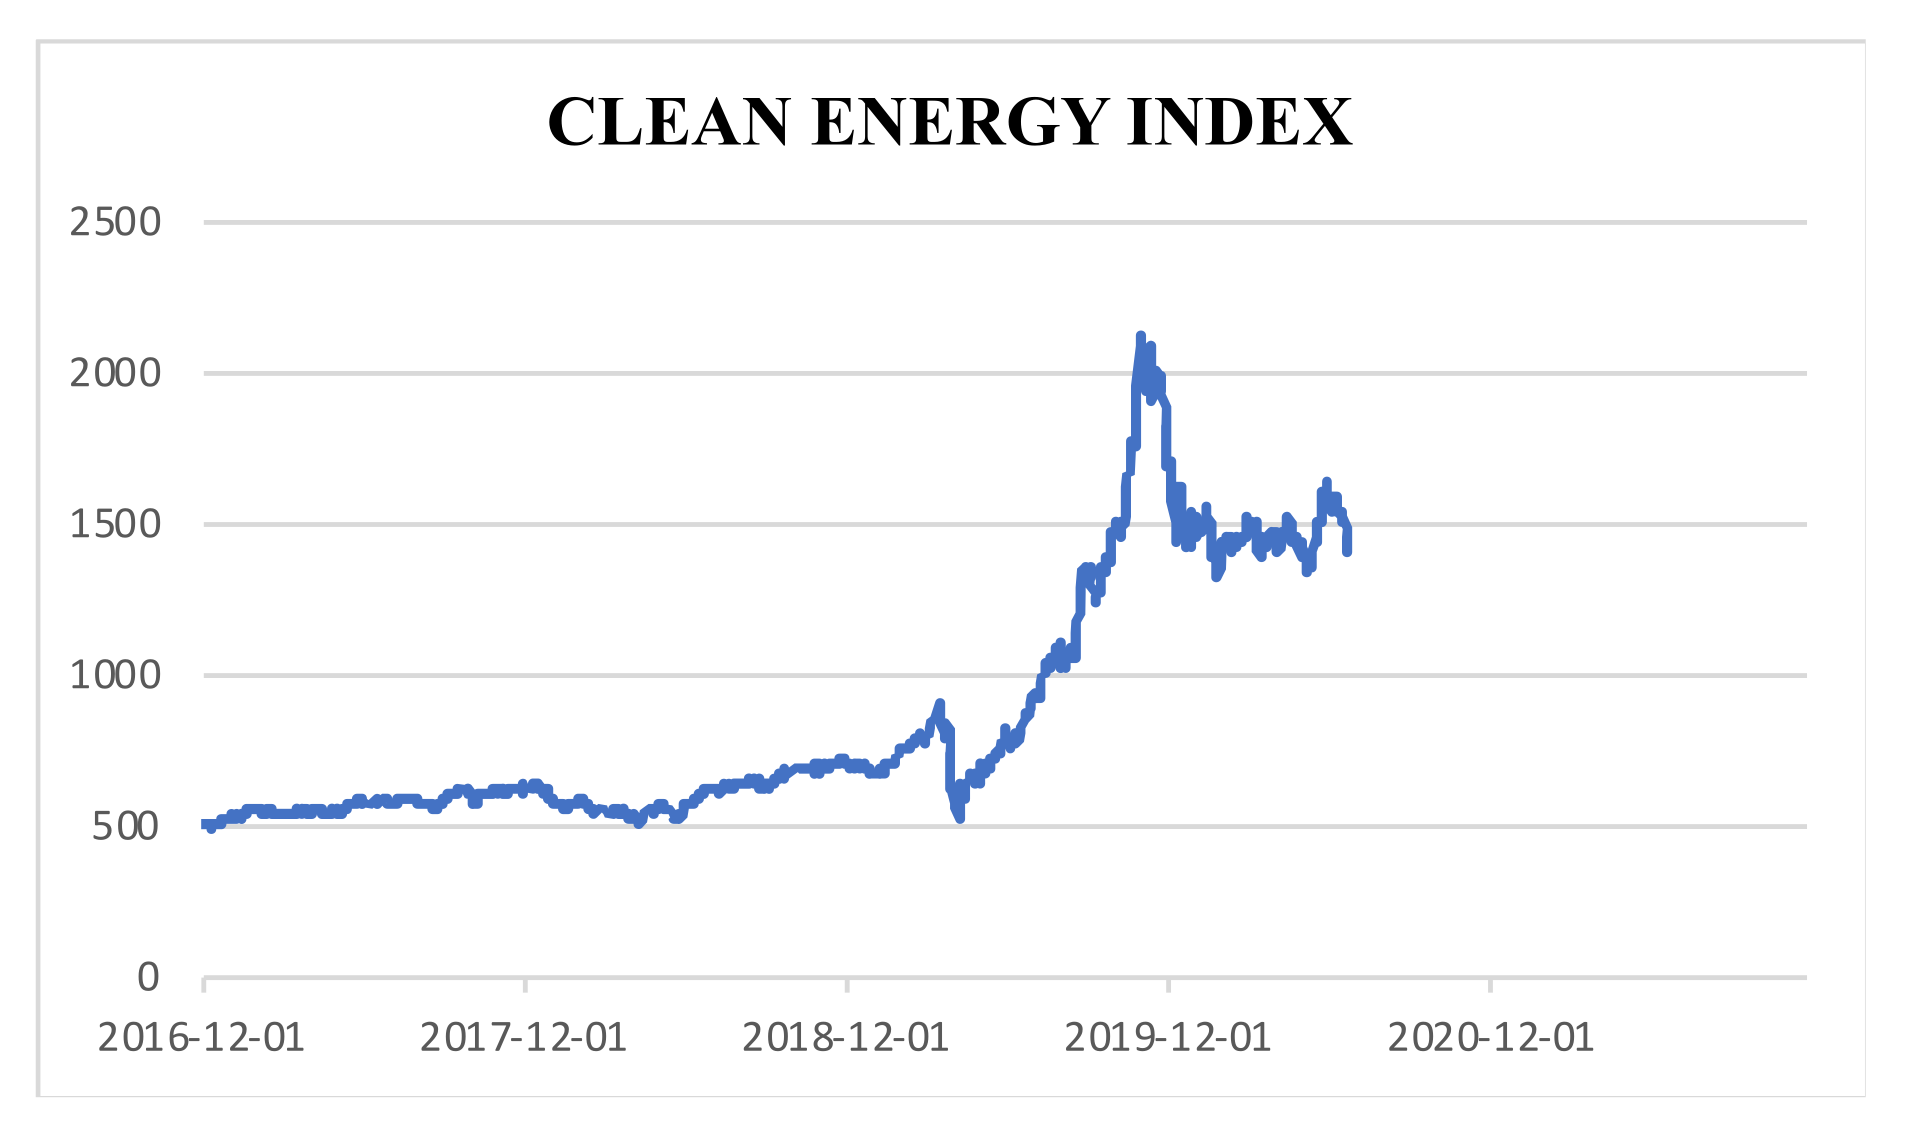
We have included the following proxies to empirically investigate the influence of economic policy uncertainty, cryptocurrencies, clean energy, and oil prices on green bonds. We have taken the green bond select index released by S&P to measure green bonds. It is a composite index representing the relevant green bond stocks. We have used the S&P global clean energy index for measuring clean energy. We have taken the daily oil prices to measure the influence of oil price volatilities on green bonds. In addition, to estimate the impact of cryptocurrencies on green bonds, we have used the daily prices of bitcoin. We have included only bitcoin because it represents the highest proportion of the global cryptocurrency market. Finally, to estimate the influence of policy uncertainty on the green bond market, U.S. daily economic policy uncertainty data is extracted. To understand the time-varying properties of the explanatory and outcome variables, and to consider the lack of data availability, we have included the daily time-series data from December 2016 to October 2021. Moreover, we have considered the following sources for data extraction: policyuncertainty.com, datastream.com, as well as the S&P green index website, and the S&P global clean energy index.
In the present paper, to estimate the asymmetric relationship between the explanatory and outcome variables, we have employed the recently developed Nonlinear Autoregressive Distribution Lag (NARDL) estimation technique proposed by Shin et al. [
37]. We have used the above estimation technique because this technique provides a robust estimate in the presence of nonlinearity and structural breaks. Previous studies highlight that economic and financial distress augments structural breaks in time series data. Therefore, to avoid the complexity of structural breaks, and to provide a robust estimate, the NARDL estimation technique is employed. Furthermore, we have also used the NARDL estimation technique due to the following benefits: first, this technique is suitable for small sample data. Second, it is also appropriate for the mixed level of integration. In addition, this technique also confirms cointegration and hidden asymmetries. Considering the above benefits, the ARDL symmetric takes the following form:
In Equation (1), GB represents green bonds, EPU denotes economic policy uncertainty, CII represents the clean energy index, BIT shows daily bitcoin prices, OIL denotes daily oil prices,
is the error term,
r and
s are the lead and lag order based on SIC criteria, and
is the first-order difference. Furthermore, based on Shin et al. [
37], Equation (1) is reframed after including the short and long run asymmetries:
where
and
represent the short-long-run coefficients;
,
denote positive and negative shocks in economic policy uncertainty and bitcoins, respectively. Under NARDL estimation, short-run parameters measure the response of the outcome variable to the independent variables, whereas long-run parameters quantify the speed of adjustments. The positive and negative variation in the economic policy uncertainty and bitcoins can be further derived as follows:
In addition, the long-run positive and negative coefficient of economic policy uncertainty and bitcoins are further ascertained as: = −/, = −/ and = −/, = −/ respectively. Likewise, the short-run positive and negative shocks are estimated as follows: , and , .
Previous studies highlight that it is mandatory to confirm the presence of unit root before applying the linear or nonlinear ARDL model. Furthermore, the linear and nonlinear model also mandate that none of the variables be of the second order of integration. Therefore, to confirm the presence of unit root, we have employed the Augmented Dicky–Fuller (ADF) unit root test. Most of the earlier studies suggest that a conventional unit root test does not provide robust estimates in the presence of structural breaks [
38]. To provide an unbiased estimate in the presence of structural breaks, we have used the Zivot and Andrews unit root test. The presence of a structural break in the data also entails the use of a structural break test, and, therefore, we have also included the BDS (Broock, Scheinkman, Dechert, and LeBaron [
39]) structural break test in our empirical analysis. The BDS test permits us to confirm the presence of nonlinearity in the series. After implementing all of the above tests, we proceed with the NARDL estimation. We have used the bound test approach to figure out the asymmetric cointegration among the variables, and for optimum lag selection, we have used SIC criteria. We have referred to the F-statistic, and compared its lower and upper bound values to estimate the presence of cointegration. If the F-statistic value is more than the upper and lower bound value, we can infer an asymmetric cointegration among the variables. Finally, the Wald test is employed to confirm the asymmetric relationship between EPU, bitcoin, and green bonds.
4. Result and Discussion
Table 1 exhibits the stochastic properties of all of the explanatory and outcome variables. The descriptive statistic shows that most of the variables are negatively skewed. We can observe that the standard deviation of the green bond (0.06%) is less than the standard deviation of the rest of the variables, for instance, bitcoin (1.85%). Thus, we can infer that green bonds are less risky compared to other variables. In addition, based on the probability value of the Jarque–Bera test, we can reject the claim of normality, and conclude that the data are not normal. The claim of non-normality further encourages to proceed with the asymmetric estimation [
40].
After discussing the stochastic properties of the variables, we proceed with the unit root estimation. Confirming the level of integration is a pre-condition for the NARDL analysis, and hence, we have used the Augmented Dicky–Fuller (ADF) unit root test. The resulting outcome attached in
Table 2 reveals that green bond and clean energy are stationary at a level, whereas economic policy uncertainty, oil prices, and bitcoins are first-difference stationary at a 5 percent significance level. The result also indicates that none of the variables are of the second order of integrations. The outcome of mix integration further permits us to proceed with the asymmetric investigation.
Previous studies confront that conventional unit root tests are not equipped to handle the issue of time break, which may result in biased estimates [
41]. In the presence of structural breaks, the Zivot and Andrews (ZA) test is an appropriate choice among the researchers. Therefore, as financial data are more susceptible to structural breaks, we have included the ZA test in our empirical analysis. In addition, the above test also reconfirms the order of integration in our sample series. The outcome of the ZA test attached in
Table 3 depicts the presence of a structural break in our sample, and also reinstates that the variable is integrated at I(0) and I(1), and that none of the variables are of the I(2) order of integration. The structural break in the explanatory and outcome variable is experienced during 2020–2021. We can relate the probable reason for the structural break in the data series to the COVID-19 outbreak. The study conducted by Taghizadeh-Hesary et al. [
42] also strengthens the above justification for the structural break in the data series. They reiterated that COVID-19-induced recession reduced the investments in green bonds globally, and thus, the exorbitant growth in green bond markets recorded a sudden fall.
The presence of time breaks in the data series further entails the usage of the BDS test, which examines the nonlinear dependence. The result of the Broock et al., 1996 test attached in
Table 4 confirms the presence of non-linearity among the various dimensions of the variables, by rejecting the null hypothesis of identical distribution. The confirmation of non-linearity re-affirms the reason for employing the NARDL approach.
Previous studies depict that it is mandatory to choose the optimal lag length before estimating cointegration between the variables. Following the Schwarz and Akaike information criteria, we have taken lag 2 in our empirical model. Furthermore, earlier studies advocate that we need to run the various diagnostic tests before estimating NARDL cointegration. Therefore, we have included the following diagnostic test, which is similar to the Ramsey RESET test to confirm misspecification, the Lagrange multiplier, and the Brush Pagan test to ascertain serial correlation and heteroskedasticity. The resulting outcome of all the diagnostic tests validates the stability and specification of the model. The result further confirms no heteroskedasticity and serial correlation in the data. After validating the diagnostic test, we proceed with the NARDL cointegration. The result showcased in
Table 5 highlights that the F-statistic value is greater than the critical value in all three cases. This suggests that on the basis of the F-value, we can reject the null hypothesis of no-cointegration among the variables, and conclude the existence of long-run cointegration among the variables.
The long-run cointegration relationship between the variables encourages us to proceed with the estimation of the asymmetric relationship between EPU, bitcoin, and green bonds.
Table 6 and
Table 7 present the proceedings of the short-run and long-run NARDL approaches. The short-run result exhibits a short-run asymmetric relationship between U.S. economic policy uncertainty, bitcoins, and green bonds. The result unveils that an increase in policy uncertainty reduces the performance of green bonds, whereas a decrease in policy uncertainty enhances the performance of green bonds. A 1 percent increase (decrease) in EPU decreases (increases) green bond performances by 0.07 and 0.15 percent. The short-run NARDL result further reveals that positive shocks in bitcoin performances create a positive impact on green bonds and vice versa. The coefficient value reveals that the impact of bitcoins on green bonds is minimal (0.0092, 0.0103). In addition, in context to control variables, the short-run outcome suggests that fluctuation in oil prices are insignificant in determining the performances of green bonds, whereas in the short-run, clean energy has a positive impact on the performance of green bonds. This indicates that with the increase in the performance of clean energy, the performance of green bonds also increases. The coefficient value shows that the performance of green bonds increases by 0.10 percent with a 1 percent increase in the clean energy index. The difference in the magnitude and the outcome of the Wald test also confirms the asymmetric relationship between bitcoins, EPU, and green bonds in the short run.
After confirming the short-run NARDL estimates, we proceed with the long-run NARDL estimation. The resulting outcome of the long-run NARDL estimates presented in
Table 7 confirms an asymmetric relationship between economic policy uncertainty and green bonds. The coefficient value reveals that positive shocks in EPU reduce the performance of green bonds, whereas negative shocks increase the performance of green bonds. In addition, the outcome also depicts that the long-run coefficient is much more powerful than the short-run estimates. The economic policy uncertainty long-run estimate shows that a 1 percent increase in EPU reduces the performance of green bonds by 0.22 percent. The probable reason for such an outcome is because higher uncertainty curtails the free flow of investments required for sustainable projects, which eventually hampers the market potential of industries associated with green products; hence, the performance of green bonds falls. Based on the findings, we can also infer that green bonds are not an appropriate hedging tool in the case of U.S. EPU. The empirical outcome is in line with the study performed by Pham et al. [
24], and contradicts the findings of Haq et al. [
43]. The work performed by Pham et al. [
24] advocates that green bonds are severely affected by high economic uncertainty. During high economic uncertainty, green bonds cannot be used as a risk-hedging instrument; however, during a period of low economic uncertainty, they can be considered as a risk-hedging option.
In context to the long-term asymmetric relation between green bonds and bitcoins, the study highlights a bi-directional asymmetric relationship. It implies that positive shocks in bitcoins increase the performance of green bonds and vice versa. A 1 percent increase in bitcoins increases the performance of green bonds by 0.02 percent, and a 1 percent decrease in bitcoins prices decreases green bonds by 0.01 percent. The coefficient value reveals the minimum transmission effect between green bonds and bitcoins. The resulting outcome reiterates the connectedness between modern financial investment instruments and sustainable financial products. A reasonable justification for such a relationship exists because both asset classes are the latest innovations in financial markets. Investors prefer these investments options over conventional assets due to the higher returns and future prospects. Therefore, based on such optimistic attitudes of investors, these instruments refer to similar co-movements. We can also infer that in the case of bitcoins, the green bond is not an appropriate hedging instrument. Besides, we can consider green bonds as a risk-diversifying instrument. The resulting outcome is consistent with the study carried out by Le et al. [
15]. Our empirical findings also collaborate with the previous studies that project a medium-risk transmission between innovative financial assets, and recommend careful investment strategies for risk diversification and hedging [
3].
The changes in the magnitudes and the probability values of the Wald test further substantiate the long-run asymmetric relationship between EPU, bitcoins, and green bonds.
In addition, in reference to the energy-related variables, we can conclude that oil prices and the clean energy index have a positive influence on green bond performance. The result shows that a 1 percent increase (decrease) in oil prices increases (decreases) the performance of green bonds by 0.05 percent. Likewise, a 1 percent increase (decrease) in the clean energy index increases (decreases) green bond performance by 0.13 percent. In addition, the coefficient value indicates that the influence of the clean energy index is more on green bonds as compared to the oil prices in the long run. The time series plot of green bonds, the clean energy index, and oil prices reported in
Figure 1 also reports a similar association. One plausible reason for a similar movement between clean energy and green bonds can be attributed to the fact that both of the assets’ class belongs to the same category of investors, who are risk-averse and have a conservative profile. Thus, similar investor profiles and risk aversion play a prominent role in the strong linkage between green bonds and the clean energy index. The findings recommend that green bonds offer noteworthy diversification benefits for investors both in energy stocks and oil-related assets regardless of their investment horizon. Overall, our results suggest that although green bonds represent a different asset class, they closely replicate the performance of oil prices and clean energy stock. The empirical outcome of a positive linkage between green bonds and oil prices also strengthens the theoretical viewpoint that an increase in oil prices should increase the issuance of green bonds, as it necessitates the diversification of energy sources, especially for oil-importing economies. Likewise, a decrease in oil prices might have a decreasing influence on the issuance of green bonds, as there is less pressure to encourage renewable energy resources, and a continued reliance on the available fossil fuels. Lastly, we can infer that the study highlights a complementary relationship between green bonds, oil prices, and the clean energy index. Our result outcome is in line with the study conducted by Azhgaliyeva et al. [
44], Lee et al. [
45], and Ahmed et al. [
46] who projected that oil, the clean energy index, and green bond prices mutually affect each other in such a way that any movements in oil prices and the clean energy index will lead to changes in green bond prices and vice versa. Therefore, investors and portfolio managers should consider this causal transmission mechanism when making portfolio and hedging decisions. Furthermore, the diagnostic test also confirms the stability and reliability of the long-run NARDL model.
5. Conclusions and Policy Recommendations
The concern for environmental sustainability, and the urge to generate adequate investments to finance sustainable environment goals, have attracted the interest of investors towards green bonds. The growing investor interest in green bonds has motivated us to examine how modern financial assets, policy uncertainty, oil prices, and the clean energy index influence green bond performances. In the present study, we tried to answer whether green bonds are a hedging tool or a risk-diversifying instrument among investors. Furthermore, we also evaluated the bidirectional relationship between green bonds, U.S. economic policy uncertainty, and bitcoins from 1st December 2016 to 31st October 2021. To this end, we utilized the Baker et al. [
47] EPU index, S&P clean energy index, S&P green bond index, daily oil prices, bitcoin prices, and nonlinear autoregressive distribution lag approach recently developed by Shin et al. [
37]. Another major contribution of this research is the inclusion of structural break and nonlinearity tests to estimate the presence of nonlinearity and structural breaks in the time series. Our empirical outcome confirms an asymmetric relationship between green bonds, bitcoins, and U.S. economic policy uncertainty. According to our findings, a positive shock in the U.S. EPU creates a negative influence on green bonds. On the other side, a negative shock in the U.S. EPU helps to increase the performance of green bonds. This implies that, similar to other conventional assets, green bonds are also not immune to economic policy uncertainty. Fluctuations in monetary, fiscal, and other economic policies have a consequential impact on green bonds. Hence, during high economic policy uncertainty, green bonds cannot be considered as a hedging tool; moreover, they account as risk-diversifying instruments. In addition to the above results, the study also concludes an asymmetric relationship between bitcoins and green bonds. The positive shocks of bitcoins exert a positive influence on green bonds and vice versa. These results reiterate that green bonds are similar to other modern financial instruments, and report similar movement. Thus, investors can use them as a risk-diversifying instrument, and not as a hedging tool. In addition to the above results, our study also highlights a positive relationship between oil prices, the clean energy index, and green bonds. It implies that green bond performance increases with an increase in the clean energy index and oil prices. Our findings support the theoretical explanation that an increase in oil prices necessitates the expansion in the purchase of green bonds, as it necessitates the diversification of energy sources, especially for oil-importing economies. Thus, based on these outcomes, we can infer that we cannot consider green bonds as a different asset class, and they work more as a substitute to conventional assets. Investors must include these shares in their portfolios as risk-diversifying instruments.
Our empirical analysis offers several policy implications highlighting the diversification and hedging properties of green bonds vis-à-vis bitcoins, clean energy, and economic policy uncertainty. The asymmetric dynamic connectedness provides instructive suggestions from a portfolio diversification standpoint. Based on the empirical outcome, we can recommend that investors include green bonds in their portfolios as a risk-diversifying instrument. Aside from the environmental benefits, they offer significant diversification benefits to investors against conventional stocks, cryptocurrencies, oil, and clean energy stock in the long run. It is highlighted in the study that during high policy uncertainty, investors should be more cautious when investing in green bonds, as in the long run, the negative influence of EPU on green bonds is much more severe. Therefore, on the basis of environmental benefits, investors should not presume that green bonds are immune to economic policy uncertainty. Our study also recommends that investors looking to contribute toward sustainable development include green bonds in their portfolios, as green bonds are viable alternatives to clean energy or renewable energy stocks. In addition, based on the findings, we can recommend that, similar to bitcoins, green bonds also offer attractive returns. Green bonds are also more stable than bitcoins due to their long-term goal of sustainability. Therefore, investors looking for moderate returns and long-term growth can switch to green bonds over bitcoins. Likewise, in the short-run, investors can hedge the volatility of oil prices by investing in green bonds, as in the short-run, there is no significant linkage between oil prices and green bonds. To sum up, we can conclude that over the years, green bonds have emerged as a powerful tool to combat climate change by attracting funds required for sustainable projects. The diversification properties against conventional and innovative market instruments also make green bonds an attractive investment avenue, provided investors consider the vulnerability of green bonds to policy uncertainty.
Our study provides insights into green bonds, an innovative financial asset that not only enhances the transition to a low-carbon economy, but also generates the attention of policymakers and investors to reduce risk and innovative transmission across different markets. The diversification benefit of green bonds develops policymakers’ confidence to scale up the green bond market for environmental responsibility. Furthermore, understanding the relationship between green bonds and other asset classes is of paramount importance to global investors, especially ethical investors, since this information helps gain superior risk-adjusted returns across the allocation of conventional assets to a portfolio. Finally, the above empirical outcomes will also assist in understanding the long-run influence of explanatory variables on green bonds, especially for emerging and developing countries. Emerging countries, such as the BRICS countries, are the largest emitters of carbon emissions. Therefore, to meet their ESG goals, these countries are resorting to environmentally friendly measures; green bond financing is no exception. However, the green bond market of these countries is in a transition process (except for China), and thus, considering the immense investment and financing opportunities to meet the sustainable goal, the above outcome will assist the investor in understanding how green bonds react to financial assets and policy uncertainties. These outcomes will assist them in devising appropriate long-run investment strategies.


 ,
, 


