Article

Do Not Rug on Me: Leveraging Machine Learning Techniques for Automated Scam Detection

1
Department of Information and Communications Technology, Pompeu Fabra University, Tanger Building, 08018 Barcelona, Spain
2
Faculty of Economics and Business, Universitat de Barcelona, 08034 Barcelona, Spain
*
Author to whom correspondence should be addressed.
These authors contributed equally to this work.
Mathematics 2022, 10(6), 949; https://doi.org/10.3390/math10060949
Submission received: 4 February 2022 / Revised: 3 March 2022 / Accepted: 12 March 2022 / Published: 16 March 2022
(This article belongs to the Special Issue Mathematics, Cryptocurrencies and Blockchain Technology)

Abstract

:
Uniswap, as with other DEXs, has gained much attention this year because it is a non-custodial and publicly verifiable exchange that allows users to trade digital assets without trusted third parties. However, its simplicity and lack of regulation also make it easy to execute initial coin offering scams by listing non-valuable tokens. This method of performing scams is known as rug pull, a phenomenon that already exists in traditional finance but has become more relevant in DeFi. Various projects have contributed to detecting rug pulls in EVM compatible chains. However, the first longitudinal and academic step to detecting and characterizing scam tokens on Uniswap was made. The authors collected all the transactions related to the Uniswap V2 exchange and proposed a machine learning algorithm to label tokens as scams. However, the algorithm is only valuable for detecting scams accurately after they have been executed. This paper increases their dataset by 20K tokens and proposes a new methodology to label tokens as scams. After manually analyzing the data, we devised a theoretical classification of different malicious maneuvers in the Uniswap protocol. We propose various machine-learning-based algorithms with new, relevant features related to the token propagation and smart contract heuristics to detect potential rug pulls before they occur. In general, the models proposed achieved similar results. The best model obtained accuracy of 0.9936, recall of 0.9540, and precision of 0.9838 in distinguishing non-malicious tokens from scams prior to the malicious maneuver.
MSC:
91-08; 91G50

1. Introduction

Blockchain technology has proven to be enormously disruptive and empowering in both the public and private sectors of computing applications. Blockchains are permissionless and immutable digital ledgers that can be implemented and audited without a trusted third party or central authority. At their basic level, they enable participants to record transactions in a shared public ledger such that, under the regular operation of the blockchain network, no transaction can be changed once committed. In 2008 [1], the blockchain idea was combined with several other technologies to create Bitcoin: a peer-to-peer electronic cash system protected through cryptographic mechanisms without needing a central repository or authority. However, users and developers perceived that Bitcoin had a limited use case due to the lack of complete programmability of the Bitcoin Virtual Machine. For this reason, many developers worked on the launch of other chains such as Ethereum, a Turing-complete blockchain that has evolved to include a wide range of decentralized applications. Often, a decentralized application (DApp) will use one or more “smart contracts” deployed on top of the blockchain.
A smart contract is an executable code that runs on the blockchain to facilitate, execute, and enforce the terms of an agreement between untrusted parties. The most popular and exciting area where smart contracts have been crucial is decentralized finance (DeFi), which makes financial products available on a publicly decentralized blockchain network. DeFi could potentially offer a new pseudo-anonymous, non-custodial, and permissionless financial architecture that allows open audit [2]. However, the Turing-complete blockchain technology is not a silver bullet; the pseudo-anonymous and permissionless nature of the blockchain allows attackers, scammers, and money launderers to act with impunity. In parallel to the work carried out in [3], in this paper, we will focus on the thefts and scams in the most popular tool of DeFi, the decentralized exchanges (DEX), the DeFi version of market exchanges. The most common way in which scammers and malicious agents execute a theft is through a rug pull. A rug pull of a project is a malicious operation or set of operations in the cryptocurrency industry where the developers abandon the project and take the investors’ funds as profits. As mentioned in [3], rug pulls are a popular maneuver that usually happens in DEXs, particularly in Uniswap, where malicious agents develop an ERC-20 token (Ethereum Request for Comments 20) and list it on a DEX and pair it with a leading cryptocurrency such as USD or Ether. Once some uninformed investors swap their leading coin for the token, the developers then remove all the currencies from the liquidity pool, making the token untradable and with zero economic value. In order to make the attack more profitable, the creators usually use different marketing tools such as a fake website, telegram groups, and Discord chat rooms to cultivate confidence among potential investors.
Our contribution: In this paper, we expand the rug pull dataset of the paper [3] to 27,588 tokens. To do this, we collected all Uniswap data until 3 September 2021 by directly interacting with the Ethereum blockchain. Then, we labelled different tokens as scam, malicious, and non-malicious tokens using various relevant features of the smart contract and the liquidity pool state (see Section 3.4 and Section 6). We manually observed different ways of executing the rug pull, proposed a rug pull classification, and observed new, complex forms of performing the theft. Moreover, we have observed a further usage of the Uniswap protocol to send ETH (ETH is the native cryptocurrency of the Ethereum network) unnoticed for most common tracking protocols. Finally, as we detail in Section 7, we propose new features of tokens, liquidity pools, and the transaction graphs, and a new framework to predict the probability of a liquidity pool becoming a rug pull or a scam in the future.
In summary, in this work, we make the following contributions:
  • We provide the most extensive labelled dataset of Uniswap rug pulls to date, including the source code, the liquidity, the prices, the mint/burn, and transfer events. The dataset includes all tokens from 4 May 2020 to 3 September 2021. In total, we labelled 26,957 tokens as scams/rug pulls and 631 tokens as non-malicious.
  • We provide a theoretical classification of three different types of rug pulls, simple, sell, and trap-door rug pulls, and provide tools to identify them.
  • To the best of our knowledge, we are the first to design an accurate automated rug pull detection to predict future rug pulls and scams using relevant features of the pool’s state and the token distribution among the users. More specifically, we used the Herfindahl–Hirschman Index and clustering transaction coefficient as heuristics to measure the distribution of the token among the investors.
  • We prove that the use of lock contracts such as Unicrypt by other scam detectors [4,5] provides misleading data about the economic security of the token. More precisely, we show that 90% of tokens using locking contracts tend to become a rug pull or a malicious token eventually.
  • We define two methods that use machine learning models to discriminate between malicious and non-malicious tokens in different scenarios. In the first scenario, tokens can be evaluated at any block prior to the malicious maneuver. In the second scenario, all tokens are evaluated at a certain time after the creation of their respective pools. Specifically, we use a new machine learning algorithm based on attention mechanisms for tabular data called FT-Transformer [6]. Our best model obtains accuracy of 0.9936, recall of 0.9540, and precision of 0.9838 in distinguishing non-malicious tokens from scams in the first scenario and accuracy of 0.992, recall of 0.784, and precision of 0.869 in the second scenario.
All these results can be replicated using the code and the pipeline in [7]. To use it, we highly recommend access to a full or an archive Ethereum node.
Organization of the paper: In Section 2, we describe the state of the art of scam detection in smart-contract-based blockchains. Section 3 gives an overview of DeFi and DEXs and the main features needed for our analysis. Section 4 introduces a classification of malicious Uniswap maneuvers, emphasizing the theoretical methodology behind different rug pulls. In Section 5, we explain the methodology used to obtain all the data needed to train our models and obtain our results. In Section 6, we explain the methodology used to label the tokens listed in the Uniswap protocol as malicious and non-malicious and give an overview of the results obtained by applying this methodology. Finally, Section 7 explains the model used to detect future rug pulls in the early stages. We explain the two different methodologies used and describe the accuracy, sensitivity, and F1 score of the models used.

2. Related Work

Due to the role of smart contracts in Blockchain Technology, some studies have analyzed the security and the automatic vulnerability detection within such contracts. Some have focused on finding anomalies in the transaction graph [8,9,10,11] and clustering malicious addresses [12,13,14]. For example, paper [8] uses the transaction graph to predict relevant market price changes and [14] uses the transaction graph and fingerprints in the gas price (https://ethereum.org/en/developers/docs/gas/, accessed on 15 February 2022) in order to detect the addresses of the same user.
Other studies have focused on the vulnerabilities of smart contracts [15,16,17,18]; for example, [16] is a static analysis framework for smart contracts that detects potential vulnerabilities. In a similar direction, other research [19,20,21,22,23] examines the vulnerabilities of DeFi protocols when interacting with rational agents.
Regarding blockchain scams, many studies have investigated phishing scams [24,25,26,27], Ponzi Schemes [28,29,30], and automated scam detection [31,32,33].
More related to our work, various studies or projects [3,4,5] have addressed the detection of rug pulls or frauds working on top of DEX protocols. Two projects [4,5] use the simple heuristics of holders, liquidity, and an automatic smart contract analysis, to give a risk score of the token. Both projects share two major problems: the lack of longitudinal studies to check their results, and the failure to detect non-malicious tokens accurately. On the other hand, ref. [3] provided the only longitudinal and cross-sectional study to date. The study provides a good introduction and overview of different rug pulls, as well as a dataset of more than 10K scam tokens listed in Uniswap. However, the major flaw of the paper is that the algorithm is trained to classify tokens and detect rug pulls only after they have occurred; that is, the machine learning algorithm is trained in order to classify tokens, but is not able to detect future rug pulls.

3. Preliminaries

3.1. Ethereum and Smart Contracts

Ethereum is a blockchain with a quasi-Turing-complete programming virtual machine that compiles different programming languages such as Solidity [34]. One relevant goal of Ethereum is for any party to develop arbitrary applications and scripts that execute in blockchain through transactions, using the blockchain to synchronize their state in a manner that is fully verifiable by any system participant. These scripts are usually referred to as smart contracts. Participants and smart contracts in the Ethereum network transact with the base currency known as Ether. Ether is the coin used to transact and to pay the fees to the miners to transfer Ether or to interact with smart contracts. Accounts on the Ethereum network can be linked to programs in a virtual machine-based language called the Ethereum Virtual Machine (EVM). More specifically, smart contracts are programs that are deployed on the blockchain public ledger and are executed in transactions, which, similarly to ACID-style database transactions [19], alter the state of the ledger atomically (that is, either all the operations of the transaction are executed or all the operations are reverted). In the moment of deploying a smart contract, a byte-code is sent in a transaction to the ledger, and this contract is assigned a unique address of 42 hexadecimal characters and its code is uploaded to the ledger. Once successfully created, a smart contract consists of a contract address of 42 hexadecimal characters, a balance, a code defined in the contract creation, and a state. Different users and parties can then change the state of a specific contract by sending transactions invoking particular functions to a known contract address. If the transaction holds the constraints hard-coded in the smart contract, this transaction will trigger a set of actions established in the smart contract code as a result, such as reading and modifying the contract state, interacting and executing other contracts, or transferring Ether or tokens to other addresses. These actions can be coded to produce events, a transaction log of the relevant information produced by the actions triggered. These events are useful for developers and users to track the state of the smart contract.
The most popular and significant smart contracts of Ethereum are known as ERC-20 tokens, and emerged in 2015 as the technical standard used for all smart contracts on the Ethereum blockchain for fungible token implementations. A token is fungible if any token is exactly equal to any other token; no tokens have special rights or behavior associated with them. This makes ERC-20 tokens useful for currency exchange, voting rights, staking, and more. ERC-20 defines a common set of functions, of which only the signatures, but not the implementations, are specified. Table 1 lists the common rules of ERC-20, including the global variables and functions.
In addition to the base ERC-20 functionality, many tokens provide other functionalities [17]. For instance, it is quite common to find contracts that can freeze accounts, transfer ownership, pause contracts, or make complex interactions with other DeFi protocols. In this study, we focused on three functionalities that involve the manipulation of tokens: minting, pausable, and complex buy/sell operations in which tokens can be obtained from or exchanged to Ether. Token minting corresponds to the creation of tokens, increasing the total supply of tokens, and associating the newly minted tokens with a specific address. Token burning is the reverse operation: tokens can be erased from an account and their total supply decreases. Token sale works in terms of operations that allow an account to buy tokens using Ether, or obtain Ether by selling tokens.
In order to obtain those features, one can use compilers such as Slither [16], a static analysis framework designed to provide human-readable information and insights into smart contracts written in the Solidity programming language. Slither allows the application of commonly used program analysis techniques such as dataflow and taint tracking. Moreover, Slither detects various important features and vulnerabilities, such as minting, reentrancy vulnerability, and pausable smart contracts.

3.2. Decentralized Exchanges

Decentralized exchanges (DEXs) [2] are a category of Decentralized Finance (DeFi) protocol that allow the non-custodial exchange of digital assets. All trades are executed on-chain and are, thus, publicly verifiable. The policy that matches buyers and sellers (or traders and liquidity providers) is hard-coded in a smart contract. DEXs have different mechanisms for price discovery: order book DEXs and automated market makers (AMM). While order book exchanges have been broadly studied [35,36] and used in traditional finance (TradFi), AMMs have been proven to be more useful in blockchain environments due to their computational efficiency and simplicity [2]. In general, in an automated market maker, each asset pair comprises a distinct pool or market. Liquidity providers supply liquidity by adding both assets in proportion to the existing pool size. Traders exchange assets by adding one asset to the pool and removing the other. The ratio of the two traded assets is the average price paid, which is calculated according to a downward sloping, convex relationship called constant function (CF). The convexity implies that the AMM is liquidity-sensitive; that is, larger orders have a larger price impact. DEXs and, particularly AMM, have become very popular in DeFi for several reasons:
  • they permit easy provision of liquidity for minor assets, i.e., any assets can be listed in a DEX;
  • they allow any party to become a market maker;
  • they are censorship-resilient in highly volatile periods;
  • they can be audited by anyone.
However, these properties also have their drawbacks:
  • blockchain transactions are publicly visible in the mempool, which means that miners or users can front-run trading transactions in DEXs [21,23], consistently leading to a worse price for users;
  • every token can be listed to trade in AMM protocols, making uninformed users fall into different scams or suboptimally performing projects [3].
With an AMM, the price of an asset is determined by the state (number of reserves) and the number of assets that users are willing to trade. The most popular AMMs, such as Uniswap (https://uniswap.org/whitepaper.pdf), Sushiswap (https://sushi.com/), Curve (https://curve.fi/whitepaper), and Balancer (https://balancer.fi/whitepaper.pdf), all accessed on 15 February 2022, use different variations of the constant product formula; see Section 3.3.

3.3. Uniswap

Uniswap, the most relevant decentralized exchange, was launched in November 2018 and, to date, more than 40,000 ERC-20 tokens are locked and tradable in the Uniswap protocol, adding a total value of 7 billion USD. In this section, we will provide an overview of the Uniswap V2 protocol; for more details, see [37,38].
Providing Liquidity: Each pair pool comprises a pair of tokens. Most frequently, as we will show in Section 5, one of the currencies is wrapped Eth (Weth), the ERC-20 equivalent version of Ether. We will typically use Eth or Weth as the numéraire and will denote it by E , and we will refer to the other ERC-20 tokens as token, denoted by C . A party wishing to provide liquidity to a specific pool deposits both E and C into the pool. If the pair pool has no tokens deposited yet, the deposit ratio can be arbitrarily chosen by the liquidity provider. Otherwise, the deposit ratio of Eth to token is determined by the existing ratio in the pool, which implicitly defines the infinitesimal price of the token C with respect to Eth E . A liquidity provider who makes such a deposit receives a proportional amount of a liquidity provider token (LP-token). This third token is specific for each pool listed in Uniswap and represents the share of the liquidity provided by the agent of the total liquidity pool. As the users swap tokens in the pool, the value of the liquidity pool may rise or fall in value. Liquidity providers can redeem their liquidity tokens at any time and have their share of the liquidity pool paid out in equal value of Eth and tokens. Providing liquidity is potentially profitable because each trade incurs a transaction fee of 0.3 % , which is redeposited into the pool. However, providing liquidity also has its own risks, leading in some situations to temporary losses [39].
Price formula: The pricing protocol for tokens listed on Uniswap is given by a constant product formula [38]. Suppose that a trader wants to buy an amount of Δ y tokens, and the current reserves of the pair pool of Eth and tokens are x and y, respectively. Then, the amount Δ x of Eth that they have to deposit is the unique solution to the following equation:
( x + ( 1 f ) Δ x ) ( y Δ y ) = x y ,
where f is the fee of the protocol, currently sett to f = 0.3 % . After the trade, the reserves of the pair pool are updated in the following way: x x + Δ x , y y Δ y . Analogously, a trader may want to sell tokens for Eth. The name constant product market comes from the fact that when the fee is set to zero, any trade must change in such a way that the reserves lie in the curve x y = k for some positive real number k.
Uniswap Architecture: Uniswap V2 contracts are divided into two types of contracts, the core and the periphery. This division allows the core contracts, which hold the assets and therefore have to be secure, to be audited more easily. All the extra functionality required by traders can then be provided by periphery contracts. The most relevant periphery contract is the UniswapV2Router (https://etherscan.io/address/0x7a250d5630b4cf539739df2c5dacb4c659f2488d, accessed on 15 February 2022). This contract allows the user to easily interact with other core contracts in order to quote prices, create pair pools, swap tokens, and add/remove liquidity. Two of the most fundamental core contracts are the UniswapV2Factory (https://etherscan.io/address/0x5c69bee701ef814a2b6a3edd4b1652cb9cc5aa6f, accessed on 15 February 2022) and UniswapV2Pair (https://github.com/Uniswap/v2-core/blob/master/contracts/UniswapV2Pair.sol, accessed on 15 February 2022). The UniswapV2Factory is responsible for creating new pool pairs and recording all the pairs created. The UniswapV2Pair contract is responsible for recording the current state of the pool, i.e., the balance of Eth E (or any other token C ) and the token C , computing the price for trading and the number of tokens needed to add liquidity. Moreover, the UniswapV2Pair contract has an ERC-20 structure and records the ownership of the liquidity provided to the pool.
Uniswap Events: As we mentioned in Section 3.1, events track the state of different variables of a smart contract. The Uniswap protocol contains five important events.
  • PairCreated: It is an event in the UniswapV2 Factory contract. This event emits each time a new pair is created, and outputs the tuple (token0, token1, pair, block_creation) of a new pool created.
  • Sync: It is an event in the UniswapV2 PairPool contract. This event emits each time the reserves of the pool change. Every time the balance of the pool updates, the smart contract outputs the tuple (reserves0, reserves1), which is the reserves of the token0 and token1 after the update.
  • Mint, Burn & Transfer: These are events in the UniswapV2 PairPool contract that tracks the state of the ERC-20 LP-token.
Locking contracts: The locking contracts are protocols that run on top of the Uniswap protocol to provide a partial solution to rug pulls. These protocols are not part of the main Uniswap protocol. In general, in the first phase of developing a token or project, the liquidity provided to Uniswap is mostly added by the developers or creators of the project. It is for this reason that, initially, the distribution of the LP tokens is managed by a small number of addresses, making potential investors less confident in the project. In order to provide some trust to new investors, the developers lock the liquidity in a smart contract (Unicrypt is the most popular DEX LP lock) or burn the LP token, making it unfeasible for the developer to remove the liquidity for some time or indefinitely.

3.4. Token Propagation

We refer to token propagation as the set of metrics and tools to study the token distribution and circulation of the token during its activity period. As we mentioned previously, tokens are transferable. To send a token from an address A to an address B, the sender A can either call the function transfer of the token’s smart contract or call other smart contracts that inherit the functions approve and transferFrom . Either way, an ERC-20 token emits the event transfer that contains the tuple ( sender ,   receiver ,   amount ) . The first means of transferring tokens is usually cheaper and is used to directly transfer the tokens from one external ownable account (EOA) to another. The most common approach is to deposit or withdraw tokens from centralized exchanges. The second method tends to be used by different DeFi protocols such as DEXs, lending protocols, or voting systems to allow smart contracts to exchange tokens on behalf of an EOA address.

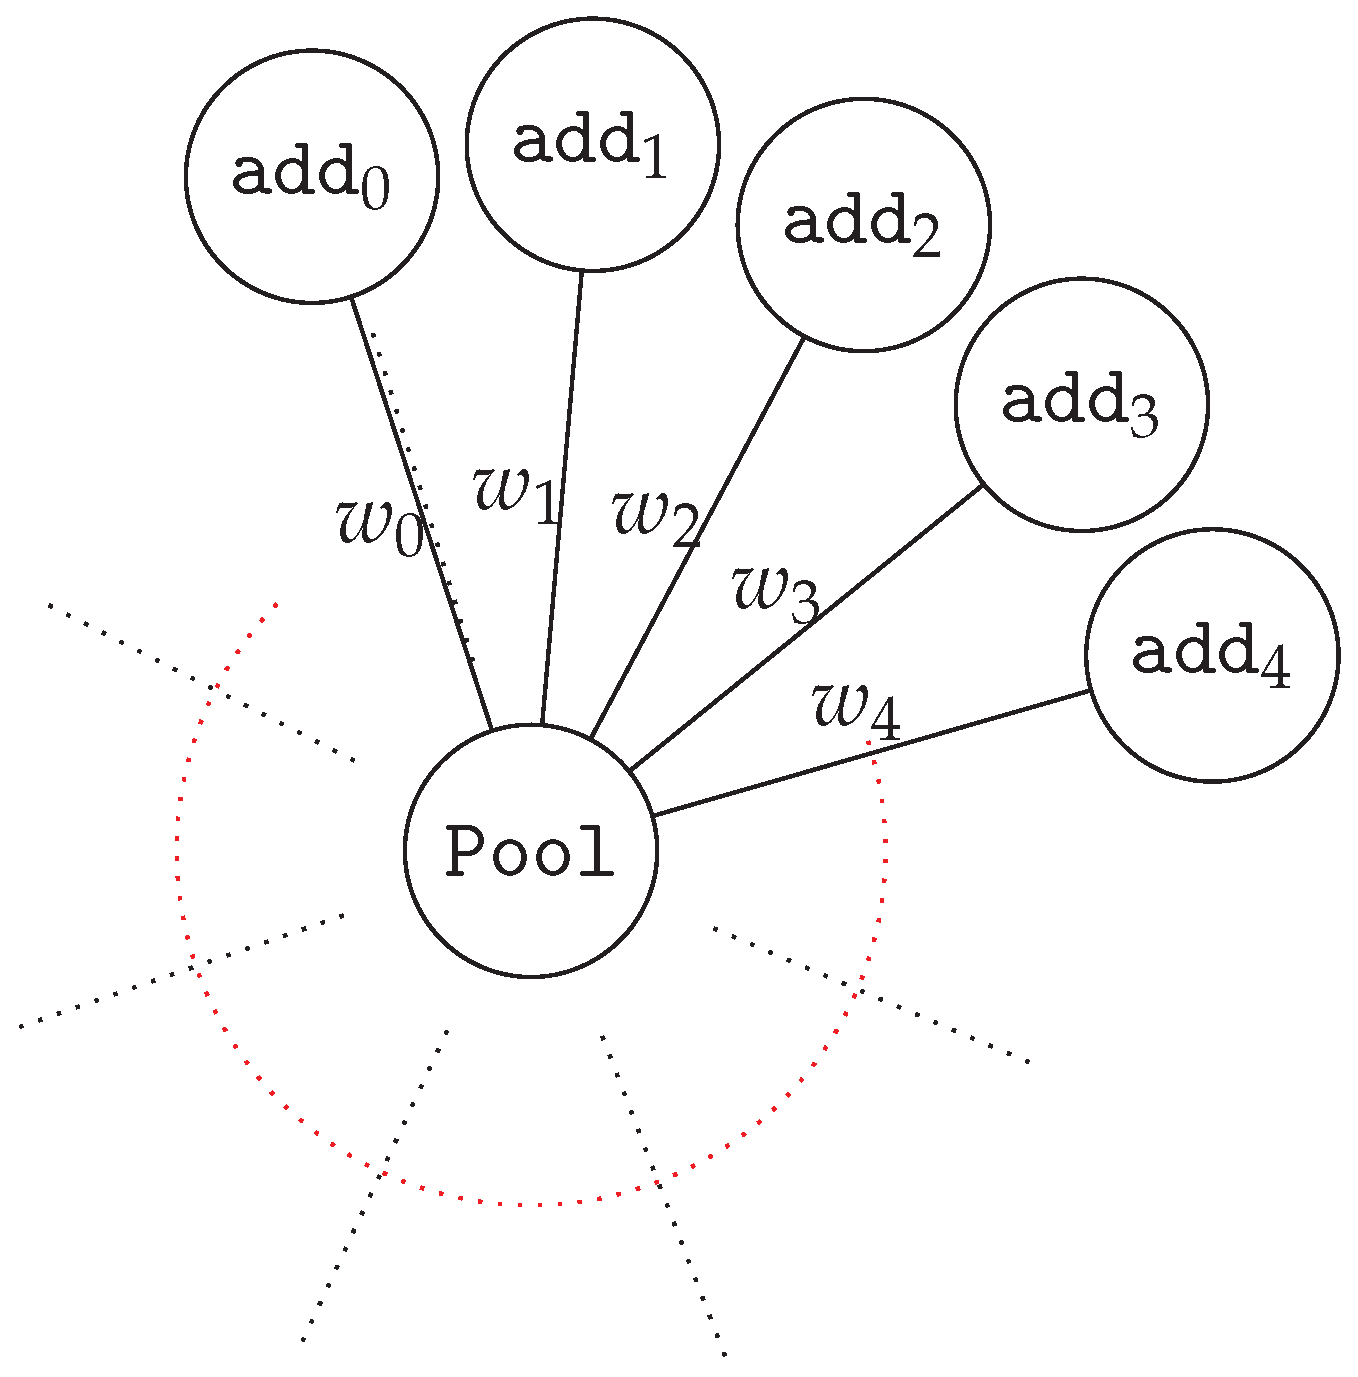
3.4.1. Token Distribution

The set of transfers and transactions allows us to compute the balance of each address for any snapshot. In order to study the distribution of the tokens, we propose using the Herfindahl–Hirschman Index (HHI).
In a nutshell, the HHI is a popular measure of market concentration and is used to calculate market competitiveness. The closer a market is to a monopoly, the higher the market’s concentration (and the lower its competition). As we will explain later, this measure will be useful in order to detect some potential rug pulls in Uniswap. Below, we provide a mathematical definition of the HHI (Figure 1).
Definition 1.
Let T be a token, A be the set of addresses, and B t : A R 0 be the balance mapping in some time frame t. The Herfindahl–Hirschman Index of the token T in time t is defined as
H H I t : = a A B t ( a ) 2 ( a A B t ( a ) ) 2 .
The H H I curve is defined as H H I : [ t i n i t , t e n d ] [ 0 , 1 ] .
In the cryptocurrency ecosystem, decentralization and the proper distribution of resources are important features. A smoother distribution of power implies less risk of breakdowns or malfunctioning produced by some participants misbehaving. In exchanges, a similar pattern occurs. In general, the more centralized the capital or funds, the higher the risk of market manipulations or liquidity removal, implying a loss of funds by retail investors.
From a game theory perspective, the more uniformly distributed the tokens and the liquidity, the less likely it is that agents can manipulate the market or remove funds in a short time period. For this reason, the lower the HHI, the better for the investors. Clearly, one of the problems of the HHI is that it is easy to manipulate and is sensitive to Sibyl attacks, since any adversary can create an arbitrary number of addresses and transfer an arbitrary amount of tokens among the addresses on his control. However, these manipulations incur some costs for the malicious agent, reducing the net profits of the attack.
To mitigate some of the problems mentioned, we propose using deeper network analysis tools. Recent studies used token transactions as a tool to forecast prices [40], detect price anomalies [8], and detect possible malicious activities [9,11,24]. Each period will be considered as a set of blocks with a separation of approximately one day between them.

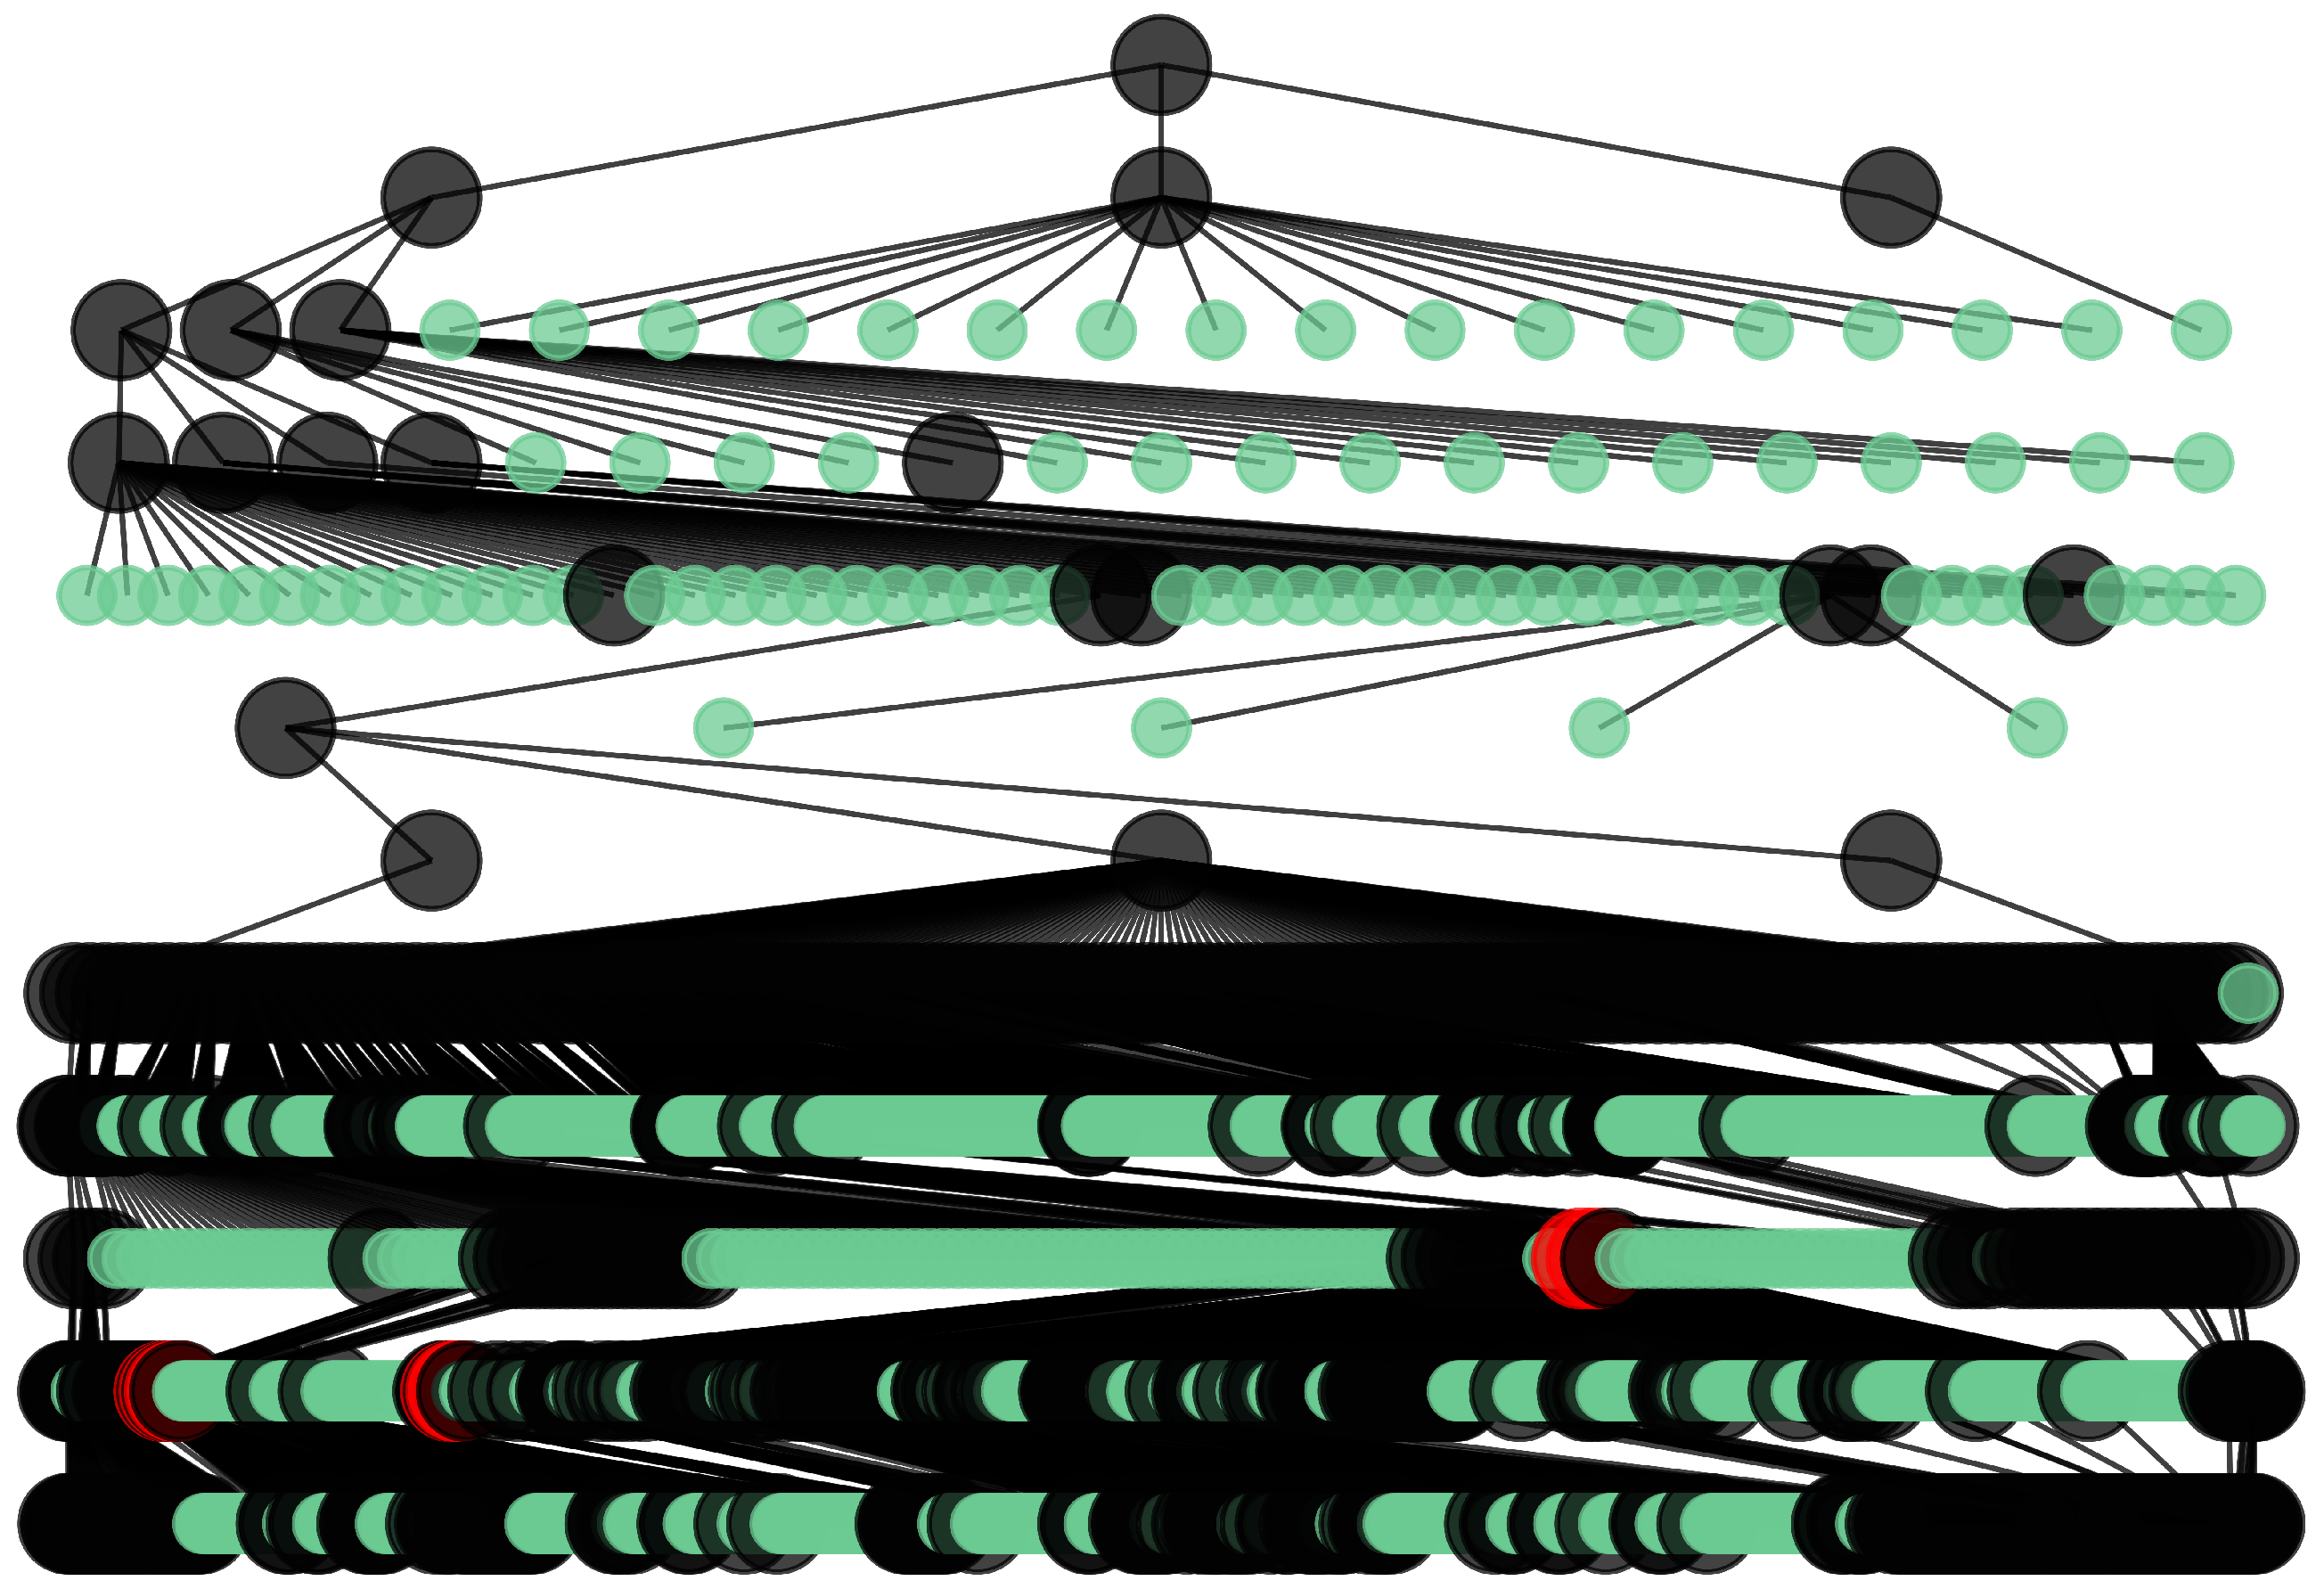
3.4.2. Transaction Graph Analysis

The set of transactions and transfers provides insightful information; however, this set can be better studied by giving it the natural graph structure, interpreting each address as a node and each transaction as a weighted edge.
Definition 2
(Transaction graph). Let G = ( V , E , w ) be a directed and weighted graph where V is the set of unique addresses, E V × V the transfers from one address to another, and w ( tx ) the amount transacted by the transfer tx . Then, G = ( G 1 , G 2 , , G n ) , i = 1 , , n + 1 is the time series for which G i represents the transaction graph generated during period i , i + 1 .
This time series captures the relationship between the users at each period. This allows us to study the circulation of the token between the different addresses.
Now, for each G i = ( V i , E i ) , we define the number of transactions N t x = # E i , the number of unique addresses N a d d r = # V i , and the volume transacted as e E w ( e ) . Finally, the average clustering coefficient is defined as A C C i = 1 n u V i c u , where c u is the geometric average of the subgraph edge weights [10], computed as follows:
c u = 1 d e g ( u ) ( d e g ( u ) 1 ) v w E ( w ^ u v w ^ v w w ^ w u ) 1 / 3
and w ^ u v are normalized by the maximum weight in the network, i.e., w ^ u v = w u v / max u v E ( w ( u v ) ) .
The average clustering coefficient is a measure of network segregation that captures the connections of individual nodes and their neighbors. In our scenario, this calculation allows us to quantify the interaction of each of the addresses with their neighboring addresses in a given period of time.
In general, the lower the use case of the token, the lower the average cluster coefficient. The main reason behind this heuristic is that a low diameter and use case usually imply that the transaction graph is close to a star graph (Figure 2) with Pool being the center node. Therefore, the average cluster coefficient is close to zero. However, users use non-malicious tokens in a large range of protocols, causing the nodes of these protocols to have a non-trivial cluster coefficient. Moreover, the daily average cluster coefficient is more prone to bias due to the constant need to make transactions between Sybil nodes and the impossibility of using batchTransfer operations, a type of operation that allows assets to be transfered to different addresses in one transaction.

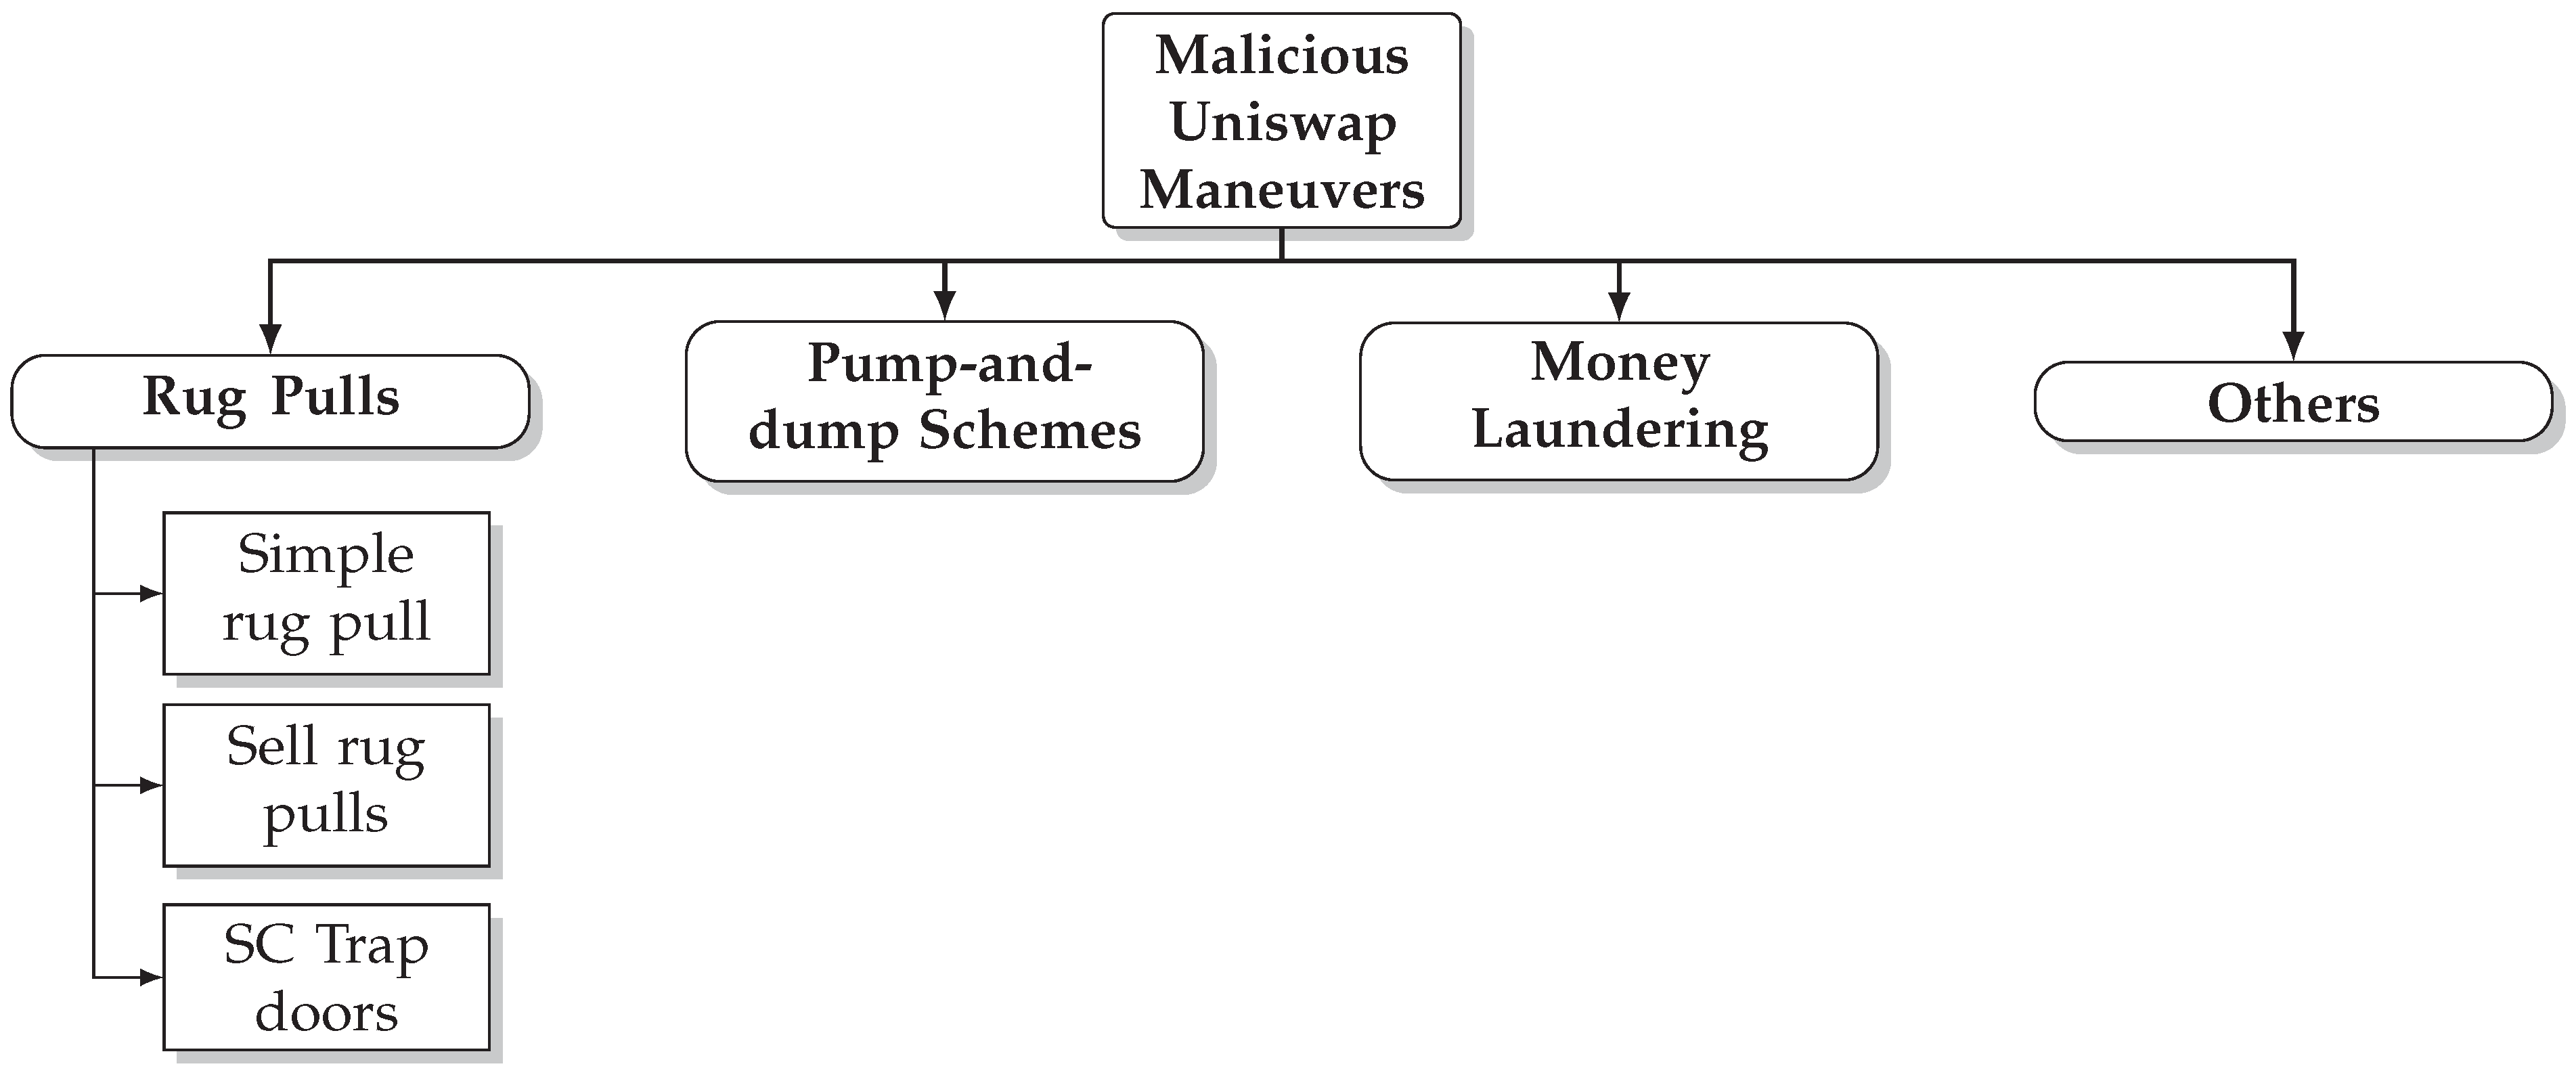
4. Malicious Uniswap Maneuvers

As we have mentioned before, a rug pull is one of the most popular means of scamming in decentralized exchanges combined with a phishing attack. Different techniques are used to trick new investors into buying malicious tokens. To understand the malicious tokens traded in UniswapV2, we introduce a comprehensive classification by manually classifying both malicious and non-malicious tokens. While this classification will provide a clear overview of the tokens in Uniswap, it depends on non-observable variables, such as intentionality and profits. Therefore, we will use a weaker classification for our machine learning model. In this section, we will propose an ideal classification that will provide insights into different rug pulls. Figure 3 provides an overview of the classification.
The terms scam and malicious token are not being used identically by all researchers. For example, papers such as [3] use the terms scam and under-performing token indistinguishably, leading to inaccurate results and classifications. In the current paper, we define a malicious token as one released by a developer or a group of developers with no intrinsic value or use case. This definition is similar to that used in paper [30]. Clearly, this definition is ambiguous unless the value and use case are properly defined. In general, this is a complex issue to address. For example, it is not clear that cryptocurrencies such as Doge (https://dogecoin.com/, accessed on 15 February 2022) or Shiba (https://www.shibatoken.com/, accessed on 15 February 2022) have any use case or intrinsic value, but they are among the most popular meme-coins. In our framework, we say that a token has no intrinsic value or use case if the developer knows that the trading price with respect to USD will eventually be zero. In other words, a tradable malicious token in Uniswap induces a zero-sum game between the users and the developers, i.e., the incentives for the investors are not aligned with those of the token creators. Therefore, the main difference between malicious and non-malicious tokens is the developer’s intentionality towards the token. One of the main problems of these definitions is that it is unfeasible to distinguish between scam tokens and under-performing or abandoned projects without accurate off-chain data. However, in general, the two terms do coincide. For these reasons, in the following section, rather than trying to identify whether a token is malicious or not, we will give a methodology for classifying and predicting under-performing and inactive tokens.
Simple rug pulls are the most common and easy to identify rug pulls. Essentially, simple rug pulls consist of three steps. The developer creates an ERC-20 token C and interacts with UniswapV2 Factory to create a new trading pair with wETH or any other relevant token, fixing the reserves to ( x , y ) . Then, the investors execute the swap transaction on the trading pair, exchanging ETH for C , and the reserves update to ( x + Δ x , y Δ y ) . Afterwards, the developer activates the function removeLiquidity, obtaining x + Δ x Ether and y Δ y of C . Since the coin C has no intrinsic value, the net profit of the attacker is x + Δ x fees .
Sell rug pulls are also prevalent. However, they are not easy to identify and compute the total gains of the attack. A simplification of the attack would be as follows. The developer creates an ERC-20 token C , with total supply S, and a new trading pair with a relevant token E . The developer adds a fraction f < S of the total supply of the C to the pool, having complete control of the remaining coins S f . Then, they wait for a sufficient number of investors to execute the swap transaction on the trading pair. Afterwards, the developer swaps f coins C for E . While this kind of rug pull is theoretically less profitable for the attacker, if combined with more features, it can be even more profitable than the first one. For example, in order to build confidence in investors, the attackers lock the liquidity in a smart contract or burn it. This makes investors think that a simple rug pull cannot happen, and that therefore it is a potentially profitable investment. In other words, the fact that the liquidity is locked makes the market volume increase. Moreover, if the token is mintable, the attacker can recover all the funds, minting as many coins as needed to recover nearly all the tokens E in the trading pool.
Smart Contract Trap Door rug pulls are the most difficult to identify and prevent. There are several reasons for this. The first is that the EVM is Turing-complete, and therefore it is highly complex to identify all vector attacks; the second is that smart contracts do not exist in isolation, i.e., smart contracts can work on top of other smart contracts. This means that the economic security of some smart contracts depends on other smart contracts [19]. In the following section, we will explain some of the most popular examples of these trap doors.
  • Mintable is a property shared by many tokens, including non-malicious ones such as USDT (https://tether.to/, accessed on 15 February 2022). In general, we say that a token is mintable if it has a function that allows it to increase the supply of the token with some pre-defined conditions. Usually, mintable tokens give rights to mint new tokens to the developers to a fixed set of addresses. While this functionality can be a useful feature in some contexts, it can also be used by malicious users to subtract all the liquidity of the pull by minting as many tokens as needed.
  • TransferFrom/Approve bad design is a property shared by some malicious tokens.
    TransferFrom is the function that allows a smart contract to transfer assets on behalf of an externally owned account. In the context of Uniswap, a proper design of this function allows tokens to be sold. In other words, arbitrarily changing the TransferFrom function makes the Uniswap Pool behave as a honeypot [18]. There are different means of making this smart contract; however, the most popular example of this kind of scam is the use of tokens that contain the line code require(from == owner to == owner from == UNI) in the TransferFrom function.
  • Composability vulnerabilities are the least common ones and the hardest to find. In general, this type of rug pull is not made by the developers but by malicious agents external to the project, who take advantage of the bad design of the smart contract token interacting with Uniswap or other DEXs. Those that we have been able to identify are the tokens with a price oracle vulnerability. Usually, we observed that these tokens have Uniswap integrated in the source code of the smart contract in order to reward holders. However, these rewards depend on the price. The higher the price, the higher the reward. The fundamental problem of this mechanism is that the price is defined through an oracle that, as shown in [22], is easy to manipulate with enough funds or using a flash loan.
In general, these rug pulls are not exclusive and, in reality, different techniques are applied in order to execute a rug pull. Moreover, these techniques are usually combined with phishing attacks and pump-and-dump schemes.
Money laundering: In traditional finance, money laundering is the processing of money obtained from illicit activities, to make it appear that it originated from a legitimate source. In the Ethereum environment or cryptospace in general, we will define money laundering as the process of sending some coins obtained from heists, honeypots, or hacks from an address addr 1 to another address addr 2 privately. That is, observers cannot link these two addresses through the transaction graph (Figure 4). In Ethereum, the most common technique to obtain privacy is through mixers [14]. The most popular mixer is TornadoCash (https://tornado.cash/, accessed on 15 February 2022), which implements a smart contract that accepts transactions in Ether so that the amount can later be withdrawn with no reference to the original transaction by means of using zero-knowledge proofs. Analyzing rug pulls in the Uniswap protocol, we have found some users that use the Uniswap protocol to send Ether to other addresses without being noticed by most common address clustering algorithms. The operation consists of three main steps. First, the address addr 2 creates an unsellable token C and lists it in Uniswap with an arbitrary amount of liquidity. Then, the address addr 1 changes the Ether for C in the Uniswap pool. Finally, the address addr 2 removes all the liquidity from the pool.
A good example of this is given by the user that controls the address 0x775744… (https://etherscan.io/address/0x775744a529f73a754164e4fE740e44C7c5aa5942, accessed on 15 February 2022), in charge of creating more than 500 tokens in order to money launder, pump prices, and obtain profits via executing trap door rug pulls.
Pump-and-dump schemes: In traditional finance, a pump-and-dump scheme is a malicious maneuver that manipulates the market price of a stock, in which the executors first purchase a financial asset at a certain price. They then persuade other speculative non-informed investors to purchase, within a short period of time, thereby causing the price to rise artificially (pump), and executors sell their assets at a profit. This typically leads to a rapid price drop (dump), leaving the victims with a loss. In traditional markets, pump-and-dump schemes have generally been illegal around the globe. However, in cryptocurrencies, the lack of regulations and the nature of cryptospace allow these maneuvers to happen easily and avoid sanctions. While these maneuvers have some intersection points with the rug pull maneuver, the fundamental difference is that, in pump-and-dump schemes, the targeted asset is not necessarily malicious, while, in rug pulls, it is.
Others: While malicious maneuvers are usually a combination of the ones mentioned before, all of them have a characteristic in common: the victims are uninformed users. However, there are other maneuvers in EVM-compatible blockchains that try to attack the weaknesses of maximal extractable value (MEV) bots. A good example of this is Salmonella (https://github.com/Defi-Cartel/salmonella, accessed on 15 February 2022), a bot that tries to trick sandwich traders [23]. Salmonella creates a token with an approve/transferFrom bad design. Afterwards, it creates a swap transaction that tricks MEV bots to sandwich it with a buy and sell operation. At the moment that the transactions are executed, by design of the Salmonella smart contract, the buy is accepted, but the sell transaction is reverted, leaving a lot of cash in the pool for the Salmonella developer.

5. Data Collection

To download all the data needed to perform the labelling and the analysis, we used an Infura archive node (https://infura.io/, accessed on 15 February 2022) and the Etherscan API (https://etherscan.io/apis, accessed on 15 February 2022.) To obtain the state of the Uniswap exchange and the tokens, we used the events produced by their respective smart contracts. Any node connected to Ethereum JSON-RPC API can observe these events and act accordingly. Events can also be indexed, so that the event history is searchable later.
  • Tokens listed: We obtained the history of all tokens listed in the Uniswap V2 from its creation to 3 September 2021, asking for all events of the PairCreated type in the UniswapV2Factory contract.
  • Smart contract and features: After obtaining all listed tokens in Uniswap, with the help of Etherscan, we downloaded the transactions in which they were created, their smart contract, their decimals, and their symbol. In order to speed up these calls, we used the multicall contract (https://etherscan.io/address/0xb1f8e55c7f64d203c1400b9d8555d050f94adf39, accessed on 15 February 2022) to batch these calls to the blockchain in a single call. Afterwards, we used Slither [16] to obtain different features of the smart contract, such as pausable and mintable.
  • Events: From all the pools of Uniswap obtained in Tokens listed, we collected all events of type Sync, Mint, Burn and Transfer for each of the PairPools obtained. Finally, we downloaded all Transfer events from each of the tokens.
There are several attributes that we could not download via API, such as the transaction creation of a contract and full market cap of a token; however, they are available on certain block explorers such as Etherscan. In these cases, we have used scrapping techniques to obtain this information. For example, some of the data that we have not been able to find via the Etherscan API and Infura include the hash of the transaction in which tokens were created and tokens that have had some type of external audit.

6. Token Labelling

In this section, we provide the set of tools and the methodology we used in order to label the tokens listed in the Uniswap protocol as malicious and non-malicious, and provide the results obtained using this methodology. First, we define the maximum drop and the recovery of token prices and liquidity time series. Then, we explain the distribution of tokens that eventually became inactive or that became a rug pull. Finally, we explain which methodology we used to accurately label tokens as non-malicious.

6.1. Ground Truth Labelling

One of the final goals of this study is to create an ML algorithm capable of detecting malicious tokens. To do this, we have built a list of tokens tagged as malicious and non-malicious. In this case, the label of the malicious tokens has been deduced from a series of calculations defined below:
Definition 3.
Let X = { X t t { 0 , , S } } , be the time series representing the price or liquidity in all the token activity up to the last sync event S. The maximum drop is defined as
M D = X l X h X h ,
where X h = max { X τ τ { 0 , , S } } , h = argmax { X τ τ { 0 , , S } } , and X l = min { X τ τ { h , , S } } .
The maximum drop is usually known in the literature as maximum drawdown and is often used as a risk measure of portfolios (Figure 5). Informally, the maximum drop is the largest drop from a peak to a trough. In our context, the maximum drop measures a fall in the price or liquidity of the Uniswap-listed pools. In Section 4, we have seen that the last step in a simple rug pull is the removal of all liquidity from the pool. Therefore, by definition, in a simple rug pull, the MD of the liquidity or time series of a rug pull tends to be approximately 1. However, the opposite implication is not true in general. While the price maximum drawdown being close to 1 implies that the token is malicious, the MD of liquidity being 1 does not necessarily imply some malicious behavior. For example, the developer could have moved the funds to another pool or another DEX project. Moreover, it could be possible that the market maker just wants to retire their funds and does not have any more interest in providing liquidity. In general, if the token has a use case and a market value, other agents will have incentives to take over as market makers. For this reason, we introduce the recovery.
Definition 4.
Let h , l [ 0 , S ] be the elements defined previously. Then, the recovery from X τ to X S is computed as
R C = X S X l X h X l .
Informally, the recovery is the largest pump from the bottom. This measure makes it possible to check if the liquidity position and the price of a token have recovered after the drop. Next, we will show how the data split, taking into account the maximum drawdown and the recovery.
Figure 6a shows two examples of different rug pulls with no recovery and a maximum drop of one in liquidity and price, respectively. Moreover, one can deduce that the rug pull (a) is a simple rug pull while the rug pull (b) is a sell rug pull.

6.1.1. Malicious Token Labelling

Various features were computed, taking into account two properties: fluctuations in price or liquidity, and activity. As explained above, the maximum drop computes the greatest drop, either in liquidity or price, during the activity of the tokens.
Most malicious tokens, at some point, lose all their liquidity or their price drops to zero. However, this does not necessarily indicate malicious behavior, as it may be due to a simple fluctuation. Thus, we also computed the recovery. If a token loses all its liquidity or its price drops to zero and these levels are never recovered, then the probability that the falls are due to malicious intent increases.
In addition, to ensure that these fluctuations are not due to simple market movement, we compute the time elapsed since the last movement of the pool or token transfer to 13 September 2021. If more than one month has passed between the last movement or transaction of the token so far, we consider that the token is inactive. Finally, we obtain a list of inactive tokens, which have drops in price or liquidity of almost one hundred percent and which do not recover. Our initial list contained 46,499 tokens. We discarded those that did not have decimals defined in their contract (169). We then selected those that had a pool connected to wETH (44,685) and downloaded their Sync, Mint, Burn and Transfer events. The final list contains 37,891 tokens that have at least one pool connected with wETH and more than 5 Sync events in all their activity. This last property is necessary to be able to compute the heuristics used to label the tokens (Figure 7).
As explained above, we first checked if the tokens were inactive, i.e, if they had not registered Transfer or Sync events for more than 30 days (86.4% of the total). We also computed the maximum liquidity drop and saw that the liquidity of 78.2% of the inactive pools had been completely withdrawn at some point. Finally, we noticed that only 0.4% of pools that at some point had lost all their liquidity recovered in all subsequent activity. This made a total of 24,870 tokens that could be tagged as malicious since they were inactive tokens that had, at some point, lost all their liquidity and had not recovered it again.
On the other hand, as shown in Figure 8, 8.6% of the inactive tokens did not have any Burn LP events in all their activity period. However, 79.2% of this 8.6% had seen a price drop of more than 90% at some point, and only 1.9% recovered their value after the drop. This adds 2087 tokens that can be identified as malicious since they are inactive, with a price MD of at least 90% and no recovery.

6.1.2. Non-Malicious Token Labelling

Unlike malicious tokens, non-malicious tokens cannot be chosen from a liquidity, price, and activity analysis. Given a token, it may be considered malicious if there has been at least one rug pull at some point in its activity. However, a token that has not had any rug pull cannot be considered non-malicious, since it could experience a rug pull later on. Therefore, we take advantage of audits carried out by external companies (Certik, Quantstamp, Hacken, etc.). It is important to highlight that non-malicious tokens can have drops in price and liquidity, too. Nevertheless, none of them simultaneously fulfil all three properties that define malicious tokens, namely inactivity, a sharp drop in price or a sharp drop in liquidity, and no recovery. Thus, a list of 674 tokens labelled as non-malicious has been mined from different sources (https://coinmarketcap.com/view/defi/; https://www.coingecko.com/en/categories/decentralized-finance-defi; https://etherscan.io/tokens, all accessed on 15 February 2022). We have also discarded those that are so large that it becomes computationally expensive to compute its features—for example, USDT or USDC. The final list contains 631 tokens labelled as non-malicious.

7. Scam Detection

We start from a list of tokens labelled as malicious or non-malicious, according to their features; therefore, it can be considered a binary classification problem. In this classification, we distinguish between the two types of tokens in the moments prior to the malicious activity. This means that models are capable of detecting malicious tokens in the activity prior to the rug pull. In this section, we present two methods: one considering all the activity of a token, and the other considering just the first 24 h. Moreover, we detail the different classifiers used in both methods and their hyperparameter optimization. Finally, we present the results of each method.

7.1. Activity-Based Method

Our goal is to detect malicious tokens at an early stage, i.e., before users lose their capital. Thus far, we have characterized two main types of rug pull: the ones that lose all liquidity at some point and the ones where the price drops to almost zero. In this way, for each token labelled as malicious, we have randomly chosen several evaluation points prior to the maximum drop. Non-malicious tokens have been evaluated throughout their activity. Then, for each evaluation point, we have calculated the token features up to that block and used them to train two ML algorithms in order to find those patterns related to malicious activity.
In this method, we choose n evaluation blocks at random. For example, Figure 9 shows the price and liquidity of one token labelled as malicious. In this token, liquidity suddenly drops to zero and does not recover again. Therefore, we consider it to be a fast rug pull. The three vertical lines leading up to the crash represent the three evaluation points for that particular token. This means that we have calculated the variables of that token up to those blocks. In this way, we have proceeded with each of the labelled tokens. As explained in Section 7.4, the final metrics have been computed taking five evaluation points on non-malicious tokens and one on malicious tokens. All evaluations are prior to the malicious act; this implies that this method can later be used as a tool to detect malicious tokens at any time. However, there are subtleties that can skew the ML algorithms used. For example, tokens labelled as non-malicious tend to have a much larger capitalization compared to malicious tokens; therefore, the algorithm could end up differentiating between “small” tokens and “large” tokens instead of malicious and non-malicious. Although this differentiation is not a bad approach to this task, we think that there may be other situations that require different approaches. In the next method, we evaluate all tokens at the same temporal evaluation points in order to identify these possible biases.

7.2. 24-Hour Early Method

Rug pulls are profitable if their malicious act is done before they are discovered. Therefore, most rug pulls (93%) occur in the first 24 h after the pool is created. This encourages us to build a tool to detect malicious tokens at startup. For each labelled token, we have computed its features in each of the 24 h after its pool creation. Then, we create a different dataset for each hour in which the tokens are evaluated.
Note that, in this case, we are training the models for each hour; therefore, we only have one evaluation point for each dataset. This also implies that we will have a smaller dataset compared to the other method. In Appendix C, we present the different metrics obtained for each of the hours. Moreover, we can measure the evolution of the predictive power of the algorithm in the first hours of the token’s life. The fact that this method requires a certain history to be able to give a prediction implies that the more history we obtain, the better the prediction. This intuition is confirmed in Section 7.4.

7.3. Machine Learning and Hyperparameter Optimization

Gradient Boosting Decision Tree (GBDT) [41] models offer high performance in classification tasks with tabular data since they allow the definition of different cost functions, do not require preprocessing for categorical features, and can handle missing data. Thus, it seems clear to apply a GBDT model to our problem. In particular, we have used the XGBoost [42] algorithm.
On the other hand, algorithms with Transformer architecture [43] are obtaining high results in fields such as natural language processing [44,45], computer vision [46], etc. In this work, we have used a model based on attention mechanisms called FT-Transformer [6] in order to test a tabular algorithm with Transformer architecture in our problem.
Hyperparameters cannot be learned during the training process. Furthermore, they have a significant impact on the performance of the model being trained. Thus, optimizing them is crucial for better efficiency, faster convergence, and overall better results. In this work, we have used Optuna [47], a software framework designed primarily for hyperparameter optimization in ML algorithms.
Finally, in order to evaluate the impact of each variable, we have used the SHAP (SHapley Additive exPlanations) Values [48]. SHAP uses game theory to explain the results obtained in ML algorithms. In particular, it uses the classical Shapley values of game theory and their related extensions.

7.4. Results

The final list contains 27,588 labelled tokens, 631 labelled as non-malicious tokens and 26,957 labelled as malicious. Within the malicious, 24,870 are fast rug pulls and 2087 do not contain LP Burn events. We see that there are far fewer non-malicious tokens than malicious ones. There are many techniques (https://imbalanced-learn.org/stable/references/index.html, accessed on 15 February 2022) to deal with this problem; however, none of them have been applied in order to make the results more understandable. Instead, our data augmentation technique consists of choosing more evaluation points for non-malicious tokens than for malicious tokens. Now, given this dataset, we want to increase the performance in predicting non-malicious tokens since it would be enough to label all of them as malicious to achieve an accuracy rate of 97.7%. Therefore, we label the non-malicious tokens as 1 and the malicious tokens as 0.
We have used the cross-validation method to validate both ML algorithms. Cross-validation is a resampling method that uses different parts of the data to test and train a model in different iterations. In particular, we have used the stratified version, in which the partitions are selected so that the mean response value is approximately the same in all partitions. In the case of binary classification, this means that each partition contains roughly the same proportions of the two types of class labels. In the first method, we have five evaluation points on non-malicious tokens and one on malicious tokens. Thus, in each of the iterations, the tokens of the training and validation set are separated in a stratified way with all their corresponding evaluations. This implies that the same token will never have evaluations in the training and validation set at the same time, and all folds will have roughly the same number of malicious tokens. Finally, we used five-fold cross-validation; therefore, all the results will be presented as the mean and standard deviation of all folds.
We have used the xgboost (https://xgboost.readthedocs.io/en/stable/, accessed on 15 February 2022) Python library to apply the XGBoost model to each method. Specifically, in each of the five folds, we have used the training partition to perform a hyperparameter optimization (see Appendix B) to later predict the test of the corresponding fold. In the case of FT-Transformer, we have used the default parameters of the rtdl (https://yandex-research.github.io/rtdl/stable, accessed on 15 February 2022) Python library, since training this model is too expensive to perform hyperparameter optimization.

7.4.1. Activity-Based Method Results

Both XGBoost and FT-Transformer obtain high metrics for accuracy, recall, precision, and F1 score. However, XGBoost outperforms FT-Transformer in all metrics. As we previously mentioned, unlike XGBoost, FT-Transformer hyperparameters have not been optimized due to the high computational complexity required to train the model (Table 2).
To understand the impact of each feature in both models, we have computed the SHAP values. In this work, we only focus on XGBoost; however, the process would be the same for FT-Transformer. The SHAP values assign the importance of each feature for each prediction. In general, the greater the impact of features on a prediction, the greater the SHAP value in absolute values.
In Figure 10, we show, on the left side, the feature importance in terms of the SHAP value applied in the first method, and, on the right, the impact on the final output. As previously noted, most malicious tokens die in the first 24 h after the pool is created; by contrast, non-malicious tokens have a longer life. This explains why features such as the number of transactions or number of unique addresses have so much weight in the model. Another important feature is the difference in blocks between the creation of the token and the pool. We notice that a smaller block difference between token and pool creation implies negative SHAP values, and negative SHAP values should correspond to malicious tokens. This conclusion coincides with [3] since several of the malicious tokens take advantage of social trends by copying the name of official tokens and take money from investors who become confused. This technique implies speed in the creation of the token and the pool, since otherwise the trend may be lost.

7.4.2. 24-Hour Early Method Results

The results of the second method must be understood from another perspective, since the problem posed is not the same. As we said, the difference with respect to the first method lies in the fact that, we evaluate all the tokens at a certain time after the creation of their respective pools.
Figure 11 shows the evolution of the metrics for each of the ML algorithms used. XGBoost obtains better metrics, except precision in some cases. We also notice that the metrics of the first hour are lower than those of the last. This confirms the intuition that our methods require a certain token history in order to work correctly and that models improve as this history grows. Our algorithm obtains very high accuracy (see Appendix C) even in the first few hours. However, the precision, recall and F1 score are lower than in the activity-based method. In the best of cases, i.e., 20 h after the creation of the pool, our best algorithm obtains a recall score of 0.789. This could indicate that while malicious tokens are easily detectable in the first few hours, non-malicious tokens require more time. On the other hand, the precision remains quite high compared to the recall. This implies that, although the algorithms do not have a strong ability to detect non-malicious tokens, once they predict that one of them is non-malicious, it is very likely to be the case.

7.4.3. Unicrypt Results

As explained in Section 3.3, Unicrypt is a protocol that runs on top of the Uniswap protocol with the purpose of being a partial solution to rug pulls. In this work, we have empirically demonstrated that most of the tokens that use Unicrypt are malicious. First, from our list of labelled tokens, 745 use Unicrypt, 725 are labelled as malicious, and 20 as non-malicious. Then, from the unlabelled tokens, we compute their features up to the present time and use the activity-based method with the XGBoost algorithm to evaluate them. Based on these predictions, of the 2544 of the non-labelled tokens using Unicrypt, 2211 are predicted to be malicious and 333 non-malicious.

8. Conclusions

In summary, first, we increased the dataset provided in [3] by 18K scam tokens, finding new ways of actively executing the rug pulls. Then, we provided a theoretical classification to understand the different ways of executing the scam, and through the process of identifying rug pulls, we found new token smart contract vulnerabilities (composability attacks) and new ways of money laundering. Based on this theoretical foundation, we provided a methodology to find rug pulls that had already been executed. Not surprisingly, we found that more than the 97.7 % of the tokens labelled were rug pulls. Finally, we defined two methods that use ML models to distinguish non-malicious tokens from malicious ones. We also verified the high effectiveness of these models in both scenarios. This implies that new malicious tokens can be detected prior to the malicious act, and, on the other hand, tokens supported by a strong project can also be detected at an early stage. The software to replicate the numerical results obtained is provided in (https://github.com/T2Project/RugPullDetection, accessed on 15 February 2022).

9. Future Work

While our study has produced high precision and accuracy in detecting scams listed in Uniswap, it carries some limitations. First, we believe that transferring learning techniques will not obtain the same quality of results in DEXs of other chains such as PancakeSwap (https://pancakeswap.finance, accessed on 15 February 2022) and QuickSwap (https://quickswap.exchange, accessed on 15 February 2022). Since the gasPrice is much lower, the economic cost of simulating volume and transfers is almost negligible. Therefore, in order to obtain similar results in other chains, we should repeat the same longitudinal work and compute new features. In addition, as market trends may change, these algorithms will have to be retrained in order to keep adding new information.
Second, even though our approach for studying the source code of the tokens with Slither [16] was efficient and reliable for our purpose, it was not completely accurate, since it is a static analysis tool of the code and does not take into account complex composability problems among other protocols. Therefore, to have more insights for a particular token, we suggest using stronger testing tools and formal verification tools, such as the ones provided in [19].
Third, even though the clustering coefficient proved to be useful, computing this feature is highly time-consuming. Therefore, we propose using other graph analysis methods, such as topology data analysis, to have a more efficient scam detection algorithm and obtain even more reliable insights into the transaction graph.

Author Contributions

Data curation, V.D.; Investigation, B.M. and V.A. All authors have read and agreed to the published version of the manuscript.

Funding

This paper is part of a project that has received funding from the European Union’s Horizon 2020 research and innovation programme under grant agreement number 814284.

Institutional Review Board Statement

Not applicable.

Informed Consent Statement

Not applicable.

Conflicts of Interest

The authors declare no conflict of interest.

Appendix A. Table of Features

Table A1. This table describes each feature used in the XGBoost and FT-Transformer classifiers. Note that apart from the Token group, all features are defined as time series.
GroupNameDescription
HHI indexliq_curveHHI applied to LP tokens.
tx_curveHHI applied to each token.
Pooln_pool_syncsTotal sync events.
wethTotal weth.
pricePrice of token.
liquidityTotal liquidity.
LP-Tokenlp_transferTotal number of LP token transfers.
mintsTotal number of mint events.
burnsTotal number of burn events.
Token transfersn_transfersTotal number of transfers.
n_unique_addressesTotal number of unique addresses.
clus_coeffClustering coefficient.
Tokendifference_token_poolNumber of blocks between token and pool creation.
lockThis feature is 1 if part of the liquidity is locked and 0 otherwise.
yieldThis feature is 1 if there is yield farming involved and 0 otherwise.
burnThis feature is 1 if part of the liquidity has been burned and 0 otherwise.

Appendix B. Hyperparameters

Table A2. List of hyperparameters optimized using the Optuna Python library.
ModelParameterTypeDistributionRange
XGBoostmax_depthIntUniform[3, 10]
subsampleFloatUniform[0.5, 1]
learning_rateFloatUniform[1 × 10⁻⁵, 1]
gammaFloatLog-Uniform[1 × 10⁻⁸, 1 × 10²]
lambdaFloatLog-Uniform[1 × 10⁻⁸, 1 × 10²]
alphaFloatLog-Uniform[1 × 10⁻⁸, 1 × 10²]

Appendix C. Second Method Results

XGBoost 24 hFT-Transformer 24 h
HourAccuracySensitivityPrecisionF1_ScoreHourAccuracySensitivityPrecisionF1_Score
10.9900.7140.8100.75810.9890.6820.7910.729
20.9910.7470.8380.78920.9880.7020.7780.734
30.9910.7550.8370.79330.9900.7070.8240.755
40.9920.7620.8560.80640.9870.7070.7510.724
50.9920.7730.8490.80950.9900.6830.8400.749
60.9920.7710.8600.81360.9890.7060.8050.749
70.9920.7630.8510.80470.9900.7170.8120.760
80.9910.7580.8410.79780.9900.7100.8210.759
90.9910.7620.8450.80190.9900.7220.8150.763
100.9920.7790.8450.810100.9900.7120.8280.762
110.9920.7730.8490.808110.9900.7170.8110.759
120.9920.7860.8520.816120.9890.7220.7950.755
130.9920.7780.8590.815130.9890.7180.7750.745
140.9920.7860.8540.817140.9890.7460.7890.764
150.9920.7760.8510.811150.9900.7500.7930.770
160.9920.7730.8480.808160.9900.7340.8120.767
170.9920.7790.8520.813170.9910.7570.8200.784
180.9920.7840.8640.821180.9910.7460.8260.782
190.9920.7820.8580.818190.9910.7650.8290.792
200.9920.7890.8530.819200.9900.7200.8380.765
210.9920.7790.8630.818210.9910.7600.8340.793
220.9920.7840.8670.823220.9910.7470.8340.786
230.9920.7840.8690.824230.9910.7460.8430.786
240.9920.7870.8600.821240.9910.7580.8190.785

References

  1. Nakamoto, S. Bitcoin: A Peer-to-Peer Electronic Cash System; Technical Report; SSRN: Rochester, NY, USA, 2019. [Google Scholar]
  2. Werner, S.M.; Perez, D.; Gudgeon, L.; Klages-Mundt, A.; Harz, D.; Knottenbelt, W.J. Sok: Decentralized finance (defi). arXiv 2021, arXiv:2101.08778. [Google Scholar]
  3. Xia, P.; Gao, B.; Su, W.; Yu, Z.; Luo, X.; Zhang, C.; Xiao, X.; Xu, G. Demystifying Scam Tokens on Uniswap Decentralized Exchange. arXiv 2021, arXiv:2109.00229. [Google Scholar]
  4. Rug Pull Detector. Available online: http://rugpulldetector.com/ (accessed on 30 September 2021).
  5. Token Sniffer. Available online: https://tokensniffer.com/ (accessed on 30 September 2021).
  6. Gorishniy, Y.; Rubachev, I.; Khrulkov, V.; Babenko, A. Revisiting Deep Learning Models for Tabular Data. 2021. Available online: http://xxx.lanl.gov/abs/2106.11959 (accessed on 15 February 2022).
  7. Zero-Dimensional Scam Detection. Available online: https://github.com/T2Project/RugPullDetection (accessed on 12 December 2021).
  8. Li, Y.; Islambekov, U.; Akcora, C.; Smirnova, E.; Gel, Y.R.; Kantarcioglu, M. Dissecting ethereum blockchain analytics: What we learn from topology and geometry of the ethereum graph? In Proceedings of the 2020 SIAM International Conference on Data Mining, SIAM, Cincinnati, OH, USA, 7–9 May 2020; pp. 523–531. [Google Scholar]
  9. Ofori-Boateng, D.; Dominguez, I.S.; Kantarcioglu, M.; Akcora, C.G.; Gel, Y.R. Topological Anomaly Detection in Dynamic Multilayer Blockchain Networks. 2021. Available online: http://xxx.lanl.gov/abs/2106.01806 (accessed on 15 February 2022).
  10. Onnela, J.P.; Saramäki, J.; Kertész, J.; Kaski, K. Intensity and coherence of motifs in weighted complex networks. Phys. Rev. E 2005, 71, 065103. [Google Scholar] [CrossRef] [PubMed] [Green Version]
  11. Patel, V.; Pan, L.; Rajasegarar, S. Graph Deep Learning Based Anomaly Detection in Ethereum Blockchain Network. In Proceedings of the International Conference on Network and System Security; Springer: Berlin, Germany, 2020; pp. 132–148. [Google Scholar]
  12. Phillips, R.; Wilder, H. Tracing Cryptocurrency Scams: Clustering Replicated Advance-Fee and Phishing Websites. In Proceedings of the 2020 IEEE International Conference on Blockchain and Cryptocurrency (ICBC), Toronto, ON, Canada, 2–6 May 2020; pp. 1–8. [Google Scholar] [CrossRef]
  13. Poursafaei, F.; Hamad, G.B.; Zilic, Z. Detecting Malicious Ethereum Entities via Application of Machine Learning Classification. In Proceedings of the 2020 2nd Conference on Blockchain Research Applications for Innovative Networks and Services (BRAINS), Paris, France, 28–30 September 2020; pp. 120–127. [Google Scholar] [CrossRef]
  14. Seres, I.A.; Nagy, D.A.; Buckland, C.; Burcsi, P. Mixeth: Efficient, trustless coin mixing service for ethereum. In Proceedings of the International Conference on Blockchain Economics, Security and Protocols (Tokenomics 2019), Schloss Dagstuhl-Leibniz-Zentrum fuer Informatik, Paris, France, 6–7 May 2019. [Google Scholar]
  15. Dika, A.; Nowostawski, M. Security vulnerabilities in ethereum smart contracts. In Proceedings of the 2018 IEEE International Conference on Internet of Things (iThings) and IEEE Green Computing and Communications (GreenCom) and IEEE Cyber, Physical and Social Computing (CPSCom) and IEEE Smart Data (SmartData) IEEE, Yogyakarta, Indonesia, 19–21 November 2018; pp. 955–962. [Google Scholar]
  16. Feist, J.; Grieco, G.; Groce, A. Slither: A static analysis framework for smart contracts. In Proceedings of the 2019 IEEE/ACM 2nd International Workshop on Emerging Trends in Software Engineering for Blockchain (WETSEB), IEEE, Montreal, QC, Canada, 27–27 May 2019; pp. 8–15. [Google Scholar]
  17. Oliva, G.A.; Hassan, A.E.; Jiang, Z.M.J. An exploratory study of smart contracts in the Ethereum blockchain platform. Empir. Softw. Eng. 2020, 25, 1864–1904. [Google Scholar] [CrossRef]
  18. Torres, C.F.; Steichen, M. The art of the scam: Demystifying honeypots in ethereum smart contracts. In Proceedings of the 28th {USENIX} Security Symposium ({USENIX} Security 19), Santa Clara, CA, USA, 14–16 August 2019; pp. 1591–1607. [Google Scholar]
  19. Babel, K.; Daian, P.; Kelkar, M.; Juels, A. Clockwork Finance: Automated Analysis of Economic Security in Smart Contracts. arXiv 2021, arXiv:2109.04347. [Google Scholar]
  20. Caldarelli, G.; Ellul, J. The Blockchain Oracle Problem in Decentralized Finance—A Multivocal Approach. Appl. Sci. 2021, 11, 7572. [Google Scholar] [CrossRef]
  21. Daian, P.; Goldfeder, S.; Kell, T.; Li, Y.; Zhao, X.; Bentov, I.; Breidenbach, L.; Juels, A. Flash boys 2.0: Frontrunning in decentralized exchanges, miner extractable value, and consensus instability. In Proceedings of the 2020 IEEE Symposium on Security and Privacy (SP) IEEE, San Francisco, CA, USA, 18–21 May 2020; pp. 910–927. [Google Scholar]
  22. Eskandari, S.; Salehi, M.; Gu, W.C.; Clark, J. SoK: Oracles from the Ground Truth to Market Manipulation. arXiv 2021, arXiv:2106.00667. [Google Scholar]
  23. Zhou, L.; Qin, K.; Torres, C.F.; Le, D.V.; Gervais, A. High-frequency trading on decentralized on-chain exchanges. In Proceedings of the 2021 IEEE Symposium on Security and Privacy (SP) IEEE, San Francisco, CA, USA, 24–27 May 2021; pp. 428–445. [Google Scholar]
  24. Chen, W.; Guo, X.; Chen, Z.; Zheng, Z.; Lu, Y. Phishing Scam Detection on Ethereum: Towards Financial Security for Blockchain Ecosystem. In Proceedings of the Twenty-Ninth International Joint Conference on Artificial Intelligence, IJCAI-20, International Joint Conferences on Artificial Intelligence Organization, Special Track on AI in FinTech, Yokohama, Japan, 11–17 July 2020; Bessiere, C., Ed.; pp. 4506–4512. [Google Scholar]
  25. Wu, J.; Yuan, Q.; Lin, D.; You, W.; Chen, W.; Chen, C.; Zheng, Z. Who Are the Phishers? Phishing Scam Detection on Ethereum via Network Embedding. IEEE Trans. Syst. Man Cybern. Syst. 2020, 52, 1156–1166. [Google Scholar] [CrossRef]
  26. Xia, P.; Wang, H.; Luo, X.; Wu, L.; Zhou, Y.; Bai, G.; Xu, G.; Huang, G.; Liu, X. Don’t Fish in Troubled Waters! Characterizing Coronavirus-themed Cryptocurrency Scams. In Proceedings of the 2020 APWG Symposium on Electronic Crime Research (eCrime), Boston, MA, USA, 16–19 November 2020; pp. 1–14. [Google Scholar] [CrossRef]
  27. Yuan, Q.; Huang, B.; Zhang, J.; Wu, J.; Zhang, H.; Zhang, X. Detecting Phishing Scams on Ethereum Based on Transaction Records. In Proceedings of the 2020 IEEE International Symposium on Circuits and Systems (ISCAS), Seville, Spain, 12–14 October 2020; pp. 1–5. [Google Scholar] [CrossRef]
  28. Bartoletti, M.; Carta, S.; Cimoli, T.; Saia, R. Dissecting Ponzi schemes on Ethereum: Identification, analysis, and impact. Future Gener. Comput. Syst. 2020, 102, 259–277. [Google Scholar] [CrossRef]
  29. Chen, W.; Zheng, Z.; Ngai, E.C.H.; Zheng, P.; Zhou, Y. Exploiting Blockchain Data to Detect Smart Ponzi Schemes on Ethereum. IEEE Access 2019, 7, 37575–37586. [Google Scholar] [CrossRef]
  30. Liebau, D.; Schueffel, P. Crypto-Currencies and Icos: Are They Scams? An Empirical Study; Elsevier: Amsterdam, The Netherlands, 2019. [Google Scholar]
  31. Badawi, E.; Jourdan, G.V.; Bochmann, G.; Onut, I.V. An Automatic Detection and Analysis of the Bitcoin Generator Scam. In Proceedings of the 2020 IEEE European Symposium on Security and Privacy Workshops (EuroS PW), Genoa, Italy, 7–11 September 2020; pp. 407–416. [Google Scholar] [CrossRef]
  32. Bian, L.; Zhang, L.; Zhao, K.; Wang, H.; Gong, S. Image-Based Scam Detection Method Using an Attention Capsule Network. IEEE Access 2021, 9, 33654–33665. [Google Scholar] [CrossRef]
  33. Sureshbhai, P.N.; Bhattacharya, P.; Tanwar, S. KaRuNa: A Blockchain-Based Sentiment Analysis Framework for Fraud Cryptocurrency Schemes. In Proceedings of the 2020 IEEE International Conference on Communications Workshops (ICC Workshops), Dublin, Ireland, 7–11 June 2020; pp. 1–6. [Google Scholar] [CrossRef]
  34. Dannen, C. Introducing Ethereum and Solidity; Springer: Berlin, Germany, 2017; Volume 318. [Google Scholar]
  35. Puljiz, M.; Begušic, S.; Kostanjcar, Z. Market microstructure and order book dynamics in cryptocurrency exchanges. In Proceedings of the Crypto Valley Conference on Blockchain Technology, Rotkreuz, Switzerland, 24–26 June 2019. [Google Scholar]
  36. Warren, W.; Bandeali, A. 0x: An Open Protocol for Decentralized Exchange on the Ethereum Blockchain. 2017, pp. 4–18. Available online: https://github.com/0xProject/whitepaper (accessed on 15 February 2022).
  37. Adams, H.; Zinsmeister, N.; Robinson, D. Uniswap v2 Core Whitepaper. Retrieved Oct. 2020, 12, 36. [Google Scholar]
  38. Angeris, G.; Kao, H.T.; Chiang, R.; Noyes, C.; Chitra, T. An analysis of Uniswap markets. arXiv 2019, arXiv:1911.03380. [Google Scholar] [CrossRef]
  39. Aigner, A.A.; Dhaliwal, G. UNISWAP: Impermanent Loss and Risk Profile of a Liquidity Provider. arXiv 2021, arXiv:2106.14404. [Google Scholar] [CrossRef]
  40. Van Vliet, B. An alternative model of Metcalfe’s Law for valuing Bitcoin. Econ. Lett. 2018, 165, 70–72. [Google Scholar] [CrossRef]
  41. Friedman, J. Greedy Function Approximation: A Gradient Boosting Machine. Ann. Stat. 2000, 29, 1189–1232. [Google Scholar] [CrossRef]
  42. Chen, T.; Guestrin, C. XGBoost. In Proceedings of the 22nd ACM SIGKDD International Conference on Knowledge Discovery and Data Mining; ACM: New York, NY, USA, 2016. [Google Scholar] [CrossRef] [Green Version]
  43. Vaswani, A.; Shazeer, N.; Parmar, N.; Uszkoreit, J.; Jones, L.; Gomez, A.N.; Kaiser, L.; Polosukhin, I. Attention Is All You Need. 2017. Available online: http://xxx.lanl.gov/abs/1706.03762 (accessed on 15 February 2022).
  44. Devlin, J.; Chang, M.W.; Lee, K.; Toutanova, K. BERT: Pre-Training of Deep Bidirectional Transformers for Language Understanding. 2019. Available online: http://xxx.lanl.gov/abs/1810.04805 (accessed on 15 February 2022).
  45. Liu, Y.; Ott, M.; Goyal, N.; Du, J.; Joshi, M.; Chen, D.; Levy, O.; Lewis, M.; Zettlemoyer, L.; Stoyanov, V. RoBERTa: A Robustly Optimized BERT Pretraining Approach. 2019. Available online: http://xxx.lanl.gov/abs/1907.11692 (accessed on 15 February 2022).
  46. Dosovitskiy, A.; Beyer, L.; Kolesnikov, A.; Weissenborn, D.; Zhai, X.; Unterthiner, T.; Dehghani, M.; Minderer, M.; Heigold, G.; Gelly, S.; et al. An Image is Worth 16x16 Words: Transformers for Image Recognition at Scale. 2021. Available online: http://xxx.lanl.gov/abs/2010.11929 (accessed on 15 February 2022).
  47. Akiba, T.; Sano, S.; Yanase, T.; Ohta, T.; Koyama, M. Optuna: A next-generation hyperparameter optimization framework. In Proceedings of the 25th ACM SIGKDD International Conference on Knowledge Discovery & Data Mining, Anchorage, AK, USA, 4–8 August 2019; pp. 2623–2631. [Google Scholar]
  48. Lundberg, S.; Lee, S.I. A Unified Approach to Interpreting Model Predictions. 2017. Available online: http://xxx.lanl.gov/abs/1705.07874 (accessed on 15 February 2022).
Figure 1. Ideal Herfindahl–Hirschman curve.
Mathematics 10 00949 g001
Figure 2. Transaction graph of centralized token, with average clustering coefficient 0.
Mathematics 10 00949 g002
Figure 3. Malicious Uniswap maneuver classification.
Mathematics 10 00949 g003
Figure 4. Transaction graph with depth = 10, of scammer addr = 0x775744… (https://etherscan.io/address/0x775744a529f73a754164e4fE740e44C7c5aa5942, accessed on 15 February 2022), where black nodes are addresses directly connected, green nodes are transactions of type rug pull/money laundering, and red nodes are centralized exchanges, such as Binance, Coinbase, and Huobi.
Mathematics 10 00949 g004
Figure 5. Maximum drawdown and recovery of ETH price.
Mathematics 10 00949 g005
Figure 6. This figure shows the price and liquidity time series of two different types of rug pulls. The two first pictures are associated with a simple rug pull with token 0x896a07e3788983ec52eaf0F9C 6F6E031464Ee2CC, while the second pair of pictures is associated with a sell rug pull with token 0x0A7e4D70e10b63FeF9F8dD19FbA3818d15154d2Fa. (a) Liquidity Fast Rug Pull; (b) Price Fast Rug Pull; (c) Liquidity Rug Pull without Burn Events; (d) Price Rug Pull without Burn Events.
Mathematics 10 00949 g006
Figure 7. Pie charts of features activity (a) and maximum drop (b) for the final list of 37,891 tokens.
Mathematics 10 00949 g007
Figure 8. Price and liquidity recovery.
Mathematics 10 00949 g008
Figure 9. Evaluation points in liquidity (a) and price (b) chosen for token 0x896a07e3788983ec 52eaf0F9C6F6E031464Ee2CC labeled as malicious.
Mathematics 10 00949 g009
Figure 10. Impact of the variables in the XGBoost model applied to the first method. Mean of SHAP values on the left and global impact of the features on the right. Images generated from the Python SHAP library.
Mathematics 10 00949 g010
Figure 11. Evolution of recall, precision, and F1 score for the XBGoost and FT-Transformer model in the first 24 h after the creation of the token. (a) XGBoost; (b) FT-Transformer.
Mathematics 10 00949 g011
Table 1. ERC-20 standard signatures.
RequirementsTypeSignature
RequiredMethod totalSupply   ( )
balanceOf   ( address )
transfer   ( address ,   uint 256 )
approve   ( address ,   uint 256 )
allowance   ( address ,   address )
transferFrom   ( address ,   address ,   uint 256 )
Event Transfer   ( address ,   address ,   uint 256 )
Approval   ( address ,   address ,   uint 256 )
OptionalMethod name   ( )
symbol   ( )
decimals   ( )
Table 2. Accuracy, recall, precision and F1 score obtained in a 5-fold cross-validation for first method.
(a) XGBoost metrics.
XGBoostMeanStd
Accuracy0.99360.0029
Recall0.95400.0297
Precision0.98380.0056
F1 score0.96840.0151
(b) FT-Transformer metrics.
FT-TransformerMeanStd
Accuracy0.98900.0036
Recall0.91800.0363
Precision0.97520.0109
F1 score0.94540.0187
Publisher’s Note: MDPI stays neutral with regard to jurisdictional claims in published maps and institutional affiliations.

