Article

Analysis of the Level of Adoption of Business Continuity Practices by Brazilian Industries: An Exploratory Study Using Fuzzy TOPSIS

by
Vitor Amado de Oliveira Bobel
1,
Tiago F. A. C. Sigahi
1,*,
Izabela Simon Rampasso
2,
Gustavo Hermínio Salati Marcondes de Moraes
3,4,
Lucas Veiga Ávila
5,
Walter Leal Filho
6,7 and
Rosley Anholon
1
1
School of Mechanical Engineering, State University of Campinas, Campinas 13083-872, Brazil
2
Departamento de Ingeniería Industrial, Universidad Católica del Norte, Antofagasta 1270755, Chile
3
School of Applied Sciences, State University of Campinas, Limeira 13484-350, Brazil
4
School of Management Sciences, North-West University, Vanderbijlpark 1174, South Africa
5
Center for Social Sciences and Humanities, Federal University of Santa Maria, Santa Maria 97105-900, Brazil
6
Faculty of Life Sciences, Hamburg University of Applied Sciences, 20099 Hamburg, Germany
7
School of Science and the Environment, Manchester Metropolitan University, Manchester M15 6BH, UK
*
Author to whom correspondence should be addressed.
Mathematics 2022, 10(21), 4041; https://doi.org/10.3390/math10214041
Submission received: 26 September 2022 / Revised: 21 October 2022 / Accepted: 26 October 2022 / Published: 31 October 2022
(This article belongs to the Special Issue Advances in Fuzzy Logic and Artificial Neural Networks)

Abstract

:
The COVID-19 outbreak caused several negative effects in industries of all sizes and in all parts of the world, leading academic and practitioners to ask whether organizations could have been better prepared to face disruptive situations. This paper aims to analyze business continuity practices performed by Brazilian industries. A survey was conducted with academics who work in the field of organizational resilience and business continuity and are familiar with the reality of Brazilian companies in the industrial sector. The participants assessed 16 practices (P) proposed by the ISO 22301:2020, considering two categories: large industries (LI) and small and medium-sized industries (SMI). Data analysis was performed using Hierarchical Cluster Analysis, frequency analysis, Fuzzy TOPSIS and sensitivity analysis. For LIs, P4 (leaders conduct periodic critical analyses of practices) was considered the practice with the best application rate, while for SMIs, P2 (understand stakeholders’ needs and expectations, and use information in business continuity management) was chosen. In all scenarios tested for LIs and SMIs, P8 (well-structured systematic processes to analyze the impact of abnormal situations on their business and the potential risks of a disruption) and P16 (periodic audits of their business continuity management activities to identify opportunities for improvement, and information record) are in the bottom quartile. When compared to LIs in the Brazilian context, SMIs exhibit more profound deficiencies in terms of applying business continuity practices. The findings of this study can be of great value to assist managers in improving organizational resilience. Organizations should be better prepared to face future disruptive events, whether biological, social, technological, or economic.

1. Introduction

The COVID-19 pandemic has disrupted not only people’s daily lives, but also the global economic system [1,2], highlighting the need for companies to pay greater attention to business continuity management [3,4,5]; that is, to their capacity “to continue the delivery of products and services within acceptable time frames at predefined capacity during a disruption” [6]. Such macroeconomic impacts have implied that businesses had to adapt to a new reality, dealing with revenue losses, demand fluctuations, lockdowns, organizational changes, and a variety of other restrictive situations and conditions imposed on their activities as a result of the economic losses and health crisis [6,7,8].
Examples of how the COVID-19 pandemic has negatively impacted various economic sectors abound. The aviation sector was one of the most affected with losses in aviation-supported jobs (reduction from 46 million to 41.7 million) and direct aviation jobs (43% reduction), including airlines, airports, manufacturers and air traffic management [9,10,11]. Another sector directly impacted by the pandemic was healthcare, where organizations faced constant challenges due to a lack of qualified professionals, inputs, resources, working conditions, and growing demand [12]. Although these effects have become more visible, many other industries can be mentioned such as manufacturing [13], energy [14], agriculture [15] and food [16], among others.
The pandemic’s effects on businesses had a number of consequences for both large and small industries, entrepreneurs and employees. The study conducted by Gautam [17], for example, revealed that more than 20 million informal sector workers in Bangladesh were unable to carry out their activities due to the implications caused by the pandemic, triggering significant social and economic disruptions in this country. Even in developed countries such as the United States (US), 76.89% of entrepreneurs and business partners claimed that the pandemic had an impact on their business, with 31.93% forced to close temporarily and 4.20% permanently [9]. Large enterprises such as Brooks Brothers and Virgin Atlantic went bankrupt due to COVID-19 [17,18]. It was also noted that family businesses and startups were especially affected by the pandemic [19,20]. Studies conducted with 5800 small businesses in the US showed a reduction of about 40% of jobs, leading thousands of them to drastic cost cutting, additional bank loans or bankruptcy [21,22,23].
Despite the fact that government responses to the pandemic varied by country, causing more severe effects in some regions, Collins et al. [24] asserted that years of organizational optimization in industries were lost, and critical systems involved in the production of goods and services revealed a lack of resilience, redundancy, investments in diversification, and adaptive capacity. This has disrupted supply chains, which are overly interdependent in today’s globalized world [24,25]. Because countries dealt with the pandemic inequitably, the effects and failures in supply chains were felt throughout the crisis; thus, even if a country has achieved positive results in combating COVID-19, shortages of certain goods and services will still be felt if the pandemic continues to affect economic activities in different parts of the world [26,27].
All of these negative effects felt by industries of all sizes and in all parts of the world led academics and practitioners to ask whether organizations could have been better prepared to face disruptive situations by implementing business continuity and resilience concepts and approaches [4,28]. The debate on this topic has gained traction, and studies have revealed that there is still enormous room for improvement and application of business continuity concepts and practices, and that, in general, organizations and managers around the world have neglected them, which could have mitigated the impacts of the pandemic [29,30].
Given the context presented, ISO 22301:2020 [6] is characterized as an important, globally recognized standard that provides security and organizational resilience guidelines, with the goal of establishing a management system that enables business continuity following a disruption. In this exploratory study, ISO 22301:2020 is used as a framework analysis with the purpose of examining the level of adoption of business continuity principles by Brazilian industries. This study is important for the dissemination of knowledge about this important management tool, as well as for the benefit of managers who can improve organizational resilience; organizations that can be better prepared for future disruptive events; and countries whose economic development is highly dependent on the continuity of their businesses.
The remainder of this paper is organized as follows. Section 2 provides the background on security, resilience and business continuity management systems (BCMS) considering the structure of the ISO 22301:2020. In addition, business continuity management is discussed in relation to firm size. Section 3 presents the methods, including the structuring of the survey, Hierarchical Cluster Analysis (HCA), frequency analysis, Fuzzy TOPSIS (Technique for Order Preference by Similarity to Ideal Solution) and sensitivity analysis. Section 4 contains discussions that take into account the results obtained for large, medium and small industries in an integrated manner. Finally, Section 5 presents the conclusions, limitations and suggestions for future studies.

2. Background

2.1. Security and Resilience: BCMS from the Perspective of the ISO 22301:2020

The ISO 22301:2020 standard defines the structure, best practices, and requirements for implementing, maintaining, and improving a BCMS. This management system guides organizations in developing the requirements for supporting in disruption contexts, while also assessing whether the impacts are acceptable or not; in addition, they contribute to reducing the likelihood of negative impacts occurring or making recovery possible when they occur [6].
According to ISO [6], when implementing a BCMS it is important that organizations comprehend the external and internal issues that can contribute to disruptive situations. These issues may differ depending on the organization’s goals, products, services, and the degree and types of risk it is willing to take. As a result, when establishing a BCMS, organizations need to identify the relevant stakeholders and define the requirements to be applied in the interaction with them.
The first requirements described in ISO 22301:2020 for the implementation of a BCMS are legal and regulatory obligations, for which a continuous process to identify them should be put in place, with the goal of ensuring their products and/or services are law-compliant. In addition, when establishing a BCMS, the standard recommends that its scope be defined in accordance with its missions, goals, and obligations, as well as the parts of the organization in which this management system must be applied [6].
ISO 22301:2020 emphasizes that organizations’ top management must demonstrate engagement and leadership in the implementation of the BCMS, establishing policies to ensure commitment to system requirements and providing resources to achieve the defined goals [6]. Thus, when planning the implementation of the BCMS, the organization must identify the risks and opportunities that should be addressed based on its scope of application in order to prevent and reduce unwanted effects and ensure that the intended results are achieved. Furthermore, actions to assess system effectiveness must be defined, including what will be done, what resources will be required, when the actions will be completed, and how the results will be evaluated [6].
According to ISO 22301:2020, it is important that the organization determine what skills, training, and experiences are required for employees to perform the activities associated with business continuity. It is also critical to educate employees on business continuity policies and the BCMS principles [6].
Finally, ISO 22301:2020 recommends that organizations implement and maintain systematic processes for analyzing the impact on business and assessing the risks of disruption to operations. These analyses must be conducted on a regular basis in order to identify and choose business continuity strategies that account for solutions before, during and after a disruption or crisis. Thus, these strategies must comprise one or more actions that meet the requirements to continue, recover and protect the organization’s activities or that reduce the probability and time of disruption, while constantly reassessing the BCMS parameters to achieve continuous improvement [6].

2.2. Business Continuity Management and Firm Size

The COVID-19 pandemic had a wide-ranging impact on businesses of all sizes, sectors and activities. As discussed by Anholon et al. [8], Margherita and Heikkilä [4] and Graham and Loke [31], the lack of structured business continuity management practices and systems at the beginning of this crisis exacerbated these impacts, emphasizing the importance of better preparation in the face of situations characterized by high uncertainty, complexity, and potentially disruptive disruption. Despite the absence of well-established BCMS, organizations were forced to reinvent themselves and consequently apply business continuity management concepts, even if instinctively and remedially, in order to survive the challenges posed by the pandemic [6,32,33].
Kraus et al. [23] investigated how small family businesses in five European countries (Austria, Germany, Italy, Liechtenstein and Switzerland) dealt with the pandemic and what risk mitigation strategies were adopted. As an example, a German appliance manufacturer reduced its own production and working hours to minimum levels in order to deal with logistical problems and low production due to the decrease in the availability of components, thus prioritizing its survival. Another example was an Austrian dairy company, which focused its resources on production to meet the increased demand for cheese during the pandemic, while implementing sanitary measures and reorganizing its production lines, despite potential losses in other product or service markets. These authors conclude that typical characteristics of family business models contributed to the survival of the companies studied, particularly the emphasis on long-term survival over immediate results and shareholder interests [23]. Other studies on small and family businesses support the importance of business continuity and risk mitigation strategies for survival in times of crisis [34,35,36].
Regarding the business continuity strategies used by large and medium-sized industries, authors such as Margherita and Heikkilä [4] and Papadopoulos et al. [33] stated that, in general, they relied on innovation and the use of new technologies, both to establish new forms of work (e.g., home office) and to develop new products and services from the application mainly of artificial intelligence and data science. The application of new technologies by large companies has also extended to the development of new supply chain management strategies [37,38].
Margherita and Heikkilä [4] have structured the business resilience responses and measures of various large and medium-sized industries into five categories: Operations and Value Systems, Customer Experience and Support, Human Resources and Workforce, Leadership and Change Management, and Community and Social Engagement. The main measures in the category of ‘Operations and Value Systems’ were directed at dealing with supply chain and logistics issues, with a focus on improving connectivity and digital integration not only within the company but also with suppliers and key business partners, as well as actions to prioritize essential inputs and restructure the business model. The Customer Experience and Support actions focused on rearranging store and office space, reducing human contact in the purchasing and sales processes, and increasing investment in digital marketing. Measures to make work more flexible, adapt the work environment and implement remote work were included in the category Human Resources and Workforce. Finally, Leadership and Change Management actions focused on creating positive scenarios to maintain customer and stakeholder trust in the organization, whereas Community and Social Engagement actions included campaigns, donations and investments in COVID-19 mitigation [4].
It is important to note that the literature concurs that logistical disruption was one of the most common problems faced by industries worldwide during the pandemic [4,22,32]. The reasons for this, according to Sharma et al. [7], are the high interdependence of supply chains in a globalized world and the low capacity for resilience and organizational flexibility. These authors mentioned Samsung as an example of a company that had diversified its industrial parks in several countries and, as a result, was able to more effectively cope with production interruptions and the differences of each country in the COVID-19 confrontation, adjusting production to the constraints and determinations of each location [7].
Overall, the pandemic has made researchers, managers and businesses all over the world aware of the importance of BCMS. Even when business continuity concepts and practices were used in an unplanned and unstructured manner, and they proved to be critical for survival and recovery during the pandemic. In a context of growing complexity and uncertainty [39], it is certain that new disruptive events will emerge, whether biological, social, technological, or economic [40]. In this sense, regardless of the geographical region, economic sector, or size of the company, advancing knowledge about the structuring and implementation of BCMS is required [7,30,32].

3. Materials and Methods

3.1. Survey Structuring and Research Instrument Development

With the purpose of examining the level of adoption of business continuity principles by Brazilian industries, a survey was conducted with academics who work in the field of organizational resilience and business continuity and are familiar with the reality of Brazilian companies in the industrial sector. It is important to mention that this study was approved by the Research Ethics Committee of the university (CAEE: 50579021.8.0000.5404).
The survey addressed 16 practices related to the BCMS proposed by ISO 56002:2020 (Table 1).
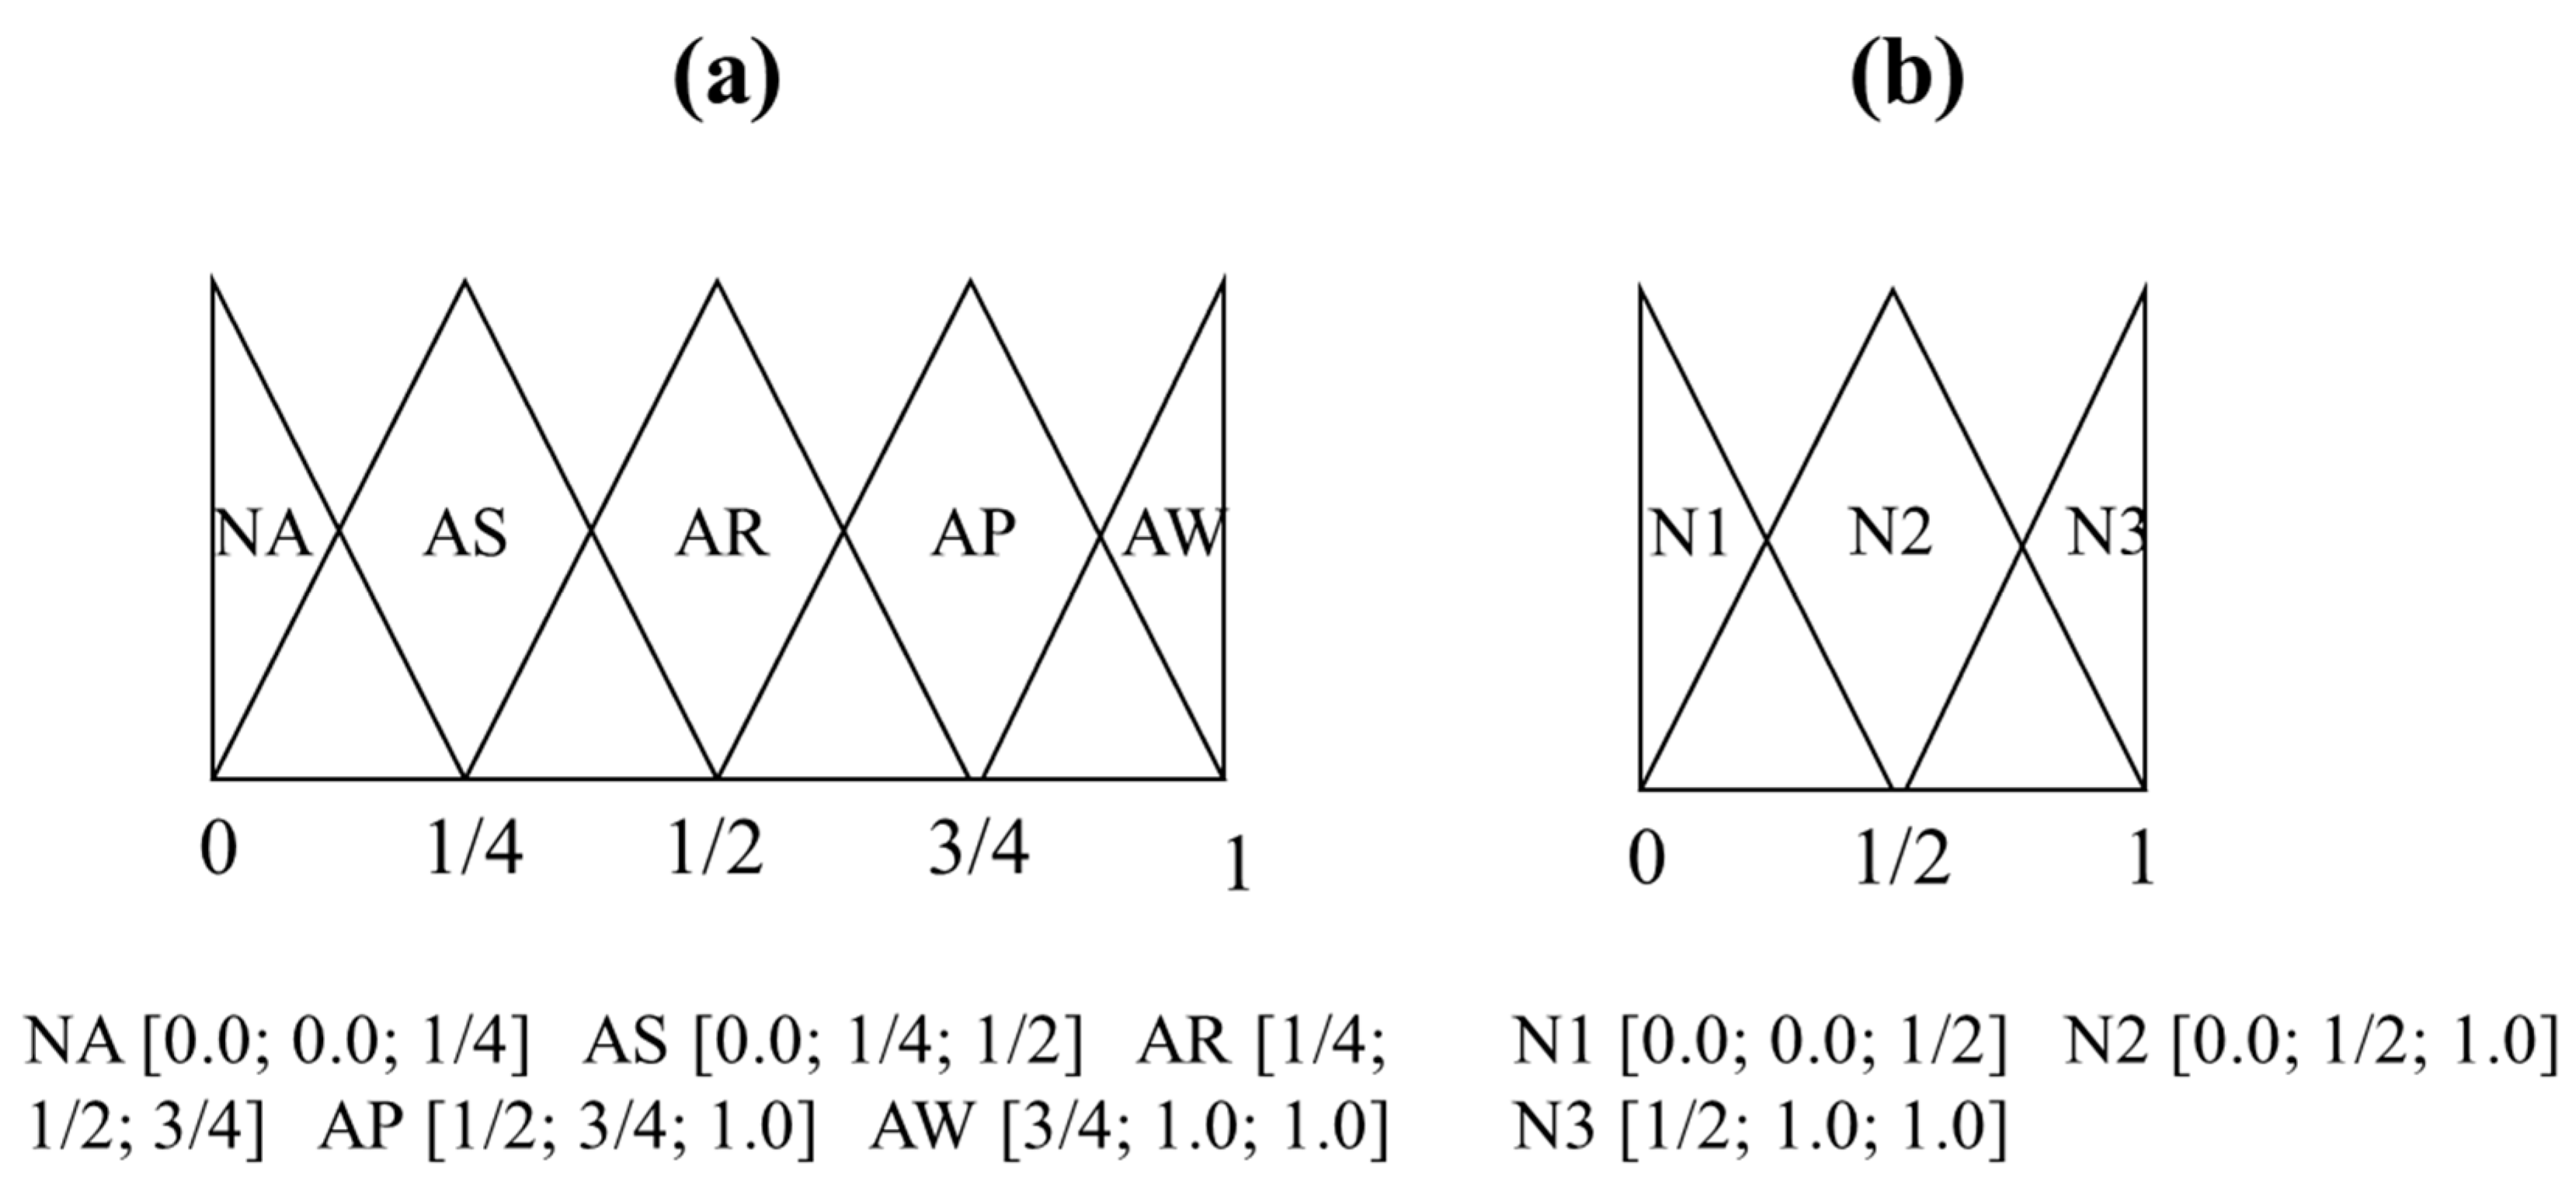
Respondents were asked about the adoption of each practice considering two categories: large industries (LI) and small and medium-sized industries (SMI). Respondents should rate each practice for each category using the following scale: Not applied (NA); Applied superficially (AS); Applied reasonably (AR); Applied properly (AP); or Applied in a well-structured way (AW).
The first section of the survey consisted of questions aiming at characterizing the sample, including the respondent’s research area, whether he/she conducted master/doctoral student supervision activities in the area of organizational resilience and business continuity management, and academic experience in the field. In the second part of the survey, the 16 practices elaborated based on the ISO 22301:2020 were presented, and the respondents assessed their level of adoption by Brazilian LIs and SMIs.
Considering the research purpose, the recommendations of Apostolopoulos and Liargovas [41] were followed for sampling, in which a non-probabilistic and judgmental procedure was adopted to select participants with conceptual and practical knowledge qualified to participate in the research. The respondents were selected based on the analysis of their curriculums registered on the main professional platform for researchers in Brazil, i.e., the Lattes platform, which is validated by the National Council for Scientific and Technological Development. Only those with experience in the field were invited to participate in the survey, based on their professional background.

3.2. Data Analysis

The data analysis was performed using Hierarchical Cluster Analysis (HCA), frequency analysis, Fuzzy TOPSIS (Technique for Order Preference by Similarity to Ideal Solution), and sensitivity analysis.
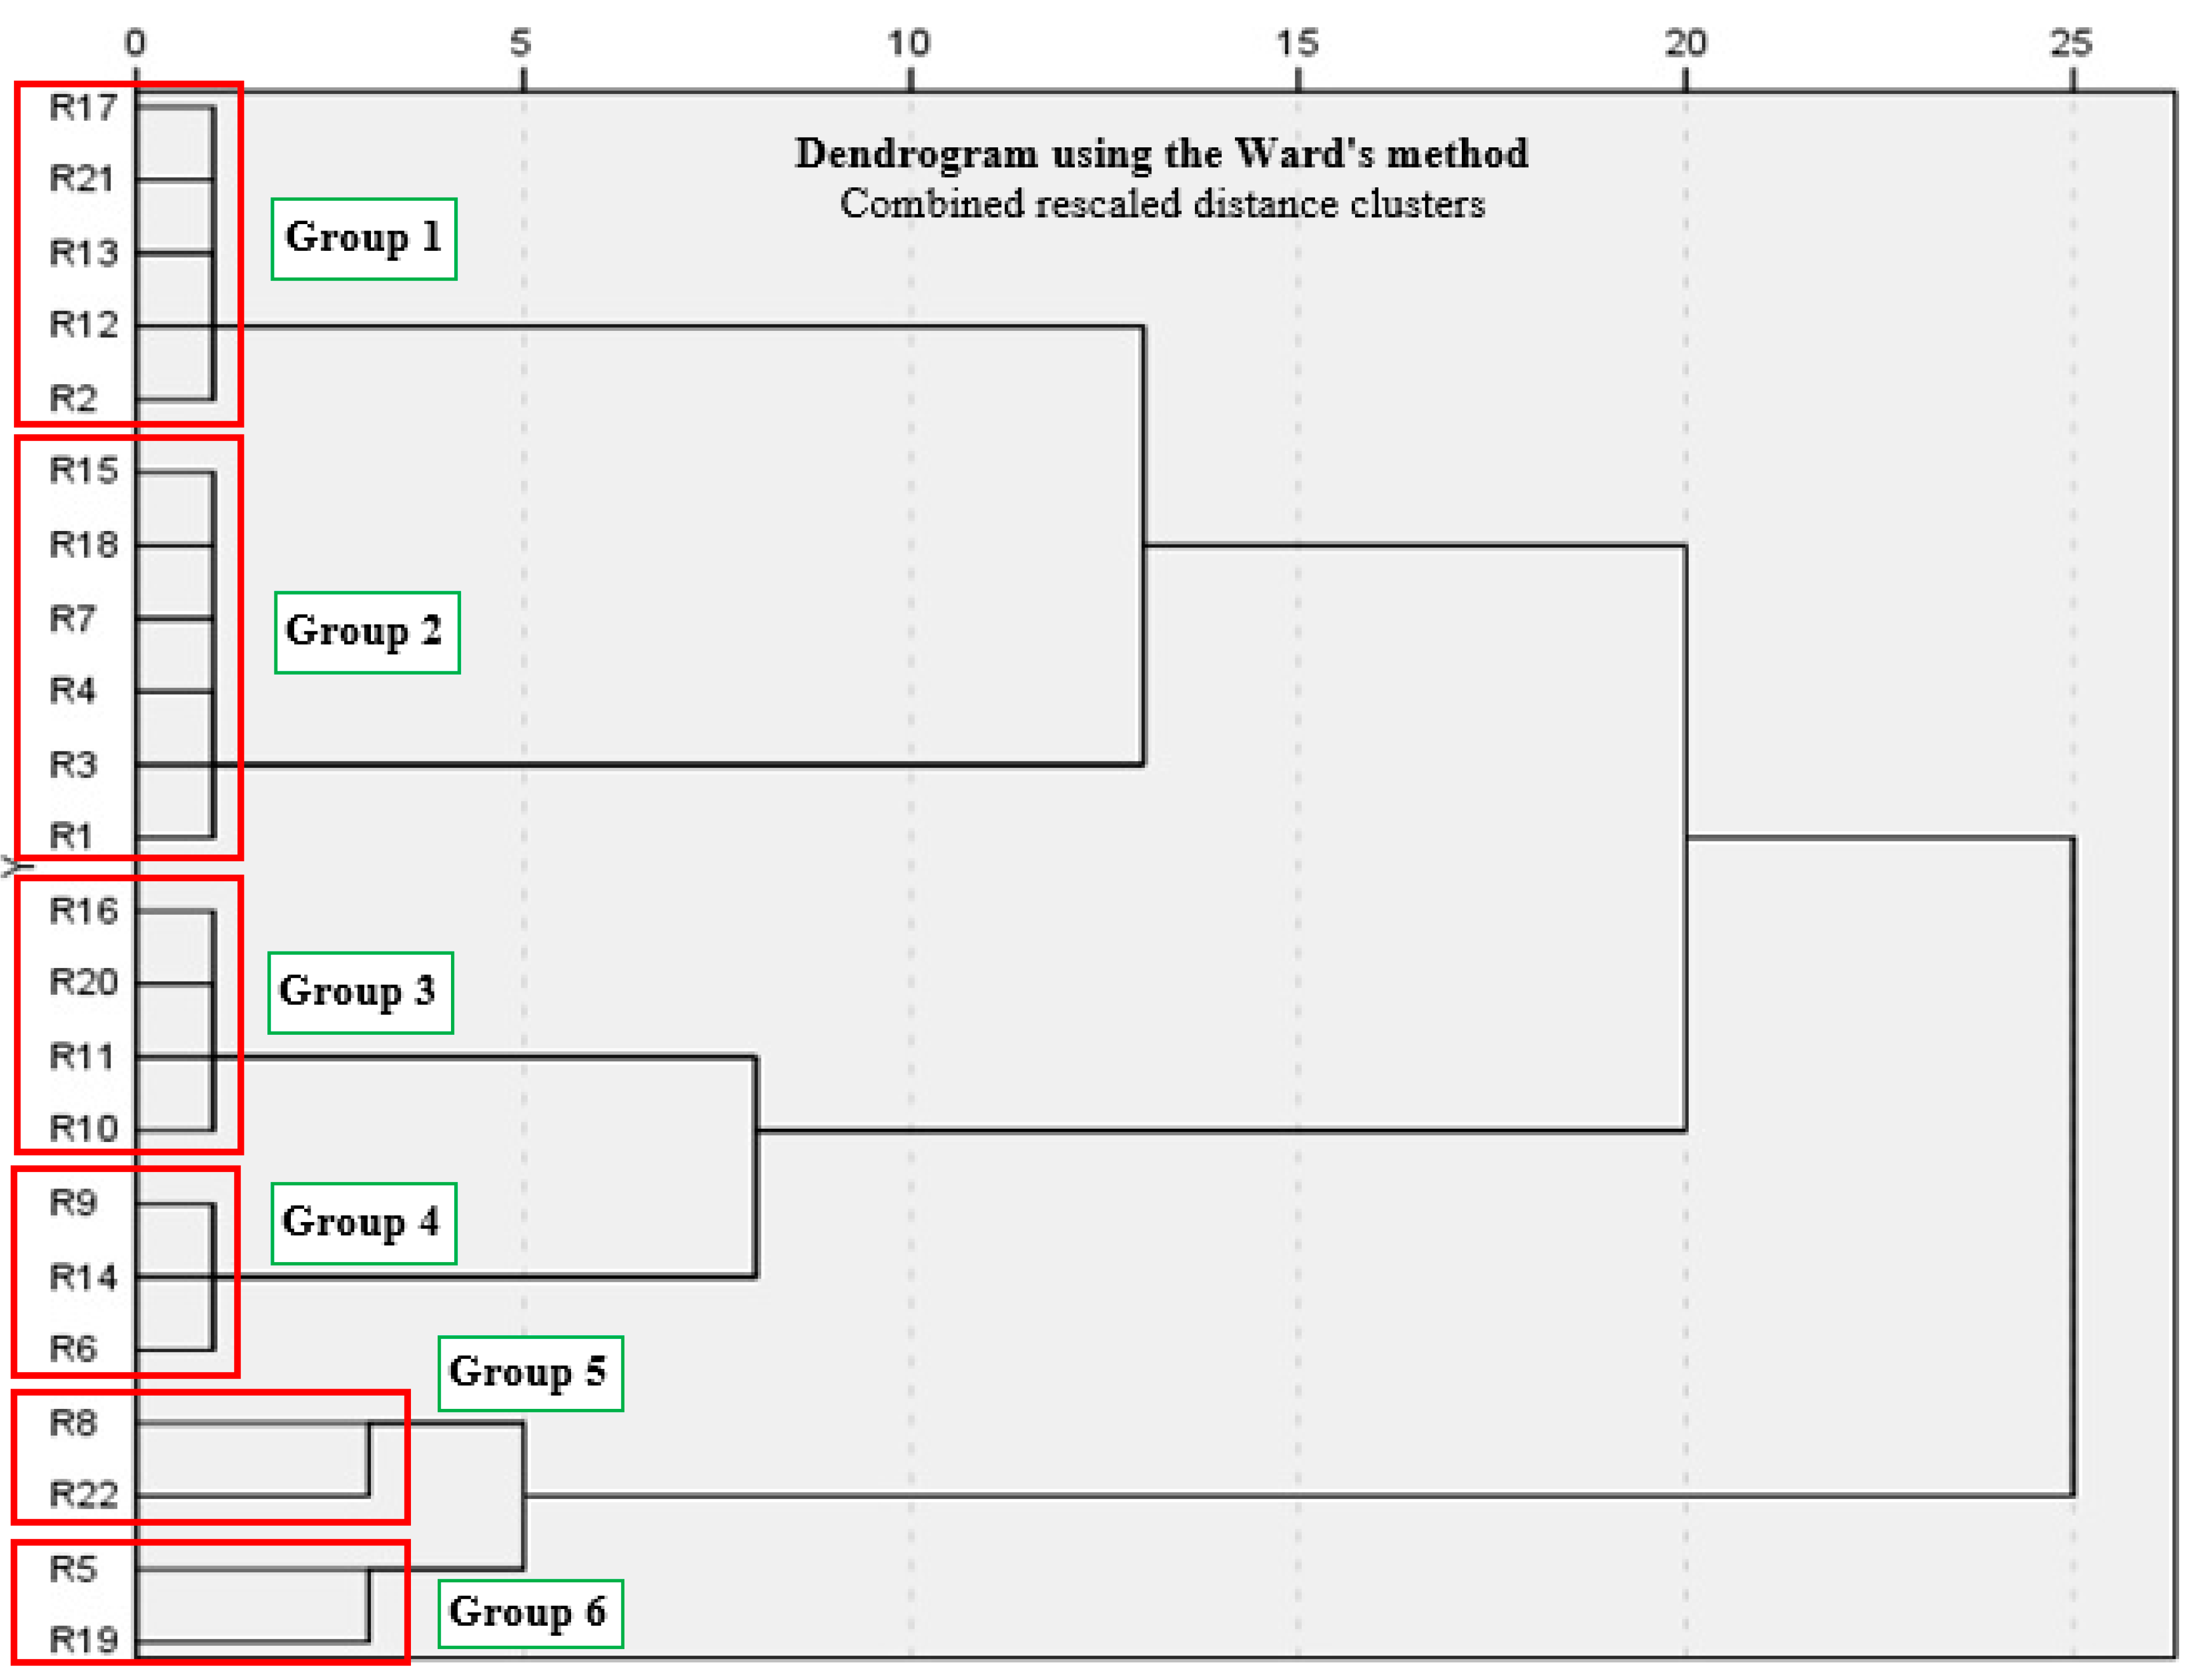
The HCA enabled classifying data into groups that are most similar to each other. According to Nielsen [42], the HCA works by progressively grouping the data in order to obtain a class in which the data can be grouped based on their similarity at each step of the algorithm. A binary tree of clusters or dendrogram is generated as a result of this calculation, with its “root” containing all of the data to be treated and each partition allowing for a new classification, with the option to truncate this process at each new partition iteration. In this study, the HCA was used to ascertain how respondents were classified based on their educational level, experience, and knowledge on organizational resilience and business continuity management. The percentage indicated by respondents for each of the 16 business continuity management practices evaluated in each category (i.e., LI and SMI) was analyzed using frequency analysis.
The Fuzzy TOPSIS application was based on the adapted version proposed by Chen [43], which is a method widely used in a variety of academic researches [44]. The Fuzzy TOPSIS is performed by combining the TOPSIS developed by Hwang and Yoon [45], which was initially used to support multi-criteria decision making [46,47], and fuzzy logic, through which Chen [43] proposed the application of fuzzy numbers for representing linguistic variables. The use of fuzzy logic in conjunction with TOPSIS allowed for the consideration of uncertainties presented in the answers of the respondents and their classification, as well as the generation of a ranking of the analyzed business continuity practices.
In this study, the Fuzzy TOPSIS was used to rank the business continuity practices presented in Table 1 based on expert opinions about the level of adoption in Brazilian LIs and SMIs. According to Chen’s [43] methodological procedures, the practices served as alternatives and the respondents as criteria with weights based on their educational background, professional experience, and subject-matter expertise. As in Chen’s [43] application, this study used the triangular fuzzy numbers. As explained by Pedrycz [48] and Klir and Yuan [49], despite its simplicity, it can be useful in cases where variations in shape have little impact on the analysis.
The fuzzy version of (a) the scales used (Figure 1a) and the levels for grouping respondents (Figure 1b) are shown in Figure 1.
Following Chen [43], based on the fuzzy numbers the responses were organized in a matrix G ˜ (1) containing the scores in their fuzzy triangular form. In the sequence, the vector E ˜ (2) was formed, where w j is the respondent’s level (based on education, experience, and knowledge) in its fuzzy triangular form, representing the fuzzy weights of the respondents.
G ˜ = [ x ˜ 11 x ˜ 1 m x ˜ n 1 x ˜ n m ] ;   x ˜ i j = [ a i j , b i j , c i j ]
E ˜ = [ w ˜ 1   ,   w ˜ 2 , w ˜ n ] ; w ˜ j = [ w 1 , w 2 , w 3 ]
In the next step, the matrix G ˜ was normalized based on the highest score value, obtaining the matrix (3) as follows:
= [ r ˜ i j ] m x n   ;   r ˜ i j = [ a i j C j * , b i j C j * ,   c i j C j * ]   C j * = max ( i ) c i j
The matrix was then weighted by the vector E ˜ , generating the matrix Ʋ (4):
Ʋ = [ v ˜ i j ] m x n i = 1 , 2 ,   ,   m ; j = 1 ,   2   ,   , n v ˜ i j = r ˜ i j   ( . )   w ˜ j
Next, the Positive Ideal Solution (unit vector) (5) and Negative Ideal Solution (null vector) (6) were used to calculate the distances d ( a ˜ ,   b ˜ ) (7) related to each element of the matrix Ʋ using the following equations:
A * = [ v ˜ 1 * ,   v ˜ 2 * , v ˜ 3 * ]   ,   where   v ˜ j * = [ 1 , 1 , 1 ]
A = [ v ˜ 1 ,   v ˜ 2 , v ˜ 3 ]   ,   where   v ˜ j * = [ 0 , 0 , 0 ]
d ( a ˜ ,   b ˜ ) = 1 3 [ ( a 1 b 1 ) 2 + ( a 2 b 2 ) 2 + ( a 3 b 3 ) 2 ]
The total positive ( d i * ) (8) and negative ( d i ) (9) distances in relation to each alternative were obtained through the sum of the partial distances as follows:
d i * = j = 1 n d ( v ˜ i j , v ˜ j * )
d i = j = 1 n d ( v ˜ i j , v ˜ j )
Then, the last step of the method was calculating the proximity coefficient ( C C i ) (10), which allowed the structuring of the ranking of the alternatives (practices).
C C i = d i d i * + d i
Finally, in order to conduct the sensitivity analysis, various scenarios were examined, each one adjusting for the exclusion of a group of respondents as defined by the HCA and evaluating how each one influenced the ordering of the business continuity management practices.

4. Results and Discussion

4.1. Hierarchical Cluster Analysis

The following criteria were used to assess the respondents’ educational level, experience and knowledge; years of experience in the field of innovation; conducting research directly related to innovation management; and teaching, training, and supervision activities for qualified human resources in the field. These criteria were applied to each of the 22 respondents, and the HCA allowed them to be classified into seven groups, as shown in the dendrogram (Figure 2).
The experts were then assigned to levels 1 (Groups 3 and 6), 2 (Groups 2, 4 and 5) and 3 (Group 1) (Table 2). This classification was based on the analysis of experts’ characteristics in each group. The experts were graded as 1 or 2 based on their data about years of experience, research area in which they work and whether or not they supervise master’s and doctorate students. For respondents with up to 15 years of experience, a grade of 1 was assigned, and a grade of 2 was assigned to those with more than 15 years of experience. For those who did not emphasize research directly related to business continuity, a grade of 1 was assigned, and a grade of 2 was assigned to those who did. In terms of graduate student supervision, those who did not perform it received a grade of 1, while those who did received a grade of 2. All of the N3 respondents were graded 2 in all the indicators. N2 respondents were graded 2 in two of the three indicators. N1 respondents presented at least two indicators with a grade of 1.

4.2. Observed Frequency Analysis

For each of the 16 practices evaluated (P1 to P16), which illustrate essential topics of BCMS proposed by the ISO 22301:2020, the frequency of responses was calculated corresponding to the scale options: Not applied (NA); Applied superficially (AS); Applied reasonably (AR); Applied properly (AP); and Applied in a well-structured way (AW). This procedure was performed for the categories of large industries (LI) and small and medium-sized industries (SMI). Following an overview of data frequencies, specific considerations by level (N1, N2, N3) are presented.

4.2.1. Data Analysis for Large Industries (LI)

The global frequency of data referring to LIs is presented in Table 3.
In the scenario of LIs in Brazil, it is worth noting that none of the respondents selected the option Not applied (NA) for 14 out of the 16 practices presented (from P1 to P13, and P15). Furthermore, none of the respondents selected the option Applied superficially (AS) for P1 (analyze internal and external issues that may jeopardize business continuity management results on a regular basis), P2 (understand stakeholders’ needs and expectations, and use information in business continuity management) and P3 (define a clear scope for BCMS), indicating that these three practices are at least reasonably applied in the Brazilian LIs according to the experts’ perceptions.
With the exception of P14 (periodic tests to assess the business continuity strategies and the ability of suppliers and partners to maintain operations and comply with the law during disruptions), it is possible to notice that most of the answers were concentrated in the options ‘Applied reasonably’ (AR) and ‘Applied properly’ (AP). P14 was the worst rated practice at the two lowest adoption levels, i.e., not applied (9.1%) and applied superficially (40.9%).
It is worth noting that P1, P4 (leaders conduct periodic critical analyses of practices) and P11 (define strategies and solutions for business continuity taking into account their reality) reached 50% agreement in the “Applied properly” option. The only cases that showed more than 50% agreement in the responses were P3 and P7 (define the goals associated with the BCMS in a consistent, measurable manner and communicate them to all parties involved), considered properly applied by 59.1% and 54.5% of the participants, respectively.
Finally, P10 (organizations have well-structured documentation control systems to support business continuity management) was the only practice considered to be applied in a well-structured way by at least 20% of the participants.

4.2.2. Data Analysis for Small and Medium-Sized Industries (SMI)

The global frequency of data referring to SMIs is presented in Table 4.
In the scenario of SMIs in Brazil, none of the practices was considered to be applied in a well-structured way. Furthermore, 9 out of the 16 practices presented (P1, P7–10, P13–16) were not evaluated as properly applied by none of the respondents, and only P3 (define a clear scope for BCMS) reached more than 10% in this level of adoption.
It is possible to observe that most of the answers were concentrated in the option Applied superficially (AS), with only three exceptions, that is P10 (organizations have well-structured documentation control systems to support business continuity management), P14 (periodic tests to assess the business continuity strategies and the ability of suppliers and partners to maintain operations and comply with the law during disruptions) and P16 (periodic audits of their business continuity management activities to identify opportunities for improvement, and information record), which presented the highest frequency in the lowest level of adoption (Not applied) with 40.9%, 45.5% and 59.1%, respectively.
The highest levels of agreement were observed for P1 (analyze internal and external issues that may jeopardize business continuity management results on a regular basis), P2 (understand stakeholders’ needs and expectations, and use information in business continuity management) and P7 (define the goals associated with the BCMS in a consistent, measurable manner and communicate them to all parties involved), all on the option Applied superficially (AS), reaching 63.6%, 68.2% and 72.7%, respectively.

4.3. Comparative Ordering Analysis via Fuzzy TOPSIS

Following the procedures proposed by Chen [43] and described in Section 3.2, the proximity coefficients ( C C i ) were calculated and based on them the practices were ordered considering LIs and SMIs. In addition, sensitivity analysis was used to verify the influence of each group of respondents in the ordering of practices.

4.3.1. Data Analysis for Large Industries (LI)

The results of the ordering of practices via Fuzzy TOPSIS and sensitivity analysis for LIs is presented in Table 5. The details for calculating the C C i related to LIs for all groups are presented in Supplementary Materials (from Table S1 to Table S7).
For Brazilian LIs, the first place, that is, the business continuity management practice with the highest level of application in the perception of the specialists, was P3 (define a clear scope for BCMS), while the last place was P14 (periodic tests to assess the business continuity strategies and the ability of suppliers and partners to maintain operations and comply with the law during disruptions).
The sensitivity analysis reveals that P3 and P1 (analyze internal and external issues that may jeopardize business continuity management results on a regular basis) were ranked as first and second, respectively, in all scenarios, demonstrating a robustness in the evaluation of these practices in the scenario of the Brazilian LIs.
It is also worth noting that the last place in the ranking changes in the scenario in which G2 is removed from the calculation, causing P16 (periodic audits of their business continuity management activities to identify opportunities for improvement, and information record) to assume this position.

4.3.2. Data Analysis for Small and Medium-Sized Industries (SMI)

Finally, the results of the ordering of practices via Fuzzy TOPSIS and sensitivity analysis for SMIs is presented in Table 6. The details for calculating the C C i related to SMIs for all groups are presented in Supplementary Materials (from Table S8 to Table S14).
When all groups of respondents are considered in the scenario of Brazilian SMIs, once more P3 stands out, being ranked in first place. The same occurs for P1, which takes second place. In turn, P16 appears last.
The sensitivity analysis reveals that none of the practices maintains the same position in all scenarios, with the only exception being P16, which was ranked last regardless of the group removed in the calculation. Considering the first position, it is worth noting that G2 is the only group that influences the classification of P3, which moves to second place, giving way to P1.

4.4. Considerations on the Level of Expertise of Participants and Industry Categories

In the case of Brazilian LIs, when considering the allocation of the respondents by level based on educational level, experience and knowledge (N1, N2 and N3) generated by the HCA (see Section 4.1), it was observed that respondents allocated in N3 rarely indicated that a business continuity management practice is applied in a well-structured way. For SMIs, it was noted that the vast majority of responses for most of the practices examined were in the lower ranges of the scale for the three levels of respondents.
The consideration of the level of expertise of participants in the comparative ordering analysis via Fuzzy TOPSIS revealed that, for LIs, the main deficiencies are observed in P14, P16 and P8, whereas the more well-established are P3, P1 and P4; and for SMIs, the main deficiencies are observed in P16, P9 e P8, whereas the more well-established are P3, P1 e P2, although they are applied superficially or reasonably. These findings are summarized in Table 7.
In general, the findings suggest that Brazilian industries, regardless of their size, should pay special attention to business continuity practices related to P8 (well-structured systematic processes to analyze the impact of abnormal situations on their business and the potential risks of a disruption) and P16 (periodic audits of their business continuity management activities to identify opportunities for improvement, and information record). When the categories are differentiated, P14 (periodic tests to assess the business continuity strategies and the ability of suppliers and partners to maintain operations and comply with the law during disruptions) inspires greater attention for LIs and P9 (structured risk assessment and intervention processes to help them make decisions concerning business continuity management) for SMIs.
As documented in the literature [4,8,31], the COVID-19 pandemic evidenced that business continuity management practices are necessary for the survival of companies of all sizes worldwide. In this sense, both LIs and SMIs must improve risks analyses (P8) and audit processes (P16). To support them in this process, besides ISO 22301, other standards of ISO can be useful, more specifically, ISO 31000 [50], which establishes guidelines for risk management, and ISO 19011 [51], which provides guidance for companies to audit their management systems. Regarding the deficiencies, ISO 31000 can also be of great value particularly for SMIs (P9). For LIs (P14), in addition to ISO 22301, the literature presents some useful contributions. An example is the study of Sadeghi et al. [52], in which the authors verified the importance of collaboration and rewards to enhance business continuity management practices throughout the supply chain.

5. Conclusions

The aim of this study was to analyze the level of adoption of business continuity practices by Brazilian industries, based on the structure of the ISO 22301:2020 and the opinion of experts on the subject. For LIs, P4 (leaders conduct periodic critical analyses of practices) was considered the practice with the best application rate, while for SMIs, P2 (understand stakeholders’ needs and expectations, and use information in business continuity management) was chosen. In all scenarios tested for LIs and SMIs, P8 (well-structured systematic processes to analyze the impact of abnormal situations on their business and the potential risks of a disruption) and P16 (periodic audits of their business continuity management activities to identify opportunities for improvement, and information record) are in the bottom quartile.
Despite the recent publication of ISO 22301:2020, the recommended business continuity management practices have had some adherence in the reality of Brazilian LIs, while SMIs remain in more deficient situations. In relation to the practical implications of the presented findings, they may be useful for Brazilian managers who want to develop a structured BCMS and/or consolidate existing practices in their organizations. The most deficient practices evidenced in this research should receive greater attention in the development of such management systems. In this regard, it is critical to highlight the systemic impact that improvements in organizational resilience capacity can have, because industry recovery is a critical factor in the economic development of all countries in a post-pandemic world.
Regarding the theoretical contribution of this study, the main novelty of it is the use of the combination of Hierarchical Cluster Analysis, frequency analysis, Fuzzy TOPSIS and sensitivity analysis to analyze the context of business continuity practices performed by Brazilian industries. These methodological procedures can be used by researchers to evaluate other realities and compare them to the results presented here. Furthermore, the findings of this paper indicate the main deficiencies of SMIs and LIs concerning the analyzed practices, and they can be used as the foundation for future studies aimed at developing guidelines for companies to overcome their weaknesses and become more resilient.
The limitations of the study are related to the specific context studied and the methods utilized. Additional research is needed to delve deeper into business continuity management practices in the Brazilian context, using qualitative methods and expanding the sample of consulted experts. Another avenue for research is to investigate other contexts, including both developing and developed countries. The findings of these studies can be compared, which can be particularly valuable to managers, as well as for the resilience of LIs and SMIs.
Finally, it is worth noting that ISO 22301:2020 serves as an important reference for industries seeking to implement organizational resilience and business continuity practices, and researchers can be excellent partners in better preparing organizations for the emergence of new disruptive events of any nature.

Supplementary Materials

The following supporting information can be downloaded at: https://www.mdpi.com/article/10.3390/math10214041/s1, Table S1: Matrix G ˜ containing the scores assigned by respondents in the fuzzy triangular form for LIs; Table S2: Vector E ˜ representing the fuzzy weights of the respondents for LIs; Table S3: Matrix containing the scores assigned by respondents in the fuzzy triangular form normalized based on the highest score value for LIs; Table S4: Matrix Ʋ resulted from matrix weighted by the vector E ˜ for LIs; Table S5: Distance to the Positive Ideal Solution for LIs; Table S6: Distance to the Negative Ideal Solution for LIs; Table S7: Total positive and negative distances and C C i for LIs; Table S8: Matrix G ˜ containing the scores assigned by respondents in the fuzzy triangular form for SMIs; Table S9: Vector E ˜ representing the fuzzy weights of the respondents for SMIs; Table S10: Matrix containing the scores assigned by respondents in the fuzzy triangular form normalized based on the highest score value for SMIs; Table S11: Matrix Ʋ resulted from matrix weighted by the vector E ˜ for SMIs; Table S12: Distance to the Positive Ideal Solution for SMIs; Table S13: Distance to the Negative Ideal Solution for SMIs; Table S14: Total positive and negative distances and C C i for SMIs.

Author Contributions

Conceptualization, V.A.d.O.B. and R.A.; methodology, V.A.d.O.B. and R.A.; validation, V.A.d.O.B. and R.A.; formal analysis, V.A.d.O.B., T.F.A.C.S. and R.A.; investigation, V.A.d.O.B. and R.A.; resources, T.F.A.C.S., G.H.S.M.d.M., L.V.Á., I.S.R., W.L.F. and R.A.; writing—original draft preparation, V.A.d.O.B., T.F.A.C.S. and R.A.; writing—review and editing, T.F.A.C.S., G.H.S.M.d.M., L.V.Á., I.S.R., W.L.F. and R.A.; supervision, R.A.; project administration, R.A. All authors have read and agreed to the published version of the manuscript.

Funding

The authors are grateful for the support of the National Council for Scientific and Technological Development (CNPq/Brazil) under the grants n° 304145/2021-1, nº 303924/2021-7, and PIBIC-CNPq.

Data Availability Statement

Not applicable.

Conflicts of Interest

The authors declare no conflict of interest. The funders had no role in the design of the study; in the collection, analyses, or interpretation of data; in the writing of the manuscript; or in the decision to publish the results.

References

  1. Ibn-Mohammed, T.; Mustapha, K.B.; Godsell, J.; Adamu, Z.; Babatunde, K.A.; Akintade, D.D.; Acquaye, A.; Fujii, H.; Ndiaye, M.M.; Yamoah, F.A.; et al. A critical review of the impacts of COVID-19 on the global economy and ecosystems and opportunities for circular economy strategies. Resour. Conserv. Recycl. 2021, 164, 105169. [Google Scholar] [CrossRef] [PubMed]
  2. Jawad, M.; Maroof, Z.; Naz, M. Impact of pandemic COVID-19 on global economies (a seven-scenario analysis). Manag. Decis. Econ. 2021, 42, 1897–1908. [Google Scholar] [CrossRef] [PubMed]
  3. Chen, J.; Huang, J.; Su, W.; Štreimikienė, D.; Baležentis, T. The challenges of COVID-19 control policies for sustainable development of business: Evidence from service industries. Technol. Soc. 2021, 66, 101643. [Google Scholar] [CrossRef] [PubMed]
  4. Margherita, A.; Heikkilä, M. Business continuity in the COVID-19 emergency: A framework of actions undertaken by world-leading companies. Bus. Horiz. 2021, 64, 683–695. [Google Scholar] [CrossRef] [PubMed]
  5. Schmid, B.; Raju, E.; Jensen, P.K.M. COVID-19 and business continuity-learning from the private sector and humanitarian actors in Kenya. Prog. Disaster Sci. 2021, 11, 100181. [Google Scholar] [CrossRef]
  6. ISO 22313:2020; Security and Resilience—Business Continuity Management Systems—Guidance on the Use of ISO 22301. International Organization for Standardization: Geneva, Switzerland, 2020.
  7. Sharma, P.; Leung, T.Y.; Kingshott, R.P.J.; Davcik, N.S.; Cardinali, S. Managing uncertainty during a global pandemic: An international business perspective. J. Bus. Res. 2020, 116, 188–192. [Google Scholar] [CrossRef]
  8. Anholon, R.; Silva, D.; Souza Pinto, J.; Rampasso, I.S.; Domingos, M.L.C.; Dias, J.H.O. COVID-19 and the administrative concepts neglected: Reflections for leaders to enhance organizational development. Kybernetes 2021, 50, 1654–1660. [Google Scholar] [CrossRef]
  9. Yue, P.; Korkmaz, A.G.; Yin, Z.; Zhou, H. Household-owned Businesses’ Vulnerability to the COVID-19 Pandemic. Emerg. Mark. Financ. Trade 2021, 57, 1662–1674. [Google Scholar] [CrossRef]
  10. International Air Transport Association. Global Outlook for Air Transport; International Air Transport Association: Montreal, QU, Canada, 2022. [Google Scholar]
  11. Air Transport Action Group. Covid-19 Impact on Aviation; Air Transport Action Group: Geneva, Switzerland, 2021. [Google Scholar]
  12. Groenewold, M.R.; Burrer, S.L.; Ahmed, F.; Uzicanin, A.; Free, H.; Luckhaupt, S.E. Increases in Health-Related Workplace Absenteeism Among Workers in Essential Critical Infrastructure Occupations During the COVID-19 Pandemic—United States, March–April 2020. MMWR. Morb. Mortal. Wkly. Rep. 2020, 69, 853–858. [Google Scholar] [CrossRef]
  13. Sahoo, P. Ashwani COVID-19 and Indian Economy: Impact on Growth, Manufacturing, Trade and MSME Sector. Glob. Bus. Rev. 2020, 21, 1159–1183. [Google Scholar] [CrossRef]
  14. Madurai Elavarasan, R.; Shafiullah, G.; Raju, K.; Mudgal, V.; Arif, M.T.; Jamal, T.; Subramanian, S.; Sriraja Balaguru, V.S.; Reddy, K.S.; Subramaniam, U. COVID-19: Impact analysis and recommendations for power sector operation. Appl. Energy 2020, 279, 115739. [Google Scholar] [CrossRef] [PubMed]
  15. Siche, R. What is the impact of COVID-19 disease on agriculture? Sci. Agropecu. 2020, 11, 3–6. [Google Scholar] [CrossRef] [Green Version]
  16. Singh, S.; Kumar, R.; Panchal, R.; Tiwari, M.K. Impact of COVID-19 on logistics systems and disruptions in food supply chain. Int. J. Prod. Res. 2021, 59, 1993–2008. [Google Scholar] [CrossRef]
  17. Gautam, S.; Setu, S.; Khan, M.G.Q.; Khan, M.B. Analysis of the health, economic and environmental impacts of COVID-19: The Bangladesh perspective. Geosyst. Geoenviron. 2022, 1, 100011. [Google Scholar] [CrossRef]
  18. Maheshwari, S.; Friedman, V. Brooks Brothers, Founded in 1818, Files for Bankruptcy. New York Times. 8 September 2020. Available online: https://www.nytimes.com/2020/07/08/business/brooks-brothers-chapter-11-bankruptcy.html (accessed on 25 September 2022).
  19. Rushe, D. Virgin Atlantic Files for Bankruptcy Protection as Covid Continues to Hurt Airlines. The Guard. 4 August 2020. Available online: https://www.theguardian.com/business/2020/aug/04/virgin-atlantic-files-for-bankruptcy-as-covid-continues-to-hurt-airlines (accessed on 25 September 2022).
  20. Kuckertz, A.; Brändle, L.; Gaudig, A.; Hinderer, S.; Morales Reyes, C.A.; Prochotta, A.; Steinbrink, K.M.; Berger, E.S.C. Startups in times of crisis–A rapid response to the COVID-19 pandemic. J. Bus. Ventur. Insights 2020, 13, e00169. [Google Scholar] [CrossRef]
  21. Belitski, M.; Guenther, C.; Kritikos, A.S.; Thurik, R. Economic effects of the COVID-19 pandemic on entrepreneurship and small businesses. Small Bus. Econ. 2022, 58, 593–609. [Google Scholar] [CrossRef]
  22. Bartik, A.W.; Bertrand, M.; Cullen, Z.; Glaeser, E.L.; Luca, M.; Stanton, C. The impact of COVID-19 on small business outcomes and expectations. Proc. Natl. Acad. Sci. USA 2020, 117, 17656–17666. [Google Scholar] [CrossRef]
  23. Kraus, S.; Clauss, T.; Breier, M.; Gast, J.; Zardini, A.; Tiberius, V. The economics of COVID-19: Initial empirical evidence on how family firms in five European countries cope with the corona crisis. Int. J. Entrep. Behav. Res. 2020, 26, 1067–1092. [Google Scholar] [CrossRef]
  24. Collins, A.; Florin, M.-V.; Renn, O. COVID-19 risk governance: Drivers, responses and lessons to be learned. J. Risk Res. 2020, 23, 1073–1082. [Google Scholar] [CrossRef]
  25. Ivanov, D. Predicting the impacts of epidemic outbreaks on global supply chains: A simulation-based analysis on the coronavirus outbreak (COVID-19/SARS-CoV-2) case. Transp. Res. Part E Logist. Transp. Rev. 2020, 136, 101922. [Google Scholar] [CrossRef]
  26. Ivanov, D.; Dolgui, A. Viability of intertwined supply networks: Extending the supply chain resilience angles towards survivability. A position paper motivated by COVID-19 outbreak. Int. J. Prod. Res. 2020, 58, 2904–2915. [Google Scholar] [CrossRef] [Green Version]
  27. Vo, T.A.; Mazur, M.; Thai, A. The impact of COVID-19 economic crisis on the speed of adjustment toward target leverage ratio: An international analysis. Financ. Res. Lett. 2022, 45, 102157. [Google Scholar] [CrossRef] [PubMed]
  28. Gebhardt, M.; Spieske, A.; Kopyto, M.; Birkel, H. Increasing global supply chains’ resilience after the COVID-19 pandemic: Empirical results from a Delphi study. J. Bus. Res. 2022, 150, 59–72. [Google Scholar] [CrossRef]
  29. Hadjielias, E.; Christofi, M.; Tarba, S. Contextualizing small business resilience during the COVID-19 pandemic: Evidence from small business owner-managers. Small Bus. Econ. 2022. [Google Scholar] [CrossRef]
  30. Beninger, S.; Francis, J.N.P. Resources for business resilience in a COVID-19 world: A community-centric approach. Bus. Horiz. 2022, 65, 227–238. [Google Scholar] [CrossRef]
  31. Graham, J.; Loke, H. Theory rewritten: Business Continuity and Crisis Management in the wake of the Covid-19 pandemic. J. Contingencies Cris. Manag. 2022, 30, 231–233. [Google Scholar] [CrossRef]
  32. Han, H.; Qian, Y. Did Enterprises’ Innovation Ability Increase During the COVID-19 Pandemic? Evidence From Chinese Listed Companies. Asian Econ. Lett. 2020, 1, 18072. [Google Scholar] [CrossRef]
  33. Papadopoulos, T.; Baltas, K.N.; Balta, M.E. The use of digital technologies by small and medium enterprises during COVID-19: Implications for theory and practice. Int. J. Inf. Manag. 2020, 55, 102192. [Google Scholar] [CrossRef]
  34. Suder, M.; Kusa, R.; Duda, J.; Dunska, M. How small printing firms alleviate impact of pandemic crisis? Identifying configurations of successful strategies with fuzzy-set qualitative comparative analysis. Entrep. Bus. Econ. Rev. 2022, 10, 61–80. [Google Scholar] [CrossRef]
  35. Nguyen, V.K.; Pyke, J.; Gamage, A.; de Lacy, T.; Lindsay-Smith, G. Factors influencing business recovery from compound disasters: Evidence from Australian micro and small tourism businesses. J. Hosp. Tour. Manag. 2022, 53, 1–9. [Google Scholar] [CrossRef]
  36. Santos, E.; Tavares, V.; Tavares, F.O.; Ratten, V. How is risk different in family and non-family businesses?–A comparative statistical analysis during the COVID-19 pandemic. J. Fam. Bus. Manag. 2021. [Google Scholar] [CrossRef]
  37. Bag, S.; Dhamija, P.; Luthra, S.; Huisingh, D. How big data analytics can help manufacturing companies strengthen supply chain resilience in the context of the COVID-19 pandemic. Int. J. Logist. Manag. 2021. [Google Scholar] [CrossRef]
  38. Nisar, Q.A.; Haider, S.; Ameer, I.; Hussain, M.S.; Gill, S.S.; Usama, A. Sustainable supply chain management performance in post COVID-19 era in an emerging economy: A big data perspective. Int. J. Emerg. Mark. 2022. [Google Scholar] [CrossRef]
  39. Taskan, B.; Junça-Silva, A.; Caetano, A. Clarifying the conceptual map of VUCA: A systematic review. Int. J. Organ. Anal. 2022. [Google Scholar] [CrossRef]
  40. Donthu, N.; Gustafsson, A. Effects of COVID-19 on business and research. J. Bus. Res. 2020, 117, 284–289. [Google Scholar] [CrossRef] [PubMed]
  41. Apostolopoulos, N.; Liargovas, P. Regional parameters and solar energy enterprises. Int. J. Energy Sect. Manag. 2016, 10, 19–37. [Google Scholar] [CrossRef]
  42. Nielsen, F. Hierarchical Clustering. In Introduction to HPC with MPI for Data Science; Nielsen, F., Ed.; Springer: New York, NY, USA, 2016; pp. 195–211. [Google Scholar]
  43. Chen, C.-T. Extensions of the TOPSIS for group decision-making under fuzzy environment. Fuzzy Sets Syst. 2000, 114, 1–9. [Google Scholar] [CrossRef]
  44. Lima Junior, F.R.; Carpinetti, L.C.R. A comparison between TOPSIS and Fuzzy-TOPSIS methods to support multicriteria decision making for supplier selection. Gest. Prod. 2015, 22, 17–34. [Google Scholar] [CrossRef] [Green Version]
  45. Hwang, C.-L.; Yoon, K. Multiple Attribute Decision Making; Lecture Notes in Economics and Mathematical Systems; Springer: Berlin/Heidelberg, Germany, 1981; Volume 186, ISBN 978-3-540-10558-9. [Google Scholar]
  46. Akram, M.; Shumaiza; Arshad, M. Bipolar fuzzy TOPSIS and bipolar fuzzy ELECTRE-I methods to diagnosis. Comput. Appl. Math. 2020, 39, 1–21. [Google Scholar] [CrossRef]
  47. Tominaga, L.K.D.G.; Martins, V.W.B.; Rampasso, I.S.; Anholon, R.; Silva, D.; Pinto, J.S.; Leal Filho, W.; Lima Junior, F.R. Critical analysis of engineering education focused on sustainability in supply chain management: An overview of Brazilian higher education institutions. Int. J. Sustain. High. Educ. 2021, 22, 380–403. [Google Scholar] [CrossRef]
  48. Pedrycz, W. Why triangular membership functions? Fuzzy Sets Syst. 1994, 64, 21–30. [Google Scholar] [CrossRef]
  49. Klir, G.J.; Yuan, B. Fuzzy Sets and Fuzzy Logic: Theory and Applications; Prentice Hall: Upper Saddle River, NJ, USA, 1995. [Google Scholar]
  50. ISO. ISO 31000-Gestão de Riscos-Diretrizes (Risks Management-Guidelines); ABNT: Rio de Janeiro, Brazil, 2018. [Google Scholar]
  51. ISO NBR ISO 19011; Diretrizes Para Auditoria de Sistemas de Gestão [Management Systems Audit Guidelines]. ISO: Geneva, Switzerland, 2018.
  52. Sadeghi R., J.K.; Azadegan, A.; Ojha, D.; Ogden, J.A. Benefiting from supplier business continuity: The role of supplier monitoring and buyer power. Ind. Mark. Manag. 2022, 106, 432–443. [Google Scholar] [CrossRef]
Figure 1. (a) Fuzzy values of the evaluation scale of practices; (b) Fuzzy values of the levels for allocation of respondents based on education, experience, and knowledge.
Mathematics 10 04041 g001
Figure 2. Dendrogram from the Hierarchical Cluster Analysis.
Mathematics 10 04041 g002
Table 1. The business continuity management practices that comprised the survey.
CodeDescription
P1Organizations analyze internal and external issues that may jeopardize business continuity management results on a regular basis
P2Organizations seek to understand stakeholders’ needs and expectations, and then use that information in activities and decisions related to business continuity management
P3Organizations define the clear scope related to the activities to be performed within the business continuity management
P4Organizations’ top management conduct periodic critical analyses in relation to activities associated with business continuity management and ensure the necessary resources so that they occur in the best possible way
P5Organizations define the roles and responsibilities associated with business continuity management correctly and ensure that employees understand them
P6Organizations have employees qualified to work on business continuity management activities; to that end, they must strive to develop such competencies through education, training, and/or experience
P7Organizations define the goals associated with business continuity management in a consistent, measurable manner and communicate them to all parties involved; they also develop strategies for achieving those goals, including what will be done, what resources will be needed, who will be involved, how long the plan will be, and how the results will be analyzed
P8Organizations have well-structured systematic processes in place to analyze the impact of abnormal situations on their business and the potential risks of a disruption, including a pre-defined maximum period during which non-resumption of activities will become unacceptable and the minimum capacity required for recovery
P9Organizations have structured risk assessment and intervention processes in place to help them make decisions concerning business continuity management
P10Organizations have well-structured documentation control systems to support business continuity management
P11Organizations define strategies and solutions for business continuity in a way that is appropriate to their reality, taking into account size and financial capacity, protecting priority activities, reducing the likelihood of disruption, and ensuring the provision of necessary resources in disruptive situations
P12Concerning operational plans to manage the organization during disruption, organizations define the purpose, scope, objectives, roles and responsibilities of employees, as well as the operation and coordination of each team, allowing for a structured and well-defined response during disruption
P13Organizations have structured plans to assess the appropriate moment for the resumption of their operations
P14Organizations conduct periodic tests to assess efficiency and validate their business continuity strategies and solutions, reflecting on existing improvement opportunities; they also assess the ability of suppliers and partners to maintain operations during disruptions, as well as compliance with legal and regulatory requirements and industry best practices
P15Organizations are clear about how they measure business continuity management performance, taking into account key factors such as relevant indicators, monitoring frequency and responsible employees
P16Organizations conduct periodic audits of their business continuity management activities to identify opportunities for improvement; they also record information in any format so that it can assist decision making and be used as a lesson learned in the future
Source: Elaborated by the authors based on ISO 22301:2020 [6].
Table 2. Allocation of the respondents based on educational level, experience and knowledge.
LevelRespondents
N1R5, R10, R11, R16, R19 and R20
N2R1, R3, R4, R6, R7, R8, R9, R14, R15, R18 and R22
N3R2, R12, R13, R17 and R21
Table 3. Global frequency on the application of each practice in LIs.
PracticesLevel of Application *
NAASARAPAW
P10.0000.0000.3180.5000.182
P20.0000.0000.4090.4550.136
P30.0000.0000.2270.5910.182
P40.0000.0450.3180.5000.136
P50.0000.0910.4090.4090.091
P60.0000.1360.4090.3180.136
P70.0000.0910.3180.5450.045
P80.0000.2270.4550.2730.045
P90.0000.1360.4550.3640.045
P100.0000.1360.4090.2270.227
P110.0000.1360.2270.5000.136
P120.0000.1360.4090.3180.136
P130.0000.1820.4550.3180.045
P140.0910.4090.1820.2730.045
P150.0000.2730.3180.3640.045
P160.0450.2730.2730.2730.136
* Source: Not applied (NA); Applied superficially (AS); Applied reasonably (AR); Applied properly (AP); Applied in a well-structured way (AW).
Table 4. Global frequency on the application of each practice in SMIs.
PracticesLevel of Application *
NAASARAPAW
P10.0450.6360.3180.0000.000
P20.0450.6820.2270.0450.000
P30.0910.4550.3180.1360.000
P40.1820.5450.2270.0450.000
P50.1820.5910.1360.0910.000
P60.2730.4090.2730.0450.000
P70.0910.7270.1820.0000.000
P80.3640.5450.0910.0000.000
P90.4090.4090.1820.0000.000
P100.4090.3640.2270.0000.000
P110.2270.4090.3180.0450.000
P120.1820.5450.2270.0450.000
P130.2730.4550.2730.0000.000
P140.4550.4090.1360.0000.000
P150.3180.5000.1820.0000.000
P160.5910.2730.1360.0000.000
* Source: Not applied (NA); Applied superficially (AS); Applied reasonably (AR); Applied properly (AP); Applied in a well-structured way (AW).
Table 5. The ordering of practices via Fuzzy TOPSIS and sensitivity analysis for LIs.
Practices C C i All GroupsGroup Excluded for Sensitivity Analysis
G1G2G3G4G5G6
P10.43652nd2nd2nd2nd2nd2nd2nd
P20.42284th3rd5th3rd4th3rd4th
P30.44531st1st1st1st1st1st1st
P40.42403rd5th3rd4th3rd4th3rd
P50.40097th9th6th7th7th7th7th
P60.379610th6th14th12th9th11th10th
P70.41455th10th4th5th5th5th5th
P80.362614th13th13th15th15th15th14th
P90.377311th8th12th11th12th14th11th
P100.39149th11th9th8th8th8th9th
P110.40876th4th7th6th6th6th6th
P120.39208th7th8th9th10th9th8th
P130.371213th12th11th13th14th13th13th
P140.335116th16th15th16th16th16th16th
P150.374912th15th10th10th11th10th12th
P160.362415th14th16th14th13th12th15th
Table 6. The ordering of practices via Fuzzy TOPSIS and sensitivity analysis for SMIs.
Practices C C i All GroupsGroup Excluded for Sensitivity Analysis
G1G2G3G4G5G6
P10.36602nd2nd 1st2nd3rd3rd2nd
P20.36323rd3rd3rd3rd2nd2nd3rd
P30.37561st1st2nd1st1st1st1st
P40.33716th7th5th7th4th5th6th
P50.34054th4th6th5th5th8th4th
P60.32969th10th7th9th7th9th7th
P70.33647th8th4th6th9th6th8th
P80.284214th12th13th14th15th14th14th
P90.276215th14th14th15th14th15th15th
P100.292212th13th11th12th13th12th12th
P110.33248th6th9th8th6th7th9th
P120.33935th5th8th4th8th4th5th
P130.322310th9th10th10th10th10th10th
P140.284513th15th15th13th12th13th13th
P150.304211th11th12th11th11th11th11th
P160.248116th16th16th16th16th16th16th
Table 7. Most deficient and well-established practices comparatively defined for LIs and SMIs.
CategoriesBusiness Continuity Practices
Most DeficientMost Well-Established
LIP14P4
SMIP9P2
BothP8 and P16P3 and P1
Publisher’s Note: MDPI stays neutral with regard to jurisdictional claims in published maps and institutional affiliations.

