Article

Community Evolution Prediction Based on Multivariate Feature Sets and Potential Structural Features

1
College of Electronic and Information Engineering, Guangdong Ocean University, Zhanjiang 524088, China
2
College of Information Science and Engineering, Yanshan University, Qinhuangdao 066004, China
3
International Hotel Management, City University of Macau, Macau 999078, China
4
College of Computer and Information Technology, Northeast Petroleum University, Qinhuangdao 066004, China
*
Authors to whom correspondence should be addressed.
Mathematics 2022, 10(20), 3802; https://doi.org/10.3390/math10203802
Submission received: 11 August 2022 / Revised: 24 September 2022 / Accepted: 11 October 2022 / Published: 15 October 2022
(This article belongs to the Special Issue Engineering Calculation and Data Modeling)

Abstract

:
The current study on community evolution prediction ignores the problem of internal community topology characteristics and does not take feature sets extraction into account. Therefore, the MF-PSF (Multivariate Feature sets and Potential Structural Features) method based on multivariate feature sets and potential structural features for community evolution prediction is proposed in this paper. Firstly, the multivariate feature sets are built from four aspects: community core node features, community structural features, community sequential features and community behavior features. Secondly, the community’s potential structural characteristics based on DeepWalk and spectral propagation theories are extracted, and the overall community’s internal structural characteristics and vertex distribution are analyzed. Finally, the community’s multivariate structural features and potential structural features are merged to predict community evolution events, and the importance of each feature in the process of evolutionary prediction is discussed. The experimental results show that compared with other community evolution prediction methods, the MF-PSF prediction method not only provides a foundation for analyzing the influence of various feature sets on predicted events, but it also effectively improves the accuracy of evolution prediction.

1. Introduction

Community evolution prediction has become a hot topic in dynamic social network analysis. Because objects in complex networks and their connections change over time, it is of great significance to study community evolution. The accurate prediction of community evolution has a wide range of applications. In public health networks, the dynamic tracking of infected communities can be used to discover the structural characteristics of communities producing clusters of epidemics and prevent the spread of diseases. In the process of spreading rumors in social networks, we can analyze the community topic content of existing rumors and their spreading rules and predict the spreading trend and public opinion center nodes of rumors, which control the spreading scope of rumors and reduce the negative impact in a timely manner.
At present, most of the research in community evolution prediction describes and tracks the process of community evolution through the framework of community evolution and the extraction of community features to build models and predict community evolution. Although these methods have achieved good research results, there are still shortcomings in the extraction of a community’s structural features:
(1)
There is a lack of extraction of multidimensional community-evolution-related features when constructing feature sets;
(2)
The internal topological structure of the community is ignored, and the local clustering characteristics and overall structural characteristics of the vertex distribution in the community are not fully considered, thus affecting the accuracy of community evolution prediction.
To solve the above problems, the relevant features of community evolution from different dimensions is extracted, and a community evolution prediction method MF-PSF based on multivariate feature sets and potential structural features is proposed. This method integrates multivariate feature sets and potential structural features to predict community evolution and effectively improve the accuracy of community evolution prediction. The main contributions of this paper are as follows:
(1)
The multivariate feature sets of community evolution is constructed, and the relevant features of community evolution are extracted from four aspects of the community core node, community structure, community sequence and community behavior.
(2)
Graph embedding encoding containing potential structural features of the community is obtained using DeepWalk and spectral propagation, and community evolution is predicted by combining the multivariate feature sets and potential structural features based on the idea of network representation learning.
(3)
The importance of each feature in the process of evolutionary prediction is analyzed on different data sets, and the community evolutionary prediction method MF-PSF effectively improves the accuracy of community evolution prediction.
This paper is organized as follows: In Section 2, the research works related to community evolution prediction are discussed. In Section 3, the process of constructing multivariate feature sets is explained. In Section 4, the process of extracting potential structural features of communities and the merging of potential structural features with multivariate feature sets are discussed. In Section 5, experiments are implemented based on the extracted features, and the importance of each feature in prediction is analyzed. Finally, the full paper is summarized, and future work is discussed.

2. Related Work

The evolution framework is used to describe and track community changes, and the evolution events are predicted by extracting community features. Brodka et al. [1] used the GED algorithm to identify and predict community evolution events. Gliwa et al. [2] adopted two GED and SGCI community evolution event detection algorithms and extracted a variety of community features to construct feature sets, including community leadership, density, community cohesion and community size, which improved the accuracy of community evolution prediction. Dakiche et al. [3] predicted the survival time of communities and analyzed the relationship between extracted features and the survival time of communities. Kairam et al. [4] extracted structural features and sequential features of communities and analyzed the importance of features extracted from groups of different sizes in predicting community life. Ilhan et al. [5] improved the process of evolutionary prediction through feature selection and cross validation and used evolutionary chains of different lengths for prediction. Takaffoli et al. [6] improved on the basis of the MODEC evolution model and added evolutionary events representing changes in community cohesion into the evolution type. Pavlopoulou et al. [7] extracted relatively complete community structural features and community sequential features to predict community dissolving, continuing, shrinking and growing events. He et al. [8] proposed a community evolution prediction method based on the construction of multiple feature sets, which extracted community features from the structure, time sequence and behavior of the community to construct the feature set, and adopted the multi-length evolution chain method to learn and train the evolution features. Shahriari et al. [9] extracted multi-community information such as key node information and community structural features to construct community feature sets and analyzed the importance of each feature in community evolution prediction. Junyi et al. [10] used the method based on Markov chains for the single-step prediction of community evolution and studied the multi-step prediction of community evolution based on the classification chain method. Hong et al. [11] proposed a fast incremental community evolution tracking framework (FIET) to discover communities and track community evolution in slow and highly evolving networks.
Scholars have also built various models to track and predict evolution. Ilhan et al. [12] proposed the community evolution prediction model based on the ARIMA model, which can predict the changes in the eigenvalues of the communities over time and used the predicted eigenvalues to identify the evolutionary events. Li et al. [13] proposed a dynamic community detection algorithm based on node persistence, and analyzed the community ownership of some nodes. Khafaei et al. [14] proposed an EPDSN model to predict different events occurring in dynamic communities. By introducing new definitions of survival and decomposition events and comprehensively using seven features for prediction in the model, the computational cost was reduced. Etienne et al. [15] proposed an analysis method based on a sliding window, which simulated the evolution of community structure by using an autoregression model and predicted the possible changes in a community by using survival analysis technology. Appel et al. [16] proposed a shared decomposition model called Chimera, extracted the potential semantic structure of the network through multidimensional forms and effectively predicted the evolution of the future community. Wu et al. [17] proposed a framework for tracking, modeling and predicting the dynamic network structure; used the spectrum theory to track the potential feature vectors of the network; and predicted the future network structure by learning the parameters. Pan et al. [18] proposed the method of graph representation learning to carry out graph embedding encoding on the network and adopted attention mechanism for feature fusion and training. Kadkhoda et al. [19] proposed the AFIF algorithm to automatically find the effective features of each community in the evolutionary process for prediction and used the ICEM [20] algorithm to track the community evolutionary chain. Guidi et al. [21] proposed a distributed protocol, SONIC-MAN, for detecting communities in dynamic social networks; SONIC-MAN is based on a Temporal Trade-off approach and discovers communities in the ego-network of the users. Revelle et al. [22] proposed a GNAN model based on a graph neural network, which used the attention mechanism to learn the feature representation of nodes and their neighbors in the community and predicted the community evolution from two aspects of community structure and sequence.

3. The Construction of Multivariate Feature Sets

In order to describe the characteristics of community evolution completely, the multivariate feature sets is constructed from the features of core nodes, community structure, community sequence and community behavior. The main feature of the core node is to extract core and influential nodes in the community. Community structural features are extracted from various structural indicators, which can reflect part of a community’s structural features. The community sequence features represent the changes that occur in the community itself as the previous community evolves into the current community. The behavior features of a community are the evolutionary events that took place in the previous time window.

3.1. Core Node Features

The community evolution is analyzed by obtaining the features of core nodes as part of the multi-feature sets, and the features and descriptions of the core nodes extracted are listed in Table 1 in this paper.

3.2. Community Structural Features

In order to quantify the structural characteristics of the community, different metrics are used to obtain the structural characteristics of the community. Set  C V c , E c  as a community in the network  G V , E ; V represents the total number of nodes in the network G; E represents the total number of edges in the network G; V c represents the total number of nodes in the community C; and E c represents the total number of edges in the community C. O E C represents the outer edge of the community C, where | O E c | = | u , v E , u V , v V | . The community structural features extracted are listed in Table 2, and the following is a description of the structural characteristics of the community:
(1)
SizeRatio, which is the ratio of the number of community nodes to the total number of nodes in the network:
S i z e R a t i o ( C ) = | V c | / | V | ;
(2)
EdgeRatio, which is the ratio of the number of community edges to the total number of edges in the network:
E d g e R a t i o C = | E c | / | E | ;
(3)
Density, which is the ratio of the actual number of edges of the community to the maximum number of edges the community may have:
D e n s i t y C = 2 | E c | | V c | | V c | 1 ;
(4)
Cohesion, which is the ratio of in-community edge density to out-community edge density, where the number of connections of out-community nodes is O E c :
C o h e s i o n C = 2 | E c | | V c | | V c | 1 | O E c | | V c | | V | | V c | = 2 | E c | | V c | | V | | V c | | O E c | | V c | | V c | 1 ;
(5)
AverageInDegree: Mean connectivity within a community:
A v e r a g e I n D e g r e e C = 2 | E c | V c ;
(6)
AverageExDegree: Community out-connectivity mean:
A v e r a g e E x D e g r e e C = | O E c | / | V c | ;
(7)
Clustering Coefficient: Reflects the density of connections within the community;
(8)
Closeness_mean, used to react to the global influence of a node;
(9)
Degree_mean, used to determine the difference degree between node degrees in a network;
(10)
Betweenness_mean, used to measure the independence degree between nodes in a network.

3.3. Community Sequential Features

The sequential features are used to describe the characteristics of the community changing over time. Consider the change in each structural attribute of the community, that is, the difference between the value of the structural attribute of the community and its predecessor. Then, the change in the nodes in the community, the survival time of the community and the similarity between the community and its predecessors are considered. We use C i t to represent the community i at time window t. The nodes of community C i t are represented by V i t , and the edges are represented as E i t . Its predecessor community is C i t 1 , which represents the community i at time window t 1 . Its nodes are represented as V i t 1 , and the edges are represented as E i t 1 . The community sequential features extracted are listed in Table 3.
(1)
DifferentStructure: The difference value of all structural features between the community at time window t and its predecessor community, where “structural features” refers to all of the features in Table 2;
(2)
JoinNodeRatio: The percentage of new nodes joining the community compared to its predecessor community to the overall number of nodes in the community:
J o i n N o d e R a t i o ( C i t , C i t 1 ) = | V i t V i t 1 | / | V i t | ;
(3)
LeftNodeRatio: Percentage of nodes that left compared to the predecessor community compared to the total nodes:
L e f t N o d e R a t i o = | V i t 1 V i t | / | V i t 1 | ;
(4)
LifeSpan: The length of the time slice that the community has survived, starting from the first time slice that the community survived to the current time slice;
(5)
JaccardCoefficient: Calculate the Jaccard similarity between a community and its predecessor:
J a c c a r d C o e f f i c i e n t C i t , C i t 1 = | V i t V i t | | V i t V i t | .

3.4. Community Behavior Features

Community behavior is characterized by the formation, splitting, merging and size change of the previous time window of the community. The extracted community behavior features are shown in Table 4.

4. Extraction of Potential Structural Features

Graph embedding encoding based on the idea of network representation learning constructs the potential structural features of the community in order to fully obtain the topological structure information of nodes in the network community and improve the accuracy of community evolution prediction.

4.1. Description of Potential Structural Features

The potential structural characteristics of the community are obtained by graph embedding encoding, which could better reflect the distribution characteristics of the local and overall structure of the community. Deepwalk and spectral propagation are used to obtain the underlying structural characteristics of the community. In the DeepWalk algorithm, the structural information around the node could be learned through the process of random walking, and the truncated random walk sequence is input into the SkipGram model to obtain the initial vector coding of the node. The node vector code learned in this process only contains the topological structural information around the node. The final constructed graph embedding code more fully contains the local information and global clustering information of the graph in order to better predict the evolution of the community. The obtained initial vector code is processed by spectral propagation, and the acquisition process of node vector encoding is shown in Figure 1.
Spectral propagation is a general method to further integrate higher-order graph information into graph embeddings and can be used to enhance existing graph embedding algorithms.We used a part of the ProNE algorithm’s [23] steps for spectral propagation.The final graph embedding representation is obtained with more local smoothing information and global clustering information according to spectral propagation, which tunes the graph structure spectrally through higher-order Cheeger inequalities to further integrate global network properties.
The graph space and the spectral space are connected according to the higher-order Cheeger inequality, and the effect of higher-order global or local partitioning of the graph is controlled by adjusting the eigenvalues of the spectral space, and the graph embedding representation is propagated on the new graph. In this process, the graph-embedded encoding of nodes will share the embedded information of points that belong to the same higher-order structure with it, so that more local information and global clustering information will be integrated into the graph embedding expression, that is, more internal structural features of communities will be integrated.

4.2. Algorithm Description

The following steps are proposed for acquiring community potential structural features:
(1)
Input the network and set the parameters of the algorithm.
(2)
Use random walking to generate the sequences and learn topological structural features from surrounding nodes throughout the walking process.
(3)
Using the SkipGram model to update the vector representation.
(4)
Using the learned node vector representations construct node vector matrix R d .
(5)
Spectral propagation of the vector matrix R d in the recursive approach of Chebyshev.
(6)
Orthogonalization is carried out through SVD to obtain the node vector encoding after spectral propagation.
Based on the above description steps, the potential structural features mining algorithm is described in Algorithm 1:
Algorithm 1 Potential Structural Features.
Require :
   G r a p h G = G ( V , E ) , Feature dimension of learning d, Number of walking per node r, The length of the path walked by each node l
Ensure :
  Vector matrix representation of nodes R d
1:
Initialization: Sample ϕ from U | V | × d
2:
/* Extract the initial node encoding according to DeepWalk idea*/
3:
Build a binary Tree T from V
4:
for i = 1 to r do
5:
      O = s h u f f l e V
6:
     for each V i O  do
7:
          W v i = R a n d o m W a l k G , v i , t
8:
          S k i p G r a m ϕ , W v i , w
9:
     end for
10:
end for
11:
/* Spectral propagation of the initially obtained node codes */
12:
Construct the node vector matrix R d of the node vector network based on the obtained node vector encoding
13:
Spectral propagation by Chebyshev’s recursive approach to R d
14:
Orthogonalization R d by SVD
15:
return the graph embedding representation boosted by spectral propagation R d

5. Experiments and Results Analysis

Three experimental data sets of different scales, Hepth, Enron and Bitcon, were selected to form a social network graph. The significance of the multivariate features and potential structural features of MF-PSF feature sets in community evolution prediction was elucidated through experiments, and the effectiveness of the feature sets constructed by MF-PSF method in improving the accuracy of community evolution prediction were verified by comparative analysis with the feature sets constructed by other community evolution prediction methods.

5.1. Description of the Data Set

Sixty months of Hepth data were selected to divide the dynamic network into twenty continuous time snapshots in a three-month time window. The Enron data of 32 months were divided the dynamic network into 32 continuous time snapshots in a one-month window. The Bitcon dataset was selected for 61 months, and the dynamic network was divided into 30 consecutive snapshots with a time window of 3 months, with 1 month of data overlap between adjacent snapshots. Information on the data sets is shown in Table 5.

5.2. Multivariate Feature Set Importance Analysis

The Random Forest prediction model was used to predict community evolution combined with the extracted multivariate feature set in this paper. Random Forest is an effective machine learning algorithm for classification and regression problems. It is flexible and simple to use. The Random Forest algorithm has high accuracy, is excellent at handling high-dimensional data and can rank the importance of features. Six community evolution events are predicted by using four extracted features: core node features, community structural features, community sequential features and community behavior features. The importance of the extracted features in predicting each evolution event is studied. The importance of each feature in the Hepth data set in predicting each evolutionary event is shown in Figure 2. Dissolving, continuing, growing, merging, shrinking and splitting are the six types of community evolutionary events depicted on the horizontal axis, and the four categories of community features extracted are depicted on the vertical axis. The depth of the color in the figure represents the importance of the feature in the process of community evolution prediction. The darker the color, the more important the feature is in predicting the community evolution events.
It can be seen from Figure 2 that the importance of each feature is different when predicting different evolutionary events. In the Hepth dataset, for predicting dissolving events, the four features of EdgeRatio, SizeRatio, Preform and LifeSpan are more important, while the other features are less important. For continuing events, the community sequential features and community behavior features are more important in the prediction process, and the number of features that play an important role is more than that of other evolutionary events. For shrinking and splitting events, the community structural features that play an important role are more distributed in the community structural features, and the LifeSpan feature also plays an important role in the prediction process.
The importance of the features of the Enron data set in predicting evolutionary events is illustrated in Figure 3. In the Enron data set, the five characteristics of SizeRatio, EdgeRatio, AverageInDegree, LifeSpan and PreForm are relatively important for predicting dissolving, continuing and growing events, while the other characteristics are less important. The overall importance of each feature in the process of dissolving event prediction is similar to that in the Hepth data set. Community sequential features and community behavior features play important roles in predicting continuing events, which are different from those in the Hepth data set. For shrinking and splitting events, the community structural features that play an important role in the prediction of shrinking events are mostly distributed in the community structural features, while the community sequential features that play an important role in the prediction of splitting events are more distributed in the community structural features.
Figure 4 illustrates the significance of each Bitcoin data set attribute in predicting each evolutionary event. When predicting dissolving events, the core node features and community structural features are crucial and the AverageExDegree, the SizeRatio and the EdgeRatio are the most significant features.Community sequential features and community behavior features play important roles in predicting continuing events. For the prediction of growing events, shrinking events and splitting events, the community behavior features play a little role, and the important features are distributed among the core node features, community structural features and community sequential features.
In the prediction processes of the Hepth, Enron and Bitcon data sets, the analysis shows that the importance of features in each evolutionary event varies depending on the dataset. For different community evolution events in the same data set, the importance of extracted community features is different. The experimental results show that it is very important to extract sufficient and comprehensive features of community evolution in the process of community evolution prediction.

5.3. Importance Analysis of Potential Structural Features

Based on the analysis of the importance of each feature in the multivariate community feature set, the importance of the community potential structural features extracted that contain information on the internal topology of the community is analyzed. A new feature set is jointly constructed to predict community evolutionary events using the four types of community features in the multivariate feature set, combined with the extracted community potential structural features, and the importance of the features in the five new types of feature sets is analyzed to verify the effectiveness of the potential structural feature. The experimental results are shown in Figure 5, Figure 6 and Figure 7.
The horizontal axis shows the five types of community features, core node features, community structural features, community sequential features, community behavior features and community potential structural features, while the vertical axis shows the prediction of six types of community evolution events: dissolving, continuing growing, merging, shrinking, and splitting. The shade of the color in the graph represents the importance of the features in the prediction process, with the darker the color indicating that the features are more essential in predicting community evolutionary events.
Figure 5 shows the importance distribution of various features in the Hepth dataset in predicting various evolutionary events. It can be seen that in the process of predicting community evolutionary events, the importance of the five extracted features in predicting each evolutionary event is significant. For the four types of community evolution events, i.e., dissolving, growing, merging, and splitting, the potential structure of community is the most important feature in evolutionary prediction, followed by the community structure. For shrinking events, community structural features are the most important type of features, and other features are of similar importance. For continuing events, community core node features, community structural features, community sequential features and community potential structural features are similar in importance.
Figure 6 shows the importance distribution of various features of the Enron dataset in predicting evolutionary events. According to the experimental results, for the five types of community evolution events, including dissolving, continuing, growing, merging and splitting, the potential structural features of the community are the most important features in the prediction process. For shrinking events, community structural features are the most important in the prediction process, and the importance of the other four features is similar.
Figure 7 shows the importance distribution of each type of feature in the Bitcon dataset for predicting each evolutionary event. For the three types of community evolutionary events (dissolving, growing and splitting), the potential structural features are the most important features in the prediction process. For shrinking, merging and continuing events, the importance of potential structural features, community structural features and community sequential features are similar in the prediction process.
The experimental results show that the extracted multivariate features play a certain degree of role in predicting each evolutionary event, and that the extracted potential structural features are the most important in predicting most evolutionary prediction events, indicating that the potential structural features extracted are effective in evolutionary prediction in this paper.

5.4. Evolutionary Prediction Results

The proposed community evolution prediction method MF-PSF constructs a feature set including four types of features in the multivariate feature set and the extracted community potential structural features. In order to verify the effectiveness of the feature set extracted by the MF-PSF method, a Random Forest prediction model was used, and the average F1 value was calculated by the ten-fold crossover algorithm. The feature set F_1 in reference [18], F_2 in reference [7], F_3 in reference [6] and F_4 extracted by the MF-PSF method were extracted for experiments, and the influence of each feature set on the prediction accuracy of community evolution events was compared and analyzed.
The Random Forest classifier has higher accuracy compared to the KNN and SVM classifiers, while the KNN and SVM classifiers also have the drawback of high computational complexity. Due to the characteristics of our data sets, linear classifiers also cannot play a good role in community evolutionary event prediction. As a result, the Random Forest classifier is used in this paper. As shown by the F1 values, better prediction results for each data set are achieved based on the Random Forest classifier.
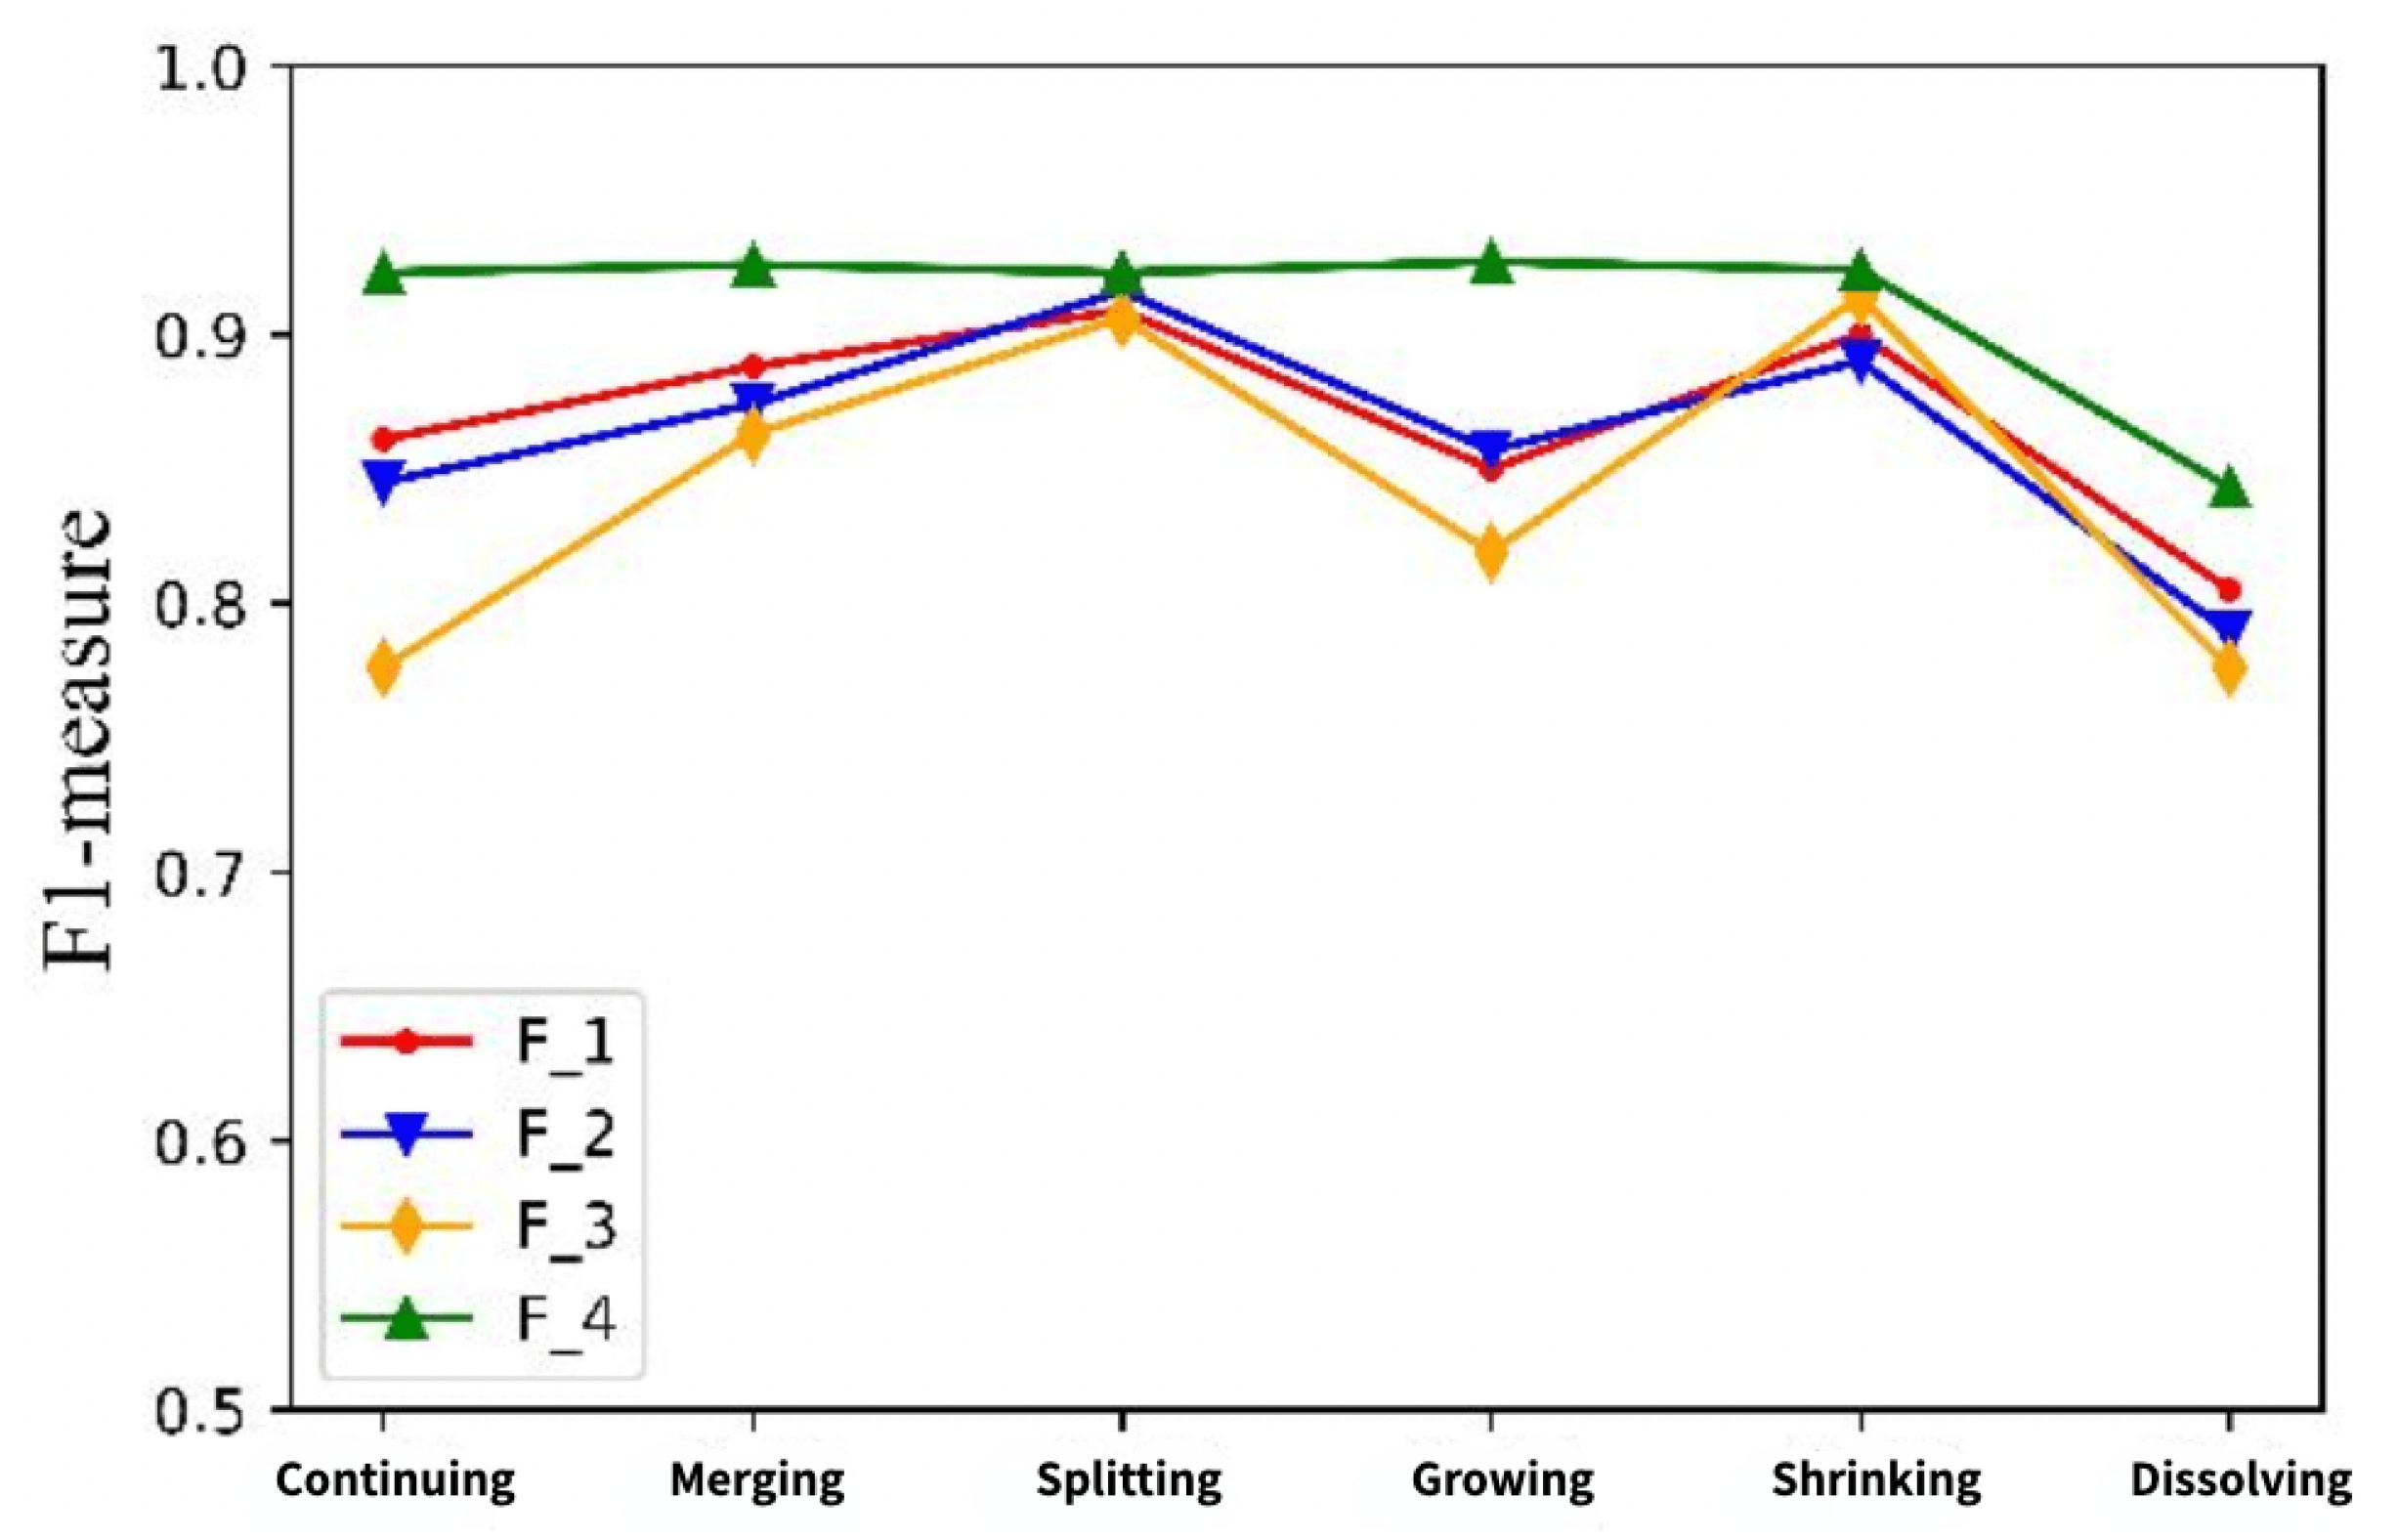
Figure 8 shows the comparison of the evolution results of each feature set predicted by the Hepth data set. It can be seen that the accuracy of F_4 extracted by the MF-PSF method is higher than the other feature sets in predicting all kinds of evolutionary events.
For continuing events, the F_4 feature set constructed by the MF-PSF method is used to predict community evolution, and the predicted F1 value is 0.870, which is 0.5%, 7.5% and 4% higher than that of the F_1, F_2 and F_3 feature sets, respectively. For merging events, the prediction F1 value of F_4 extracted by the MF-PSF method is 0.913, which is 3.7% higher than that of the F_2 feature set, with a better prediction result. For splitting events, the predicted F1 value of F_4 extracted by the MF-PSF method was 0.924, which was 3.4%, 2.8% and 0.7% higher than that of F_1, F_2 and F_3, respectively. For growing events, the F_4 feature set constructed by the MF-PSF method is significantly better than the F_1, F_2 and F_3 feature sets, and the predicted F1 value increased by 6.8%, 6% and 9.8%, respectively. For shrinking events, the prediction results of the F_1, F_2 and F_3 feature sets are similar, and the F_4 extracted by the MF-PSF method is improved by about 4% compared with other methods. For dissolving events, the prediction accuracy of the four feature sets is slightly lower than that of other evolution events. Compared with F_1, F_2 and F_3, the prediction evaluation value of F_4 extracted by the MF-PSF method increased by 7.8%, 1.6% and 13.4%, respectively.
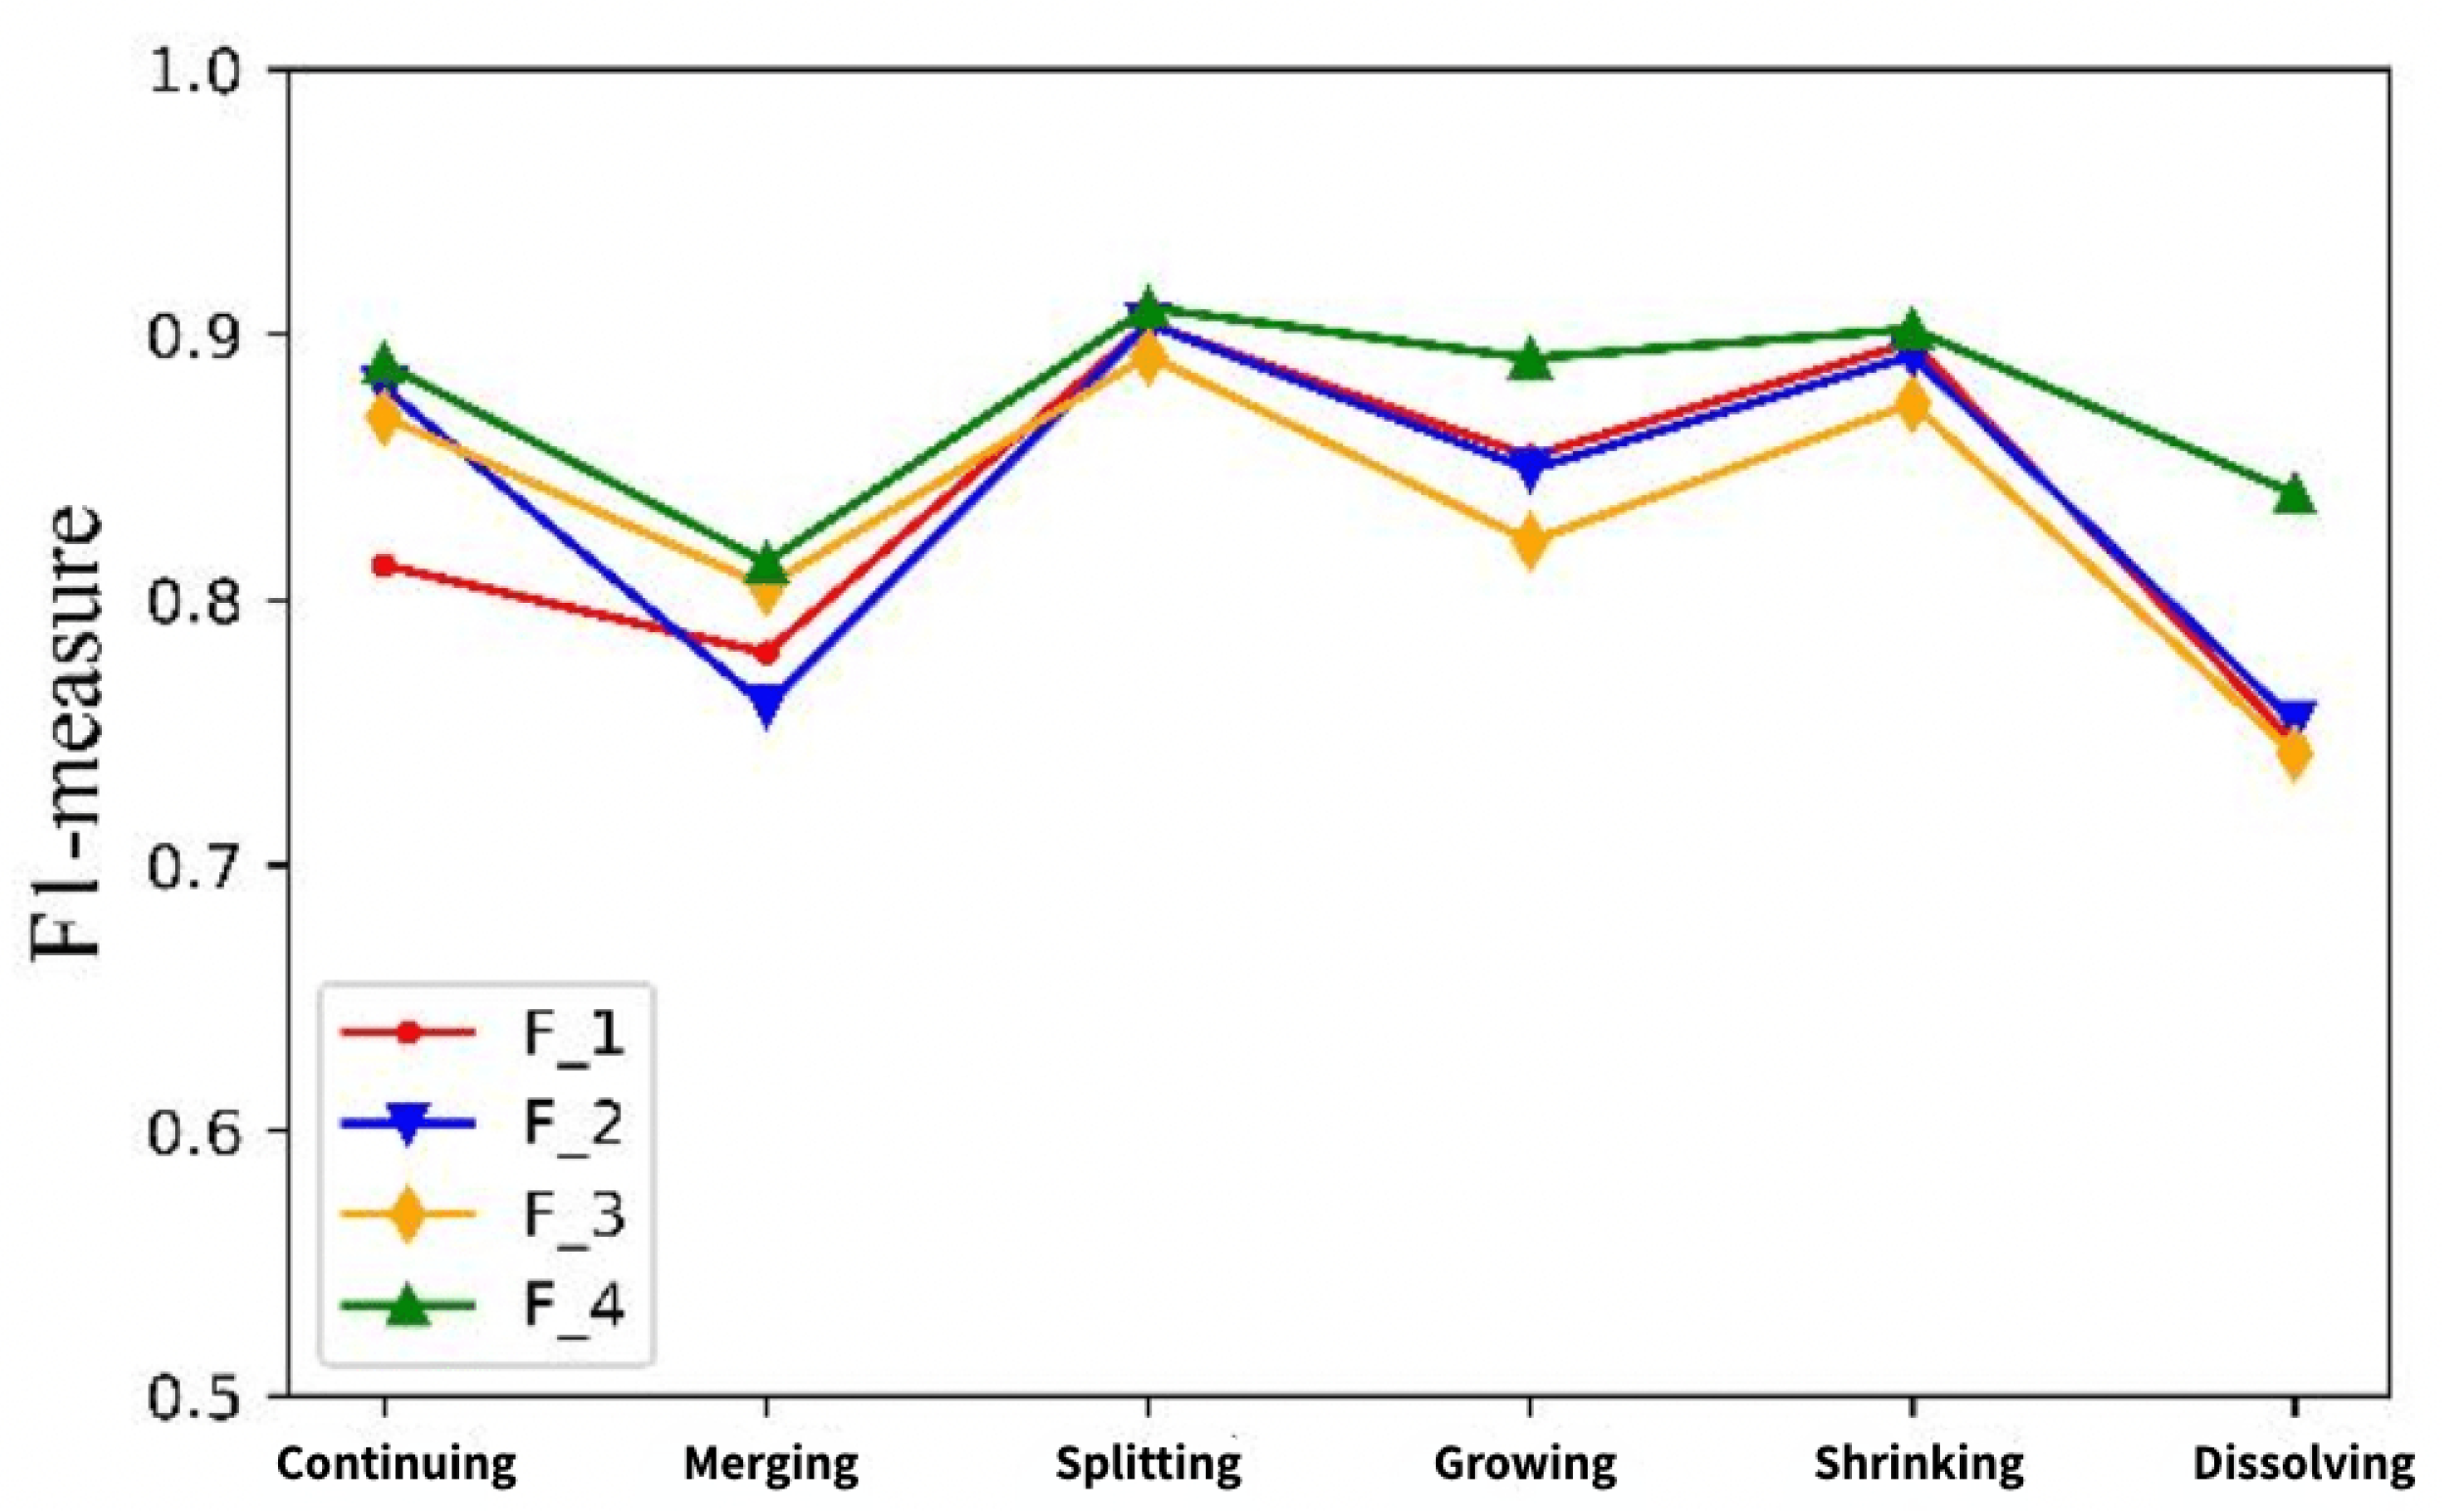
Figure 9 shows a comparison of the predicted community evolution results for each feature set in the Enron data set. For continuing events, the F_4 feature set constructed by the MF-PSF method is used to predict community evolution, and the predicted F1 value is 0.923, which is 6.2%, 7.8% and 14.7% higher than that of the F_1, F_2 and F_3 feature sets, respectively. Therefore, it can be seen that the feature set F_4 improves the accuracy of continuing event prediction. For merging events, the predicted F1 value of the F_4 feature set was 0.926, which was 3.8%, 5.2% and 6.3% higher than that of the other three feature sets, respectively. For splitting events, the F1 values predicted by the four feature sets are all above 0.9, but the prediction result of F_4 extracted by the MF-PSF method is 0.923. The F_4 feature set constructed by the MF-PSF method is superior to the F_1, F_2 and F_3 feature sets in terms of prediction results, and the predicted F1 values are increased by 7.7%, 7% and 10.8%, respectively. For the shrinking event, the predicted F1 values of the four feature sets are similar, but the F_4 feature set constructed by the MF-PSF method is still higher than the other three feature sets. For dissolving events, the prediction accuracy of the four feature sets was slightly lower than that of other evolution events. Compared with F_1, F_2 and F_3, the prediction evaluation value of F_4 extracted by the MF-PSF method improved by 3.8%, 5.4% and 6.7%, respectively.
Figure 10 shows the comparison of the evolution results of each feature set predicted by the Bitcon data set. For continuing events, the F_4 feature set constructed by the MF-PSF method is used to predict community evolution, and the predicted F1 value is 0.889, which is 9.3%, 1.0% and 2.3% higher than that of the F_1, F_2 and F_3 feature sets, respectively. For growing events, the predicted F1 value of the F_4 feature set was 0.891, which was 4.3%, 4.9% and 8.3% higher than that of the other three feature sets, respectively. For splitting events and shrinking events, the predicted F1 values of the four feature sets are similar, but the F_4 feature set constructed by the MF-PSF method is still higher than the other three feature sets. For dissolving events, the F_4 feature set constructed by the MF-PSF method is used to predict community evolution, and the predicted F1 value is 0.840, which is 12.6%, 11.4% and 13.2% higher than that of the F_1, F_2 and F_3 feature sets, respectively. Therefore, it can be seen that the feature set F_4 improves the accuracy of dissolving event prediction. For merging events, the F_4 feature set constructed by the MF-PSF method is significantly better than the F_1, F_2 and F_3 feature sets, and the predicted F1 value increases by 4.3%, 7.1% and 1.1%, respectively.
According to the experimental results, the Random Forest classifier is also used to predict various community evolution events in different data sets. The feature set constructed by MF-PSF based on multivariate feature set and potential structural features could describe community characteristics more effectively and improve the accuracy of community evolution prediction.

6. Conclusions

A community evolution prediction method MF-PSF based on a multivariate feature set and potential structural features is proposed in this paper. This method fully extracted four types of community evolution multivariate feature sets, including community core node features, community structural features, community sequential features and community behavior features. Secondly, the potential structural features of the community are used to obtain the topological information of the local and the global community through network representation learning method, and the evolution of the community is predicted by combining multivariate feature sets and potential structural features. Experiments were performed on Hepth, Enron and Bitcon data sets to analyze the importance of various features in predicting evolutionary events and to verify the validity of the potential structural features extracted in predicting evolutionary events. Compared with other community evolution prediction methods, the results show that the MF-PSF method can effectively improve the accuracy of community evolution prediction. Future work will focus how to identify evolutionary events in communities on non-neighboring time slices based on evolutionary events in communities on neighboring time slices and to predict future evolution over a long period of time.

Author Contributions

Conceptualization, J.C. and H.Z.; methodology, H.Z. and X.Y.; validation, J.C., H.Z. and X.Y.; formal analysis, H.Z. and X.Y.; investigation, H.Z., Z.Y. and M.L. (Miaomiao Liu); resources, J.C., M.L. (Mingxin Liu) and M.L. (Miaomiao Liu); data curation, H.Z. and X.Y.; writing—original draft preparation, J.C., H.Z. and X.Y.; writing—review and editing, J.C., H.Z. and X.Y.; visualization, H.Z.; supervision, J.C., M.L. (Mingxin Liu), M.L. (Miaomiao Liu); funding acquisition, J.C. and M.L. (Mingxin Liu). All authors have read and agreed to the published version of the manuscript.

Funding

This research was funded by the National Natural Science Foundation of China (Grant Nos. 62172352, 61871465 and 42002138), the Natural Science Foundation of Hebei Province (Grant Nos. 2022203028), the Central Government Guides Local Science and Technology Development Fund Projects (Grant No. 226Z0305G).

Data Availability Statement

Not applicable.

Conflicts of Interest

The authors declare no conflict of interest.

Abbreviations

The following abbreviations are used in this manuscript:
MF-PSFMultivariate Feature sets and Potential Structural Features
GEDGraph Edit Distance
SGCIStable Group Changes Identification
GNANGroup Node Attention Network
SVDSingular Value Decomposition

References

  1. Bródka, P.; Kazienko, P.; Kołoszczyk, B. Predicting Group Evolution in the Social Network; Springer: Berlin/Heidelberg, Germany, 2012; pp. 54–67. [Google Scholar]
  2. Gliwa, B.; Bródka, P.; Zygmunt, A.; Saganowski, S.; Kazienko, P.; Kolak, J. Different Approaches to Community Evolution Prediction in Blogosphere; IEEE: Piscataway, NJ, USA, 2013. [Google Scholar]
  3. Dakiche, N.; Tayeb, B.S.; Slimani, Y.; Benatchba, K. Sensitive Analysis of Timeframe Type and Size Impact on Community Evolution Prediction. In Proceedings of the IEEE International Conference on Fuzzy Systems, Rio de Janeiro, Brazil, 8–13 July 2018; pp. 1–8. [Google Scholar]
  4. Kairam, S.R.; Wang, D.J.; Leskovec, J. The Life and Death of Online Groups: Predicting Group Growth and Longevity. In Proceedings of the Acm International Conference on Web Search and Data Mining, Seattle, WA, USA, 8–12 February 2012. [Google Scholar]
  5. Ilhan, N.; Ögüdücü, I. Community Event Prediction in Dynamic Social Networks. In Proceedings of the International Conference on Machine Learning and Applications, Beijing, China, 21–26 June 2014. [Google Scholar]
  6. Takaffoli, M.; Rabbany, R.; Zaane, O.R. Community evolution prediction in dynamic social networks. In Proceedings of the IEEE/ACM International Conference on Advances in Social Networks Analysis and Mining, Beijing, China, 17–20 August 2014. [Google Scholar]
  7. Pavlopoulou, M.E.G.; Tzortzis, G.; Vogiatzis, D.; Paliouras, G. Predicting the evolution of communities in social networks using structural and temporal features. In Proceedings of the 2017 12th International Workshop on Semantic and Social Media Adaptation and Personalization (SMAP), Bratislava, Slovakia, 9–10 July 2017. [Google Scholar]
  8. He, W.; Hu, X.; Li, L.; Lin, Y.; Li, H.; Pan, J. Feature Construction and Prediction of Community Evolution. J. Chin. Comput. Syst. 2018, 39, 1016–1020. [Google Scholar]
  9. Shahriari, M.; Gunashekar, S.; Domarus, M.V.; Klamma, R. Predictive Analysis of Temporal and Overlapping Community Structures in Social Media. In Proceedings of the 25th International Conference Companion on World Wide Web, Montréal, QC, Canada, 11–15 May 2016. [Google Scholar]
  10. Man, J.; Zhu, J.; Cao, L. Multi-Step Community Evolution Prediction Methods via Marcov Chain and Classifier Chain. In Proceedings of the 38th China Control Conference, Guangzhou, China, 27–30 July 2019. [Google Scholar]
  11. Hong, G.; Qiao, L.; Yao, L.; Qin, Z.; Wang, R.; Kang, X. Fast Community Discovery and Its Evolution Tracking in Time-Evolving Social Networks. In Proceedings of the IEEE International Conference on Data Mining Workshop, Barcelona, Spain, 12–15 December 2016. [Google Scholar]
  12. İlhan, N.; Öğüdücü, Ş.G. Predicting community evolution based on time series modeling. In Proceedings of the IEEE/ACM International Conference on Advances in Social Networks Analysis and Mining, Paris, France, 25–28 August 2015. [Google Scholar]
  13. Li, X.; Wu, B.; Qian, G.; Zeng, X.; Shi, C. Dynamic Community Detection Algorithm Based on Incremental Identification. In Proceedings of the 2015 IEEE International Conference on Data Mining Workshop (ICDMW), Atlantic City, NJ, USA, 14–17 November 2015. [Google Scholar]
  14. Khafaei, T.; Tavakoli Taraghi, A.; Hosseinzadeh, M.; Rezaee, A. Tracing temporal communities and event prediction in dynamic social networks. Soc. Netw. Anal. Min. 2019, 9, 59. [Google Scholar] [CrossRef]
  15. Tajeuna, E.G.; Bouguessa, M.; Wang, S. Modeling and Predicting Community Structure Changes in Time-Evolving Social Networks. IEEE Trans. Knowl. Data Eng. 2018, 31, 1166–1180. [Google Scholar] [CrossRef]
  16. Appel, A.P.; Cunha, R.L.F.; Aggarwal, C.C.; Terakado, M.M. Temporally Evolving Community Detection and Prediction in Content-Centric Networks. In Proceedings of the Machine Learning and Knowledge Discovery in Databases, Würzburg, Germany, 16–20 September 2019; Berlingerio, M., Bonchi, F., Gärtner, T., Hurley, N., Ifrim, G., Eds.; Springer International Publishing: Cham, Switzerland, 2019; pp. 3–18. [Google Scholar]
  17. Wu, T.; Chang, C.S.; Liao, W. Tracking Network Evolution and Their Applications in Structural Network Analysis. IEEE Trans. Netw. Sci. Eng. 2019, 6, 562–575. [Google Scholar] [CrossRef]
  18. Pan, J.F.; Cao, Y.; Dong, Y.H.; Chen, H.H.; Qian, J.B. The Community Evolution Event Prediction Based on Attention Deep Random Forest. CTA Electron. Sin. 2019, 47, 2050–2060. [Google Scholar]
  19. Kadkhoda Mohammadmosaferi, K.; Naderi, H. AFIF: Automatically Finding Important Features in community evolution prediction for dynamic social networks. Comput. Commun. 2021, 176, 66–80. [Google Scholar] [CrossRef]
  20. Kadkhoda Mohammadmosaferi, K.; Naderi, H. Evolution of communities in dynamic social networks: An efficient map-based approach. Expert Syst. Appl. 2020, 147, 113221. [Google Scholar] [CrossRef]
  21. Guidi, B.; Michienzi, A.; Ricci, L. SONIC-MAN: A Distributed Protocol for Dynamic Community Detection and Management. In Proceedings of the Distributed Applications and Interoperable Systems, Madrid, Spain, 18–21 June 2018; Bonomi, S., Rivière, E., Eds.; Springer International Publishing: Cham, Switzerland, 2018; pp. 93–109. [Google Scholar]
  22. Revelle, M.; Domeniconi, C.; Gelman, B. Group-Node Attention for Community Evolution Prediction. In Proceedings of the 2021 IEEE/ACM International Conference on Advances in Social Networks Analysis and Mining, Virtual Event, 8–11 November 2021. [Google Scholar]
  23. Zhang, J.; Dong, Y.; Wang, Y.; Tang, J.; Ding, M. ProNE: Fast and Scalable Network Representation Learning. In Proceedings of the International Joint Conference on Artificial Intelligence (IJCAI), Macao, China, 10–16 August 2019. [Google Scholar]
Figure 1. Node vector encoding acquisition process.
Mathematics 10 03802 g001
Figure 2. Distribution of the importance of each feature in the Hepth data set: (a) Core node features and Community structural features; (b) Community sequential features and Community behavior features.
Mathematics 10 03802 g002
Figure 3. Distribution of the importance of each feature in the Enron data set: (a) Core node features and Community structural features; (b) Community sequential features and Community behavior features.
Mathematics 10 03802 g003
Figure 4. Distribution of the importance of each feature in the Bitcon data set: (a) Core node features and Community structural features; (b) Community sequential features and Community behavior features.
Mathematics 10 03802 g004
Figure 5. Distribution of importance of various features in the Hepth data set.
Mathematics 10 03802 g005
Figure 6. Distribution of importance of various features in the Enron data set.
Mathematics 10 03802 g006
Figure 7. Distribution of importance of various features in the Bitcon data set.
Mathematics 10 03802 g007
Figure 8. Hepth dataset prediction results.
Mathematics 10 03802 g008
Figure 9. Enron dataset prediction results.
Mathematics 10 03802 g009
Figure 10. Bitcon dataset prediction results.
Mathematics 10 03802 g010
Table 1. Core Node Features.
FeatureDescriptionValue Range
Core_node_numThe number of core nodes [ 0 , )
Mean_core_degreeAverage degree of core nodes [ 0 , )
Core_ratioCore Node Percentage [ 0 , 1 ]
Core_closenessAverage proximity centrality of core nodes [ 0 , 1 ]
Table 2. Community Structural Features.
FeatureValue Range
SizeRatio ( 0 , 1 ]
EdgeRatio ( 0 , 1 ]
Density ( 0 , 1 ]
Cohesion ( 0 , )
ClusteringCoefficient ( 0 , 1 ]
AverageInDegree [ 1 , n 1 ]
AverageExDegree [ 0 , )
C_node_num [ 3 , )
Closeness_mean ( 0 , 1 ]
Degree_mean ( 0 , 1 ]
Betweenness_mean ( 0 , 1 ]
Table 3. Community Sequential Features.
FeatureValue Range
DifferentStructure
JoinNodeRatio [ 0 , 1 ]
LeftNodeRatio [ 0 , 1 ]
LifeSpan [ 1 , t ]
JaccardCoefficient [ k , 1 ]
Table 4. Community Behavior Features.
FeatureValue Range
PreForm{true, false}
PreSplit{true, false}
PreMerge{true, false}
PreContinue{true, false}
PreGrow{true, false}
PreShrink{true, false}
Table 5. Description Of The Data Sets.
Data SetNumber of NodesNumber of EdgesTime Periods
Hepth16,205154,41960 months
Enron87,2731,148,07232 months
Bitcon588135,59261 months
Publisher’s Note: MDPI stays neutral with regard to jurisdictional claims in published maps and institutional affiliations.

