
Conditional Synthesis of Blood Glucose Profiles for T1D Patients Using Deep Generative Models
 ,
,  , ,
, ,
Abstract
:1. Introduction
- A GAN has been used for the conditional generation of realistic BG values for the first time.
- The rationale for the development of a GAN-based diabetes patient simulator is given.
2. Deep Generative Models
2.1. Generative Adversarial Network
2.2. Conditional Generative Adversarial Networks
2.3. Image Translation Using Conditional Generative Adversarial Networks
3. Methodology
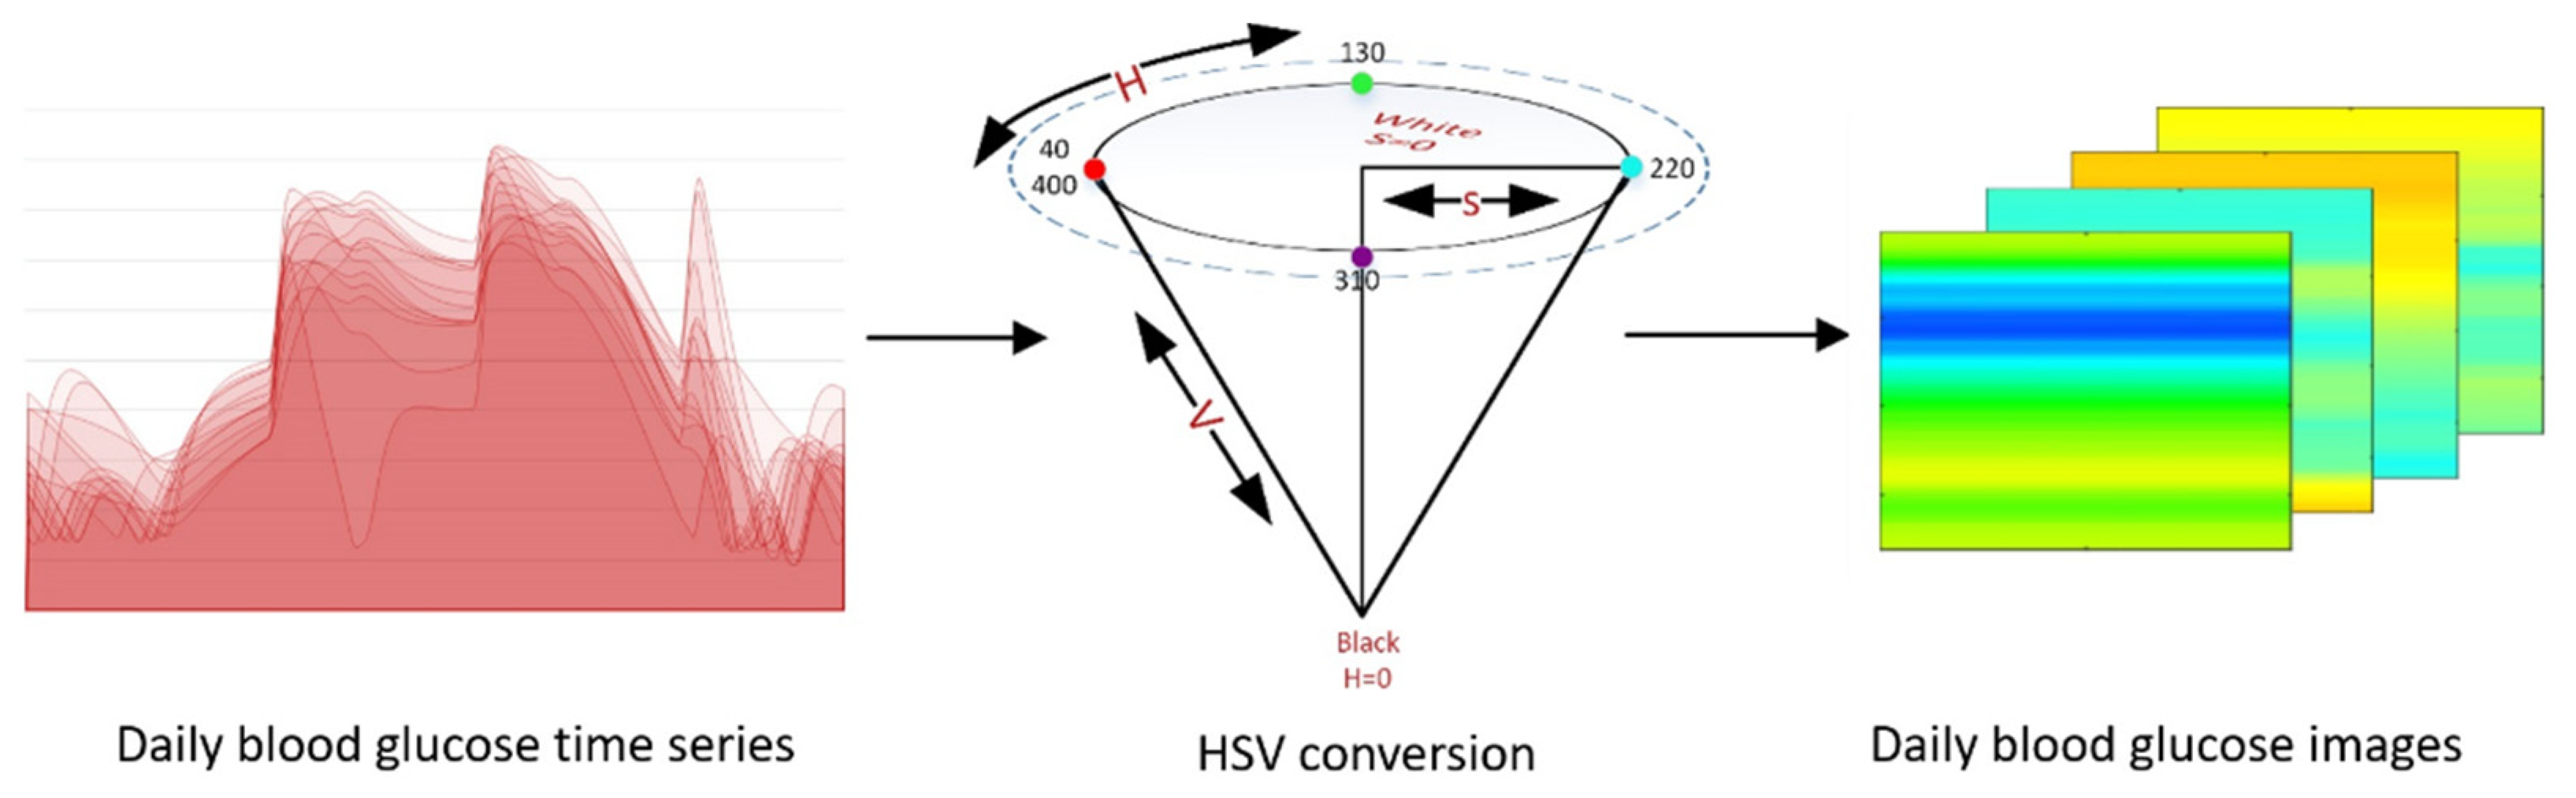
- Numerical data to graphical data conversion;
- Pix2Pix GAN Training;
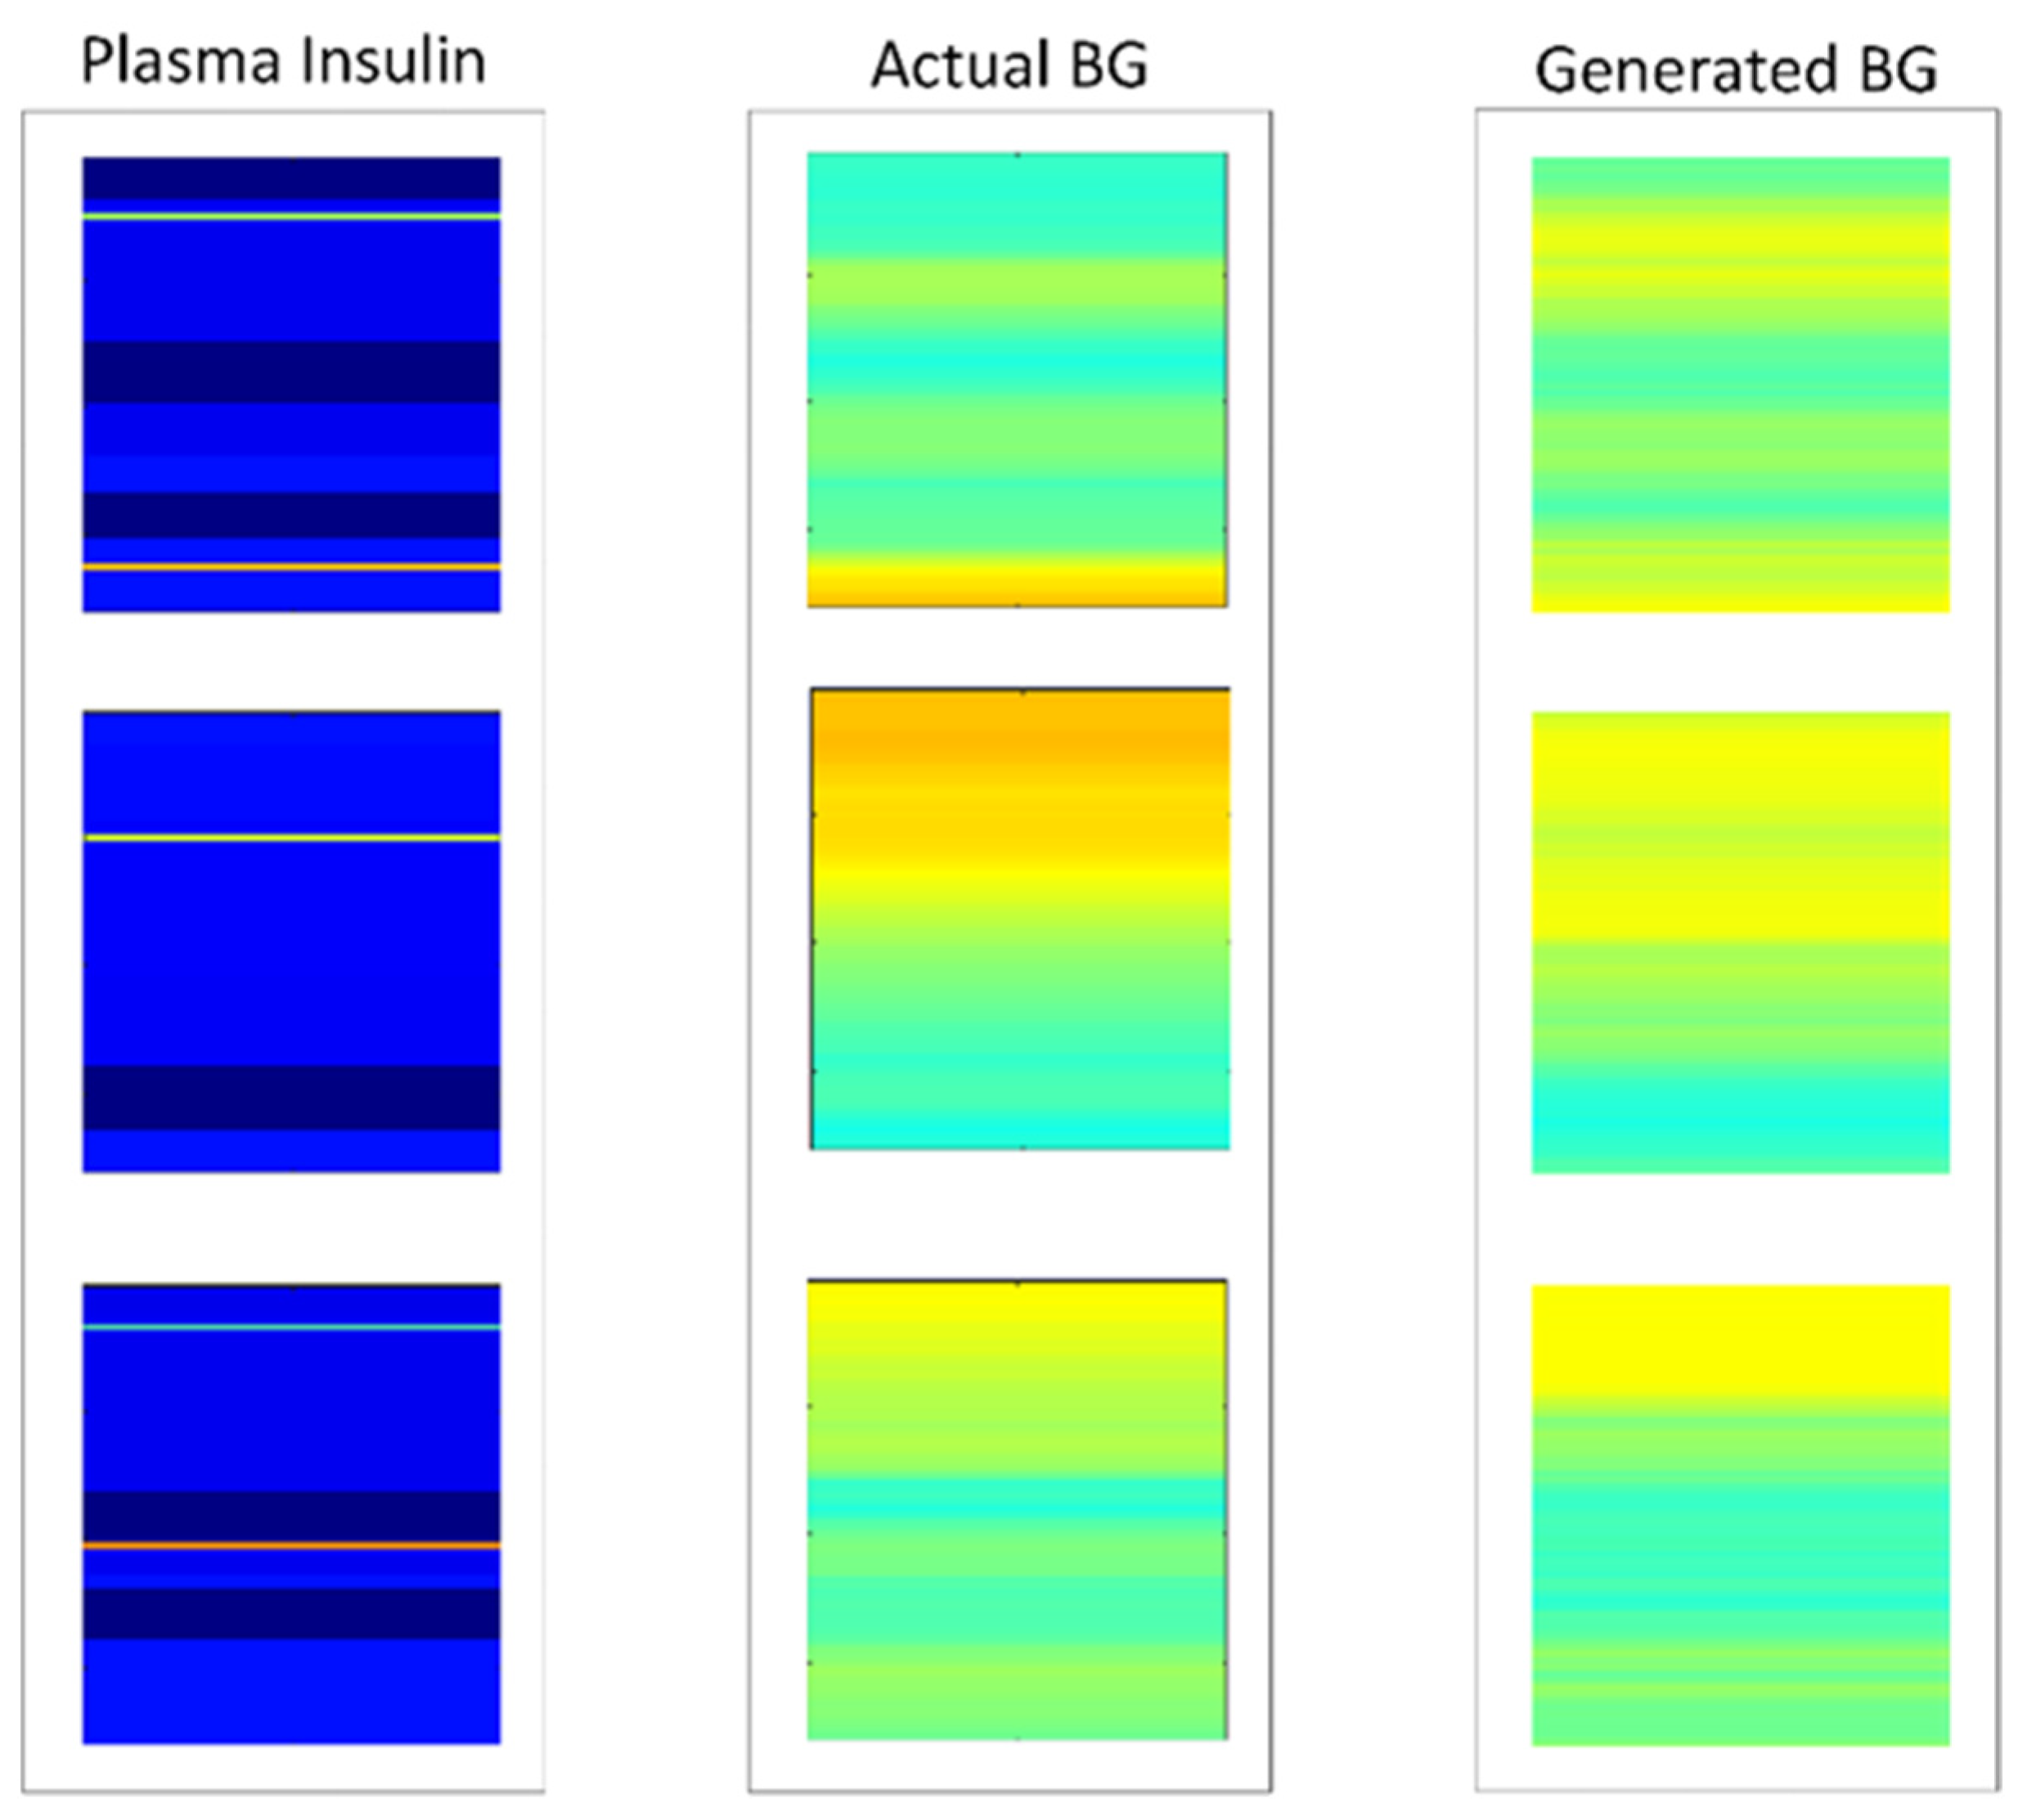
- Data generation using a trained Pix2Pix generator;
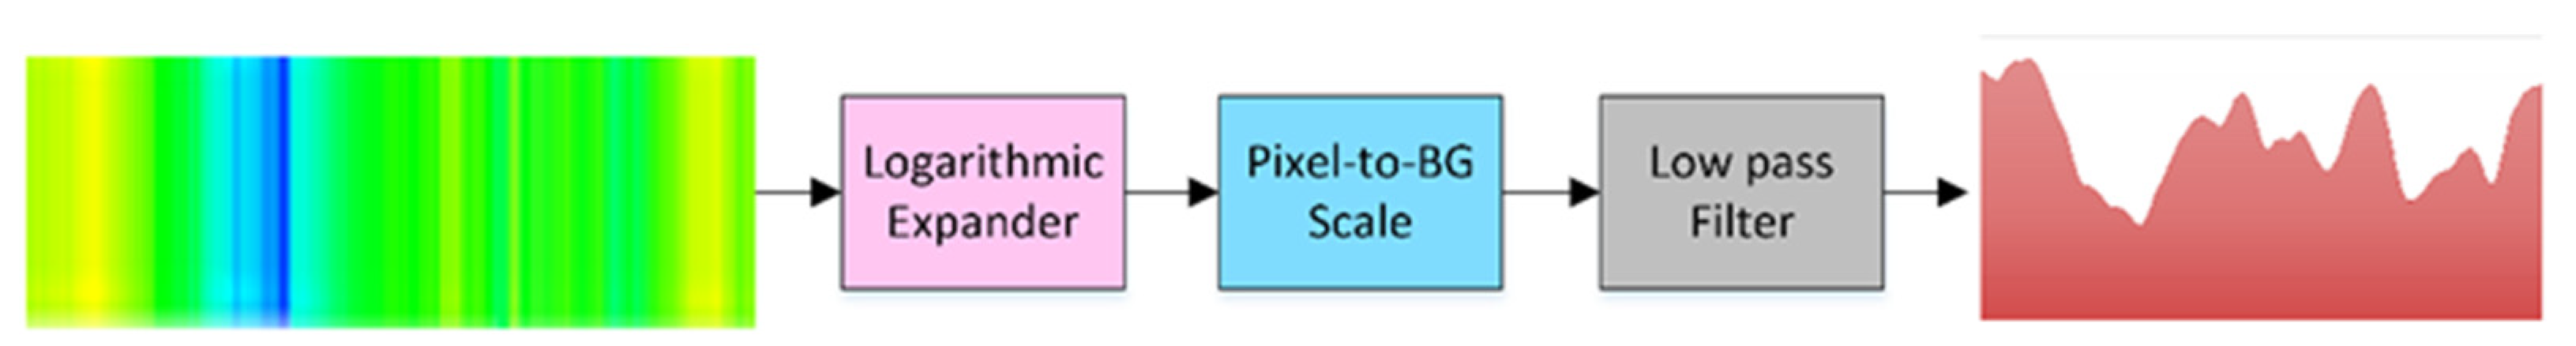
- Graphical data to numerical data conversion.
3.1. Experimental Data Sets
3.2. Model Architecture
3.3. Translation between Numerical and Image Information
3.4. Model Training and Data Generation
4. Results
5. Discussion
6. Conclusions
Author Contributions
Funding
Institutional Review Board Statement
Informed Consent Statement
Data Availability Statement
Conflicts of Interest
References
- Sá-Couto, C.; Patrão, L.; Maio-Matos, F.; Pêgo, J.M. Biomedical simulation: Evolution, concepts, challenges and future trends. Acta. Med. Port. 2016, 29, 860–868. [Google Scholar] [CrossRef] [PubMed] [Green Version]
- Man, C.D.; Micheletto, F.; Lv, D.; Breton, M.; Kovatchev, B.; Cobelli, C. The UVA/PADOVA type 1 diabetes simulator: New features. J. Diabetes Sci. Technol. 2014, 8, 26–34. [Google Scholar] [CrossRef] [Green Version]
- Wilinska, M.E.; Chassin, L.J.; Acerini, C.; Allen, J.M.; Dunger, D.; Hovorka, R. Simulation Environment to Evaluate Closed-Loop Insulin Delivery Systems in Type 1 Diabetes. J. Diabetes Sci. Technol. 2010, 4, 132–144. [Google Scholar] [CrossRef] [PubMed] [Green Version]
- Alkhalifah, T.; Wang, H.; Ovcharenko, O. MLReal: Bridging the gap between training on synthetic data and real data applications in machine learning. Eur. Assoc. Geosci. Eng. 2021, 2021, 1–5. [Google Scholar] [CrossRef]
- Jan, S.V.S.; Geris, L. Modelling towards a more holistic medicine: The Virtual Physiological Human (VPH). Morphologie 2019, 103, 127–130. [Google Scholar] [CrossRef]
- Shengli, W. Is Human Digital Twin possible? Comput. Methods Programs Biomed. Updat. 2021, 1, 100014. [Google Scholar] [CrossRef]
- Kovatchev, B.P.; Breton, M.; Man, C.D.; Cobelli, C. In SilicoPreclinical Trials: A Proof of Concept in Closed-Loop Control of Type 1 Diabetes. J. Diabetes Sci. Technol. 2009, 3, 44–55. [Google Scholar] [CrossRef] [Green Version]
- Cobelli, C.; Man, C.D.; Sparacino, G.; Magni, L.; De Nicolao, G.; Kovatchev, B.P. Diabetes: Models, Signals, and Control. IEEE Rev. Biomed. Eng. 2009, 2, 54–96. [Google Scholar] [CrossRef] [Green Version]
- Hester, R.L.; Iliescu, R.; Summers, R.; Coleman, T.G. Systems biology and integrative physiological modelling. J. Physiol. 2011, 589, 1053–1060. [Google Scholar] [CrossRef]
- Vettoretti, M.; Facchinetti, A.; Sparacino, G.; Cobelli, C. Type-1 Diabetes Patient Decision Simulator for In Silico Testing Safety and Effectiveness of Insulin Treatments. IEEE Trans. Biomed. Eng. 2017, 65, 1281–1290. [Google Scholar] [CrossRef]
- Roversi, C.; Vettoretti, M.; Del Favero, S.; Facchinetti, A.; Sparacino, G. Modeling Carbohydrate Counting Error in Type 1 Diabetes Management. Diabetes Technol. Ther. 2020, 22, 749–759. [Google Scholar] [CrossRef] [PubMed] [Green Version]
- American Diabetes Association. 15. Diabetes Care in the Hospital: Standards of Medical Care in Diabetes—2021. Diabetes Care 2021, 44 (Suppl. S1), S211–S220. [Google Scholar] [CrossRef] [PubMed]
- Karimy, M.; Koohestani, H.R.; Araban, M. The association between attitude, self-efficacy, and social support and adherence to diabetes self-care behavior. Diabetol. Metab. Syndr. 2018, 10, 86. [Google Scholar] [CrossRef] [PubMed] [Green Version]
- Bertachi, A.; Biagi, L.; Contreras, I.; Luo, N.; Vehí, J. Prediction of Blood Glucose Levels And Nocturnal Hypoglycemia Using Physiological Models and Artificial Neural Networks. KHD@ IJCAI 2018, 85–90. [Google Scholar]
- Mujahid, O.; Contreras, I.; Vehi, J. Machine Learning Techniques for Hypoglycemia Prediction: Trends and Challenges. Sensors 2021, 21, 546. [Google Scholar] [CrossRef]
- Contreras, I.; Vehi, J. Artificial Intelligence for Diabetes Management and Decision Support: Literature Review. J. Med. Internet Res. 2018, 20, e10775. [Google Scholar] [CrossRef]
- Nalisnick, E.; Matsukawa, A.; Teh, Y.W.; Gorur, D.; Lakshminarayanan, B. Do deep generative models know what they don’t know? arXiv 2018, arXiv:1810.09136. [Google Scholar]
- Nikzad, M.; Movagharnejad, K.; Talebnia, F. Comparative Study between Neural Network Model and Mathematical Models for Prediction of Glucose Concentration during Enzymatic Hydrolysis. Int. J. Comput. Appl. 2012, 56, 43–48. [Google Scholar] [CrossRef]
- Noguer, J.; Contreras, I.; Mujahid, O.; Beneyto, A.; Vehi, J. Generation of Individualized Synthetic Data for Augmentation of the Type 1 Diabetes Data Sets Using Deep Learning Models. Sensors 2022, 22, 4944. [Google Scholar] [CrossRef]
- Buczak, A.L.; Babin, S.; Moniz, L. Data-driven approach for creating synthetic electronic medical records. BMC Med. Inform. Decis. Mak. 2010, 10, 59. [Google Scholar] [CrossRef] [Green Version]
- Frid-Adar, M.; Klang, E.; Amitai, M.; Goldberger, J.; Greenspan, H. Synthetic data augmentation using GAN for improved liver lesion classification. In Proceedings of the 2018 IEEE 15th International Symposium on Biomedical Imaging (ISBI 2018), Washington, DC, USA, 4–7 April 2018; pp. 289–293. [Google Scholar] [CrossRef] [Green Version]
- Isola, P.; Zhu, J.-Y.; Zhou, T.; Efros, A.A. Image-to-image translation with conditional adversarial networks. In Proceedings of the IEEE Conference on Computer Vision and Pattern Recognition, Honolulu, HI, USA, 21–26 July 2017; pp. 1125–1134. [Google Scholar]
- Jordon, J.; Yoon, J.; van der Schaar, M. PATE-GAN: Generating synthetic data with differential privacy guarantees. In Proceedings of the International Conference on Learning Representations, Vancouver, BC, Canada, 30 April–3 May 2018. [Google Scholar]
- Frid-Adar, M.; Diamant, I.; Klang, E.; Amitai, M.; Goldberger, J.; Greenspan, H. GAN-based synthetic medical image augmentation for increased CNN performance in liver lesion classification. Neurocomputing 2018, 321, 321–331. [Google Scholar] [CrossRef]
- Lee, C.-H.; Liu, Z.; Wu, L.; Luo, P. Maskgan: Towards diverse and interactive facial image manipulation. In Proceedings of the IEEE/CVF Conference on Computer Vision and Pattern Recognition, Seattle, WA, USA, 13–19 June 2020; pp. 5549–5558. [Google Scholar]
- Meskys, E.; Liaudanskas, A.; Kalpokiene, J.; Jurcys, P. Regulating deep fakes: Legal and ethical considerations. J. Intellect. Prop. Law Pract. 2020, 15, 24–31. [Google Scholar] [CrossRef] [Green Version]
- Dornis, T.W. Artificial Creativity: Emergent Works and the Void in Current Copyright Doctrine. Yale J. Law Technol. 2020, 22, 1. [Google Scholar]
- Ravuri, S.; Lenc, K.; Willson, M.; Kangin, D.; Lam, R.; Mirowski, P.; Fitzsimons, M.; Athanassiadou, M.; Kashem, S.; Madge, S.; et al. Skillful Precipitation Nowcasting using Deep Generative Models of Radar. arXiv 2021, arXiv:2104.00954. [Google Scholar]
- Ruthotto, L.; Haber, E. An introduction to deep generative modeling. GAMM-Mitteilungen 2021, 44, e202100008. Available online: https://arxiv.org/abs/2103.05180 (accessed on 20 August 2022). [CrossRef]
- Creswell, A.; White, T.; Dumoulin, V.; Arulkumaran, K.; Sengupta, B.; Bharath, A.A. Generative Adversarial Networks: An Overview. IEEE Signal Process. Mag. 2018, 35, 53–65. [Google Scholar] [CrossRef] [Green Version]
- Mirza, M.; Osindero, S. Conditional Generative Adversarial Nets. arXiv 2014, arXiv:1411.1784. [Google Scholar]
- Ahmad, S.; Ramkissoon, C.; Beneyto, A.; Conget, I.; Giménez, M.; Vehi, J. Generation of Virtual Patient Populations that Represent Real Type 1 Diabetes Cohorts. Mathematics 2021, 9, 1200. [Google Scholar] [CrossRef]
- Hovorka, R.; Canonico, V.; Chassin, L.J.; Haueter, U.; Massi-Benedetti, M.; Federici, M.O.; Pieber, T.R.; Schaller, H.C.; Schaupp, L.; Vering, T.; et al. Nonlinear model predictive control of glucose concentration in subjects with type 1 diabetes. Physiol. Meas. 2004, 25, 905–920. [Google Scholar] [CrossRef] [Green Version]
- Marling, C.; Bunescu, R. The OhioT1DM Dataset for Blood Glucose Level Prediction: Update 2020. CEUR Workshop Proc. 2020, 2675, 71–74. [Google Scholar]
- Ronneberger, O.; Fischer, P.; Brox, T. U-Net: Convolutional Networks for Biomedical Image Segmentation. In Medical Image Computing and Computer-Assisted Intervention—MICCAI 2015; Springer: Berlin/Heidelberg, Germany, 2015; pp. 234–241. [Google Scholar]
- Vadivel, A.; Sural, S.; Majumdar, A.K. Human color perception in the HSV space and its application in histogram generation for image retrieval. Proc. SPIE 2005, 5667, 598–609. [Google Scholar] [CrossRef]
- PHerrero, P.; Alalitei, M.A.; Reddy, M.; Georgiou, P.; Oliver, N. Robust Determination of the Optimal Continuous Glucose Monitoring Length of Intervention to Evaluate Long-Term Glycemic Control. Diabetes Technol. Ther. 2021, 23, 314–319. [Google Scholar] [CrossRef]
- Goodfellow, I.J.; Pouget-Abadie, J.; Mirza, M.; Xu, B.; Warde-Farley, D.; Ozair, S.; Courville, A.; Bengio, Y. Generative Adversarial Networks. arXiv 2014, arXiv:1406.2661. [Google Scholar] [CrossRef]


| Ranges | Real Cohort | Generated Cohort | p-Values |
|---|---|---|---|
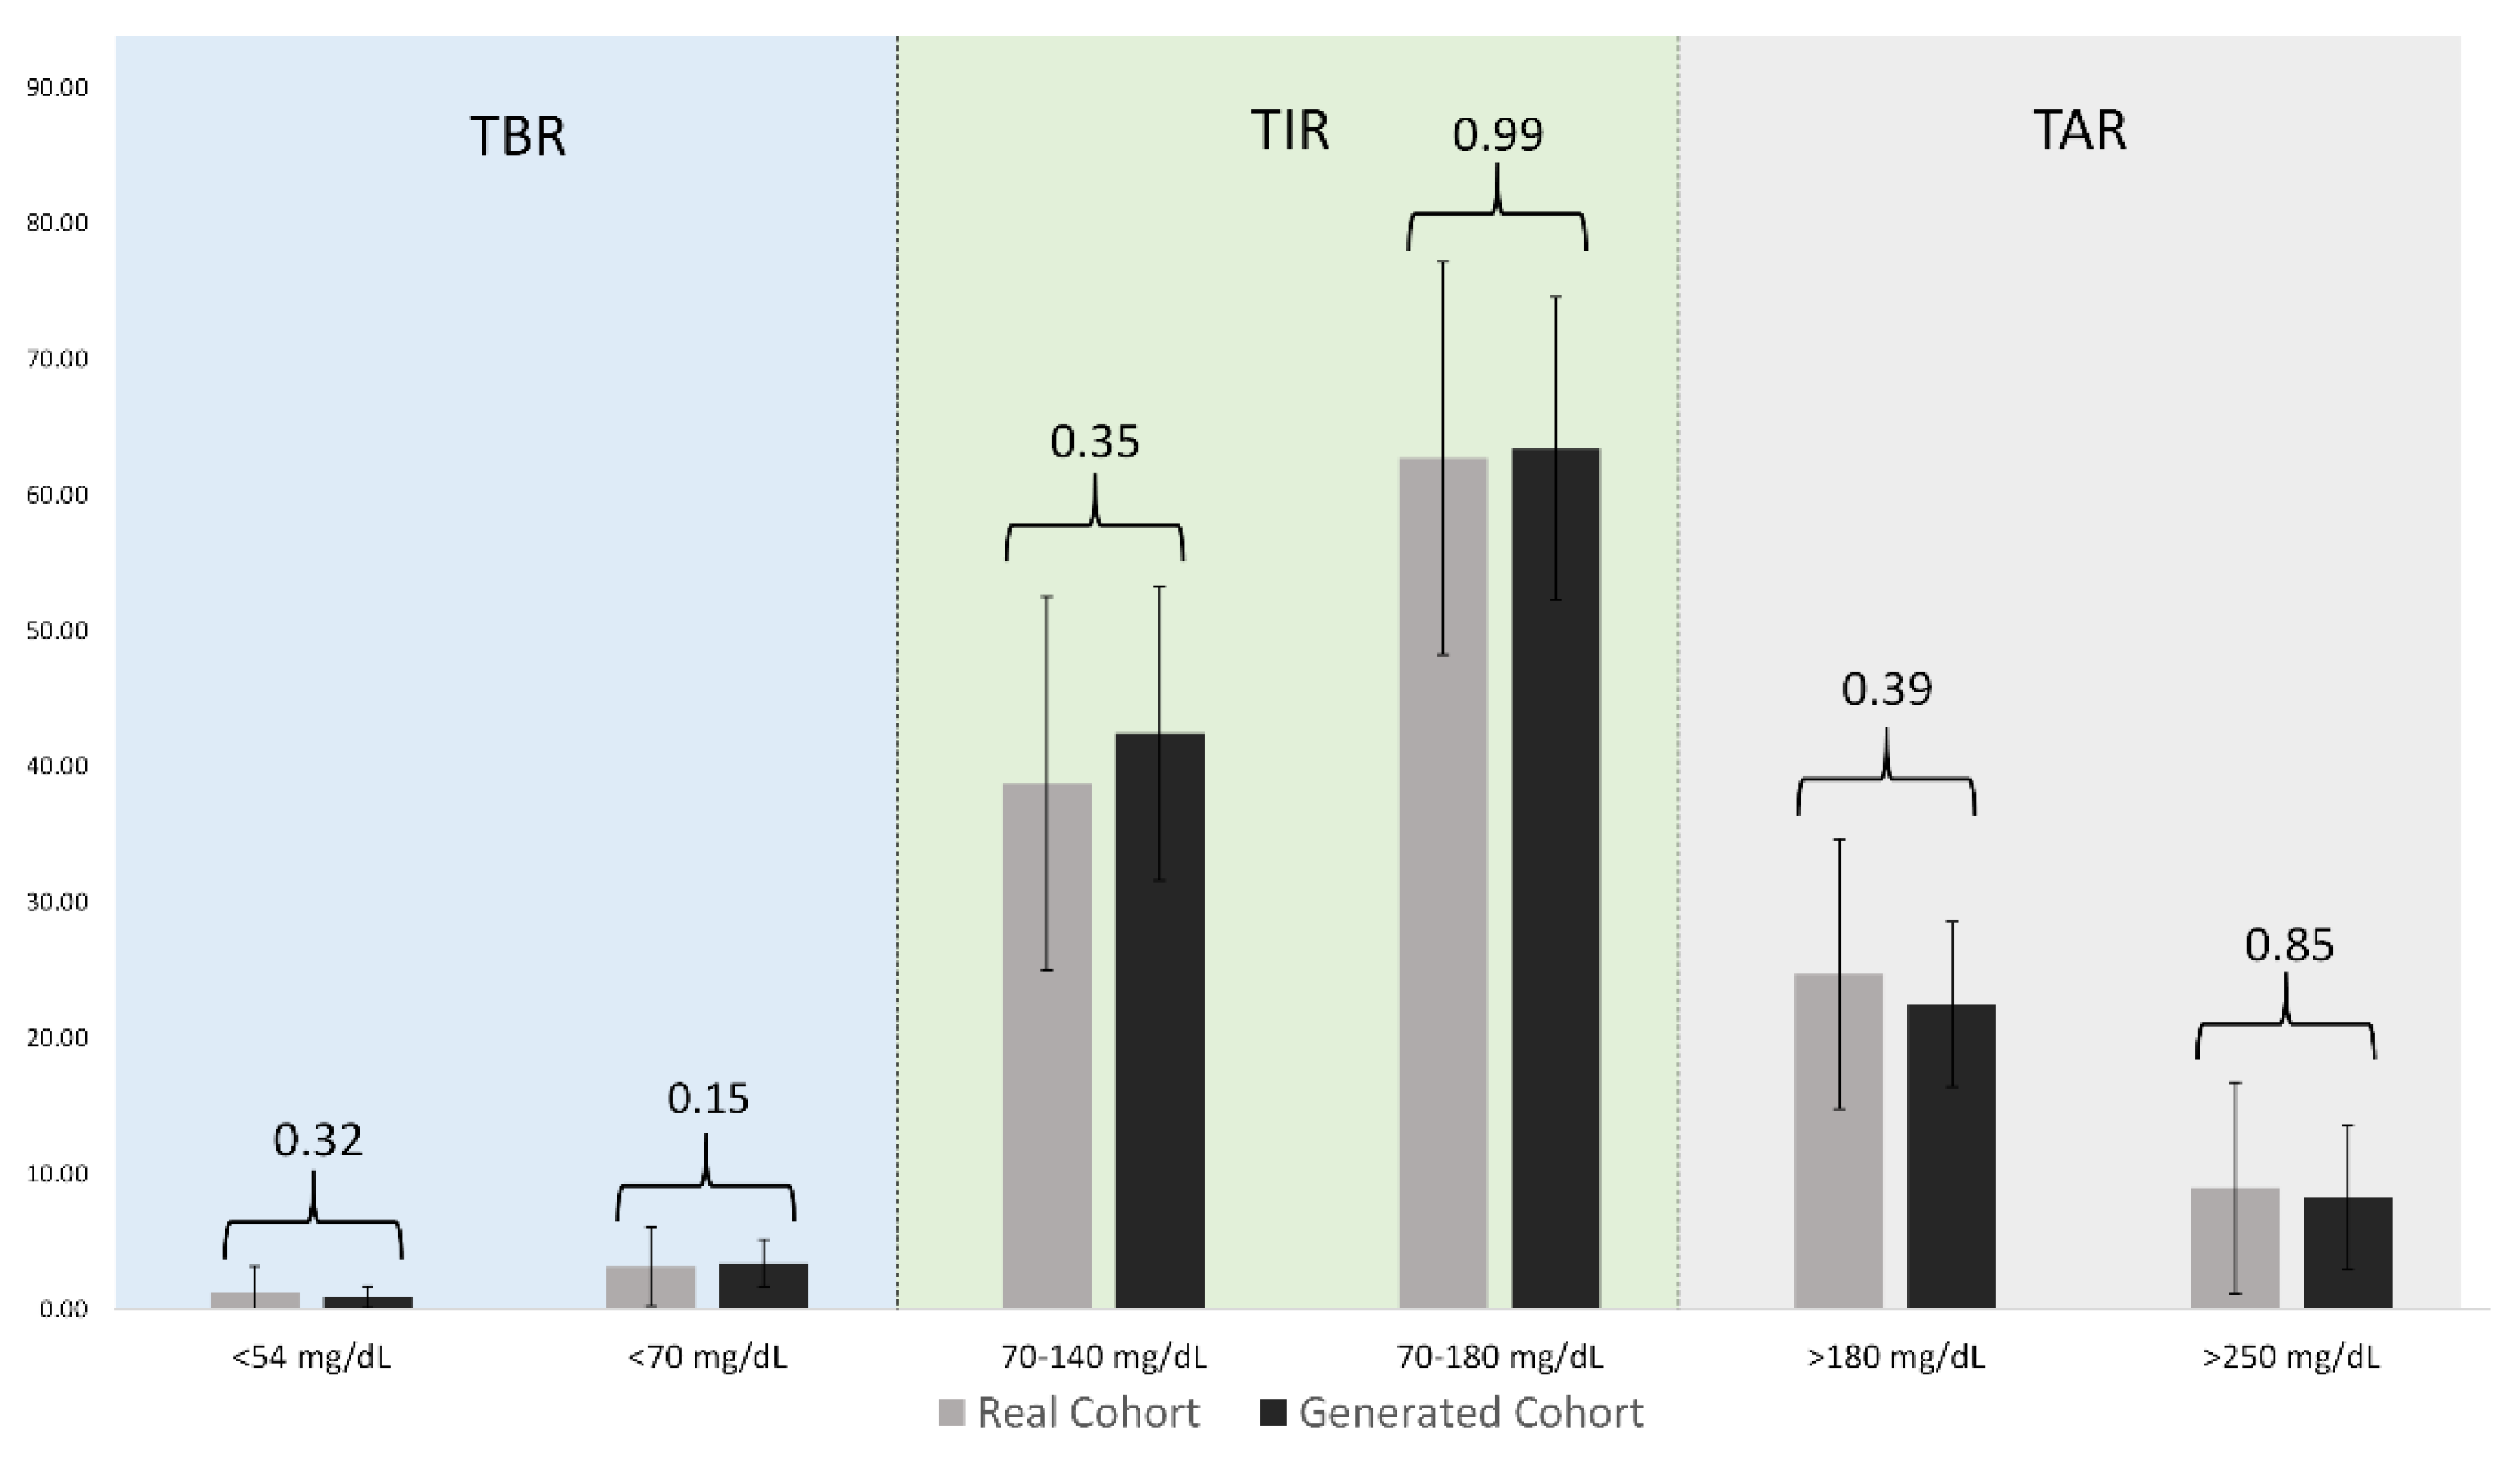
| Below 54 (mg/dL) | 1.26(0.16–1.03) | 0.90 (0.34–1.15) | 0.32 |
| 54 to 69 (mg/dL) | 3.14 (1.41–4.03 | 3.41 (2.43–4.56) | 0.15 |
| 70 to 140 (mg/dL) | 38.72 (29.32–46.81) | 42.40 (37.98–47.99) | 0.35 |
| 70 to 180 (mg/dL) | 62.68(55.64–69.45 | 63.39 (56.91–70.71) | 0.99 |
| 180 to 250 (mg/dL) | 24.70 (17.52–30.46) | 22.46 (18.34–27.51) | 0.39 |
| Above 250 (mg/dL) | 8.94 (3.43–11.75) | 8.25 (4.31–11.21) | 0.85 |
| Mean CGM (mg/dL) | 159.46 (148.06–173.86) | 157.64 (147.76–169.16) | 0.86 |
| CV (Percentage) | 35.96 (32.89–39.05) | 38.56 (35.85–41.88) | 0.12 |
| Maximum CGM (mg/dL) | 373.03 (358–400) | 389.27 (387.93–400) | 0.06 |
| Minimum CGM (mg/dL) | 43.86 (40–43) | 46.21 (40.00–50.20) | 0.25 |
| Ranges | Real Cohort | Generated Cohort | p-Values |
|---|---|---|---|
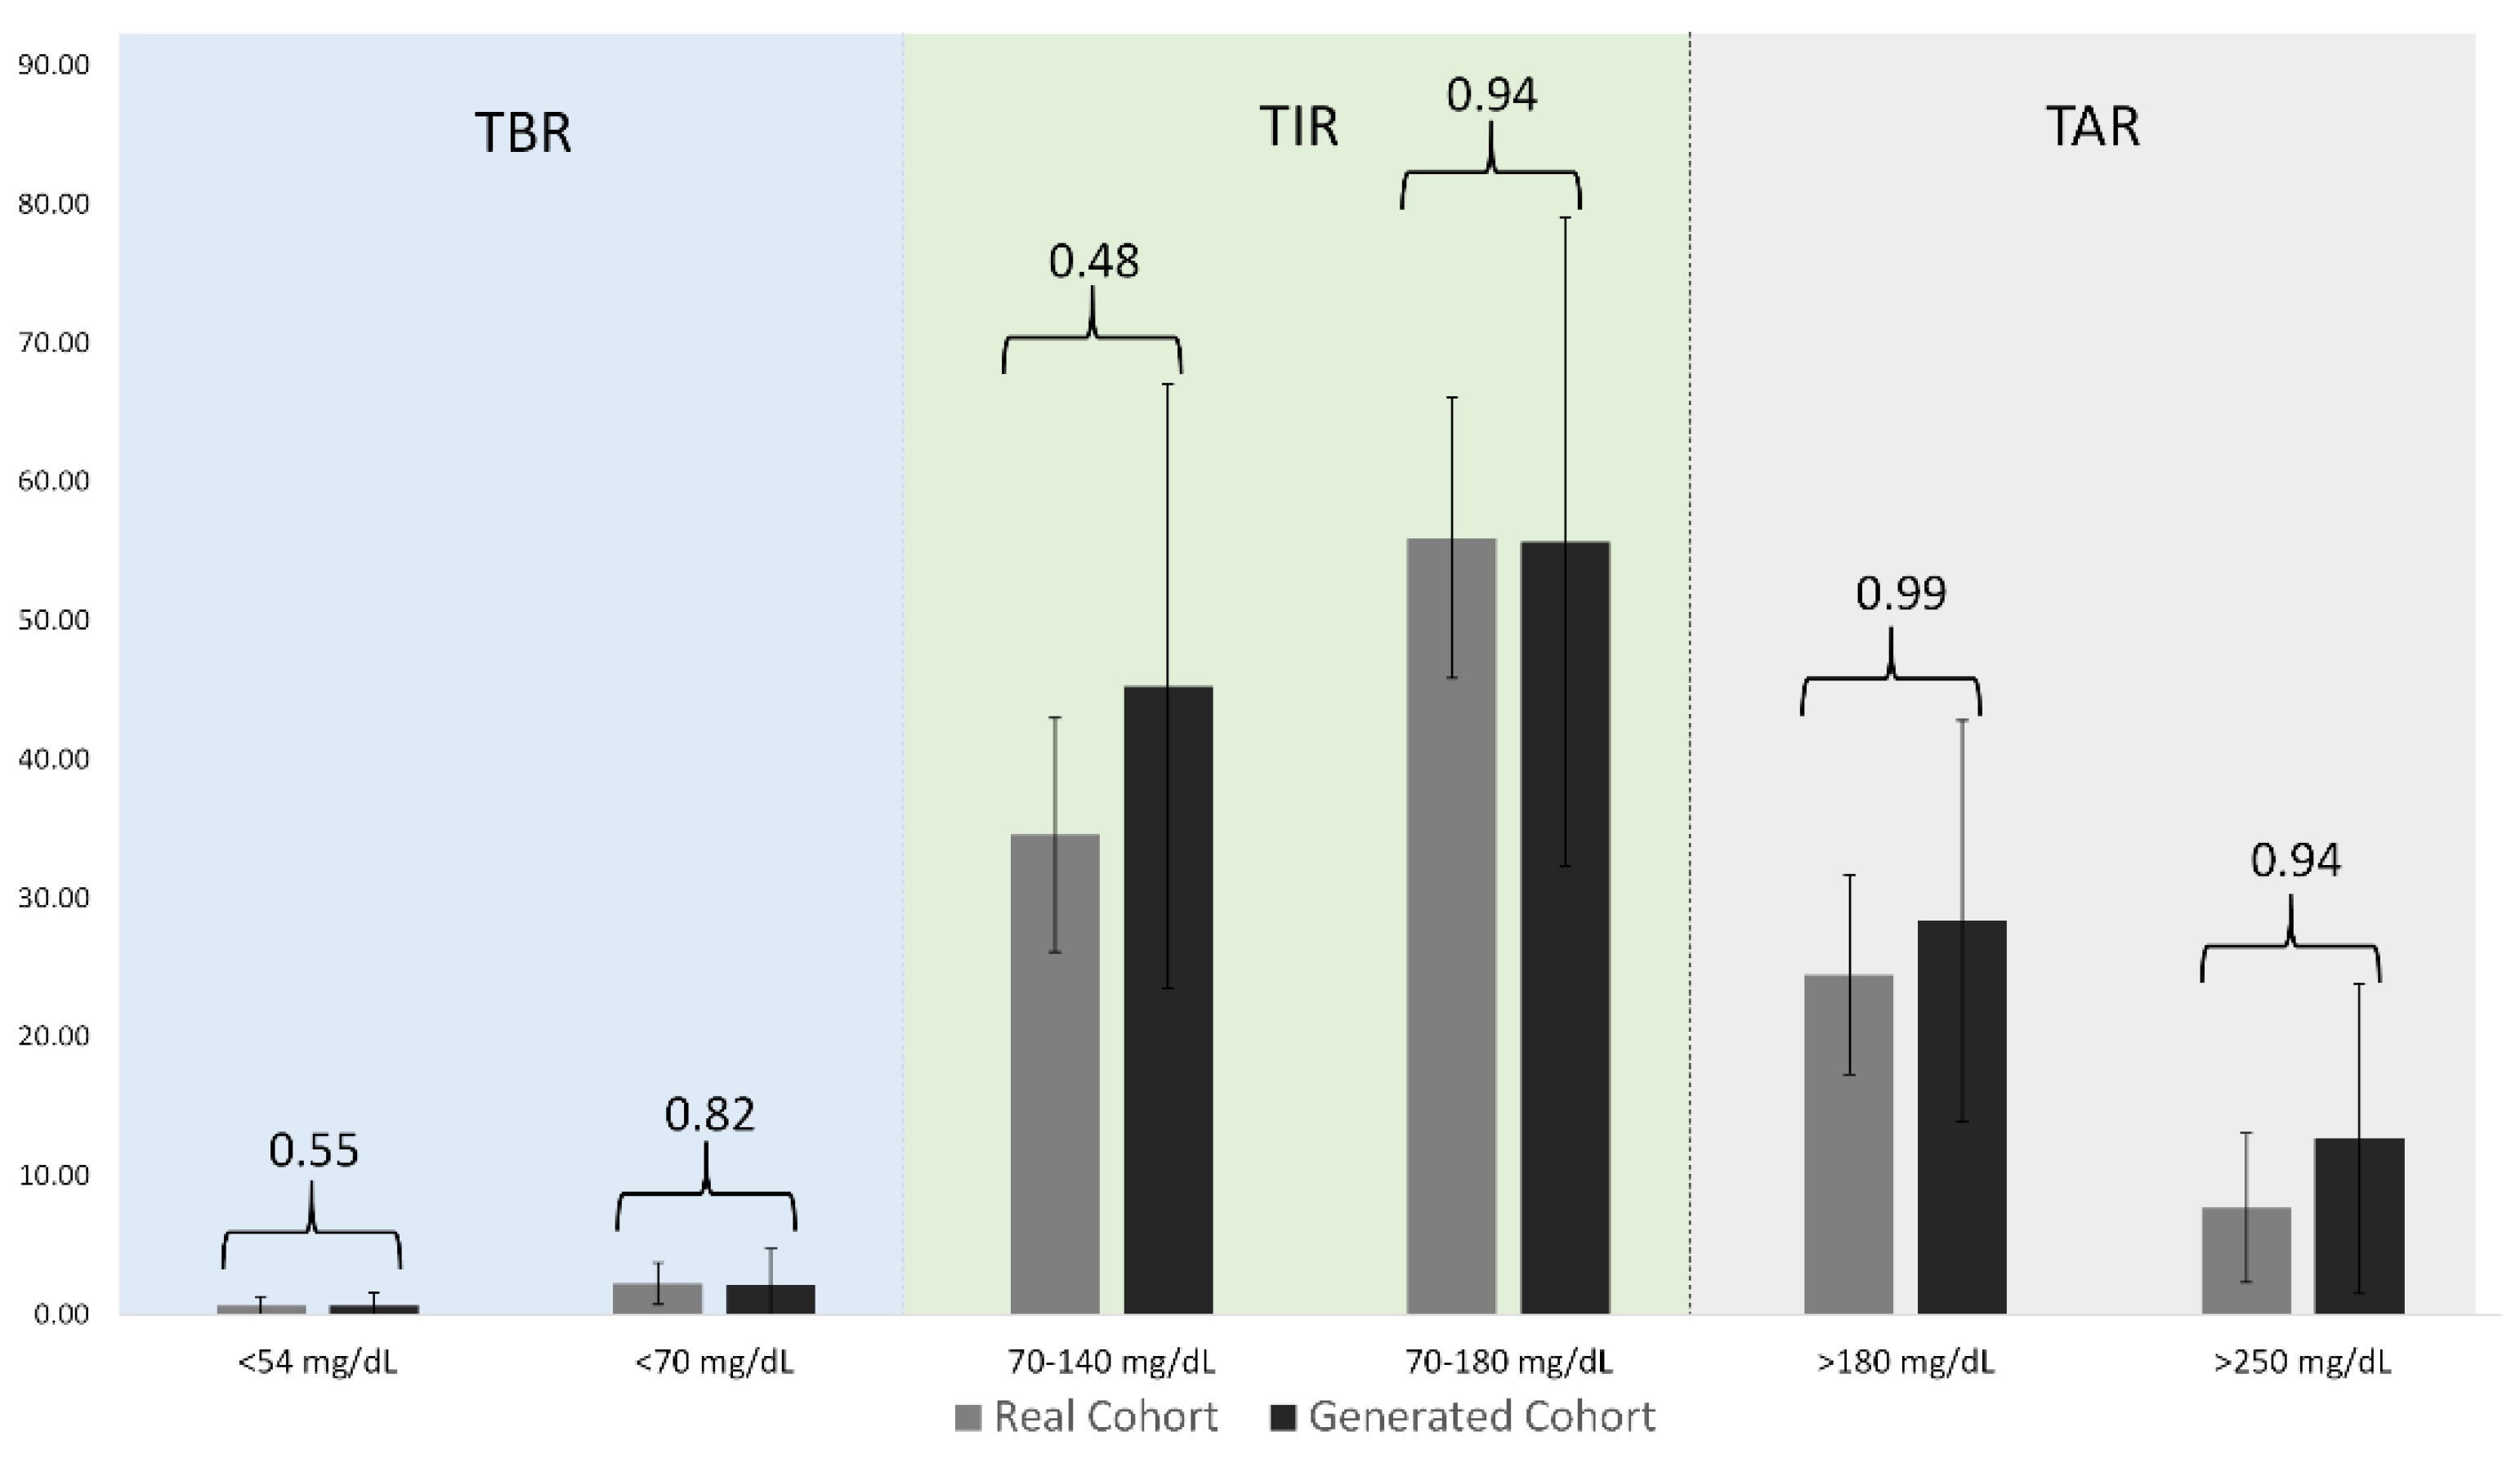
| Below 54 (mg/dL) | 0.63 (0.19–0.81) | 0.63 (0.06–0.84) | 0.55 |
| 54 to 69 (mg/dL) | 2.20(1.45–2.43) | 2.18(0.08–3.64) | 0.82 |
| 70 to 140 (mg/dL) | 34.52(32.07–40.77) | 45.24(26.33–63.36) | 0.48 |
| 70 to 180 (mg/dL) | 55.91(50.98–61.97) | 55.65(34.92–74.06) | 0.94 |
| 180 to 250 (mg/dL) | 24.45(20.23–28.49) | 28.34(15.94–38.83) | 0.99 |
| Above 250 (mg/dL) | 7.66(4.75–10.25) | 12.65(4.65–18.52) | 0.94 |
| Mean CGM (mg/dL) | 146.53(133.25–156.02) | 158.63(127.73–190.56) | 0.99 |
| CV (Percentage) | 49.28(43.60–56.20) | 40.44(34.47–45.89) | 0.31 |
| Maximum CGM (mg/dL) | 395.67(397.75–400.00) | 340.43(331.15–347.81) | 0.004 |
| Minimum CGM (mg/dL) | 41.00 (40–40) | 51.55 (40.08–62.53) | 0.12 |
Publisher’s Note: MDPI stays neutral with regard to jurisdictional claims in published maps and institutional affiliations. |
© 2022 by the authors. Licensee MDPI, Basel, Switzerland. This article is an open access article distributed under the terms and conditions of the Creative Commons Attribution (CC BY) license (https://creativecommons.org/licenses/by/4.0/).
Share and Cite
Mujahid, O.; Contreras, I.; Beneyto, A.; Conget, I.; Giménez, M.; Vehi, J. Conditional Synthesis of Blood Glucose Profiles for T1D Patients Using Deep Generative Models. Mathematics 2022, 10, 3741. https://doi.org/10.3390/math10203741
Mujahid O, Contreras I, Beneyto A, Conget I, Giménez M, Vehi J. Conditional Synthesis of Blood Glucose Profiles for T1D Patients Using Deep Generative Models. Mathematics. 2022; 10(20):3741. https://doi.org/10.3390/math10203741
Chicago/Turabian StyleMujahid, Omer, Ivan Contreras, Aleix Beneyto, Ignacio Conget, Marga Giménez, and Josep Vehi. 2022. "Conditional Synthesis of Blood Glucose Profiles for T1D Patients Using Deep Generative Models" Mathematics 10, no. 20: 3741. https://doi.org/10.3390/math10203741