Article

A Hybrid Approach Based on Principal Component Analysis for Power Quality Event Classification Using Support Vector Machines

by
Akash Saxena
1,
Ahmad M. Alshamrani
2,
Adel Fahad Alrasheedi
2,
Khalid Abdulaziz Alnowibet
2 and
Ali Wagdy Mohamed
3,*
1
Swami Keshvanand Institute of Technology, Management & Gramothan, Jaipur 302017, India
2
Statistics and Operations Research Department, College of Science, King Saud University, P.O. Box 2455, Riyadh 11451, Saudi Arabia
3
Operations Research Department, Faculty of Graduate Studies for Statistical Research, Cairo University, Giza 12613, Egypt
*
Author to whom correspondence should be addressed.
Mathematics 2022, 10(15), 2780; https://doi.org/10.3390/math10152780
Submission received: 25 June 2022 / Revised: 21 July 2022 / Accepted: 28 July 2022 / Published: 5 August 2022

Abstract

:
Power quality has emerged as a sincere denominator in the planning and operation of a power system. Various events affect the quality of power at the distribution end of the system. Detection of these events has been a major thrust area in the last decade. This paper presents the application of Support Vector Machine (SVM) in classifying the power quality events. Well-known signal processing techniques, namely Hilbert transform and Wavelet transform, are employed to extract the potential features from the observation sets of voltages. Supervised architecture consisting of SVM has been constructed by tuning the parameters of SVM by various algorithms. It has been observed that Augmented Crow Search Algorithm (ACSA) yields the best accuracy compared to other contemporary optimizers. Further, Principal Component Analysis (PCA) is employed to choose the most significant features from the available features. On the basis of PCA, three different models of tuned SVMs are constructed. Comparative analysis of these three models, along with recently published approaches, is exhibited. Results are validated by the statistical one-way analysis of variance (ANOVA) method. It is observed that SVM, which contains attributes from both signal-processing techniques, gives satisfactory results.
MSC:
68T01; 68T05; 68T07; 68T09; 68T20; 68T30

1. Introduction

In recent years, increasing demands and a competitive business environment have put a heavy burden on grid utilities. With modern power electronic devices, Power Quality (PQ) has become a major concern. In PQ problems, the deviation of voltage and current is observed from the ideal waveforms. Ideal voltage/current waveforms are sinusoidal signals of constant frequency and constant amplitudes [1]. Researchers have come forward with new approaches, designs, and hypotheses to improve the quality of power. Improvement of the quality refers to three common approaches namely identification, determination, and removal of the above said deviations from the voltage/current signals. Electromagnetic transients are the root cause of the PQ problems. These transients are occurred due to switching actions, lightning strokes, fault clearing mechanisms obtained by fuses, capacitor bank operation and end-user equipment switching [2]. Moreover the major causes of degradation in PQ are voltage sag, swell, flicker, notch, transients and harmonics [3,4,5,6,7,8,9,10,11,12,13,14,15]. PQ events recognition is an important issue for the development of the subsequent generation. This recognition can be done in two folds: firstly the employment of signal processing techniques like Wavelet transform [5,9,12,13] Discrete Fourier Transform (DFT) [4], Fast Fourier Transform (FFT) [5], Kalman filtering [3] and S-transforms [6,7,8,11] to extract few representative disturbance signals and secondly to use a supervised learning based paradigm for classification of the disturbances. Signal processing techniques are used for the separation of the disturbed signals into their frequency components. These processed frequency components with statistical attributes are characterized as features for classification. Traditionally Fourier transforms (FTs) are considered a powerful tool to analyze the frequency content of the signals. However, FTs are not efficient to extract the transient information from non-stationary signals [2]. Moreover, the non-stationary nature of PQ events also presents difficulty in the detection of disturbance waveforms. Recently, a Wavelet transform approach is applied by Yong et al. [9]. In this approach, one v/s and multiclass SVMs were employed. A three-stage algorithm namely preprocessing, feature extraction, and classification was employed in work [9]. Optimal feature selection by using k means aripori algorithm is performed in [13]. In the nine-level multiresolution analyses, Wavelet transform coefficients were obtained and a feature of having 90 dimensions is extracted from the signal data. SVM is used as a binary classifier to classify different events. Although Wavelet transforms are an efficient technique for feature extraction in the time and frequency domain, yet the excessive computation, vulnerability to the noise levels and dependency of the accuracy on the choice of mother wavelet make it less efficient for this recognition to be carried out. Another important methodology to detect PQ events is S-transform. Recently Biswal et al. [10] employed S-transform to extract the features from the disturbance signals by using a decision tree methodology. However, the decision tree methodology and several decision steps of the optimization algorithm caused time delay in classification. Short-Time Fourier Transform (STFT) was also employed in some approaches [4,5]. The quality of STFT is to divide the full time intervals into segments. However, the fixed window width of STFT is a significant limitation. The high-frequency signals, with multiple occurrences, pose a difficulty to detection. Recently, an interesting study of harmonic estimation with the application of a modified version of ACSA has been done in reference [16]. Till now various supervised learning models have been applied for the recognition of the PQ problems by researchers. These are namely Feed Forward Neural Network (FFNN), Radial Basis Function Neural Network (RBFNN) [15], Fuzzy classifiers [4,14], Modular Neural Networks [8], Probabilistic Neural Network [6] and Support Vector machines (SVMs) [9,10,12,13,17,18,19,20]. In some approaches Fuzzy classifiers are used along with Wavelet transforms [14], in which fuzzy classifier is advocated as a crisp classifier. The problem with fuzzy approaches is that there are no certain boundaries and a clear mathematical relationship between dependent and independent variables. For this reason, in many real classification problems, these approaches are not able to classify the events in an efficient manner. In the past, various approaches related to a single signal processing technique are observed and analyzed for PQ event classification problems. However, the combination of different signal processing techniques and statistical attributes of those remains unexplored. Further the reference [21], reports the application of optimized Bayesian convolutional neural networks for the classification of PQ events. The application of Variational Mode Decomposition and deep learning classifier (simple feed-forward neural network) has been employed for the classification of PQ events under the presence of distributed generation sources [22]. A Grey wolf Optimizer (GWO) based Extreme Learning Machine approach has been reported in reference [23]. The reference [24] reports the application of Discrete Wavelet Transform (DWT) on PQ data along with starting current data to identify the broken rotor bar and bearing fault in induction motors with a neural network for detection. A combined application of chirp mode pursuit and Grasshopper Optimization Algorithm has been reported in reference [25]. Real-time PQ analysis is conducted in reference [26].
The approaches pertaining to SVMs often employs optimization algorithms for tuning hyperparameters. As a parameter, tuning of the support vector machine always plays a critical role in the performance of classification accuracy. A hybrid algorithm-based approach has been proposed in reference to the identification of fault diagnosis of rotating machinery. The authors employed a hybrid algorithm called GWO and Sine Cosine Algorithm [27]. The GWO-based approach has been employed in the work for tuning the hyperparameter for the classification task [28]. In view of the above, the following literature review and objectives are formed for this work:
  • To analyze two well-known signal processing techniques namely Hilbert and Wavelet transform for the PQ event classification problem.
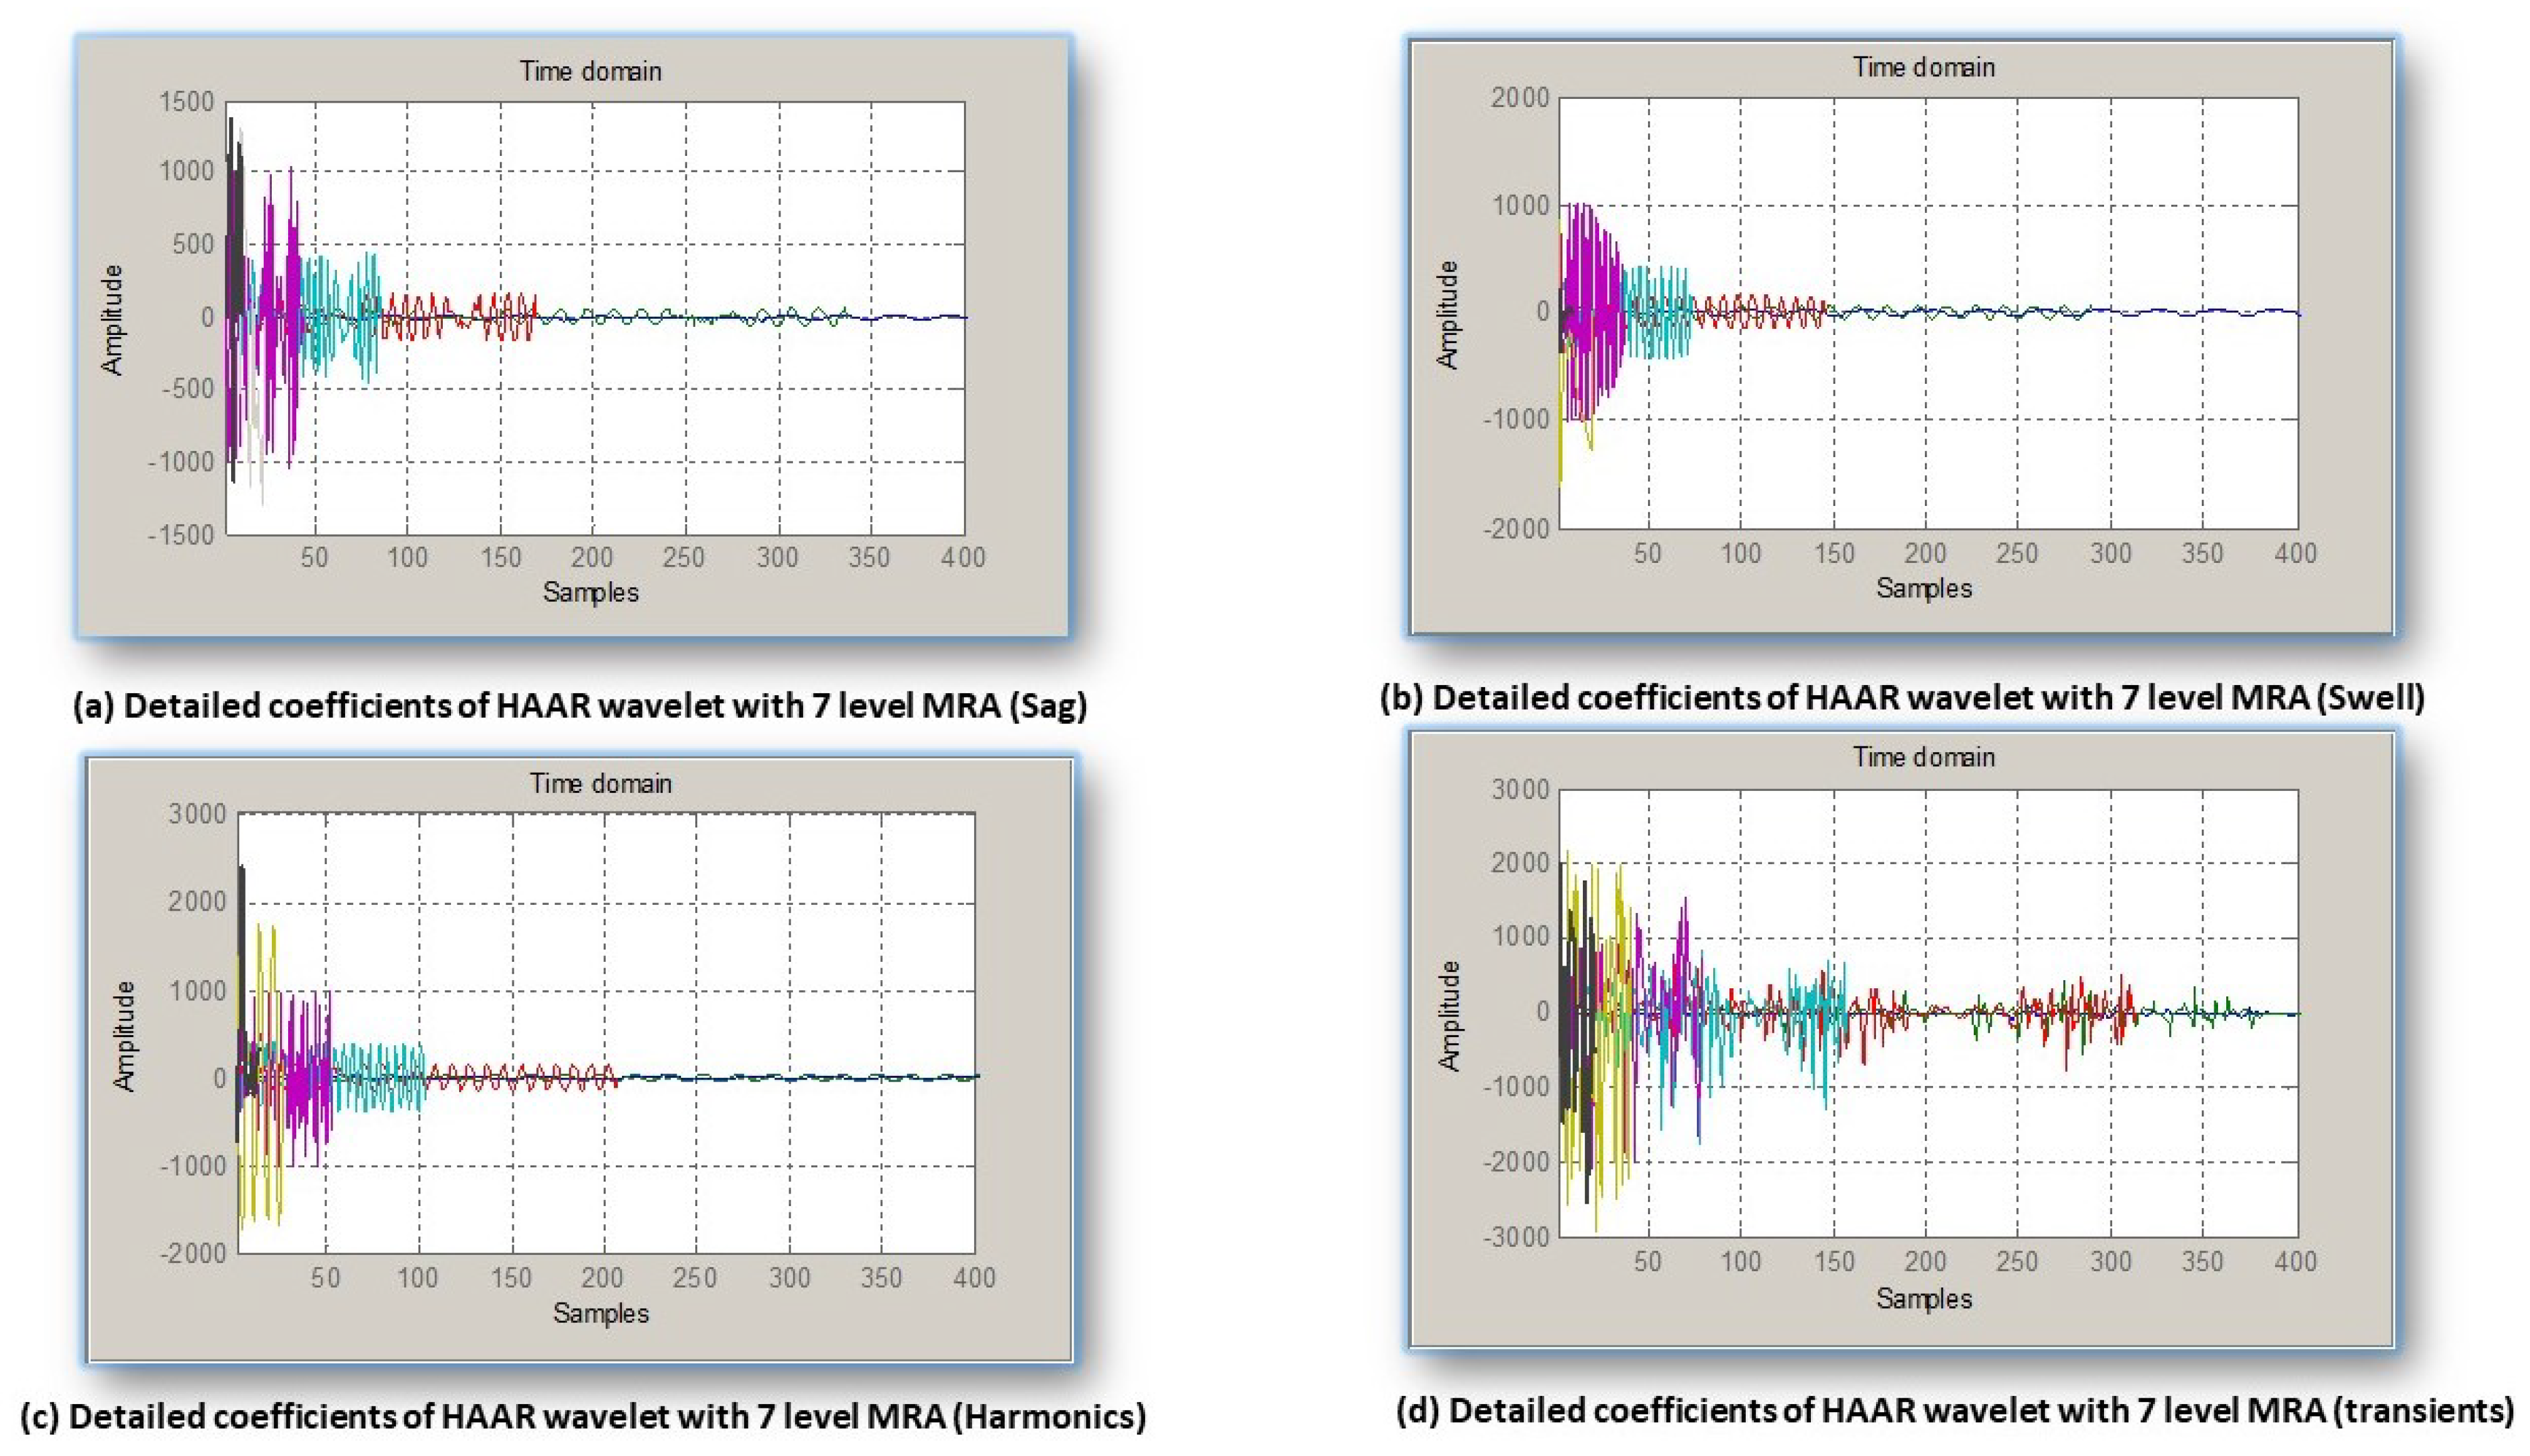
  • To perform the seven-level Multi-Resolution Analysis, in order to obtain the detailed and approximation coefficients of Wavelet transforms.
  • To perform optimization with the help of a recently published advanced metaheuristic algorithm for hype parameter tuning of SVM and present a comparative analysis.
  • To perform Principal Component Analysis (PCA) for choosing the efficient input features from the given 9 features.
  • To build different modules of Support Vector Machines (SVMs) with the permutations of different efficient input features and present a comparison between these different modules on the basis of standard error indices.
  • To test the efficacy of the proposed module by the statistical ANOVA test.
The remaining paper is organized as follows, In Section 2, system description along with preliminaries of PQ is discussed. The details of Hilbert and Wavelet transform are given in Section 3. Basics of SVM and tuning results are given in Section 4. In Section 5 PCA is discussed, following to this, results and conclusions are presented in Section 6 and Section 7, respectively.

2. Materials and Methods

PQ disturbance classification is a potential area of research during the last decade. This section presents basic details for framing classification engine for PQ events.

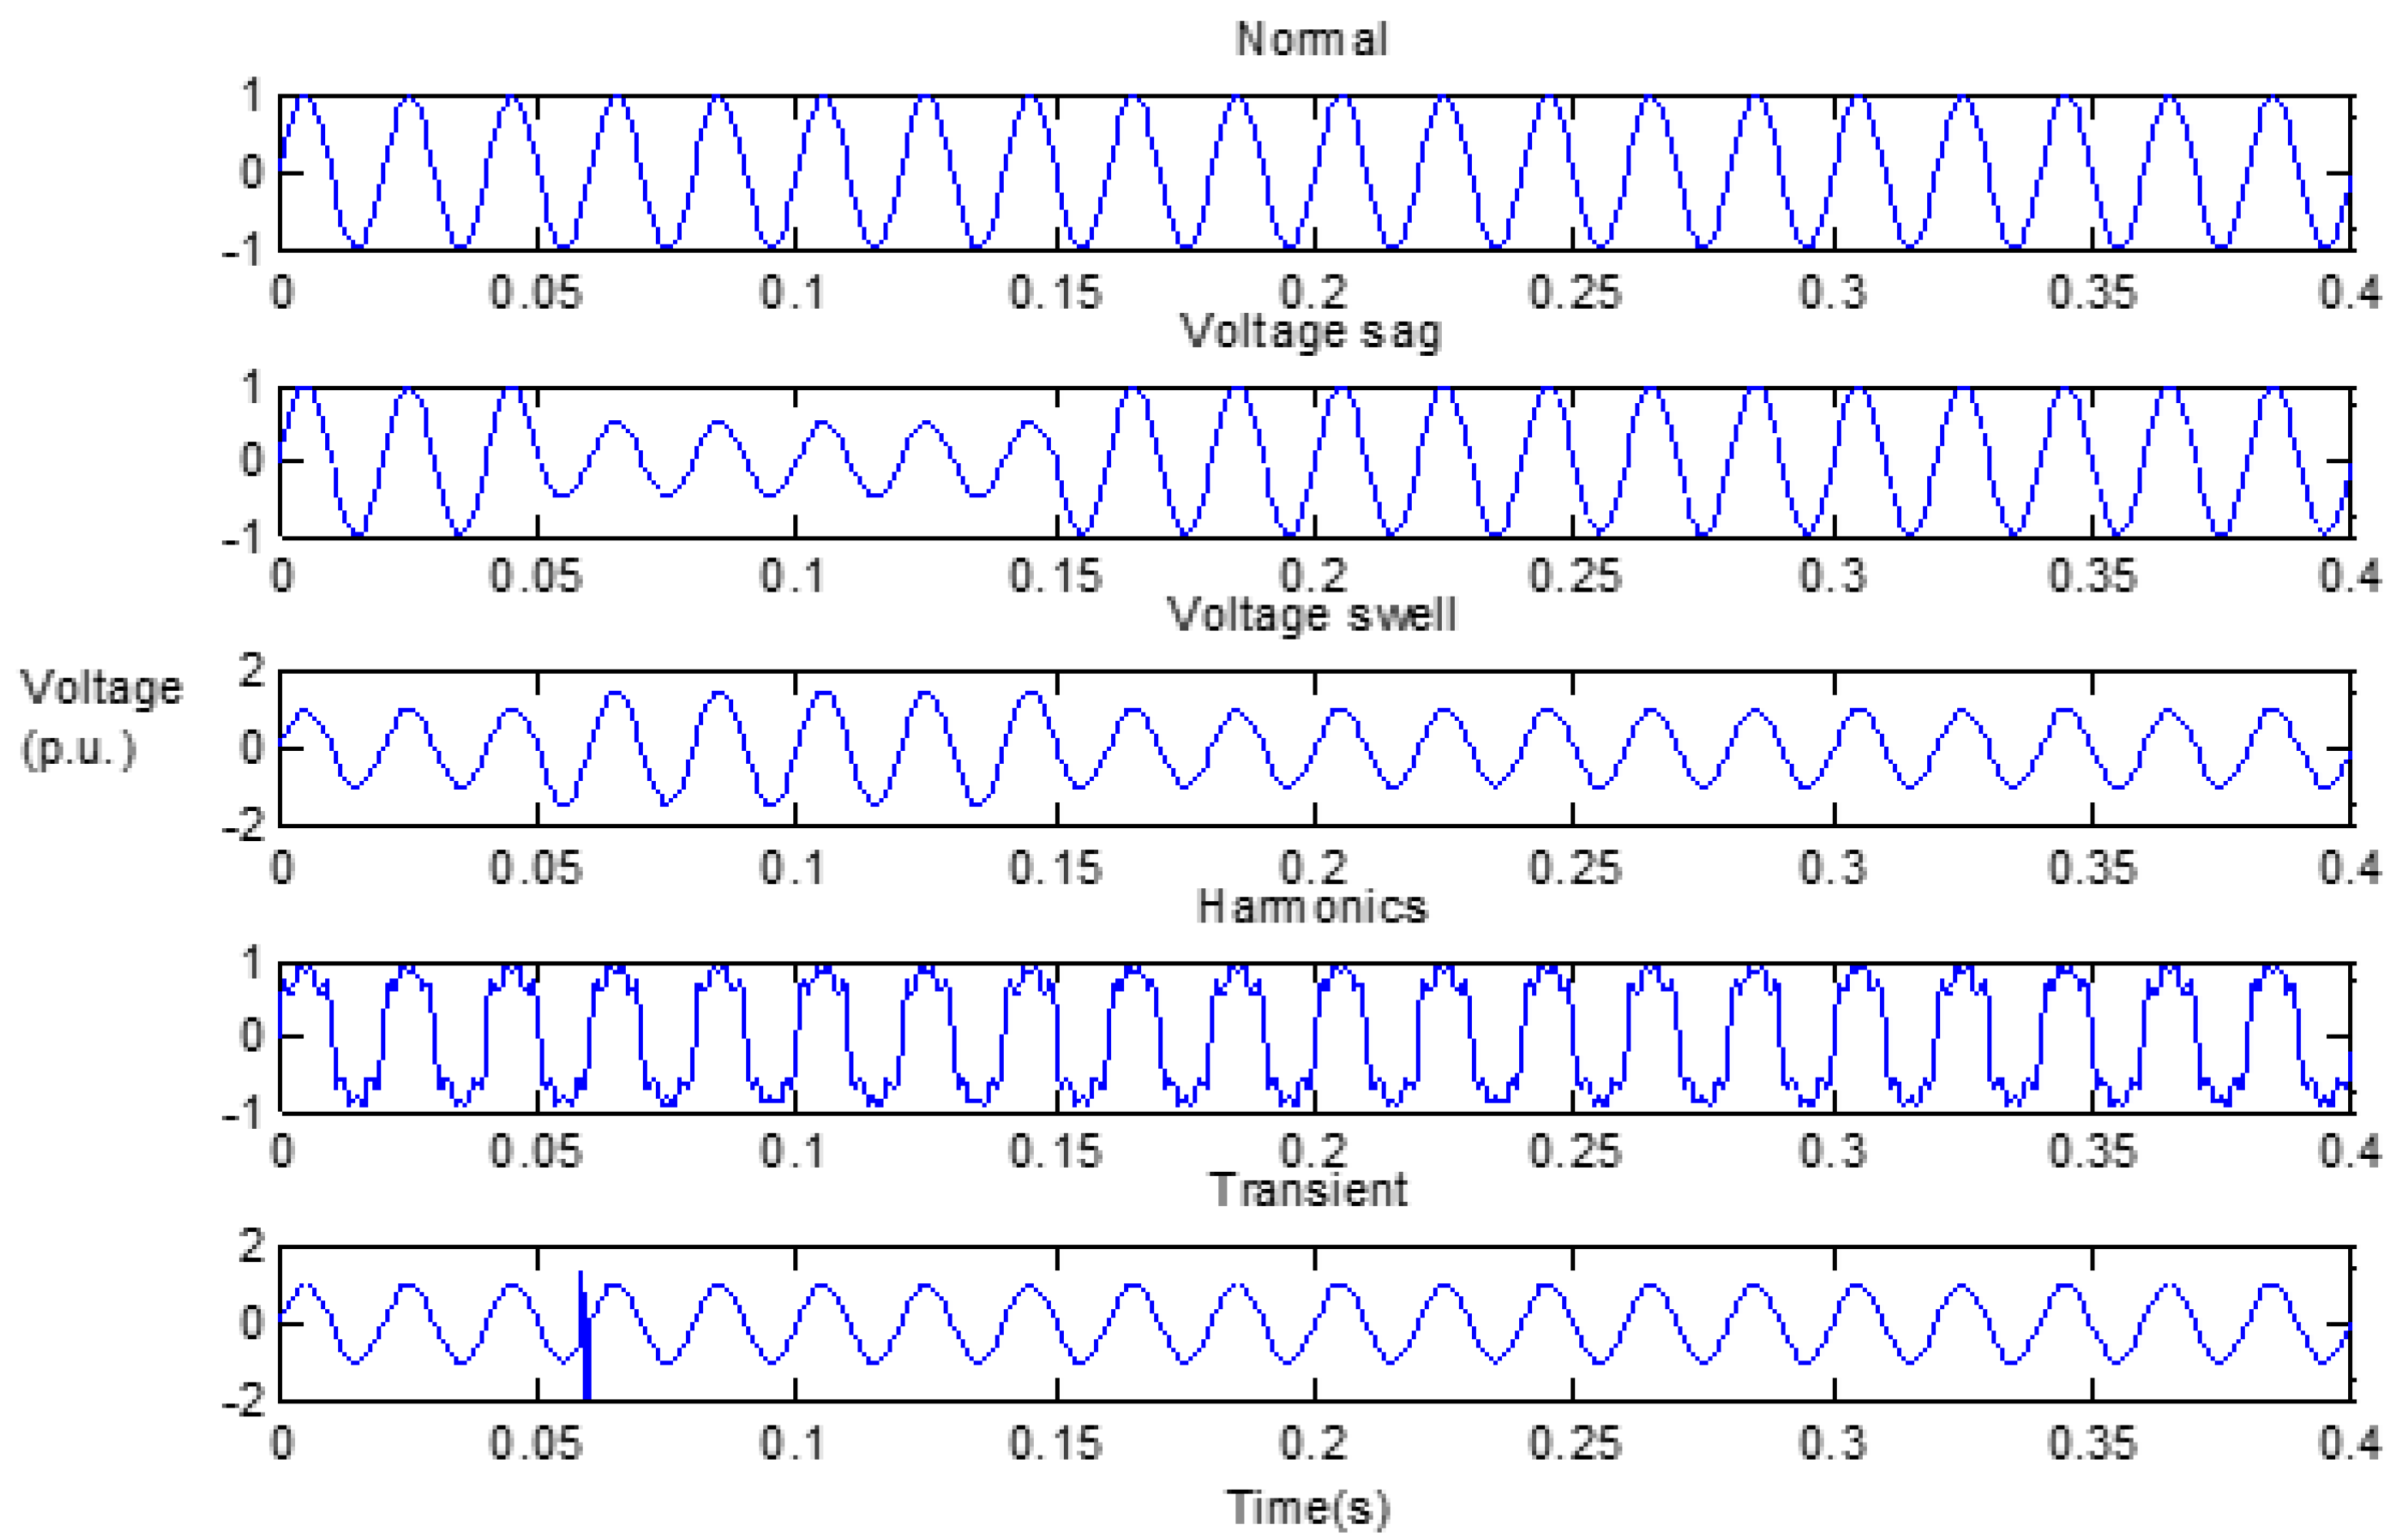
2.1. Power Quality Events

PQ events are broadly classified into three categories namely short-term duration variations, e.g., sag, swell, interruptions [1]. Time durations of these events vary from a few cycles (5 cycles) to a minute. The second important category is the long duration, which consists of sustained interruptions, under voltage and overvoltages over a long time. The third category is transients. Description of the events along with the pictorial representation is exhibited in Table 1 and Figure 1 [29].

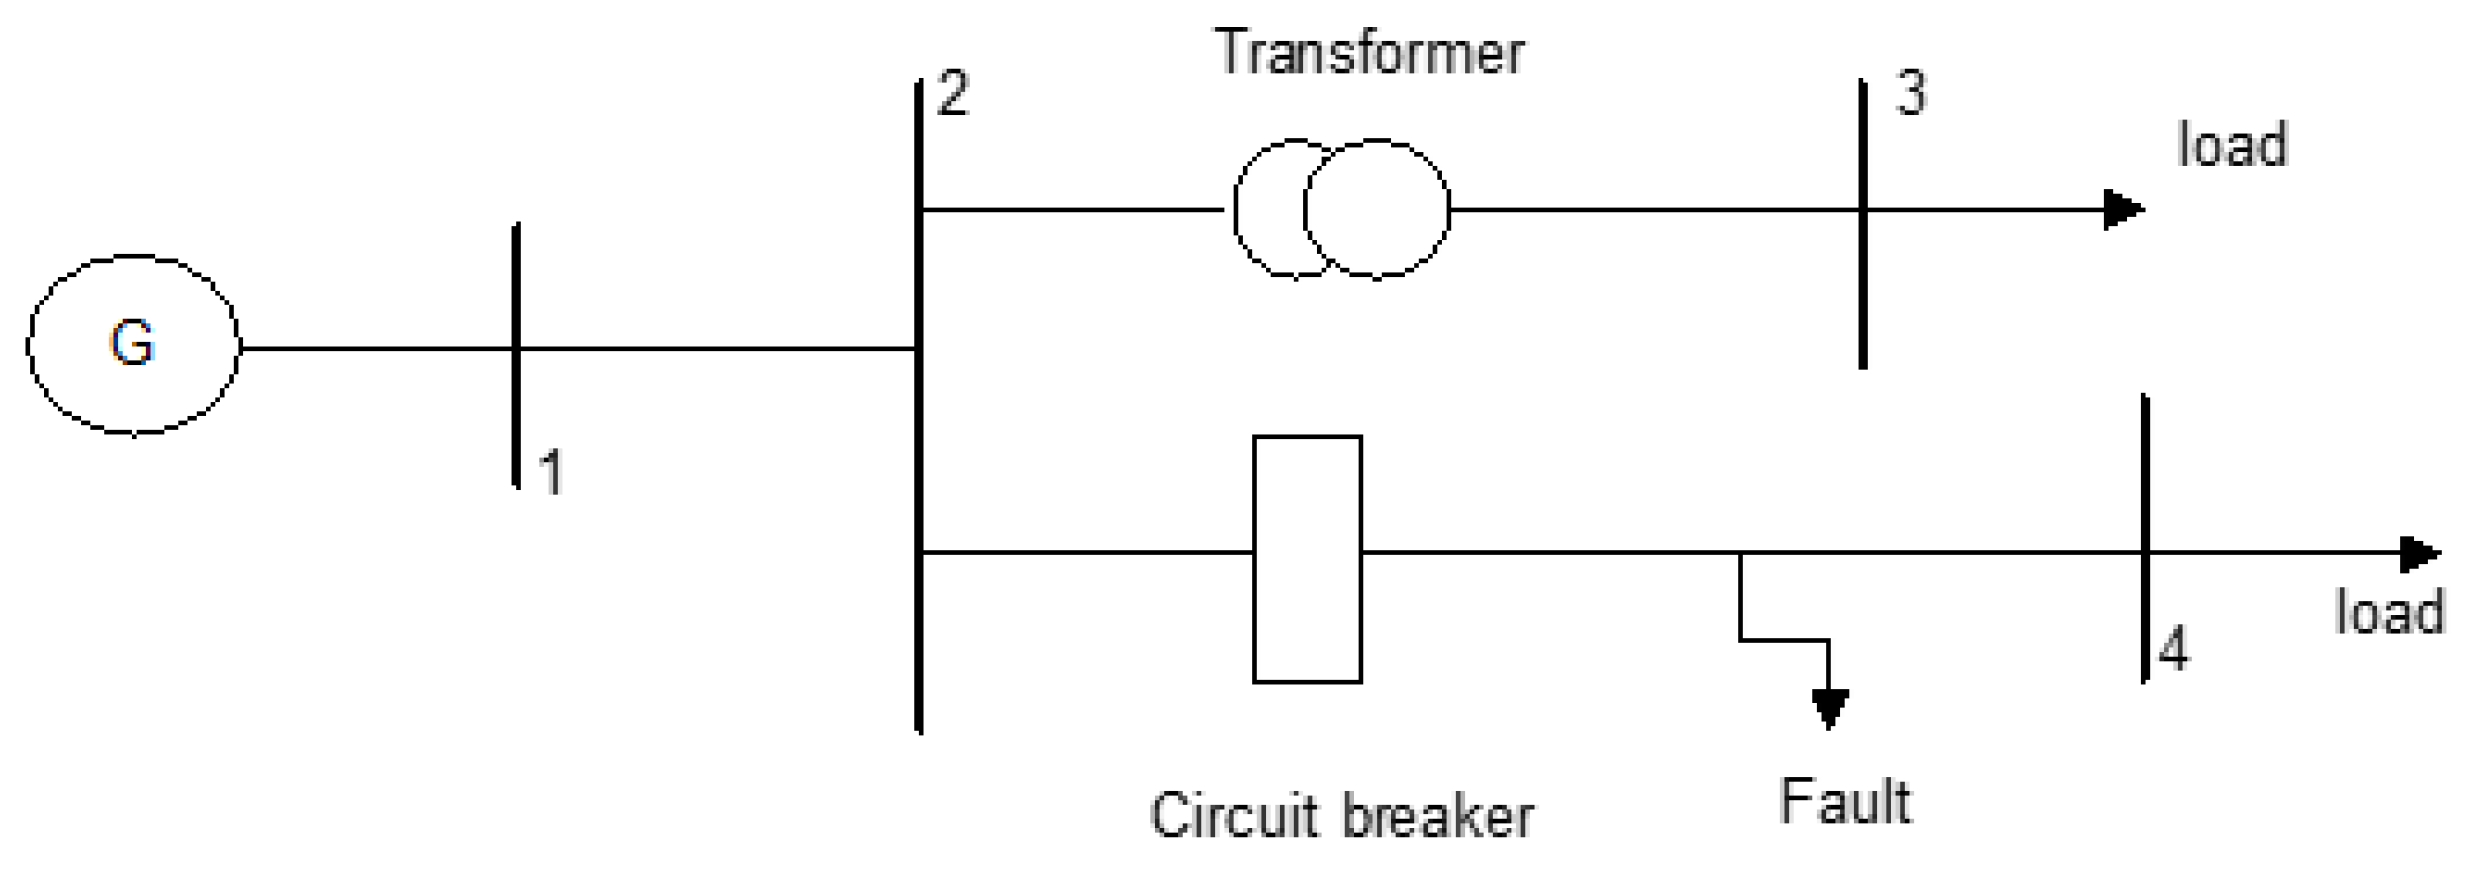
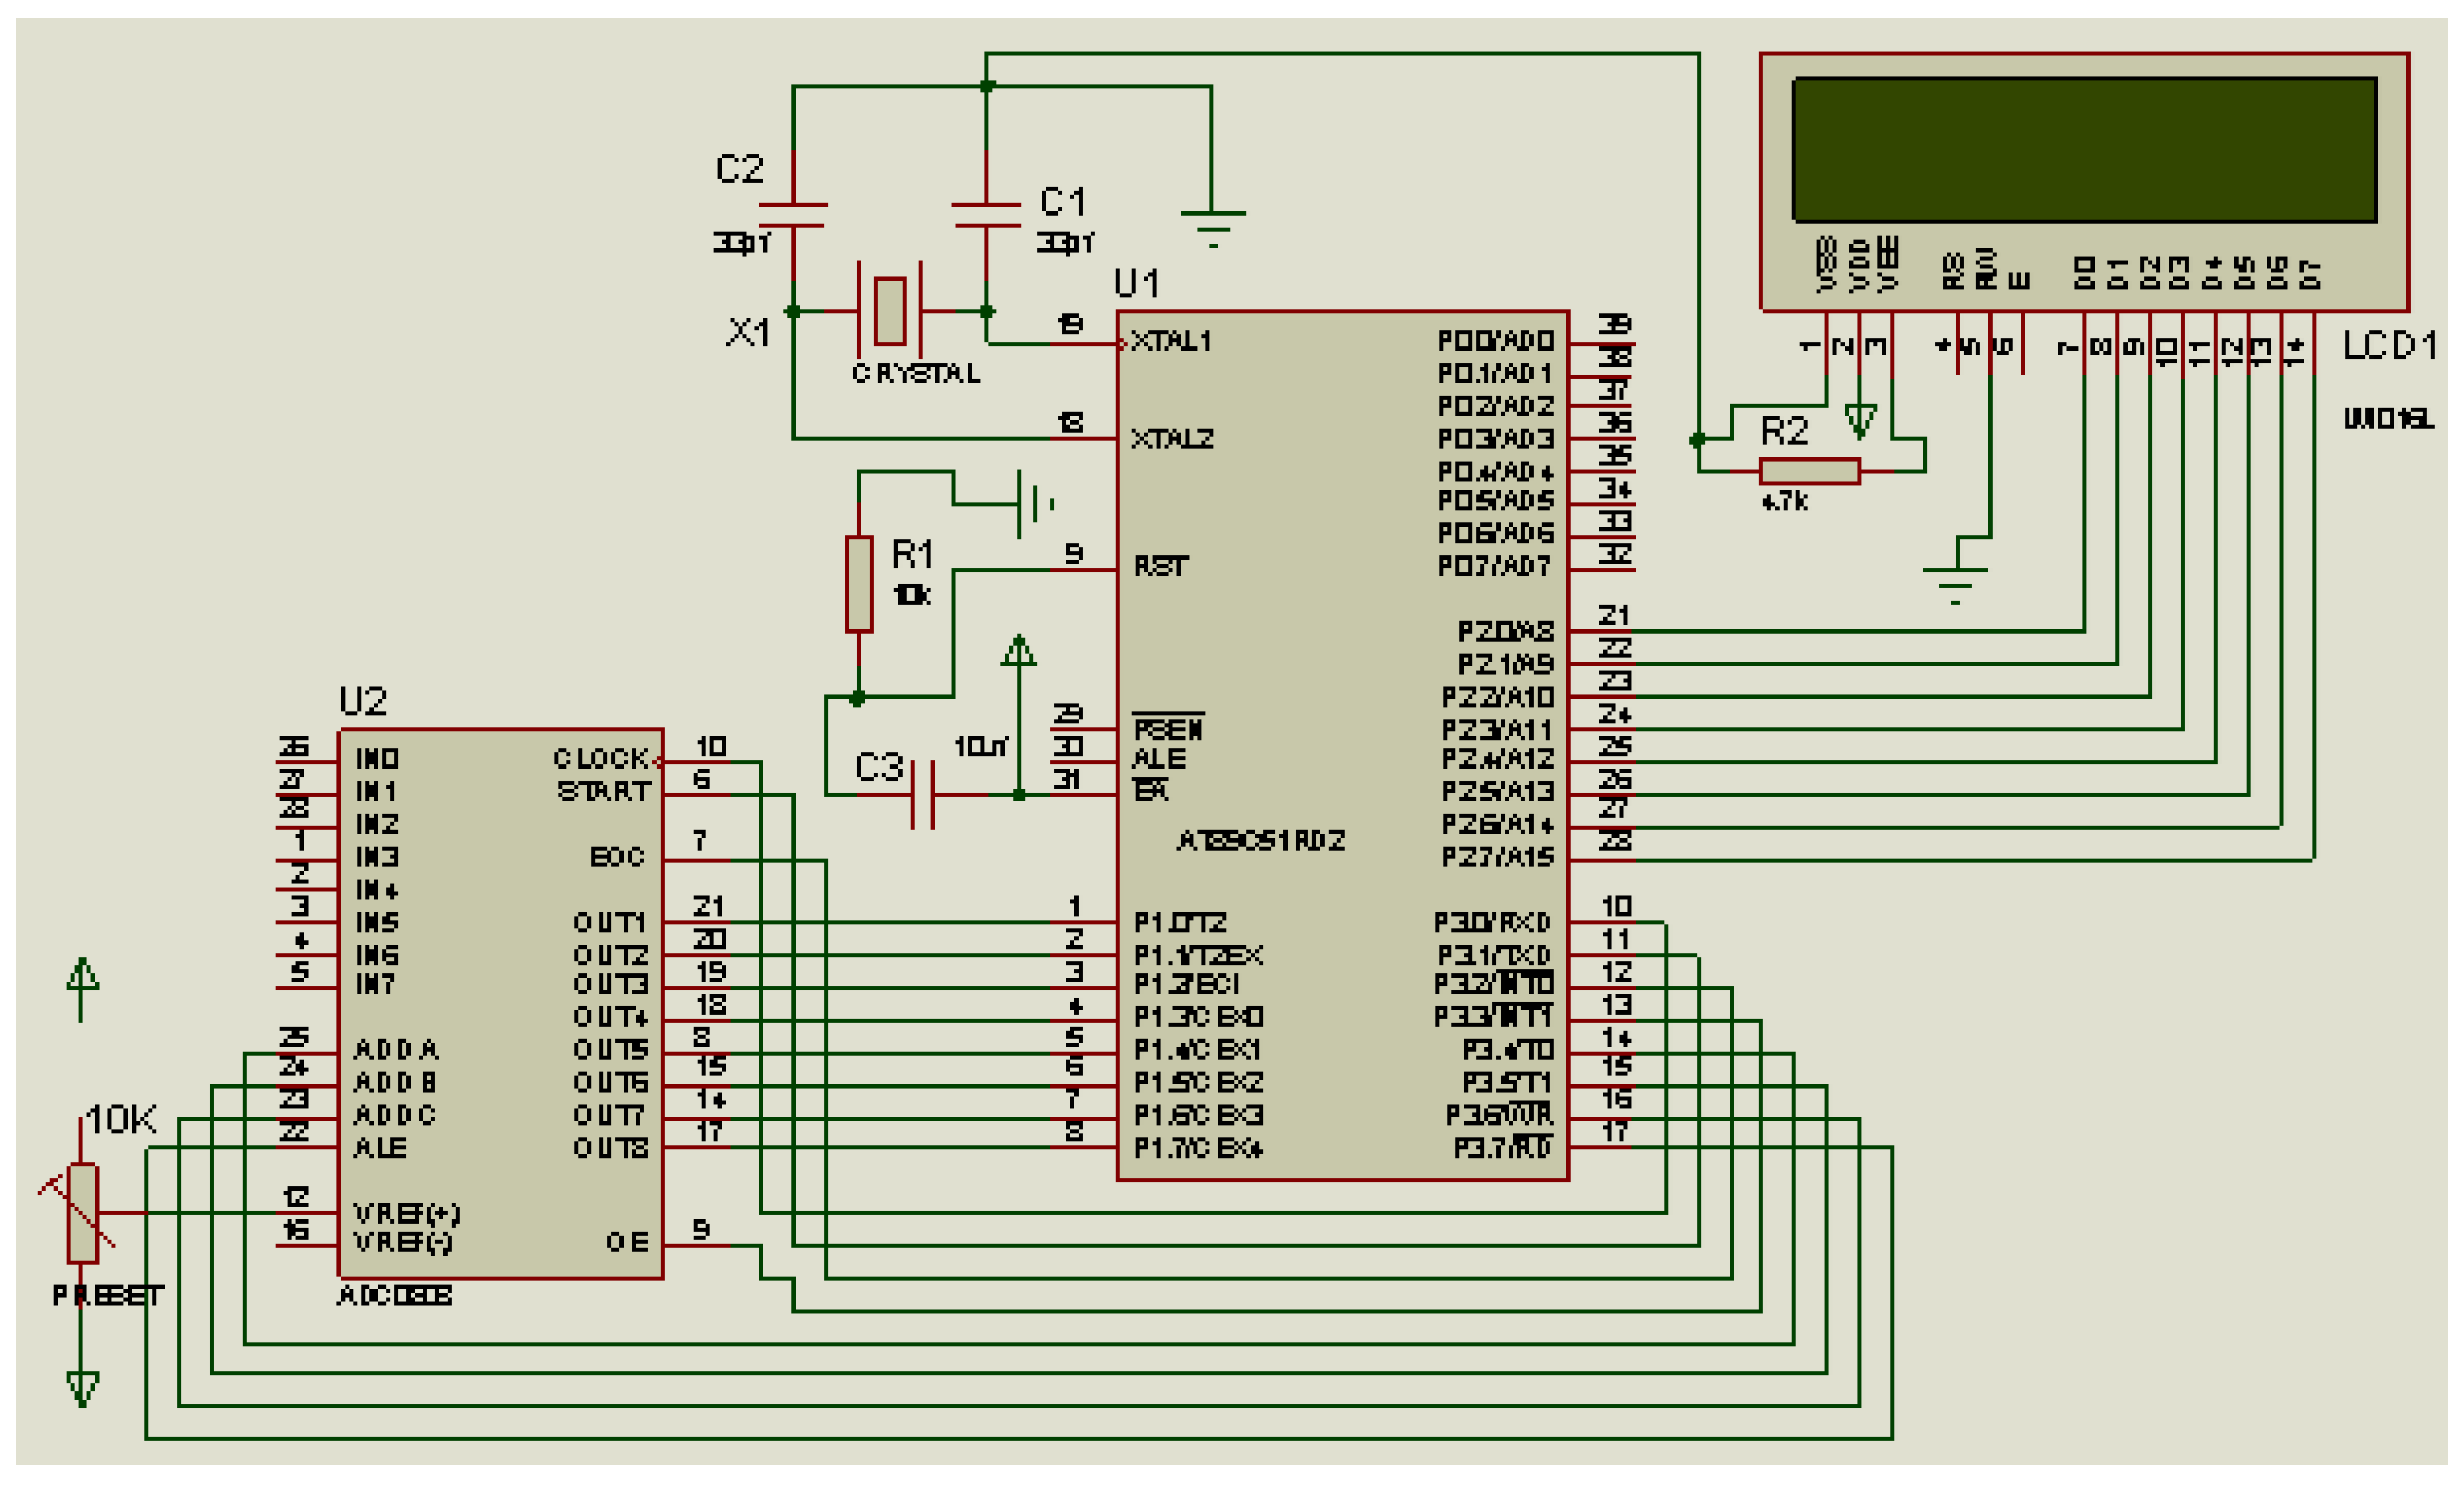
2.2. System Description

To simulate this work a simple test network along with a laboratory setup, is shown in Figure 2 and Figure 3. A three-phase power system (400 volts (line to line), 50 Hz) with a 100 km long transmission network terminated by an RL load of 10 ohms, 0.005 Henry is considered and simulated in Matlab Environment.
To analyze the system voltages, a potential transformer is employed with an Analog to Digital Converter IC-ADC 0808/0809. This chip is employed to convert analog signals into digital signals. This IC is an 8-bit IC; input three-phase voltages are given on input channels 0–2. The 8051 (Philips) P89V51RD2 microcontroller is the main processing unit for calculating the Hilbert and Wavelet transforms. The unit analyzes the output voltages along with the statistical attributes of features (standard deviations, mean, max, min, and norm values).
A seven-level Multi-Resolution Analysis (MRA) is processed for Wavelet transforms. The detailed coefficients window is shown in Figure 4a–d. Further, the digital to analog conversion is done with the help of DAC to show the status of waveforms. The responses under different operating conditions are analyzed by the controller and used for validation of the results of SVMs. The program for the micro-controller is written in C language. Liquid Crystal Display (LCD) 16 × 2 is used to display the results. In the first row, the initial five digits represent the target classes for all voltages. Target classes are shown in Table 2.

3. Signal Processing Techniques

In PQ events identification problems, the employment of an effective signal processing technique to extract significant features from the signals is the fulcrum of the module. In this section preliminaries pertaining to Wavelet and Hilbert transforms signal processing techniques are presented.

3.1. Wavelet Transform

In past, Wavelet transform shows the extraordinary capability to extract features in terms of detailed and approximate coefficients belonging to different event types. In reference [11], the coefficients associated with different levels along with statistical attributes of the coefficients are employed to train the neural networks. However, this procedure has a large number of input features according to different levels and incurs a heavy computational burden. Choice of mother Wavelet is also a critical issue in the Wavelet transforms. In this work “Haar” Wavelet is chosen for the feature extraction. “Haar” Wavelet is the simplest possible Wavelet and can be utilized for the analysis of signals with sudden transitions. A seven-level MRA is performed to extract detail and approximate coefficients. The detail and approximate coefficients alone are impractical to apply as inputs to the classifier. Hence, for each decomposition level, feature extraction methods are implemented. The energy at the decomposition level is given by the following equations:
E i = l = 1 n D i l 2 i = 1 , 2 , , 7
K i = l = 1 n A i l 2
l is the decomposition level and n is the number of coefficients of detail or approximations at each decomposition level. Statistical attributes namely maximum, minimum, norm, mean values, and standard deviations of these coefficients at different decomposition levels are taken as the features. Figure 4a–d presents Detailed coefficients in a single window analyzer cumulatively for five events respectively. From this figure, it is empirical to judge that for complex events and with different multiple data sets, achieving higher classification rates from these features is a daunting task to perform. Windows for different events have been shown in Figure 4; it is empirical to judge that a clear distinction can be done by this transformation.

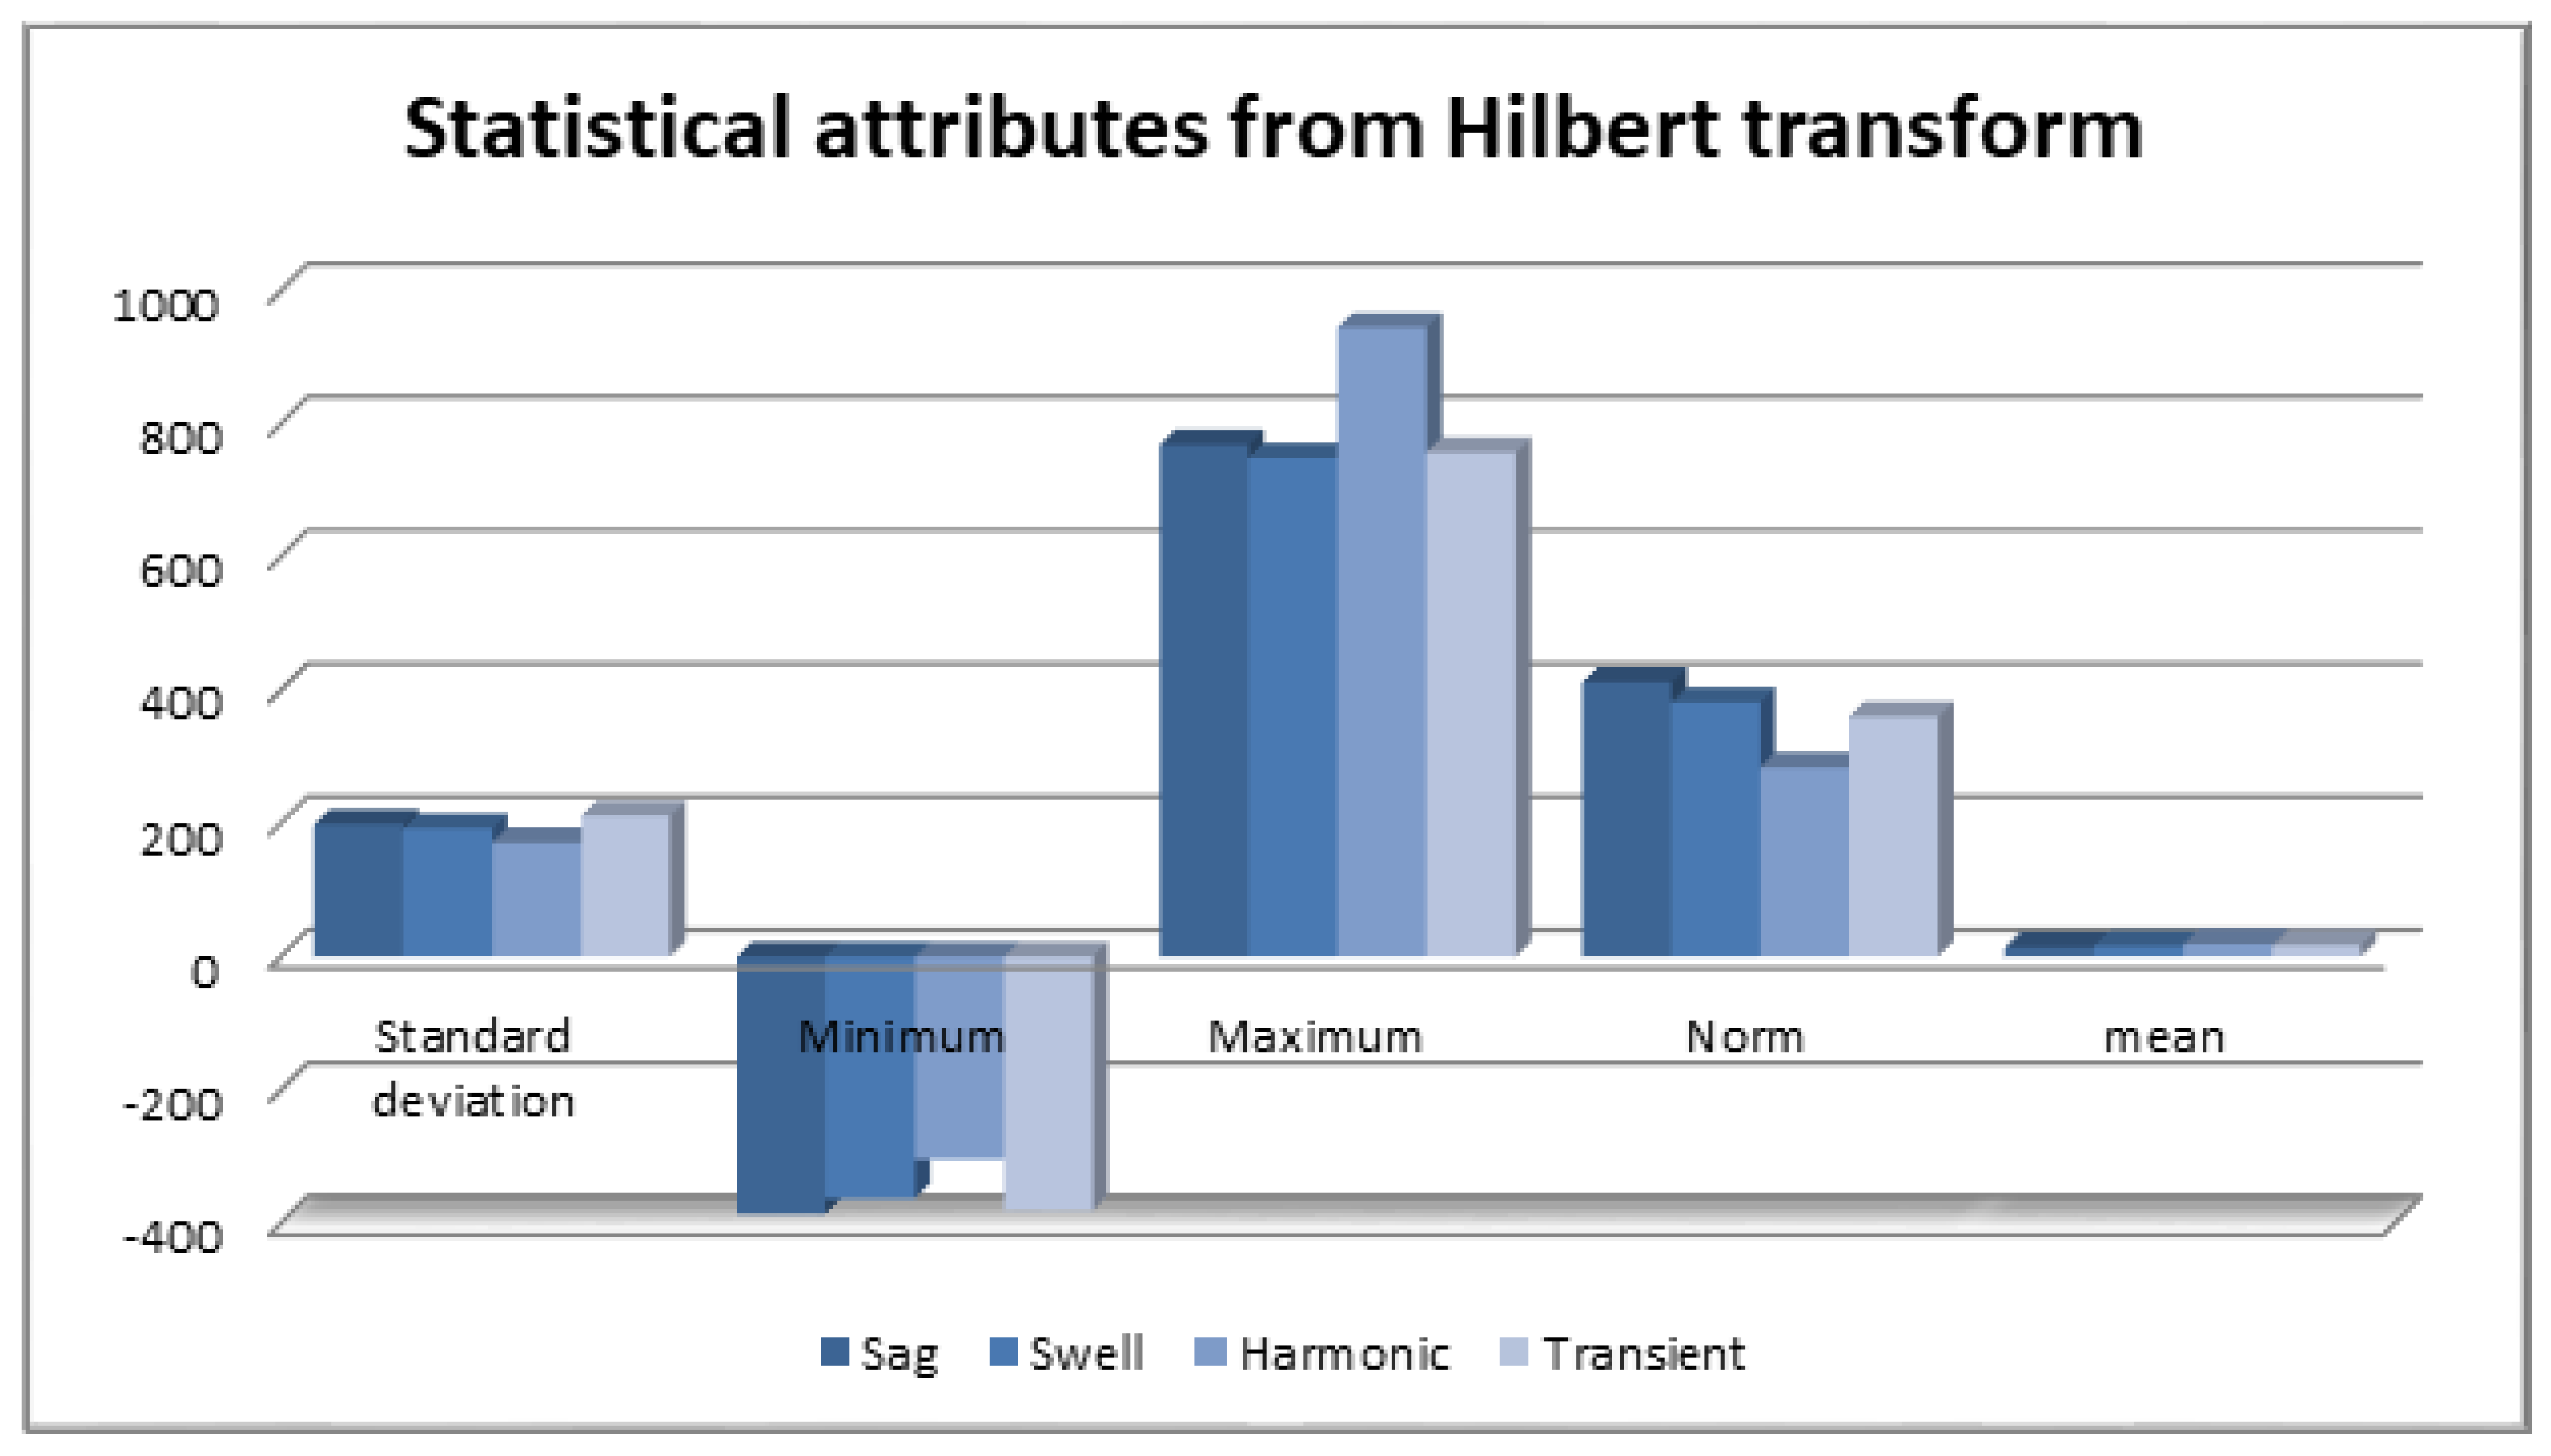
3.2. Hilbert Transform

Hilbert transform is a mathematical tool for the generation of an analytical signal from a real signal. It is obtained by convolving the real signal g ( t ) with the function(1/ π t).
g H ( t ) = g ( t ) 1 π t = 1 π g α t α d α
A complex signal xc(k) consists of the original signal as a real part, and its Hilbert transform as an imaginary part. In this paper, the imaginary part of the complex voltage signal is captured for different types of events, and the statistical attributes are calculated of the transformed signals. Different statistical attributes of the Hilbert transform are employed as input features to SVM. Different statistical attributes for different events are shown in Figure 5. It is empirical to judge that for the events like sag, swell harmonics and transient this feature can be the source of important information to train the classifier. From Figure 4 and Figure 5, it is judged that in many cases the performance of the classifier is based on the datasets.
Since no significant variations are observed in mean values, the following analysis will not include the mean of the signals as a potential feature. To compete with the pattern recognition-based classifiers, a hybrid approach, which employs features from both signal-processing techniques is more fruitful for such real problems. The motivation for this work hails from here only.

4. Support Vector Machines

In recent years, the applications of SVM in classification problems have increased due to its capability in the segregation of datasets by the best hyperplane. SVMs are applied for classification of PQ events [9,10,12,13,17,18,19,20], multi-dimensional data classification [17], classification of microarrays [18], wind speed prediction [19], voltage stability monitoring [20] and many more. The popularity of SVM is rising with every passing day because it can handle large feature space. Also, a large feature space cannot hinder the classification accuracy. In the case of other classifiers, the input feature space dimension is a very crucial design parameter [9].
Due to this virtue of SVM, its employment is a primary reason for large classification problems. SVM utilizes various kernel functions to transfer the input space of data to nonlinear high-dimensional data. A sparse prediction function is generated by choosing a selected number of points; these points are Support Vectors (SVs). SVMs possess two main features such as structural risk minimization and a tradeoff between empirical error and model complexity [19].
Let the n-dimensional inputs Xi (i = 1, 2, 3, …, m), where m is the number of samples belonging to class 1 and class 2. Associated labels are K ( i ) = 1 and K ( i ) = −1. SVM is an inherently two-class separator, hence, the linear hyperplane that separates the data can be determined by the following equation:
f z = W T z + d = k = 1 n W k z k + d
where W is an n-dimensional vector and d is scalar. These two parameters determine the location of the hyperplane. The constraints are f z 1 if K ( i ) 1 and f z 1 if K ( i ) 1 . The separating data plane that generates the maximum distance between the nearest data and the plane, is called the optimal separating hyperplane. Geometric margin w 2 and insensitive loss function ε are the most important parameters in SVM design. Let the error between predicted results and targets be visualized by ε , that is
y f z = 0 y f z ε y f z ε y f z ε
The optimization problem, which is convex in nature, is now converted to the minimization of geometric margin. This objective is subjected to the minimization of the error between predicted values and simulated values. The objective function I can be represented as:
I = m i n 1 2 w 2
S u b j e c t t o y W . f z d ε 0
W . f z + d y i ε i = 1 , 2 , , m
Since the problems of PQ disturbance identification is data specific and also system specific, hence, it is necessary to add the non-negative slack variable χ . The convex optimization problem can be converted as follows:
I = m i n 1 2 w 2 + A i = 1 m χ i
S u b j e c t t o y W f z d ε + χ i , χ i 0 i = 1 , 2 , , m
To find the optimal values, the problem (6) can be rearranged by the Langragian saddle point method, that is
L = 1 2 w 2 + A i = 1 m χ i + β 1 m y + W f z + d + ε + χ i 1 m γ ε i
Hence, the classification-based optimization problem can be solved with respect to the primal variables W, d, ε , and χ . However, as per reported results in reference [30], we used a Radial Basis Function (RBF) kernel for the classification task. In general, also, the RBF function is the most common choice as the mercer kernel function because of its Gaussian function form. However, for tuning the parameters of SVM, we have experimented with 6 advanced algorithms. The detailed analysis of these algorithms and experimental results tuning are shown in the following subsection.

Choice of Algorithm for Parameter Tuning

In the past, various attempts have been made to tune the hyperparameters of the SVM in many approaches. Proper tuning of these parameters enhances the classification accuracy of the classifier. For constructing the optimization routine, an objective function that is based on the maximization of classification accuracy of the PQ events is considered here. For robustness of optimization, we have taken 2500 samples of different PQ events and classify according to the discussion presented in previous sections. For comparing the optimization performance, the search agents no. along with maximum iteration have been kept constant for all algorithms. Also, the parameter pertaining to algorithms are taken from the references. The following algorithms are considered for tuning tasks:
1.
Augmented Crow Search Algorithm (ACSA): The author of the ACSA has developed a new variant of the Crow Search Algorithm. The author modified the algorithm by incorporating Opposition based learning and a gradient-based scheme for better exploration and exploitation.
2.
Whale Optimization Algorithm (WOA): The recent application of WOA in the field of Demand Side Management (DSM) inspired authors to design and optimize the hyperparameter of SVM with the help of WOA.
3.
Intelligent Grey Wolf Optimizer (IGWO): In a recent application of IGWO, the estimation of solar panel parameters attracted the interest of researchers, as well the authors of this paper for employing the algorithm for tuning task. The algorithm employs a sinusoidal bridging parameter and Opposition based learning.
4.
Gaining Sharing Knowledge based Algorithm (GSK): The algorithm has previously been applied for classification tasks. The performance of the algorithm on various mathematical functions primarily became the criterion for choosing it.
5.
Chaotic Marine Predator Algorithm (CMPA): A recently published chaotic version of the Marine Predator Algorithm and its performance on feature selection tasks inspired the authors to employ CMPA in tuning tasks. The algorithm embeds a chaotic function for position update in its intermediate stage.
6.
Augmented Whale Optimization Algorithm (AWOA): This algorithm primarily works on Opposition based learning and updating of position based on the Cauchy mutation operator. The AWOA has been tested over a number of benchmark functions along with the real application.
The analysis of the results is shown in Table 3. For comparing the optimization performance, search agents no., maximum no. of iteration are kept constant. From the table, it has been observed the highest classification rate acquired with the help of ACSA that is 96.2 % . Hence, for further analysis, ACSA has been taken for tuning the parameters of SVM. The following section presents the feature selection process based on PCA.

5. PCA-Based Feature Selection for PQ Event Classification

The efficiency of the supervised learning models is highly affected by the size of the features. To reduce the dimensionality of the input feature matrix, PCA is a well-known methodology. Recently PCA is used for wind speed prediction [19], building forecasting models for electricity consumption prediction [36] and for fault detection [37]. In PQ event detection problem, different statistical attributes of the output of signal processing techniques are chosen as input features. In this work, the dimension of the input feature size is 9. The first five attributes are from Wavelet transform and the last four are extracted from the Hilbert transform technique. It is necessary to select the major factors that contribute to the relevant information about the event using the well-known principal component analysis. The observation matrix (O) is first designed as:
O = k 1 k 2 k 3 k 4 k 5 k 6 k 7 k 8 k 9 = k 11 k 12 k 13 k 14 k 15 k 16 k 17 k 18 k 19 k s 1 k s 2 k s 3 k s 4 k s 5 k s 6 k s 7 k s 8 k s 9
where s is the sample size (2500), the remaining variables are as follows:
k 1 = 1 s j = 1 7 A b j 1 s j = 1 7 A b j 2
k 2 = m i n A b
k 3 = n o r m A b
k 4 = m a x A b
k 5 = 1 s A b
k 6 = 1 s j = 1 j = s X h 1 s j = 1 j = s X h 2
k 7 = m i n X h
k 8 = n o r m X h
k 9 = m a x X h
Here k 1 = k 11 k 21 k s 1 and so on k 9 = k 19 k 29 k s 9 and A b is the detailed coefficients of seven-level MRA of Wavelet transforms. X h is the Hilbert transform of the voltage signals. Further, these features are normalized between 0.1 to 0.9 and the correlation coefficient matrix C R is created as follows.
C R = R 11 R 12 R 19 R 21 R 22 R 29 R 91 R 92 R 99
where
R i j = m = 1 m = s k m i * k m j * s 1
and
k i j * = k i j k j v a r k j , k j = 1 s k i j s
Hence, the eigenvalue associated with this correlation matrix will be ( E 1 E 9 ). The contribution rate γ i associated with each principal component can be calculated as:
γ i = E i j = 1 j = 9 E i
The contribution rates of the different transforms are shown in Table 4. Based on the contribution rates various permutations of input features are constructed for SVM. Three modules are constructed with three different permutations of features; details and analysis of the results are given in the following sections.

6. Results

This section presents a comparative analysis of the results obtained from the application of different combinations of SVMs obtained from PCA in the classification of different PQ events. The real power system model is simulated in Matlab. Different PQ events such as sag, swell, normal (without sag and swell), transients, and harmonics are simulated with the consideration of interruptions. Binary classification is used with five target classes namely sag, swell, transient, harmonics, and normal. Table 2 shows binary classification for PQ event detection. Total 2500 samples are generated for this classification task i.e., 500 for each event. Out of 2500 samples, 70% datasets are used for training purposes, the remaining 15% for testing, and 15% for validation. Signals are sampled at 256 points/cycle and the normal frequency is 50 Hz.
Hilbert transform and Wavelet transforms are applied to extract the information from the generated signals. Different statistical attributes of Hilbert transforms and Wavelet transforms namely minimum, maximum, standard deviation, and norm of the Hilbert coefficients and detailed energy coefficients are employed as an input feature for SVM. The nine significant features are extracted from this simulation process. The contribution rates and accumulative contribution rates are shown in Table 4. To carry out this analysis in a meaningful manner, different possible combinations of SVMs are employed and efficacy of the each module is tested.
The results of PCA are shown in Table 4. As per the datasets obtained from PCA, it is observed that the values of contribution rates for all statistical attributes of Hilbert coefficients along with standard deviations and minimum values of detailed energy coefficients of the Wavelet transform contribute around 95.82%. For this reason, these features are employed to construct the different architecture of SVMs.
Observation sets for SVM-1: In this observation set two extinct features of highest contribution rates (standard deviations and minimum values of Hilbert transform coefficients) are selected as input features. The confusion value for this module is 0.087. The confusion diagram for this classifier is exhibited in Figure 6a.
Observation sets for SVM-2: In this observation set all four features extracted from the statistical attributes of Hilbert transforms are employed. The confusion rate for this module is 0.043 and the confusion diagram for this classifier is shown in Figure 6b.
Observation sets for SVM-3: In this observation set all four features extracted from the statistical attributes of Hilbert transforms and two distinct features namely minimum values and standard deviations of detailed energy coefficients of Wavelet transforms are employed. The confusion rate for this module is 0.038 and the confusion diagram for this classifier is presented in Figure 6c.

6.1. Discussions

Three standard error criteria are applied to measure the efficacy of these modules. These are Mean Square Error (MSE), Mean Absolute Error (MAE), and Root Mean Square Error (RMSE). Definitions of these indices are taken from [19]. From Figure 7, it is empirical to judge that the values for these error indices are minimum for SVM-3. Moreover, higher values are obtained for SVM-1 and RBFNN. The corresponding values of these error indices are shown in Table 5. In order to judge the classifier performance, confusion diagrams are utilized.
The lower value of confusion indicates the higher classification efficacy of the classifier. As calculated, in this case, SVM-3 proves to be a better classifier. From Figure 6a it is empirical to judge that the classifier is able to judge the 91.3% events only. For class 1 the classification efficiency is 59% only. However, in classes 3 and 4, 98.2% and 99.4% efficiency are achieved by SVM-1 respectively. Figure 6b shows the classification accuracy of SVM module 2.
Similarly for SVM-3 as shown in Figure 6c the performance is 96.2%. Classification efficiencies for each class are indicated in the confusion diagrams and these are (86, 100, 99.4, 95.8, and 100%). It can be concluded that the statistical attributes of Hilbert coefficients and Wavelet energy coefficients provide a good combination as input features and SVM-3 gives a good performance as compared with the other two modules and RBFNN. To compare the performance of these classifiers few statistical tests are conducted here.

6.2. Statistical Analysis

The improved performance of SVM-3 over the existing method and other modules can be realized through statistical analysis. This module should be statistically significant in terms of error measures, classification accuracy, or any other classification problems. Implications of statistical tests and analytical measures in classification problems are discussed by Demsar [38]. In this paper one-way ANOVA test (fisher) [39,40] has been performed. The objective of ANOVA is to test the hypothesis to evaluate variability in the performance of the models. A null hypothesis can be constructed that all classifiers have the same classification accuracy. Rejection of this hypothesis can be based on error variability. To conduct this test, 5 fold cross validation technique is used. Classifier accuracies of different datasets of different capacities on all three SVMs are exhibited in Table 6. Datasets of different capacities are prepared and all three SVM models are applied. The simulation results are depicted in Figure 8.

6.3. Null Hypothesis

All means are equal (the classification efficiency of all classifiers is the same). This test has been carried out using one-way ANOVA in Duncan multiple test range [41] with 95% confidence interval, (0.05) significance level, and linear polynomial contrast and the results have been presented in Table 7 and Figure 8 shows the results of ANOVA test. In Duncan, multiple tests a control variable is considered, and the classification accuracy of SVM-2 (C2) is taken as a control variable.

7. Conclusions

With the ever-rising concern of design engineers to attain a high quality of power, the focus is on PQ event classification and mitigation of unwanted signals. This paper had presented a combined application of SVM and signal processing techniques in PQ event classification. The salient features of this work are as follows:
1.
Combined input features based on Wavelet and Hilbert transforms are employed to train, test, and validate the supervised learning module SVM for efficient detection of PQ events.
2.
The tuning of SVM hyperparameters is carried out with the help of the latest developed versions of optimization algorithms. Some of the algorithms are developed by the authors, it has been concluded that ACSA yields the best classification accuracy.
3.
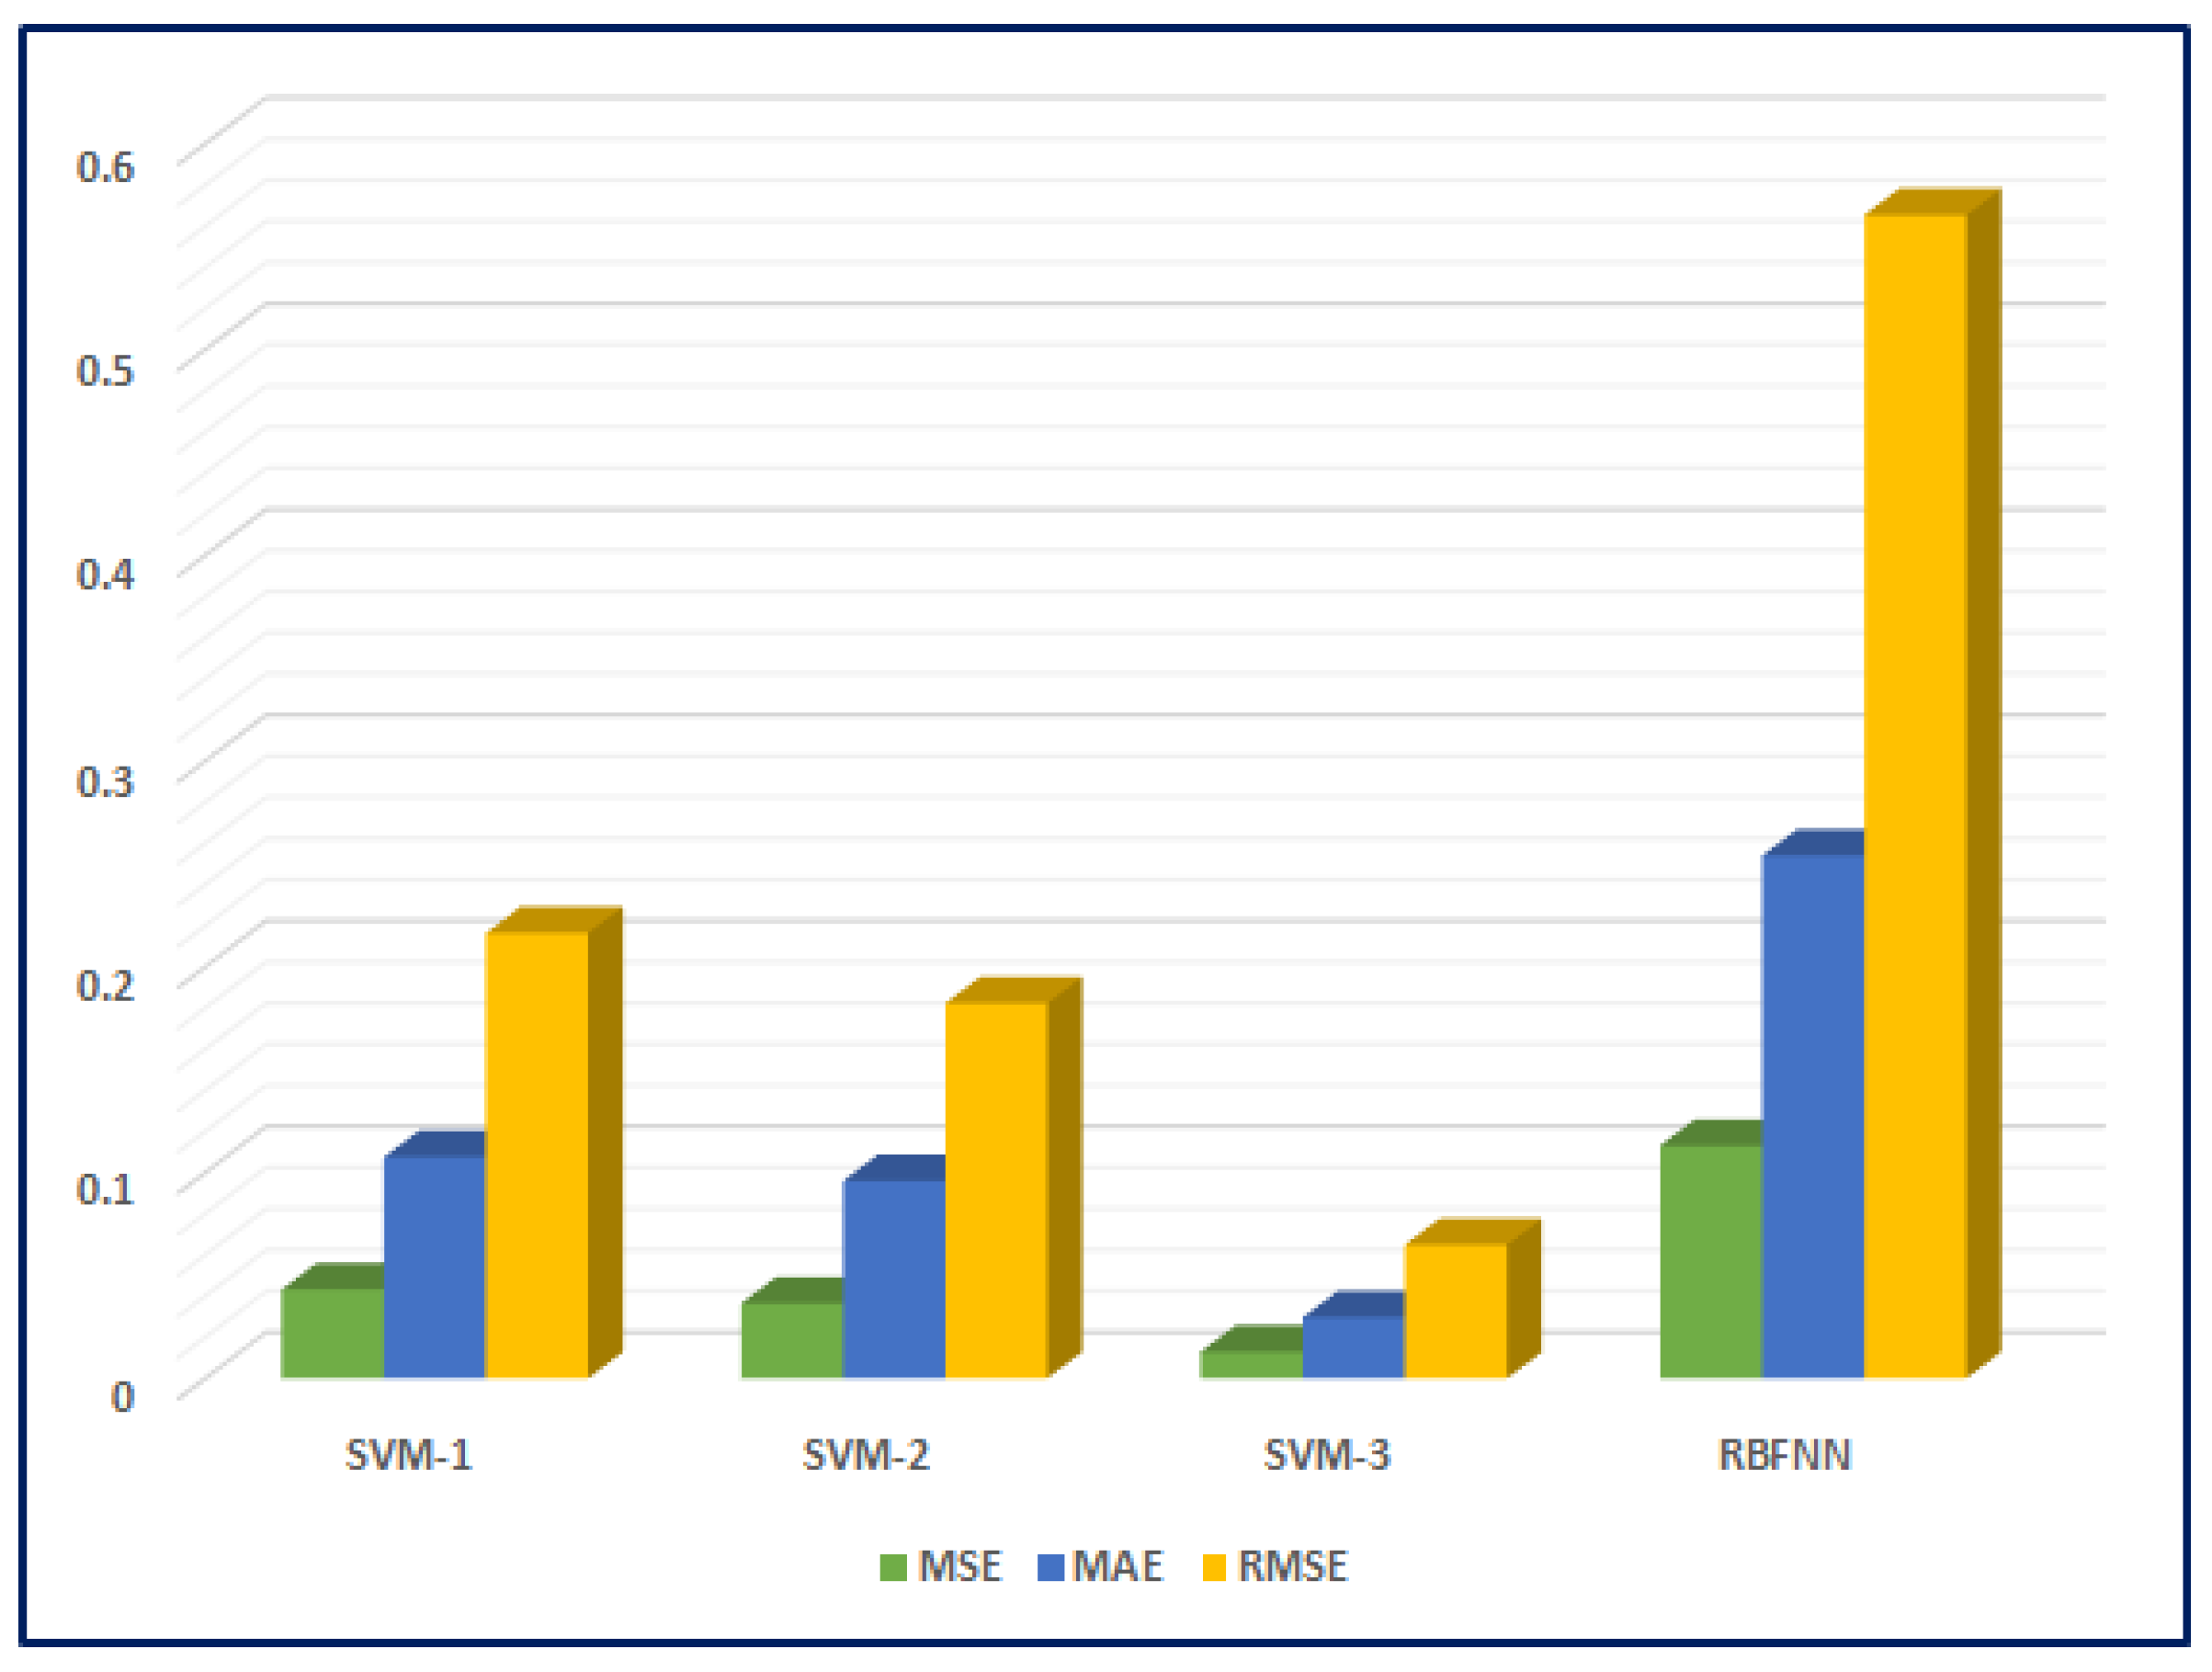
Principal Component Analysis is carried out to detect efficient features from a large pool, based on different features; three models of SVMs are constructed. The comparison of these three modules is carried out based on the three-error criteria MSE, MAE, and RMSE.
4.
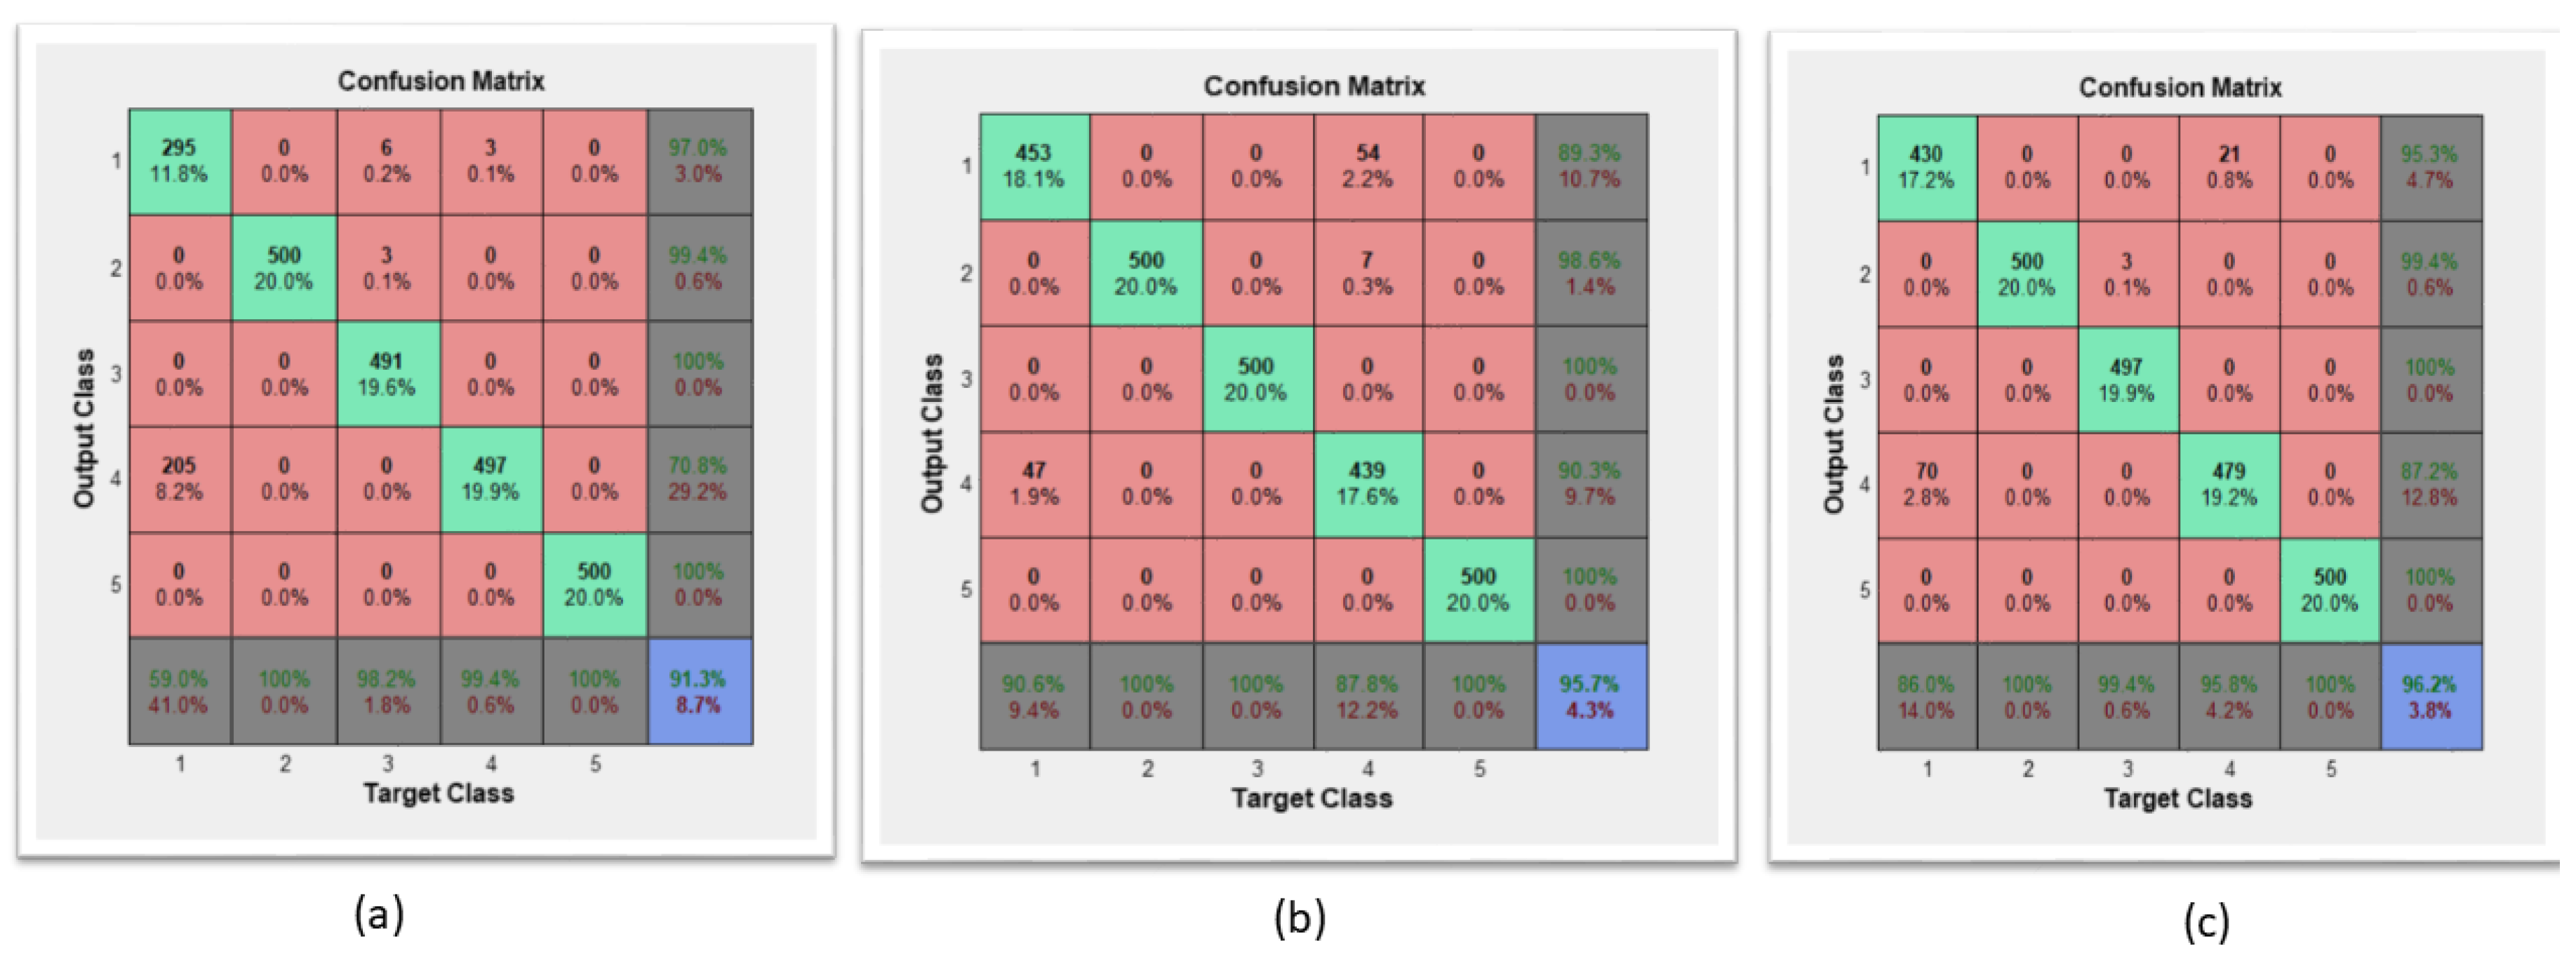
Classification accuracy of these modules is tested based on confusion values and diagrams, it is concluded that SVM-3, possesses features from both transforms and gives the best results.
5.
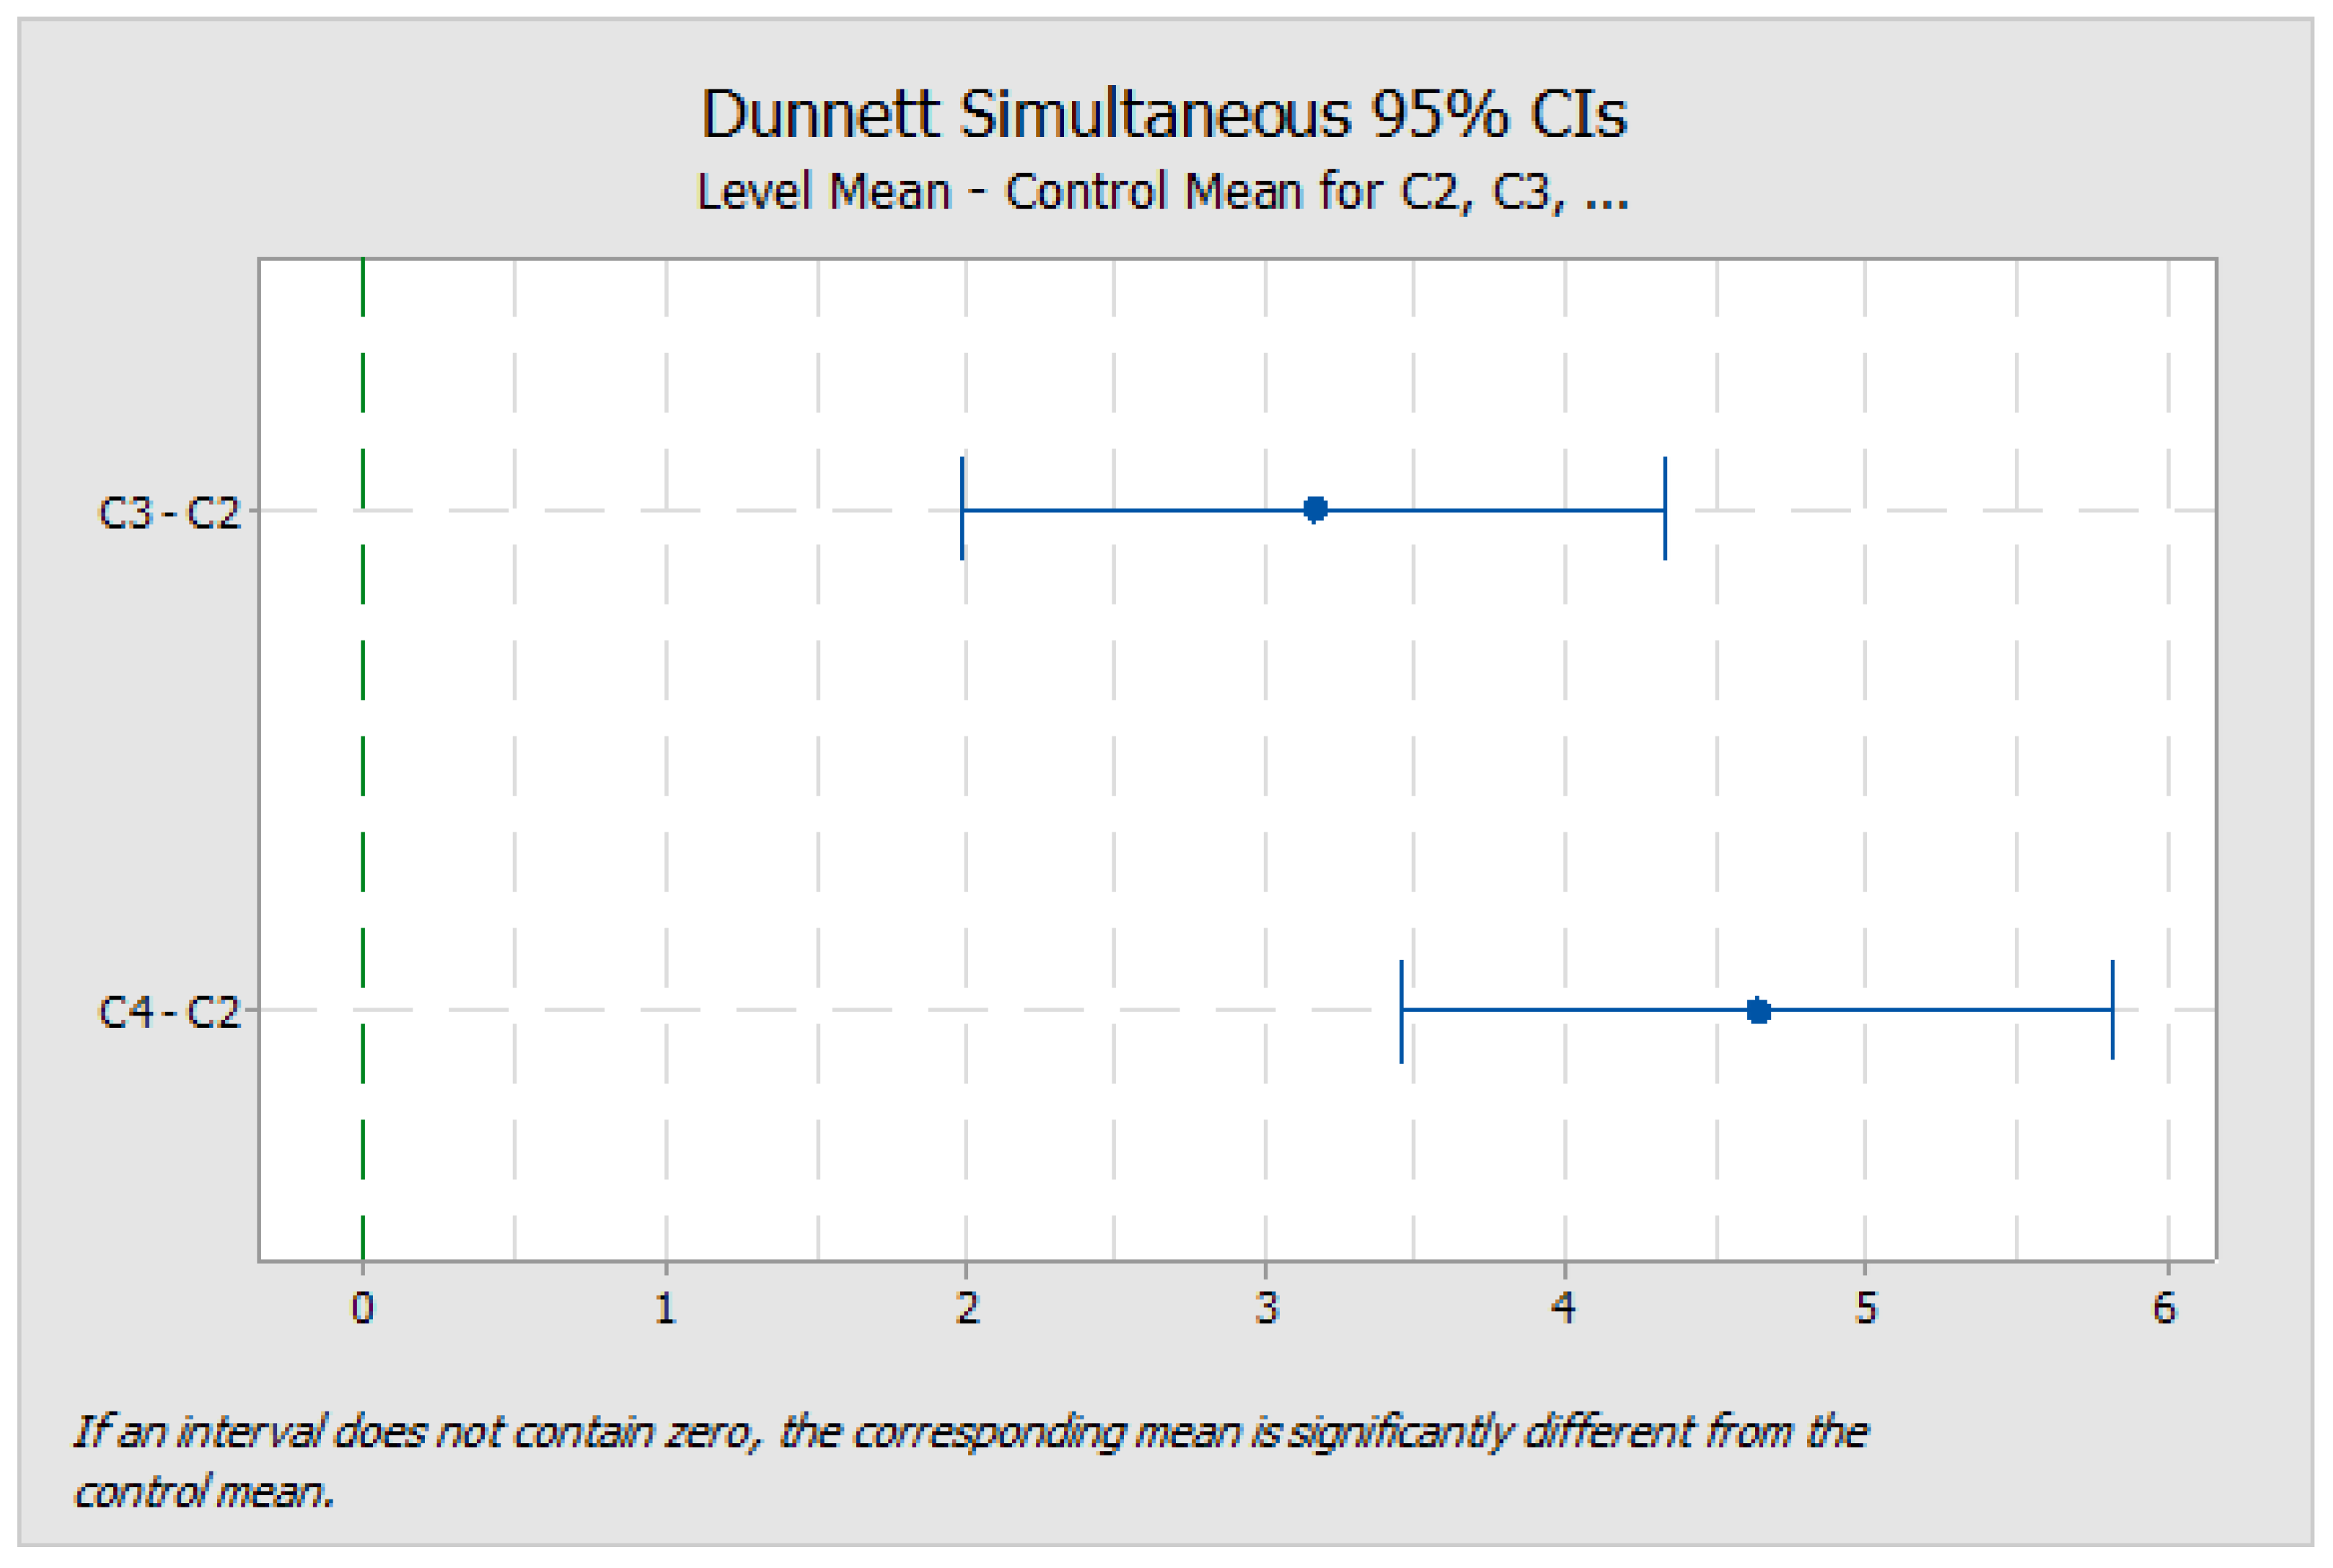
Last but not least, the validation of obtained results is carried out with a statistical ANOVA test. Rejection of the Null hypothesis is done based on obtained statistical values and the Dunnett test.
Application of these modules on a wind dominating system will be addressed in the future. Also, the application of deep learning models will be explored with the combined application of optimization, signal processing, and data mining.

Author Contributions

Formal analysis, K.A.A. and A.S.; Funding acquisition, K.A.A.; Investigation, K.A.A.; Methodology, A.F.A. and A.S.; Project administration, A.W.M.; Software, A.S.; Supervision, A.S. and A.W.M.; Validation, A.F.A. and A.W.M.; Visualization, A.F.A. and A.M.A.; Writing—original draft, A.S.; Writing—review & editing, A.M.A. and A.S. All authors have read and agreed to the published version of the manuscript.

Funding

The research is funded by Researchers Supporting Program at King Saud University, (RSP-2021/323).

Institutional Review Board Statement

Not applicable.

Informed Consent Statement

Not applicable.

Data Availability Statement

Not Applicable.

Acknowledgments

The authors present their appreciation to King Saud University for funding the publication of this research through the Researchers Supporting Program (RSP-2021/323), King Saud University, Riyadh, Saudi Arabia.

Conflicts of Interest

The authors declare no conflict of interest.

Abbreviations

The following abbreviations are used in this manuscript:
PQPower Quality
SVMSupport Vector Machine
ACSAAugmented Crow Search Algorithm
PCAPrincipal Component Analysis
FSFeature Selection
MSEMean Square Error
MAEMean Absolute Error
RMSERoot Mean Square Error

References

  1. Acha, E.; Madrial, M. Power System Harmonics: Computer Modeling and Analysis; John Wiley and Sons Ltd.: London, UK, 2001. [Google Scholar]
  2. Arrillaga, J.; Watson, N.R.; Chen, S. Power System Quality Assessment; John Wiley and Sons Ltd.: London, UK, 2000. [Google Scholar]
  3. Dash, P.K.; Chilukuri, M.V. Hybrid S-transform and Kalman filtering approach for detection and measurement of short duration disturbances in power networks. IEEE Trans. Instrum. Meas. 2004, 53, 588–596. [Google Scholar] [CrossRef]
  4. Dash, P.K.; Mishra, S.; Salama, M.M.A.; Liew, A.C. Classification of power system disturbances using a fuzzy expert system and a Fourier linear combiner. IEEE Trans. Power Deliv. 2000, 15, 472–477. [Google Scholar] [CrossRef] [Green Version]
  5. Santoso, S.; Grady, W.M.; Powers, E.J.; Lamoree, J.; Bhatt, S.C. Characterization of disturbance power quality event with Fourier and wavelet transforms. IEEE Trans. Power Deliv. 2000, 15, 247–254. [Google Scholar] [CrossRef]
  6. Mishra, S.; Bende, C.N.; Panigrahi, B.K. Detection and classification of power quality disturbances using S-transform and probabilistic neural networks. IEEE Trans. Power Deliv. 2008, 23, 280–287. [Google Scholar] [CrossRef]
  7. Dash, P.K.; Panigrahi, B.K.; Panda, G. Power quality analysis using S-transform. IEEE Trans. Power Deliv. 2003, 18, 406–411. [Google Scholar] [CrossRef]
  8. Bendhe, C.N.; Mishra, S.; Panigah, P.K.I. Detection and classification of power quality disturbances using S-transform and modular neural network. Electr. Power Syst. Res. 2008, 78, 122–128. [Google Scholar] [CrossRef]
  9. Yong, D.D.; Bhowmik, S.; Magnago, F. An effective Power Quality classifier using Wavelet Transform and Support Vector Machines. Expert Syst. Appl. 2015, 42, 6075–6081. [Google Scholar] [CrossRef]
  10. Biswal, B.; Biswal, M.K.; Dash, P.K.; Mishra, S. Power quality event characterization using support vector machine and optimization using advanced immune algorithm. Neuro Comput. 2013, 103, 75–86. [Google Scholar] [CrossRef]
  11. Erişti, H.; Yıldırım, Ö.; Erişti, B.; Demir, Y. Automatic recognition system of underlying causes of power quality disturbances based on S-Transform and Extreme Learning Machine. Int. J. Electr. Power Energy Syst. 2014, 61, 553–562. [Google Scholar] [CrossRef]
  12. Ekici, S. Classification of power system disturbances using support vector machines. Expert Syst. Appl. 2009, 36, 9859–9868. [Google Scholar] [CrossRef]
  13. Erişti, H.; Demir, Y. A new algorithm for automatic classification of power quality events based on wavelet transform and SVM. Expert Syst. Appl. 2010, 37, 4094–4102. [Google Scholar] [CrossRef]
  14. Meher, S.K.; Pradhan, A.K. Fuzzy classifiers for power quality events analysis. Electr. Power Syst. Res. 2010, 80, 71–76. [Google Scholar] [CrossRef]
  15. Jayasree, T.; Devaraj, D.; Sukanesh, R. Power quality disturbance classification using Hilbert transform and RBF networks. Neuro Comput. 2010, 73, 1451–1456. [Google Scholar] [CrossRef]
  16. Saxena, A. An efficient harmonic estimator design based on Augmented Crow Search Algorithm in noisy environment. Expert Syst. Appl. 2022, 194, 116470. [Google Scholar] [CrossRef]
  17. Cyganek, B.; Krawczyk, B.; Woźniak, M. Multidimensional data classification with chordal distance based kernel and Support Vector Machines. Eng. Appl. Artif. Intell. 2015, 46, 10–22. [Google Scholar] [CrossRef]
  18. Kumar, M.; Rath, S.K. Classification of microarray using Map Reduce based proximal support vector machine classifier. Knowl. Based Syst. 2015, 89, 584–602. [Google Scholar] [CrossRef]
  19. Kong, X.; Liu, X.; Shi, R.; Lee, K.Y. Wind speed prediction using reduced support vector machines with feature selection. Neuro Comput. 2015, 169, 449–456. [Google Scholar] [CrossRef]
  20. Sajan, K.S.; Kumar, V.; Tyagi, B. Genetic algorithm based support vector machine for on-line voltage stability monitoring. Int. J. Electr. Power Energy Syst. 2015, 73, 200–208. [Google Scholar] [CrossRef]
  21. Ekici, S.; Ucar, F.; Dandil, B.; Arghandeh, R. Power quality event classification using optimized Bayesian convolutional neural networks. Electr. Eng. 2021, 103, 67–77. [Google Scholar] [CrossRef]
  22. Subudhi, U.; Dash, S. Detection and classification of power quality disturbances using GWO ELM. J. Ind. Inf. Integr. 2021, 22, 100204. [Google Scholar] [CrossRef]
  23. Cortes-Robles, O.; Barocio, E.; Obushevs, A.; Korba, P.; Sevilla, F.R.S. Fast-training feedforward neural network for multi-scale power quality monitoring in power systems with distributed generation sources. Measurement 2021, 170, 108690. [Google Scholar] [CrossRef]
  24. Ganesan, S.; David, P.W.; Balachandran, P.K.; Samithas, D. Intelligent starting current-based fault identification of an induction motor operating under various power quality issues. Energies 2021, 14, 304. [Google Scholar] [CrossRef]
  25. Motlagh, S.Z.; Foroud, A.A. Power quality disturbances recognition using adaptive chirp mode pursuit and grasshopper optimized support vector machines. Measurement 2021, 168, 108461. [Google Scholar] [CrossRef]
  26. Bandla, P.B.; Vairavasundaram, I.; Teekaraman, Y.; Kuppusamy, R.; Nikolovski, S. Real Time Sustainable Power Quality Analysis of Non-Linear Load under Symmetrical Conditions. Energies 2021, 15, 57. [Google Scholar] [CrossRef]
  27. Fu, W.; Tan, J.; Zhang, X.; Chen, T.; Wang, K. Blind parameter identification of MAR model and mutation hybrid GWO-SCA optimized SVM for fault diagnosis of rotating machinery. Complexity 2019, 2019, 3264969. [Google Scholar] [CrossRef]
  28. Eswaramoorthy, S.; Sivakumaran, N.; Sekaran, S. Grey wolf optimization based parameter selection for support vector machines. COMPEL 2016, 35, 1513–1523. [Google Scholar] [CrossRef]
  29. Thakur, P.; Singh, A.K.; Bansal, R.C. A novel way for classification and type detection of voltage sag. IET-Gener. Transm. Distrib. 2013, 7, 398–404. [Google Scholar] [CrossRef]
  30. Saxena, A.; Shekhawat, S. Ambient air quality classification by grey wolf optimizer based support vector machine. J. Environ. Public Health 2017, 2017, 3131083. [Google Scholar] [CrossRef] [Green Version]
  31. Sharma, A.K.; Saxena, A. A demand side management control strategy using Whale optimization algorithm. SN Appl. Sci. 2019, 1, 870. [Google Scholar] [CrossRef] [Green Version]
  32. Saxena, A.; Sharma, A.; Shekhawat, S. Parameter extraction of solar cell using intelligent grey wolf optimizer. Evol. Intell. 2020, 15, 167–183. [Google Scholar] [CrossRef]
  33. Mohamed, A.W.; Hadi, A.A.; Mohamed, A.K.; Awad, N.H. Evaluating the performance of adaptive GainingSharing knowledge based algorithm on CEC 2020 benchmark problems. In Proceedings of the 2020 IEEE Congress on Evolutionary Computation (CEC), Glasgow, UK, 19–24 July 2020; pp. 1–8. [Google Scholar]
  34. Alrasheedi, A.F.; Alnowibet, K.A.; Saxena, A.; Sallam, K.M.; Mohamed, A.W. Chaos Embed Marine Predator (CMPA) Algorithm for Feature Selection. Mathematics 2022, 10, 1411. [Google Scholar] [CrossRef]
  35. Alnowibet, K.A.; Shekhawat, S.; Saxena, A.; Sallam, K.M.; Mohamed, A.W. Development and Applications of Augmented Whale Optimization Algorithm. Mathematics 2022, 10, 2076. [Google Scholar] [CrossRef]
  36. Li, K.; Hu, C.; Liu, G.; Xue, W. Building’s electricity consumption prediction using optimized artificial neural networks and principal component analysis. Energy Build. 2015, 108, 106–113. [Google Scholar] [CrossRef]
  37. Huang, J.; Yan, X. Dynamic process fault detection and diagnosis based on dynamic principal component analysis, dynamic independent component analysis and Bayesian inference. Chemom. Intell. Lab. Syst. 2015, 148, 115–127. [Google Scholar] [CrossRef]
  38. Demšar, J. Statistical comparisons of classifiers over multiple data sets. J. Mach. Learn. Res. 2006, 7, 1–30. [Google Scholar]
  39. Fisher, R.A. Statistical Methods and Scientific Inference, 2nd ed.; Hafner Publishing Co.: New York, NY, USA, 1959. [Google Scholar]
  40. Tukey, J.W. Comparing individual means in the analysis of variance. Biometrics 1949, 5, 99–114. [Google Scholar] [CrossRef] [PubMed]
  41. Dunnett, C.W. A multiple comparison procedure for comparing several treatments with a control. J. Am. Stat. Assoc. 1980, 50, 1096–1121. [Google Scholar] [CrossRef]
Figure 1. Different Power Quality Events.
Mathematics 10 02780 g001
Figure 2. Test System.
Mathematics 10 02780 g002
Figure 3. Laboratory Testing Module.
Mathematics 10 02780 g003
Figure 4. Analysis of detailed coefficients of HAAR Wavelet with different PQ events.
Mathematics 10 02780 g004
Figure 5. Values of different statistical attributes of Hilbert transforms for different events.
Mathematics 10 02780 g005
Figure 6. Comparative Analysis of Observation sets for SVM module 1 (ac) to SVM module 3.
Mathematics 10 02780 g006
Figure 7. Error Indices.
Mathematics 10 02780 g007
Figure 8. Test results for ANOVA—Dunnett simultaneous statistical test.
Mathematics 10 02780 g008
Table 1. Classification of power quality events.
S. No.CategoriesDurationVoltage Magnitude
1.Normal-Fundamental values
2.SagShort term (up to 1 min)0.1–0.9 p.u.
3.SwellShort term (up to 1 min)1.1–1.4 p.u.
4.HarmonicSteady state THD > 5
5.Transients<50 ns0–4 p.u.
Table 2. Binary Classification for PQ event detection.
Sag10000
Swell01000
Normal00100
Transients00010
Harmonics00001
Table 3. Comparative analysis of different optimization algorithms for hyper-parameter tuning.
Size of
Data Sets
AlgorithmAttribute of AlgorithmRegularization
Parameter
Kernel
Parameter
Classification
2500ACSA [16]Inculcation of OBL and bridging of the exploration and exploitation phase10.5230.32596.2
2500WOA [31]hunting behavior of the whale10.3650.31594.35
2500IGWO [32]OBL and Bridging through sinusoidal turncated function10.2450.36992.65
2500GSK [33]Based on the behavior of gaining and sharing knowledge10.3620.35491.25
2500CMPA [34]Chaotic algorithm that employs chaotic position update system10.0120.325794.21
2500AWOA [35]Cauchy mutation operator based position update10.2150.36694.36
Table 4. Results of Principal Component Analysis.
Signal Processing
Technique
Principal ComponentsEigenvaluesContribution Rates (%)Accumulative
Contribution (%)
Hilbert TransformStandard Deviation3.117634.6434.64
Minimum Value2.635529.2863.92
Norm Value0.930510.3474.26
Maximum Value0.85029.4483.71
Wavelet TransformStandard Deviation0.65187.2490.95
Minimum Value0.43944.8895.83
(Detailed Energy
coefficients)
Norm Value0.27783.0998.92
Maximum Value0.09691.08100
Mean Values0.00017820.01100
Table 5. Comparison of Error Indices.
Supervised Learning ModelMSEMAERMSE
SVM-10.04330.10760.2164
SVM-20.03650.09600.1824
SVM-30.01300.02970.0649
RBFNN0.11310.25410.5655
Table 6. Classification Accuracy of All SVM models for different datasets.
ModelSize of Datasets
5001000150020002500
SVM-190.8991.0190.4990.3691.3
SVM-293.1492.9893.7594.2995.7
SVM-394.995.494.7695.7896.2
Table 7. ANOVA results.
ModelFactor (N)MeanStandard DeviationConfidence Interval for Mean
Upper BoundLower Bound
SVM-1590.810.38590.08691.534
SVM-2593.971.09793.24894.696
SVM-3595.440.55194.72496.172
Publisher’s Note: MDPI stays neutral with regard to jurisdictional claims in published maps and institutional affiliations.

