Article

Floods, Poverty, and Happiness of Rural Farmers in Northern Benin

1
Unité de Recherche en Analyse de Politiques Agricoles et de Gestion des Exploitations Agricoles et Entreprises Agro-Industrielles, Université Nationale d’Agriculture, Porto-Novo 01 BP 55, Benin
2
Suleman Dawood School of Business, Lahore University of Management Sciences (LUMS), Opposite Sector U, DHA, Lahore 54792, Pakistan
*
Author to whom correspondence should be addressed.
Economies 2024, 12(3), 52; https://doi.org/10.3390/economies12030052
Submission received: 29 September 2023 / Revised: 28 January 2024 / Accepted: 7 February 2024 / Published: 21 February 2024

Abstract

:
Floods destroy crop production; nevertheless, the extent of their impact on farmers’ livelihoods in developing countries has been poorly investigated. This paper contributes to the growing evidence-based assessment of the impacts of shocks on communities. It assessed the post-disaster livelihood of farmers affected by the 2012 flooding in the semi-arid zone of Benin. To this end, a survey was conducted on 228 farmers in two municipalities of the flood-prone part of the semi-arid zone of Benin (Malanville, Karimama). Information on the well-being of households was collected using semi-structured interviews. Data were analyzed using income and consumption approaches focusing on poverty and on subjective assessment using happiness approach. Additionally, a probit model was used for a poverty assessment. The survey revealed that flooded farmers were amongst the poorest in the study system. Seven variables determined poverty in this study: household size, location, the percentage of the farm size that was flooded, fishing, the farmer’s gender, farm size, and “holding a secondary activity”. Regarding happiness, 99% of the flooded farmers were unhappier after the flood in 2012. The results clearly show that being subjected to floods increases the incidence of poverty. The capacity of flood risk management and governance should be strengthened in the study system.

1. Introduction

Floods are the most expensive natural disaster in global contexts, with an expected increase in frequency and intensity if no effective adaptation strategies are implemented (Pricope et al. 2022; Parker 2000; Ayerakwa et al. 2014; Harvey et al. 2014). Flood risk is the potential damage and disruption caused by flooding, which is influenced by physical phenomena, such as precipitation, and the presence of people (Fekete 2010). Vulnerability includes communities’ exposure, sensitivity, and adaptation capacities (IPCC 2014). Floods are a complex phenomenon, and understanding the changes in flood hazards can be challenging due to multiple interacting factors (Johnson et al. 2016). Many factors such as rivers, climate change, water resources, population density, and industrialization cause or aggravate the impact of flooding (Schmuck 2012).
Flood-originated disasters impede economic and human development at the macro-level and the household level because livestock, crops, homes, and human lives are repeatedly destroyed (Shrestha et al. 2019; Bremond et al. 2013). In low-income countries, floods adversely affect people’s livelihoods due to high exposure and sensitivity (Omungu 2014). An author stated that croplands are exposed to flooding in these systems, adding that at the same time, a high share of the population is poor and highly depends on subsistence agriculture. In Africa, human settlements are more prone to flooding. This is because they lack adequate infrastructure to cope with natural disasters combined with a large population living below the poverty line. This forces them to live in vulnerable locations by rivers (Ayerakwa et al. 2014; Armah et al. 2010).
Recently, floods in Benin have become more prevalent, with their after-effects being more destructive (Lokonon 2016; Baudoin et al. 2013). Floods affect almost every sphere of life, including farming, housing, schools, healthcare, roads, marketplaces, places of worship, drinking water supplies, sanitation, and other goods and public services (World Bank 2011). In rural areas, floods also affect farmers’ livelihoods, especially through crop loss. In 2020, the poverty rate was 45.9%, with the country ranking 158 out of 189 countries in 2020 regarding happiness status (World Development Indicators 2020). Some actions and programs are being undertaken in agriculture to alleviate poverty and raise the happiness level in rural areas. Simultaneously, covariate shocks such as floods, dry spells, droughts, and idiosyncratic shocks including diseases, deaths, and fire hinder efforts, rendering them unsuccessful. In 2012, a surge striking the semi-arid zone in the country led to the destruction of several farms. Understanding how such shocks impact income and poverty levels and farmers’ happiness status could help design responses better.
Ezin et al. (2018) conducted a study highlighting that agriculture in Benin is under a severe threat of climate change, resulting in food insecurity. Therefore, it is essential to apply timely policy interventions to overcome this challenge. Mounirou and Yebou (2022) assessed farmers’ perceptions of climate risks in Northern Benin. According to their research, the effects of climate change adversely force farmers to migrate to other areas with better land for agriculture. In addition, Bonou et al. (2018) found that a 1% increase in flooding duration (days) was linked to a 0.40% decrease in agricultural income in Benin. A farmer stated that their household agricultural income decreased by an estimated 1.44% when the severity of flooding in 2012 in Benin was major compared with what it would have been if the flooding had been minor. Additionally, the same author found a 1% rise in flooded cultivated areas corresponded with an approximate loss of 0.27% in agricultural income. Ariom et al. (2022) proposed that African economies are under severe threats of climate change. Therefore, it is mandatory to lessen these effects by mainstreaming agriculture in policymaking. The prior literature also discussed how extreme flooding harms the agricultural sector. For example, Skevas et al. (2023) found that approximately 37% of farmers affected by flooding have reported financial losses of at least USD 100,000 in Missouri. This highlights the devastating impact that floods can have on agricultural communities and underscores the need for effective disaster relief measures. Moreover, Dasgupta (2007) elucidated that floods in Bangladesh led to a worsening in poverty among farmers. In a comparatively recent study, Adnan et al. (2020) also showed how farmers lost their agricultural lands in Bangladesh after recent floods. Khayyam (2020) revealed the impact of floods on poverty in Pakistan, illustrating a solid interconnection between flooding and poverty. Similarly, in their case study on Ghana, Atanga and Tankpa (2021) found that floods deteriorate crop yields. Floods have a significant impact on smallholder farmers, exacerbating their vulnerability to poverty. Zulqarnain (2013) and Mavhura and Mucherera (2020) both highlighted the devastating effects of floods on these farmers, with Zulqarnain specifically noting the loss of livelihoods in Pakistan, and Mavhura and Mucherera highlighting the case in Zimbabwe. Maganga et al. (2021) further emphasized the link between climate-induced vulnerability and poverty, with floods being a key factor in Malawi. The location of farmers also plays a role, as Owusu et al. (2016) found in Ghana that those in low-lying areas are particularly vulnerable. These studies collectively underscore the need for targeted interventions to support smallholder farmers in flood-prone areas, including the provision of financial and technical assistance and the promotion of alternative livelihoods. There are many studies on climate change, flood disasters, and poverty in Africa, but few studies focus on the intersection of flood disasters and poverty in the agricultural sector in Benin.
This paper aimed to assess the post-disaster poverty and happiness status of smallholder farmers affected by the 2012 flooding in the semi-arid zone of Benin, focusing on the social framework. This case study investigates the mitigation and adaptation strategies for disasters using the social framework rather than physical hazards as the starting point. Moreover, in the international literature, several studies have assessed the impact of covariate and idiosyncratic shocks on poverty using either income or consumption as an indicator (Pradhan and Mukherjee 2016; INSAE 2012; Günther and Harttgen 2009). However, because impacts are case-specific, finding an effective solution requires local data collection on the case being handled. Thus, it is paramount to undertake context-specific research first to guide policymakers and contribute to the scientific discussion on the right indicator to be used as a proxy for poverty assessment.
Much research on happiness has added new knowledge to the standard view. For instance, one study showed that non-financial variables have a systematically sturdy influence on the self-reported life satisfaction (Reinhardt and Hrodey 2019). Welsch (2005) suggested that air pollution is a statistically significant predictor of inter-country and intertemporal variations in subjective well-being. Another study observed a private water connection and an increase in the convenient access to water, with no change in water quality and an increase in households’ satisfaction levels (Nadeem et al. 2020; Devoto et al. 2012). While the real income in several countries has risen considerably ever since World War II, the self-reported subjective well-being amongst the population has not increased. In the US, for example, the per capita real yearly income rose by 2.5 (from approximately USD 11,000 to USD 27,000) between 1946 and 1991, whereas happiness in the same period remained constant, on average (Diener and Biswas-Diener 2002). Furthermore, in Burkina Faso, households experienced significant increases in subjective welfare after the cotton reform with no corresponding increases in consumption and income (Kaminski 2014). There are alternative reasons for economists to have an interest in happiness, such as economic policy. It is usually impossible to form a proposal for a Pareto improvement, because social policy involves prices for a few people. Hence, an analysis of the effects on individual utilities is required.

2. Literature Review

2.1. Background on Geography, Agriculture, and Poverty in Benin

Benin, a small country in the southern region of the Sahel, was chosen as the focus of our research due to the high incidence of flooding in the area over the past 50 years. Takeaways from this case study can generate important lessons for the rest of West Africa. As of 2020, the population of Benin amounted to approximately 12,120,000 inhabitants. The country encompasses 114,763 square kilometers of land covering a large area perpendicular to the coast of the Gulf of Guinea in West Africa. Benin shares a border with Burkina Faso and Niger in the north, the Federal Republic of Nigeria in the east, and Togo in the west. The country’s coastline spans 124 km from north to south and approximately 672 km and 324 km from east to west at its widest point. Benin boasts volatile tropical conditions, whereby the country receives less rainfall than other countries at a similar latitude (Lawin et al. 2013).
Benin’s economy highly depends on agriculture, with 88% of its export revenues and 70% of its workforce being in agriculture (World Development Indicators 2020). This sector generates approximately 27.1% of the GDP (World Development Indicators 2020). Apart from food crops (manioc, beans, yams, sorghum, maize, millet, and rice), farmers primarily grow cotton, the main export crop. The country is Africa’s leading cotton producer, providing livelihoods for 2 million of Benin’s inhabitants. Other export crops—palm oil, cashews, and pineapples—account for only 10 percent of exports. Rice ranks fourth as the most vital staple regarding food consumption (Lawin et al. 2013), following yam, maize, and cassava. Promoting sectors such as rice, pineapple, maize, and cashew nuts, developing irrigation infrastructure (dams, dykes, and irrigation canals), and setting up agro-processing units are among the policies that aim to diversify Benin’s export agriculture and further integrate the national agricultural production into global value chains (African Economic Outlook 2020).
Regarding poverty, Benin ranked 158 out of 189 countries in 2020, with a Human Development Index of 0.545 (World Development Indicators 2020). The poverty rate at the national level increased from 33% in 2007 to 38.5% in 2019, growing at an average annual rate of 4.07%. In 2020, the poverty rate was 45.9%, and the real GDP fell to 3.8% after the COVID-19 crisis. Public spending was the primary growth driver, and higher food prices pushed inflation to 3% in late 2020. The fiscal deficit (grants included) widened from 0.5% of the GDP in 2019 to 4.2% in 2020 (World Development Indicators 2020).

2.2. Poverty and Happiness as a Measure of Well-Being

Human well-being is a multi-dimensional phenomenon, where attaining well-being is contingent on achievements in various other dimensions. Well-being arises from achievements spanning three dimensions: the material, subjective, and relational (McGregor and Sumner 2010). It is essential to view well-being as a multi-dimensional phenomenon for several reasons. Firstly, due to the failure to understand individuals or households within the broader network of social structures and institutions, poverty interventions tackle only one dimension of poverty, possibly generating damage in other dimensions of well-being (Devereux and McGregor 2014). Secondly, linking causes of poverty with poor people fails to acknowledge poverty as being embedded in structures and institutions by poverty professionals. Lastly, sustainable livelihoods may be measured using resources, including economic, human, natural, and social capital (Scoones 1998). The most widespread method to measure poverty is the welfare approach. In practice, this approach concentrates mainly on comparing economic well-being, also known as the standard of living or income approach. This approach links strongly with traditional economic theory, which assumes that people are perfectly rational, patient, and computationally proficient (Ravallion 1994). Well-being refers to a level of satisfaction that is achieved via the consumption of a certain good. Classical economic science typically suggests that consumers are rational and better judges of life and activities that tend to maximize their utility and happiness. Then, income and consumption are used as proxies for poverty analysis.
Happiness is perceived as multi-dimensional and an aggregate of well-being (Duclos and Araar 2006). The concept of happiness is sometimes used interchangeably with the term subjective well-being. Subjective well-being or happiness studies include the scientific analysis of how people evaluate their lives, both in a given moment and over more extended periods, such as the preceding year. Life satisfaction and happiness are self-reported and may be calculated with the help of a single or several questions. Measures of happiness report emotional reactions to multiple things, including events, and moods, along with their satisfaction with life, regarding domains such as marriage and jobs (Diener et al. 2010).
Happiness and subjective well-being have been typified into two distinct perspectives. One of these is broadly referred to as hedonism (Kahneman et al. 1999). Hedonism implies that well-being entails pleasure. The other perspective, eudaimonism, clarifies that well-being is not limited to happiness (Waterman 1993). These two perspectives are founded on distinct views of human nature and what constitutes a good society (Ryan and Deci 2001).
Thus, subjective well-being measures two concepts: life evaluation, where the perspectives of individuals on their lives are reported, and emotional well-being, hedonic well-being, and daily affect measures, where the presence of multiple emotions at any point are captured (Kahneman and Deaton 2010; Diener et al. 2009). The key to correct measurement should begin with the definition of happiness. Happiness in the past has been measured as an emotion (“Were you cheerful yesterday?”) and an analysis (“Are you cheerful along with your life as a whole?”). Therefore, respondents should be assisted in clearly recognizing the difference between the two in the context of life satisfaction (Helliwell et al. 2013; Diener et al. 2010).

3. Materials and Methods
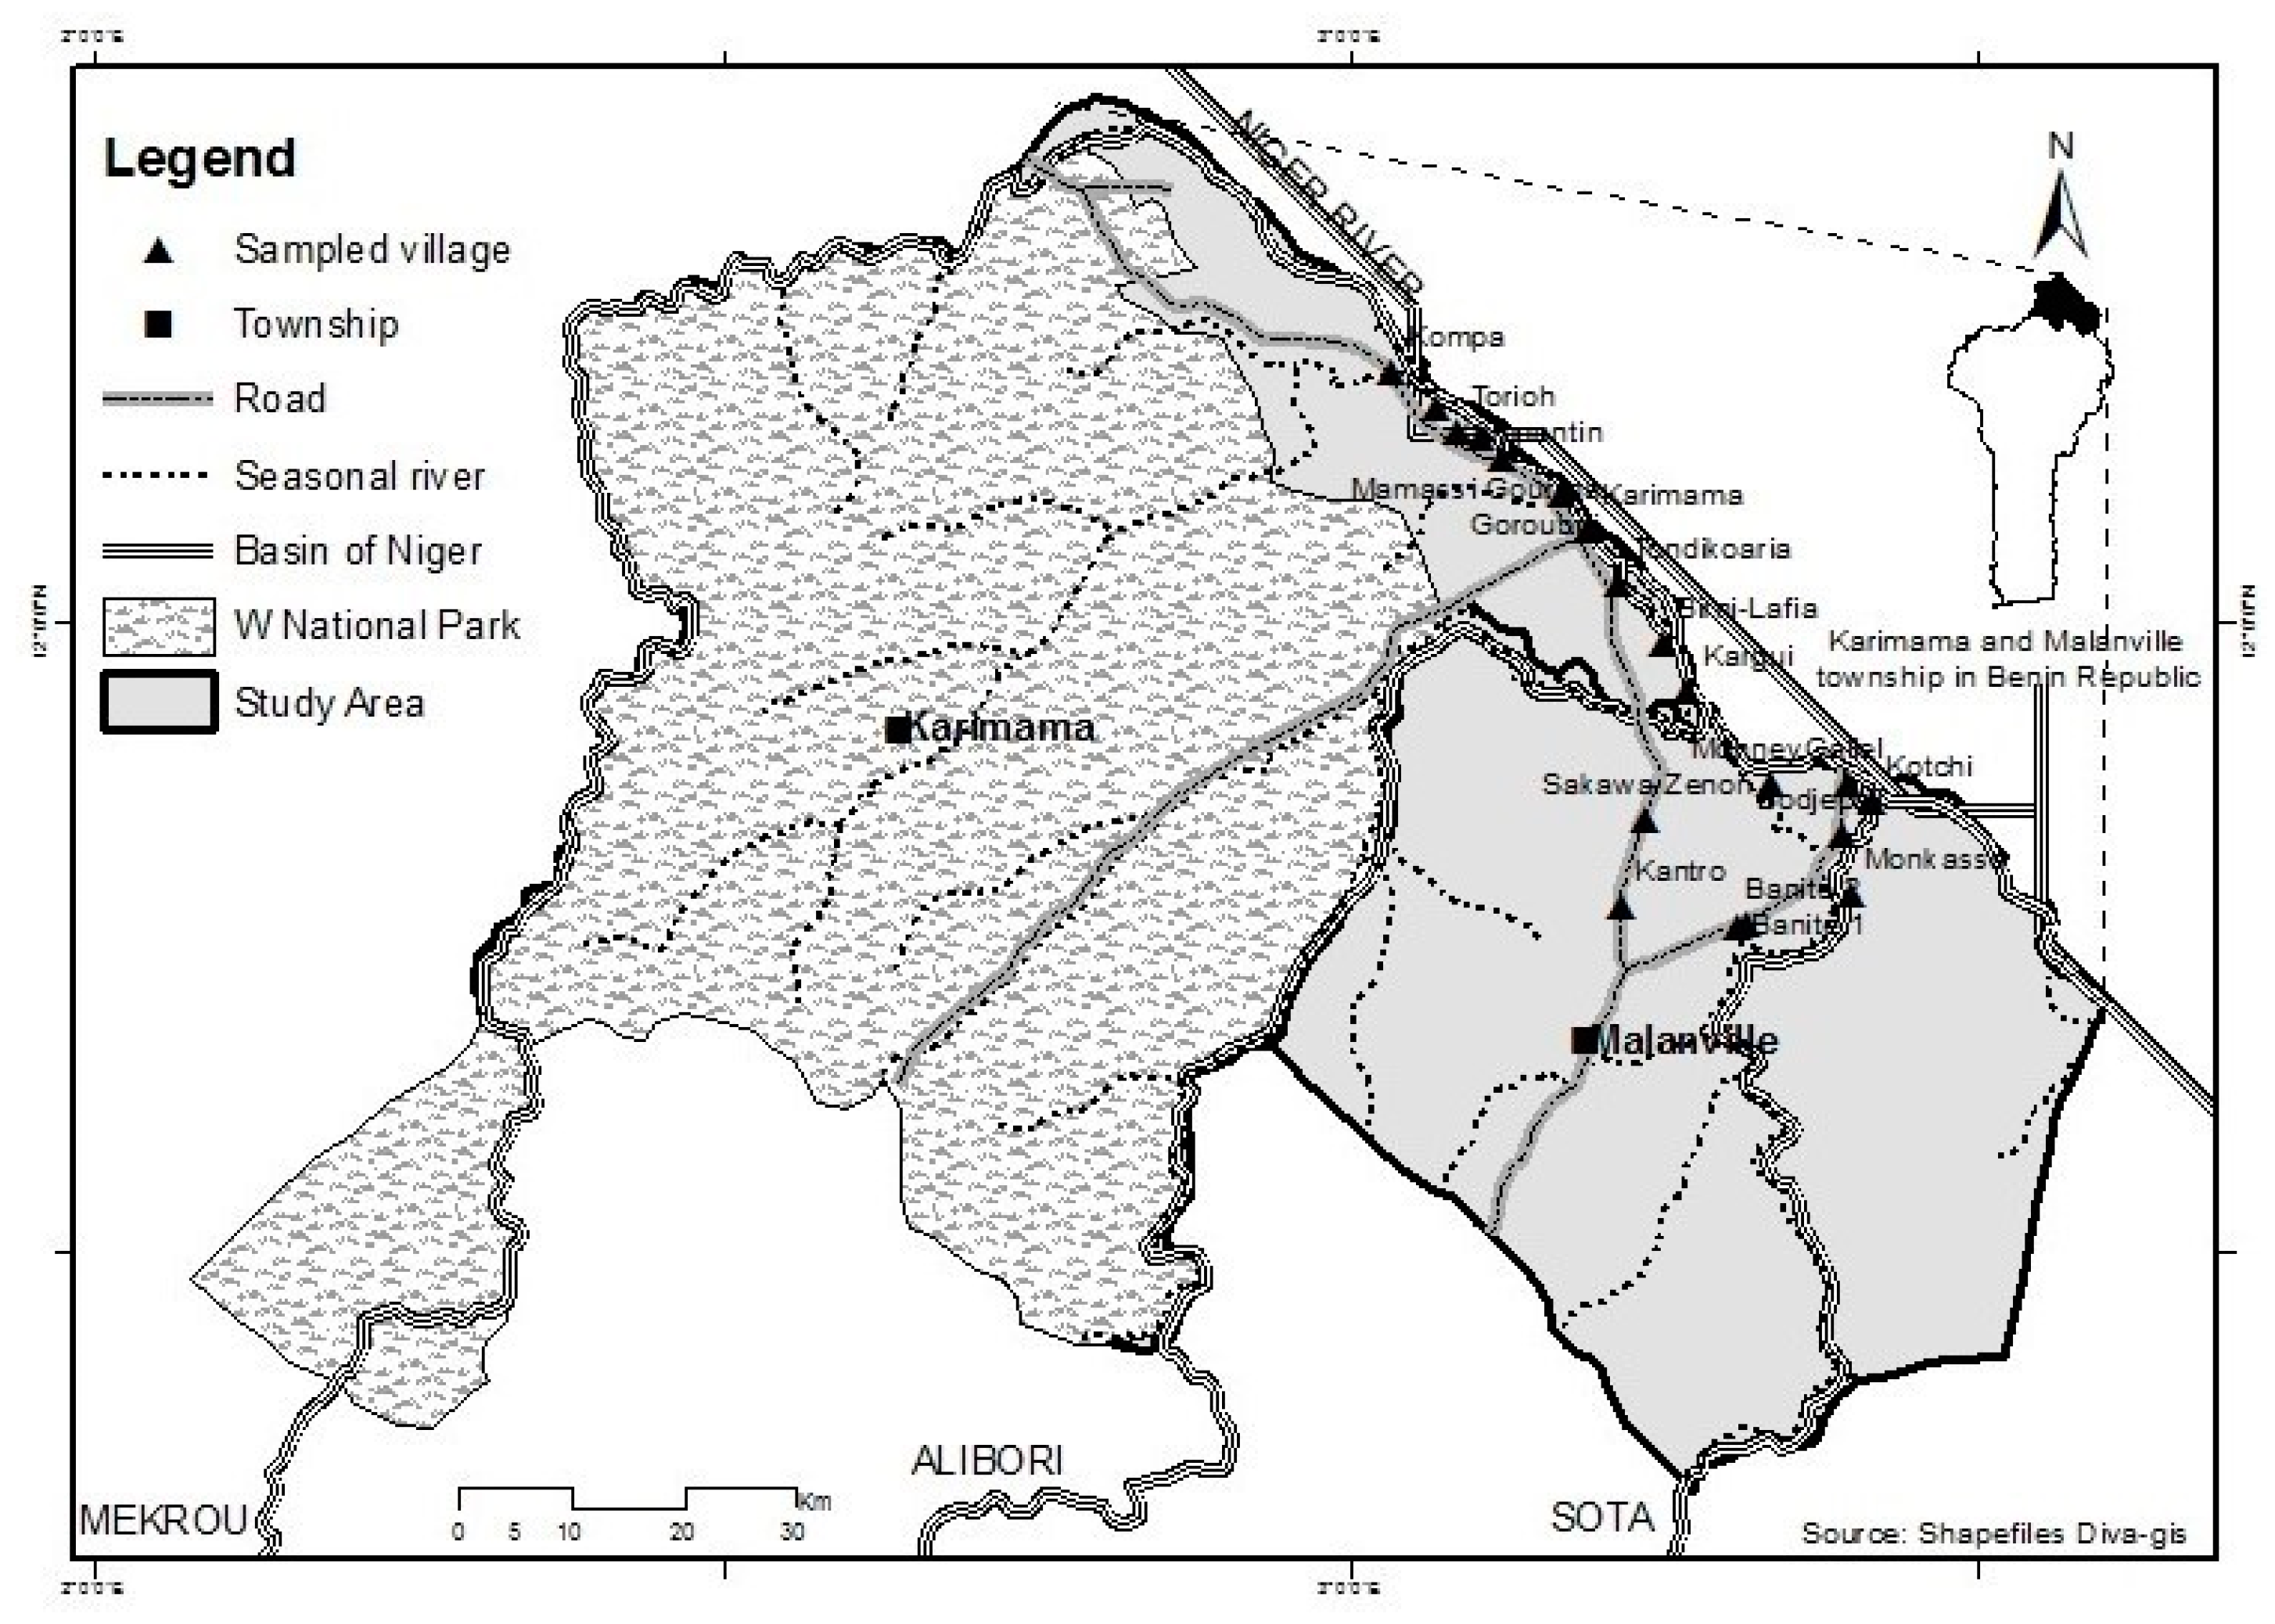
3.1. Study System

This study was conducted in Benin’s Niger watershed region, particularly in the Malanville and Karimama municipalities located downstream of the basin and, thus, the most impacted by flooding (Figure 1). Malanville (11°52′0″ N, 3°22′60″ E, and 160 m above sea level) covers approximately 3016 km2, with a population of approximately 101,628 individuals in 2013 (https://fr.wikipedia.org/wiki/Malanville, accessed on 24 January 2023).
Karimama (2°4′0″ N, 3°10′60″ E, and 164 m above sea level) covers 6102 km2, with a population of 39,579 individuals in 2013 (https://fr.wikipedia.org/wiki/Karimama, accessed on 24 January 2023).

3.2. Sampling Method

A two-stage sampling technique was applied. In the first stage, villages in the two targeted municipalities were selected based on their proximity to the river. Nineteen villages were selected: nine in Malanville and ten in Karimama. Before the second sampling stage, a systematic census of the number of households in the study system was conducted. This returned a total number of 1554 households. Following Dagnelie (1998), a sampling rate of 15% (i.e., 228 households) was considered for the survey. In the second sampling stage, twelve households were randomly chosen per village (Table 1 and Table 2).

3.3. Data Collection and Analysis

The survey was conducted in March 2014, and flooding had occurred since August 2012. Therefore, cross-sectional data were collected. A twenty-page questionnaire was used with open and closed questions. The total number of questions was too high. The questionnaire was pre-tested in another region similar to the study area. After that, some questions were readjusted, and the questionnaire was validated before use. The data collection was based on the recall memory of the farmers concerning the cropping season of 2012–2013. The main topics covered by the questionnaire were as follows: the socio-demographic characteristics of the household members, the experience of farmers with flooding, household farm characteristics, farm size, the agricultural income for each culture and livestock and fishing, non-agricultural revenue, agricultural expenditures (variable cost and fixed cost) for each culture and livestock and fishing, other expenditures, additional costs due to flooding, and the subjective well-being of the household (happiness).
Three interviewers were used in the survey apart from the researcher. The questionnaire was written in French, but the interviews were entirely conducted in the farmers’ local languages (Dendi, Gourmantche, and Fulani). Questionnaire interviews lasted 1 h to 1 h 30 min.
Farmers produced numerous cultures during the rainy season, including rice, maize, millet, sorghum, cotton, groundnut, bean, soybean, tomato, pepper, onion, okra, sweet potato, cassava, potato, banana plantain, banana, orange tree, mango, gourd, hot and red pepper, and edible leaves.
Three indices were used to estimate the extent of poverty (Haughton and Khandker 2009; Duclos and Araar 2006; Deaton 1997):
  • The headcount index (P0);
  • The poverty gap index (P1);
  • The poverty severity index (P2).
The headcount index (P0) is the most common measure of poverty and considers the fraction of the group that is viewed as poor.
P 0 = N p N
where N refers to the total sample size (i.e., p. 228), and Np refers to the number of poor people in the sample based on the poverty line:
N P = i = 1 N I ( y i < z )
If consumption or income ( y i ) is < the poverty line (z), then I = 1 (poor).
The poverty gap index (P1) quantifies the degree to which individuals in our sample fell below the poverty line. Thus, the poverty gap refers to the poverty line (z) minus the actual income/consumption ( y i ) for poor individuals. The gap is zero for the rest.
P 1 = 1 N i = 1 N z y i z
The poverty severity index (P2) indicates the inequality among poor individuals. The index averages the squares of the poverty gaps relative to the poverty line. Squaring the poverty gaps enables weighting in favor of those falling well below the poverty line:
P 2 = 1 N i = 1 N z y i z 2
The value of consumption is assumed to be the sum of the expenditures on goods and services purchased and consumed at a particular time, plus the value of goods and services that are only consumed (for example, goods and services received as gifts), and finally the consumption or service value of assets and durable goods possessed by the household (Duclos and Araar 2006). The present study used Benin’s 2011 annual poverty line, amounting to XOF 120,839 (USD 242) annually (INSAE 2012). To estimate the per capita consumption, the consumption of households was combined and subsequently divided by the household size. Similarly, the annual per capita income is the total income from all household sources (agriculture, fishing, trade, and transportation, among others) divided by the household size. Moreover, agricultural income was measured by the total revenue from the rainy cropping season after the 2012 flood and the two dry cropping seasons after it. It was calculated by multiplying the yield of each crop for each corresponding season (in local units) with the sale price of a local unit in 2012. Additionally, the livestock income was obtained by multiplying the number of animals sold by their sale price. Finally, the off-farm income was estimated by the addition of all gains from activities such as farm labor on others’ farms, transport, fishing, healing, Quran recitation, butchery, family transfer, brick making, retirement pensions, social assistance, loans, crafts, trade, etc. (Bonou et al. 2018).
A probit model was used to analyze the determinants of poverty. The variable of interest was the percentage of land flooded (%) in 2012. In the poverty model, the independent variables used included: gender, household size, having a second activity, location, fishing, and farm size.
Additionally, data on the happiness of the households focusing on life satisfaction were collected. The impact of floods on residual happiness was assessed, considering the non-financial impacts of floods. Data on subjective well-being were used. To this end, informants were asked: “Taken together, how would you say things were in 2012? Would you say that you were very happy, pretty happy, or not too happy?” (adapted from Frey and Stutzer 2002). The survey failed to collect these data on the 31 non-flooded households. Thus, it was impossible to run the probit model. This happened because the dependent variable, subjective well-being, yielded only two values, pretty happy and not too happy, leading to homogeneity in the database.

4. Results

4.1. Poverty Analysis for the Sample

The mean annual consumption per capita was XOF 183,193, while the mean annual income per capita was XOF 193,630. The three indices of poverty are presented in Table 3. In 2012, the headcount index (P0) was 42.1%, implying that approximately 42% of the sample lived below the monetary poverty line. The poverty gap index (P1) was 0.2, representing the mean proportional poverty gap in the sample, which is the estimated minimum cost (relative to the poverty line) of eliminating poverty. Lastly, the poverty severity index amounted to approximately 0.1.
While using income instead of consumption for the index computation, we found the results of all three indices to differ slightly.

4.2. Poverty Analysis Using Flooding Status and Happiness Analysis

Among the sample of 228 farmers, 197 farmers’ farms were flooded in 2012, while 31 were not. The mean per capita expenditure for flooded farmers was XOF 185,590, with the same spending being XOF 167,960 for non-flooded farmers (Table 4). Moreover, the mean per capita income was XOF 195,229 for the former and XOF 183,471 for the latter (Table 5). Using Student’s comparison test between the two sub-groups, and considering the two-poverty proxies, the differences were not significant. Considering the poverty index based on expenditure, the headcount index (P0) was 41.1% for flooded farmers and 48.4% for non-flooded farmers (Table 4). This suggests that farmers in the flood-free group may tend to be poorer than those in the flooded group. The analysis was inverted when the headcount index was computed based on income, where there were more impoverished farmers among flooded farmers than among non-flooded farmers (Table 5). The poverty index is an alpha (intra-community) index and, as such, cannot be averaged over compared subgroups.
Table 6 shows the happiness analysis after the flood in 2012. 99% of the flooded farmers were unhappier.

4.3. Determinants of Poverty

The probit models regarding the determinants of poverty and happiness were globally significant at 1% (Table 7).
Regarding poverty assessment, the dependent variable, poverty, was binary and computed based on their income. The independent variable of interest was the percentage of land flooded (%) in 2012. There was a relationship between poverty and flood variables. The increase in the percentage of the flooded farm proportion led to poverty.
Moreover, six variables determined poverty in this study: household size, location, fishing, the gender of the household head, farm size, and “holding a secondary activity”. The first three variables influenced poverty positively, and the last three influenced it negatively. A household with a larger household size was more likely to be poor, whereas a household from Karimama was expected to be poorer than a household from Malanville. A farmer who has fished was poor in 2012. In addition, the gender of the household head affected poverty negatively. Female-headed households were poorer than male-headed households. A farmer holding a secondary activity was more likely to escape poverty. A farmer who had a big farm was richer than the others.

5. Discussion

5.1. Poverty

This study revealed that approximately 42% of surveyed households were monetarily poor and then living below the monetary poverty line in 2012 during the flooding. The poverty rate at the national level increased from 33% in 2007 to 38.5% in 2016, growing at an average annual rate of 4.07% (Alia et al. 2016). Considering the analysis of the poverty of farmers using “income-based indices”, poorer farmers were identified among the flooded group. This justifies the link between flooding and poverty, as highlighted by many studies outside Benin (Owusu et al. 2016; Trinh et al. 2023). The 2019 Missouri River flood caused billions of dollars in damage to businesses, homes, and public infrastructure in United States (Skevas et al. 2023). In Bangladesh, Dasgupta (2007) found that the negative effects of flooding are especially strong in the short-term in the immediate aftermath of major floods. However, he added that the normal flooding is necessary and beneficial for agriculture, transport, and fisheries. The probability of catastrophic flooding is approximately once in a decade. In Pakistan, Zulqarnain (2013) showed the devastating effects of flooding in 2010 on the livelihood of the people which made their life difficult. He added that, for the farmers who were already living in critical conditions, flooding took away their entire livelihood and made them more vulnerable. The Mbire community in Zimbabwe in 2015 was facing increasing threats from recurring high- and low-magnitude floods that manifest themselves in the disruption of livelihoods and destruction of crops and infrastructure (Mavhura and Mucherera 2020). In Malawi, Maganga et al. (2021) highlighted droughts, floods, and irregular rainfall exacerbating poverty, with droughts showing the greatest impact on farmers’ welfare loss, followed by floods. In Ghana, Atanga and Tankpa (2021) had linked climate change, flood disasters, and food security. Moreover, Winsemius et al. (2018) highlighted that African countries show a disproportionally high flood risk for the poor. Climate change will cause or aggravate the impact of flooding (Schmuck 2012). Although its greenhouse gas (GHG) emissions are among the lowest in the world (standing at just 0.05% of global emissions), Benin is one of the countries that is most vulnerable to climate change. It ranks 152nd out of 181 countries (World Bank 2023). In this situation, understanding the local impacts of climate-related events could help communities prepare for future uncertainties (Goyol and Pathirage 2018).
This paper showcased a strong relationship between floods and poverty at the household level, as reported elsewhere (Kawasaki et al. 2020; Mtapuri et al. 2018). In the sample, the mean annual per capita expenditure of the flooded farmers was greater than that of the non-flooded farmers. In contrast, the model highlighted that the increase in the percentage of the flooded farm proportion led to poverty, suggesting that flooded farmers were poor (Winsemius et al. 2018; Eakin et al. 2016). This implies that a farmer who was flooded in 2012 possessed a lower per capita income than the poverty line combined with a high per capita expenditure. A farmer may compensate for the loss of yield with an increased expenditure on recovery and prevention (food, health, drainage, farm cleaning costs, etc.) (Siwiec 2015). Farmers also reported the consumption of substitute crop commodities to arrange food for their consumption, thereby making their annual spending higher than that of non-flooded farmers. As farms are flooded, the income of the flooded group of farmers should be the smallest. With the actual revenue of the flooded farmers falling and their expenditures rising, farmers tend to rely on savings from neighbors or loan institutions or use up their capital or savings (Panman et al. 2022) or funds from disaster-rebuilding agencies (Siwiec 2015). This may explain why the expenditure for farmers whose farms were flooded increased after the 2012 disaster. Since the consumption of individuals depends on both their income as well as their neighbors’ incomes, flooded farmers use informal risk-pooling strategies (social networks, social capital, charities, and relief agencies) to smooth their consumption. After the 1998 floods, private-sector borrowing was a commonly used survival strategy by households in Bangladesh (Del Ninno et al. 2003). While this helped households to sustain consumption, long-term debts rose (Del Ninno et al. 2003). It is essential to reflect on whether individuals should use their income or consumption to cope with the impact of disasters on poverty (Gradin 2016).
This study confirms that the income indicator (income-based index) reflects the effects of the 2012 flooding. This confirms the findings of Mercader-Prats (1998), who reported that consumption is more contingent on individual idiosyncrasies than income. Thus, the superiority of consumption over income as a proxy for welfare levels in the long run can no longer be taken for granted.
Some other variables explain the poverty status of farmers in 2012. Regarding the farms’ locations, the results show that Karimama’s farmers are the poorest compared with Malanville’s. Compared with Malanville, which is close to a main road (used as a reference category), households living in Karimama, very far from the main road, are more likely to be poverty-stricken, which implies that areas with difficult access should continue to be a primary focus of poverty alleviation efforts in Benin (Biyase and Zwane 2018). Policy-makers may facilitate the access to production factors in the Karimama commune by building upon the main road leading to this commune. Household size further explains poverty, as large households are more likely to be poor (Sekhampu 2013).
The gender of the head of the household also negatively affects poverty (Biyase and Zwane 2018). This implies that female-headed households are poorer than male-headed households. Female-headed households may be more vulnerable because most would be divorced or widowed, making it easier to fall into poverty. Thus, it is vital to strengthen their capacity to cope with shocks like flooding. In this regard, making more land available to farmers may be beneficial. Finally, livelihood diversification can help to address economic shocks and mitigate poverty (Dagunga et al. 2020). Therefore, promoting off-farm income-generating activities is essential to poverty reduction.

5.2. Happiness

The 2012 flood destroyed farms, leading to yield losses and affecting the mood of the farmers. The result yielded that 99% of flooded farmers were unhappier after the flood in 2012.
Thus, the flood was an exogenous shock that disturbed the farmers’ existing state of equilibrium (Strack et al. 1991). Satisfaction with life among the individuals who experienced the flood was considerably lower (Sekulova and Van den Bergh 2016). Similar results were reported by Armah et al. (2010), who found that 90% of respondents in Ghana felt worse off after the 2007 flood. Other studies also found that experiencing a flood and perceiving a recurrence of such an event was associated with a considerable decrease in the subjective well-being in Bulgaria (Sekulova et al. 2017).
The findings also suggested that farmers who produced rice in 2012 were unhappier than the others. Since rice is usually produced near rivers, flooding destroyed rice production, leading to unhappiness among farmers. The findings also suggest that a farmer engaged in fishing is happier than a farmer who is not, as previously illustrated by Bodmer et al. (2018).

6. Conclusions

This work assessed the poverty and happiness of farmers in response to flood shocks. It had some limitations. For example, the data on the flood, income, consumption, and happiness relied heavily on the recall memory of the farmers. This implies some risk of the poor or inaccurate report of what they have experienced. Nevertheless, the recall reports biases have been reduced with the large sampling size and the technique of the random selection of the farmers into the sample. In addition, these results could be observed as an important step towards modelling and responding to flooding impacts. Furthermore, only agricultural loss was considered to assess farmers’ poverty, which may be a simplification concerning designing new policies. Accounting for data on damages posed by floods to fences, soil, equipment, structures, and stocks could yield a more robust model. Despite these shortcomings, the findings are unique and reveal useful lessons for response designs. Overall, the 2012 flood impacted farmers’ incomes, raising their consumption and leading to poverty. This highlights the devastating impact that floods can have on agricultural communities and underscores the urgent need for effective disaster relief measures. Seven variables determined poverty in this study: the percentage of the farm size that is flooded, household size, location, fishing, the gender of the household head, farm size, and “holding a secondary activity”. The first four variables positively influenced poverty, and the last three negatively influenced it. Furthermore, 99% of the flooded farmers were unhappier after the 2012 flood.
To mitigate flood impacts, decision-makers should consider strengthening the flood risk management capacity (in terms of prevention, risk, and response capacity reductions) and governance (via improvement of the regulatory framework and greater accountability of the local communities). Future research could focus on studying other damages (pasture, fences, soil, buildings, equipment, stocks, and cleaning costs) and the post-flood coping strategies of farmers and flood insurance in the context of Sub-Saharan African countries.

Author Contributions

Conceptualization, A.B.; Methodology, A.B.; Software, A.B.; Validation, A.B.; S.Z. and S.A.; Formal Analysis, A.B.; Investigation, A.B.; Resources, A.B.; Data Curation, A.B.; Writing—Original Draft Preparation, A.B.; Writing—Review & Editing, S.Z. and S.A.; Visualization, S.Z. and S.A.; Funding Acquisition, A.B. All authors have read and agreed to the published version of the manuscript.

Funding

This work draws from the corresponding author’s Ph.D. thesis (which is online), supported by the West African Science Service Center on Climate Change and Adapted Land Use (WASCAL), a graduate program of the German Federal Ministry of Education and Research (BMBF).

Informed Consent Statement

Informed consent was obtained from all subjects involved in the study during the interviews.

Data Availability Statement

Data will available upon request.

Acknowledgments

We thank the editors, the Adama Diaw and Tobias Wünscher. We would like also to thank Adandé Belarmain Fandohan, Alphonse Singbo and Anselme Adégbidi, as well as numerous conference participants, for their thoughtful comments and dialogues.

Conflicts of Interest

The authors declare no conflict of interest.

References

  1. Adnan, Mohammed Sarfaraz Gani, Abu Yousuf Md Abdullah, Ashraf Dewan, and Jim W. Hall. 2020. The effects of changing land use and flood hazard on poverty in coastal Bangladesh. Land Use Policy 99: 104868. [Google Scholar] [CrossRef]
  2. African Economic Outlook. 2020. Africa’s Economic Performance and Outlook Amid COVID-19. 116p, ISBN 978-973-9848-8-3. Electronic. Available online: https://www.afdb.org/sites/default/files/documents/publications/afdb20-04_aeo_supplement_full_report_for_web_0705.pdf (accessed on 24 January 2023).
  3. Alia, Didier Yelognisse, Katia A. S. M. Jossa-Jouable Alia, and Edwige Rose Fiamohe. 2016. On poverty and the persistence of poverty in Benin. Journal of Economic Studies 43: 661–76. [Google Scholar] [CrossRef]
  4. Ariom, Thaddaeus Obaji, Elodie Dimon, Eva Nambeye, Ndèye Seynabou Diouf, Oludotun Olusegun Adelusi, and Sofiane Boudalia. 2022. Climate-smart agriculture in African countries: A Review of strategies and impacts on smallholder farmers. Sustainability 14: 11370. [Google Scholar] [CrossRef]
  5. Armah, Frederick A., David O. Yawson, Genesis T. Yengoh, Justice O. Odoi, and Ernest K. A. Afrifa. 2010. Impact of Floods on Livelihoods and Vulnerability of Natural Resource Dependent Communities in Northern Ghana. Water 2: 120–39. [Google Scholar] [CrossRef]
  6. Atanga, Raphael Ane, and Vitus Tankpa. 2021. Climate change, flood disaster risk and food security nexus in Northern Ghana. Frontiers in Sustainable Food Systems 5: 706721. [Google Scholar] [CrossRef]
  7. Ayerakwa, Hayford M., Robert D. Osei, and Isaac Osei-Akoto. 2014. Poverty and Happiness: An examination of the factors influencing Happiness among the extreme poor in rural Ghana. Paper presented at the UNU-WIDER Conference on Inequality, Helsinki, Finland, September 5–6; 16p. Available online: http://hdl.handle.net/10419/126331 (accessed on 6 September 2014).
  8. Baudoin, Marie-Ange, Aida Cuni Sanchez, and Belarmain Fandohan. 2013. Small scale farmers’ vulnerability to climatic changes in southern Benin: The importance of farmers’ perceptions of existing institutions. Mitig Adapt Strateg Glob Change 19: 1195–207. [Google Scholar] [CrossRef]
  9. Biyase, Mduduzi, and Talent Zwane. 2018. An empirical analysis of the determinants of poverty and household welfare in South Africa. The Journal of Developing Areas 52: 115–30. Available online: https://www.jstor.org/stable/26416998 (accessed on 24 January 2023). [CrossRef]
  10. Bodmer, Richard, Pedro Mayor, Miguel Antunez, Kimberlyn Chota, Tula Fang, Pablo Puertas, Marlini Pittet, Maire Kirkland, Mike Walkey, Claudia Rios, and et al. 2018. Major shifts in Amazon wildlife populations from recent intensification of floods and drought. Conservation Biology 32: 333–44. [Google Scholar] [CrossRef] [PubMed]
  11. Bonou, Alice, Tobias Wünscher, Anselme Adéniyi Adégbidi, and Adama Diaw. 2018. Impact of Floods on Farmers’ Livelihoods in the Semi-arid Zone of Benin. In Strategies for Building Resilience against Climate and Ecosystem Changes in Sub-Saharan Africa. Edited by Osamu Saito, Gordana Kranjac-Berisavljevic, Kazuhiko Takeuchi and Edwin A. Gyasi. Science for Sustainable Societies. Singapore: Springer, pp. 59–77. [Google Scholar] [CrossRef]
  12. Bremond, Pauline, Grelot Frédéric, and Agenais Anne-Laurence. 2013. Economic evaluation of flood damage to agriculture–review and analysis of existing methods. Natural Hazards and Earth System Sciences 13: 2493–512. [Google Scholar] [CrossRef]
  13. Dagnelie, Pierre. 1998. Statistiques Théoriques et Appliquées. Bruxelles: De Boeck et Larcier. [Google Scholar]
  14. Dagunga, Gilbert, Micheal Ayamga, and Gideon Danso-Abbeam. 2020. To what extent should farm households diversify? Implications on multidimensional poverty in Ghana. World Development Perspectives 20: 100264. [Google Scholar] [CrossRef]
  15. Dasgupta, Amrita. 2007. Floods and poverty traps: Evidence from Bangladesh. Economic and Political Weekly 28: 3166–71. Available online: https://www.jstor.org/stable/4419847 (accessed on 24 January 2023).
  16. Deaton, Angus. 1997. The Analysis of Household Surveys: A Microeconometric Approach to Development Policy. Washington, DC: World Bank Publications. [Google Scholar]
  17. Del Ninno, Carlo, Paul A. Dorosh, and Lisa C. Smith. 2003. Public Policy, Food Market and Household Coping Strategies in Bangladesh: Lessons from the 1998 Floods. IFPRI, FCND discussion paper n°: 156. Washington, DC: International Food Policy Research Institute. 54p. [Google Scholar] [CrossRef]
  18. Devereux, Stephen, and J. Allister McGregor. 2014. Transforming Social Protection: Human Well-being and Social Justice. European Journal of Development Research 26: 296–310. [Google Scholar] [CrossRef]
  19. Devoto, Florencia, Esther Duflo, Pascaline Dupas, William Parienté, and Vincent Pons. 2012. Happiness on Tap: Piped Water Adoption in Urban Morocco. American Economic Journal: Economic Policy 4: 68–99. [Google Scholar] [CrossRef]
  20. Diener, Ed, and Robert Biswas-Diener. 2002. Will money increase subjective well-being? Social Indicators Research 57: 119–69. [Google Scholar] [CrossRef]
  21. Diener, Ed, Daniel Kahneman, and John Helliwell. 2010. International Differences in Well-Being. New York: Oxford University Press. [Google Scholar] [CrossRef]
  22. Diener, Ed, Daniel Kahneman, Raksha Arora, James Harter, and William Tov. 2009. Assessing Well-Being. Oxford: Springer. [Google Scholar] [CrossRef]
  23. Duclos, Jean-Yves, and Abdelkrim Araar. 2006. Poverty and Equity: Measurement, Policy and Estimation with DAD. Edited by Jacques Silber. Ramat Gan: Bar Han University. [Google Scholar]
  24. Eakin, Hallie, Amy M. Lerner, David Manuel-Navarrete, Bertha Hernández Aguilar, Alejandra Martínez-Canedo, Beth Tellman, Lakshmi Charli-Joseph, Rafael Fernández Álvarez, and Luis Bojórquez-Tapia. 2016. Adapting to risk and perpetuating poverty: Household’s strategies for managing flood risk and water scarcity in Mexico City. Environmental Science & Policy 66: 324–33. [Google Scholar] [CrossRef]
  25. Ezin, Vincent, Emeric G. M. Kochoni, and Adam Ahanchede. 2018. Agriculture and food security under threat of change climate in Benin. African Journal of Agricultural Research 13: 1389–99. [Google Scholar] [CrossRef]
  26. Fekete, Alexander. 2010. Assessment of Social Vulnerability for River-Floods in Germany. Doctoral dissertation, Rheinische Friedrich-Wilhelms-Universität Bonn, Bonn, Germany. Online-Ausgabe in Bonndoc. Available online: https://nbn-resolving.org/urn:nbn:de:hbz:5N-20040 (accessed on 9 November 2023).
  27. Frey, Bruno S., and Alois Stutzer. 2002. What Can Economists Learn from Happiness Research? Journal of Economic Literature 40: 402–35. [Google Scholar] [CrossRef]
  28. Goyol, Simi, and Chaminda Pathirage. 2018. Farmers perceptions of climate change related events in Shendam and Riyom, Nigeria. Economies 6: 70. [Google Scholar] [CrossRef]
  29. Gradín, Carlos. 2016. 8. Poverty and ethnicity in Asian countries. In The Asian ‘Poverty Miracle’: Impressive Accomplishments or Incomplete Achievements? Edited by Jacques Silber and Guanghua Wan. Cheltenham and Northampton: Edward Elgar Publishing, pp. 253–297. [Google Scholar] [CrossRef]
  30. Günther, Isabel, and Kenneth Harttgen. 2009. Estimating households’ vulnerability to idiosyncratic and covariate shocks: A novel method applied in Madagascar. World Development 37: 1222–34. [Google Scholar] [CrossRef]
  31. Harvey, Celia A., Zo Lalaina Rakotobe, Nalini S. Rao, Radhika Dave, Hery Razafimahatratra, Rivo Hasinandrianina Rabarijohn, Haingo Rajaofara, and James L. MacKinnon. 2014. Extreme vulnerability of smallholder farmers to agricultural risks and climate change in Madagascar. Philosophical Transactions of the Royal Society B: Biological Sciences 369: 20130089. [Google Scholar] [CrossRef]
  32. Haughton, Jonathan, and Shahidur R. Khandker. 2009. Handbook on Poverty and Inequality. Washington, DC: The International Bank for Reconstruction and Development. Washington, DC: The World Bank. [Google Scholar]
  33. Helliwell, John, Richard Layard, and Jeffrey Sachs. 2013. World Happiness Report 2013. New York: UN Sustainable Development Solutions Network. Available online: http://idr.uin-antasari.ac.id/id/eprint/352 (accessed on 24 January 2023).
  34. INSAE. 2012. Note sur la pauvreté au Benin. Constanța: INSAE. 21p, a local report. [Google Scholar]
  35. IPCC. 2014. Impacts, Adaptation, and Vulnerability. Part B: Regional Aspects. Contribution of Working Group II to the Fifth Assessment Report of the Intergovernmental Panel on Climate Change. Edited by Vicente R. Barros, Christopher B. Field, David Jon Dokken, Michael D. Mastrandrea, Katharine J. Mach, T. Eren Bilir and Linda L. White. Cambridge and New York: Cambridge University Press. [Google Scholar]
  36. Johnson, Fiona, Christopher J. White, Albert van Dijk, Marie Ekstrom, Jason P. Evans, Dörte Jakob, Anthony S. Kiem, Michael Leonard, Alexandra Rouillard, and Seth Westra. 2016. Natural hazards in Australia: Floods. Climatic Change 139: 21–35. [Google Scholar] [CrossRef]
  37. Kahneman, Daniel, and Angus Deaton. 2010. High income improves evaluation of life but not emotional well-being. Proceedings of the National Academy of Sciences of the United States of America 107: 16489–93. [Google Scholar] [CrossRef] [PubMed]
  38. Kahneman, Daniel, Edward Diener, and Norbert Schwarz, eds. 1999. Well-Being: The Foundations of Hedonic Psychology. New York: Russell Sage Foundation. [Google Scholar]
  39. Kaminski, Jonathan. 2014. Subjective Wealth and Satisfaction with Policy Reform: Evidence from the Cotton Reform Experience in Burkina Faso. Journal of African Economies 23: 528–81. [Google Scholar] [CrossRef]
  40. Kawasaki, Akiyuki, Genki Kawamura, and Win Win Zin. 2020. A local level relationship between floods and poverty: A case in Myanmar. International Journal of Disaster Risk Reduction 42: 101348. [Google Scholar] [CrossRef]
  41. Khayyam, Umer. 2020. Floods: Impacts on livelihood, economic status and poverty in the north-west region of Pakistan. Natural Hazards 102: 1033–56. [Google Scholar] [CrossRef]
  42. Lawin, Agnide E., P. B. Irénikatché Akponikpè, Abdulai Jalloh, Gerald C. Nelson, and Timothy S. Thomas. 2013. Chapter 3 Benin. In West African Agriculture and Climate Change, A Comprehensive Analysis. Edited by Abdulai Jalloh, Gerald C. Nelson, Timothy S. Thomas, Robert Bellarmin Zougmoré and Harold Roy-Macauley. Washington, DC: International Food Policy Research Institute, pp. 53–78. [Google Scholar]
  43. Lokonon, Boris Odilon Kounagbè. 2016. Urban households attitude towards flood risk, and waste disposal: Evidence from Cotonou. International Journal of Disaster Risk Reduction 19: 29–35. [Google Scholar] [CrossRef]
  44. Maganga, Assa M., Levison Chiwaula, and Patrick Kambewa. 2021. Climate induced vulnerability to poverty among smallholder farmers: Evidence from Malawi. World Development Perspectives 21: 100273. [Google Scholar] [CrossRef]
  45. Mavhura, Emmanuel, and Blessing Mucherera. 2020. Flood survivors’ perspectives on vulnerability reduction to floods in Mbire district, Zimbabwe. Jàmbá: Journal of Disaster Risk Studies 12: 1–12. Available online: https://hdl.handle.net/10520/EJC-1d217baa02 (accessed on 3 January 2024).
  46. McGregor, Allister, and Andy Sumner. 2010. Beyond business as usual: What might 3-D well-being contribute to MDG momentum? IDS Bulletin 41: 104–12. [Google Scholar] [CrossRef]
  47. Mercader-Prats, M. L. H. 1998. Assessing Alternative Reforms to the Spanish Income Tax: A Static Micro-Simulation Approach. Cambridge: Microsimulation in the New Millenium, Microsimulation Unit. [Google Scholar]
  48. Mounirou, Ichaou, and Jérémie Yebou. 2022. Perceptions of Climate Risks and Migration of Agricultural Producers in Northern Benin. Society & Natural Resources 36: 190–208. [Google Scholar] [CrossRef]
  49. Mtapuri, Oliver, Ernest Dube, and Jephias Matunhu. 2018. Flooding and poverty: Two interrelated social problems impacting rural development in Tsholotsho district of Matabeleland North province in Zimbabwe. Jàmbá: Journal of Disaster Risk Studies 10: 1–7. Available online: https://hdl.handle.net/10520/EJC-e35ee377f (accessed on 6 February 2024).
  50. Nadeem, Abdul Majeed, Muhammad Zahid Rafique, Khuda Bakhsh, Muhammad Sohail Amjad Makhdum, and Shaoan Huang. 2020. Impact of socio-economic and water access conditions on life satisfaction of rural farmers in Faisalabad district of Pakistan. Water Policy 22: 686–701. [Google Scholar] [CrossRef]
  51. Omungu, Belinda A. 2014. Impact of Natural Disasters on Rural Household Poverty—A Case Study of Floods in Lower Kano Plains, Kenya. Doctoral dissertation, University of Nairobi, Nairobi, Kenya. [Google Scholar]
  52. Owusu, Alex Barimah, Jacqueline Tiaba Jakpa, and Kwabena Gyekye Awere. 2016. Smallholder farmers’ vulnerability to floods in the Tolon District, Ghana. Interdisciplinary Environmental Review 17: 286–311. [Google Scholar] [CrossRef]
  53. Panman, Alexandra, Ian Madison, Nyambiri Nanai Kimacha, and Jean-Benoît Falisse. 2022. Saving up for a rainy day? Savings groups and resilience to flooding in Dar es Salaam, Tanzania. In Urban Forum. Dordrecht: Springer, vol. 33, pp. 13–33. [Google Scholar] [CrossRef]
  54. Parker, Dennis J. 2000. Introduction to Floods and Flood Management. In Floods. Edited by Dennis J. Parker. London and New York: Routledge, vol. 1. [Google Scholar]
  55. Pradhan, Kailash Chandra, and Shrabani Mukherjee. 2016. Covariate and Idiosyncratic Shocks and Coping Strategies for Poor and Non-poor Rural Households in India. Journal of Quantitative Economics 16: 101–27. [Google Scholar] [CrossRef]
  56. Pricope, Narcisa G., Christopher Hidalgo, J. Scott Pippin, and Jason M. Evans. 2022. Shifting landscapes of risk: Quantifying pluvial flood vulnerability beyond the regulated floodplain. Journal of Environmental Management 304: 114221. [Google Scholar] [CrossRef] [PubMed]
  57. Ravallion, Martin. 1994. Poverty Comparisons, Fundamentals of Pure and Applied Economics. Chur: Harwood Academic Publishers, vol. 56. [Google Scholar]
  58. Reinhardt, Ulrich G., and Peter J. Hrodey. 2019. Trap happiness and catch bias in sea lamprey traps. Fishes 4: 34. [Google Scholar] [CrossRef]
  59. Ryan, Richard M., and Edward L. Deci. 2001. On happiness and human potentials: A Review of Research on Hedonic and Eudaimonic well-being. Annual Review Psychology 52: 141–66. [Google Scholar] [CrossRef]
  60. Schmuck, Hanna. 2012. Flood. In Handbook of Hazards and Disaster Risk Reduction. London: Routledge, pp. 244–56. [Google Scholar]
  61. Scoones, Ian. 1998. Sustainable Rural Livelihoods: A Framework for Analysis. IDS Working Paper 72. Edited by IDS Editorial Team. Hoboken: John Wiley & Sons Ltd. Brighton: University of Sussex, Falmer, East Sussex. Online ISSN:2040-0209, Print ISSN:1353-6141. [Google Scholar]
  62. Sekhampu, Tshediso Joseph. 2013. Determinants of poverty in a South African township. Journal of Social Sciences 34: 145–53. [Google Scholar] [CrossRef]
  63. Sekulova, Filka, and Jeroen C. J. M. Van den Bergh. 2016. Floods and happiness: Empirical evidence from Bulgaria. Ecological Economics 126: 51–57. [Google Scholar] [CrossRef]
  64. Sekulova, Filka, Giorgos Kallis, and François Schneider. 2017. Climate change, happiness and income from a degrowth perspective. In Handbook on Growth and Sustainability. Cheltenham: Edward Elgar Publishing. [Google Scholar]
  65. Shrestha, Badri Bhakta, Edangodage Duminda Pradeep Perera, Shun Kudo, Mamoru Miyamoto, Yusuke Yamazaki, Daisuke Kuribayashi, Hisaya Sawano, Takahiro Sayama, Jun Magome, Akira Hasegawa, and et al. 2019. Assessing flood disaster impacts in agriculture under climate change in the river basins of Southeast Asia. Natural Hazards 97: 157–92. [Google Scholar] [CrossRef]
  66. Siwiec, Ewelina. 2015. Losses and expenditures caused by extreme events in Poland. Disaster Prevention and Management 24: 553–69. [Google Scholar] [CrossRef]
  67. Skevas, Theodoros, Ray Massey, and Sherry L. Hunt. 2023. Farm impacts of the 2019 Missouri River floods and economic valuation of flood risk reduction. Journal of Environmental Management 344: 118483. [Google Scholar] [CrossRef] [PubMed]
  68. Strack, Fritz, Michael Argyle, and Norbert Schwarz. 1991. Subjective Well-Being: An Interdisciplinary Perspective. Oxford: Pergamon Press. [Google Scholar]
  69. Trinh, Toan, N. Do, L. Trinh, and K. Carr. 2023. Flood forecasting by means of dynamical downscaling of global NWPs coupling with a hydrologic model at Nong Son-Thanh My River basins. Journal of Water and Climate Change 14: 3257–79. [Google Scholar] [CrossRef]
  70. Waterman, Alan S. 1993. Two conceptions of happiness: Contrasts of personal expressiveness (eudaimonia) and hedonic enjoyment. Journal of Personality and Social Psychology 64: 678–91. [Google Scholar] [CrossRef]
  71. Welsch, Heinz. 2005. Environment and happiness: Valuation of air pollution using life satisfaction data. Ecological Economics 58: 801–13. [Google Scholar] [CrossRef]
  72. Winsemius, Hessel C., Brenden Jongman, Ted I. E. Veldkamp, Stephane Hallegatte, Mook Bangalore, and Philip J. Ward. 2018. Disaster risk, climate change, and poverty: Assessing the global exposure of poor people to floods and droughts. Environment and Development Economics 23: 328–48. [Google Scholar] [CrossRef]
  73. World Bank. 2011. Benin-Inondations au Benin: Rapport d’Evaluation des Besoins Post-Catastrophe. Washington, DC: World Bank Group. 84p, Available online: http://documents.worldbank.org/curated/en/750141468208769683/Benin-Inondations-au-Benin-rapport-devaluation-des-besoins-post-catastrophe (accessed on 24 January 2023). (In English)
  74. World Bank. 2023. Benin—Rapport National sur le Climat et le Développement. Country Climate and Development Report, n°: 186227. Washington, DC: World Bank. 118p. [Google Scholar]
  75. World Development Indicators. 2020. Available online: https://databank.worldbank.org/source/world-development-indicators (accessed on 24 January 2023).
  76. Zulqarnain, Zulqarnain. 2013. Economic Impacts of Floods on Small Scale Farmers of Pakistan: A Case Study from the District Nowshera, Khyber Pukhtunkhwa Province. Master’s thesis, Rural Development and Natural Resource Management. Faculty of Natural Resources and Agricultural Sciences, Swedish University of Agricultural Sciences, Uppsala, Sweden; 51p. Available online: https://stud.epsilon.slu.se (accessed on 2 January 2024).
Figure 1. Map of the study system.
Economies 12 00052 g001
Table 1. Sample size with the surveyed villages in the municipality of Malanville.
DistrictVillage/CityTotal of Recorded
Farmers
Total of Surveyed Farmers
Monkassa4612
Garou 12
Bodjecali11312
Galiel8612
Kotchi4412
Monney17412
Malanville 48
Banite 12812
Banite 29012
Kantro6112
Guene 36
Sakanwa Zenon3012
Toumboutou 12
Total672108
Table 2. Sample size with the surveyed villages in the municipality of Karimama.
DistrictVillage/CityTotal of Recorded
Farmers
Total of Surveyed Farmers
Birni Lafia8312
Kargui6512
Tondikoaria8512
Birni Lafia 36
Mamassi Gourma14012
Torioh9312
Bogo Bogo 24
Kompa14912
Kompanti1812
Kompa 24
Goroubiri2912
Karimama-Centre14912
Mamassi Peulh7012
Karimama 36
Total881120
Table 3. Poverty indices in the full sample.
Poverty IndicesUsing Consumption Using Income
EstimateStandard ErrorEstimateStandard Error
Consumption183,193173,626--
Income--193,630219,895
P0 (%)42.103.2747.803.31
P10.170.010.230.01
P20.090.010.140.01
Table 4. Poverty analysis comparing flooded and non-flooded groups using expenditure.
Sub-Group of the Sample Expenditure (XOF) Significant Difference Headcount Index (%)
Group of flooded farmers 185,590 t = −0.5247
Pr(|T| > |t|) = 0.6003
41.11
Group of non-flooded farmers 167,960 48.38
Table 5. Poverty analysis comparing flooded and non-flooded groups using income.
Sub-Group of the SampleIncome (XOF)Significant DifferenceHeadcount Index (%)
Group of flooded farmers 195,229t = −0.2762
Pr(|T| > |t|) = 0.7827
48.22
Group of non-flooded farmers 183,47145.16
Table 6. Descriptive statistics of the perception of the level of happiness of flooded farmers.
Happiness Perception after the 2012 FloodsFrequencyPercentageCum.
“very happy”000
“pretty happy”21.021.02
“not too happy”19598.98100
Total197100.00
Table 7. Determinants of poverty.
Independent VariablesModel Probit
Percentage of land flooded (%)0.001 *
(0.001)
Household size 0.031 ***
(0.006)
Gender (male = 1)−0.310 ***
(0.110)
Having a second activity (yes = 1)−0.500 ***
(0.08)
Fishing (yes = 1)0.160 *
(0.090)
Location (Karimama = 1) 0.280 ***
(0.070)
Farm size−0.005 ***
(0.010)
Constant 0.650
(0.450)
Observation228
Prob > chi2 0.000
Pseudo R2 0.310
Note: ***, and * indicate significance at 1%, and 10%, respectively. Robust standard errors are in parentheses.
Disclaimer/Publisher’s Note: The statements, opinions and data contained in all publications are solely those of the individual author(s) and contributor(s) and not of MDPI and/or the editor(s). MDPI and/or the editor(s) disclaim responsibility for any injury to people or property resulting from any ideas, methods, instructions or products referred to in the content.

