1. Introduction
The Romanian economy has transitioned from slow growth to rapid development based on the principles of sustainable development. It is essential to coordinate the interaction between economic production and environmental consequences for sustainable economic development. Development that meets current demands without affecting the capacity of future generations to satisfy their own needs is known as sustainable development (
Romanian Government 2018). As a result, it objectively represents the sustainable level of economic development. However, in order to achieve ecological growth, it is necessary to identify the possible measures that contribute to sustainable development, such as sustainable transport—the main source of pollution reduction. Green economy, of which sustainable transport is an integral part (
MRDPA 2016), represents an important source for promoting high-quality sustainable economic development. Sustainable transport plays a key role in promoting sustainable economic development by promoting economic development based on low-carbon technologies, i.e., reducing pollution. Sustainable transport can have an impact on local economic development. The Green New Deal (
GND 2023) has a global perspective, but local, national, and regional actions are still needed. On the 14 July 2021, the European Parliament adopted several proposals to adapt EU climate, energy, and transport policies with the aim to reduce net greenhouse gas emissions by at least 55% by 2030. All EU initiatives on green economy are interconnected and complementary, so any measures which need to be taken must consider the income and costs they generate.
One aspect of regional development is sustainable development, which is the process of changing the dynamic balance between social, economic, and environmental factors (
Mach et al. 2021). Green economy represents an economy providing a higher quality of life for all within the ecological limits of the planet (
GEC 2023). The economic aspect of this is about promoting economic growth and development. This is an aspect of economic development that we will also follow in our research by analyzing the impact of sustainable transport on regional development. Transportation can be a key facilitator of sustainable economic growth and can act as a magnet for regional economic growth by attracting resources from other regions (
Pradhan and Bagchi 2012). Transport is an important factor in transforming human life, from trade to production, education, research, entertainment, culture, and defense. An efficient transport system can have certain positive outcomes in terms of economic growth, such as lower transport costs, reduced time, economic and communication opportunities are created, increased employment, tourism, and foreign investment.
The aim of regional development is to reduce the socio-economic disparities between different places, raise living standards, and provide residents with high-quality services by promoting and diversifying economic activity and investment in both the public and private sectors (
Apostolache 2014). The European Commission adopted a package of proposals in 2022 to set up EU policies to reduce the Union’s net greenhouse gas emissions by at least 55% by 2030 compared to the 1990 levels (
European Commission 2021a). Europe has to reduce its emissions if it plans to become the first continent to be carbon neutral by 2050 and make its commitments in the European Green Deal a reality (
European Commission 2020). The regulation on effort sharing for the mandatory annual reduction in greenhouse gas emissions by EU Member States in the period 2021–2030 (
European Commission 2021b) requires each member state to reduce emissions in the building, road and inland waterway transport, agriculture, waste, and small industries sectors. These targets are set considering the baseline situation and the different capabilities of each member state and are based on the GDP per capita, adjusted to ensure cost-effectiveness. The Executive Vice President of the Green Pact, Frans Timmermans, says that all parts of the transport sector must actively contribute to achieving our climate and zero-pollution targets (
European Commission 2023).
In Romania, green economy is linked to sustainable development. The National Strategy for Sustainable Development—Horizons 2012–2020–2030 states that, by using appropriate economic policy means, the productivity of material and energy consumption resources can be increased at an average annual rate of 3–4% over the period 2008–2030 (
Ardeleanu et al. 2012). An attractiveness study by Ernst &Young in 2021 (
EY Romania 2021) considers Romania to be a desirable place in which to engage in the green economy, as it can take advantage of the opportunities provided by the Fair Transition Mechanism and the European Green Deal in addition to other funds allocated to the green economy. Romania is among the countries with the lowest GHG emissions per capita in the European Union, yet it ranks among the top states when the same indicators are compared to the size of GDP (
Popovici 2021).
The decision to analyze the impact of EU funding on sustainable transport in Romania was driven by some gaps or unresolved issues in the existing literature. These gaps often arise from the need to understand, in the context of sustainable development and economic growth, the exact impact of policy interventions, the effectiveness of funding allocation, and its apparent effects. While numerous studies have been conducted on the general impact of EU funds on economic development, few studies explicitly address Romania, particularly with regard to sustainable transport. Research in this area could help to uncover the specific benefits of EU-funded sustainable transport projects, such as reduced carbon emissions, improved urban mobility, and economic benefits. Another motivating factor for research on this topic could be the need to evaluate the efficiency and effectiveness of the allocation of EU funds to sustainable transport projects in Romania. The question of whether these funds are optimally used to achieve the desired results in terms of sustainability and economic development could drive research in this area.
Given the EU’s focus on reducing regional inequalities, it is important to understand how investment in sustainable transport supports this objective in the Romanian context, which, in turn, could be an important motivation for research. A research agenda that focuses on the long-term outcomes and sustainability of EU-funded projects in Romania can provide valuable information for future policy making and funding allocation. Addressing these gaps or answering specific research questions could make an important contribution to knowledge about the impact of EU funding on sustainable transport in Romania and provide valuable information for policymakers, practitioners, and future research in this area.
Through this research, it is highlighted that Romania has made commitments in terms of climate policy and pollution reduction. This research, thus, underlines the importance of promoting green economy through the effective use of EU funds for sustainable transport. Since there is no established system of indicators to evaluate the green economy (
Adarina et al. 2019), our research analyzes the financial allocation of EU funds for sustainable transport and its impact on the GDP of the developing regions in Romania. The economic indicators used in this study are the financial allocations for the Objective 7 funding line of “Promoting sustainable transport systems and removing bottlenecks in major network infrastructures” and the GDP per region. The state remains the most important actor in the implementation of clean technology innovation and the growth of the green economy. The nation’s overall development is part of each region’s development, and their potential for progress has been and continues to be encouraged by European Union Structural Funds (
Mach et al. 2021). On the other hand, green economic development can contribute to a country’s gross domestic product (GDP), leading to economic growth (
Ali et al. 2021). Research suggests that a growing GDP per capita has come to be a primary aspect driving carbon emissions (
Zhu and Gao 2019). Transport became the supplier of around 1/4 of the EU’s overall CO2 emissions in 2019 (
European Parliament 2023). Of these, 71.7% originated from avenue shipping, in line with a document by the European Environment Agency (
European Parliament 2023). Thus, funding sustainable transport could cause a decrease in carbon emissions; however, the GDP per capita will still continue to trend upwards. Advanced transport infrastructure may be an essential element in the improvement of the economy, and righting plans of delivering infrastructure investments may affect the boom capacity of the areas in which they are applied and help reduce local disparities so as to obtain a sustainable economy and maintain social stability (
Mohmand et al. 2016). Studies in India reveal that there is a two-way causality between road transport infrastructure and economic growth (
Pradhan and Bagchi 2012). This means that road transport drives economic growth and vice versa; therefore, an increase in transport investments would have a positive effect on economic growth. The same study concludes that there is a two-way causal relationship between road transport infrastructure and gross domestic capital formation and also reveals a bidirectional causality between economic growth and gross domestic capital formation (
Pradhan and Bagchi 2012). Research findings also show that transport infrastructure plays a positive role in promoting economic growth in “Belt and Road Initiative” (BRI) countries (
Chao Wang et al. 2020).
Sustainable transportation policies reduce air pollution and, thus, contribute directly to better health and green economy development. Sustainable transport aims to build flexible and resilient transport structures that support economic growth, enhance public health, and contribute to a more sustainable environment (
Hmamed et al. 2023). The results from some studies suggest that transport infrastructure has a promotional effect on economic development and a significant and positive effect on economic growth (
Zhang and Cheng 2023;
Ghosh and Dinda 2019). Research on the U.S. shows that federal spending on transportation infrastructure increases the economy’s capital stock, increasing its capacity to produce goods and services and leading to more job opportunities and a higher GDP (
IHS Markit 2021). On the other hand, studies in China show that transport infrastructure is an important factor in regional economic growth (
Qiuming Lai 2020).
The main trend in economic development is regional economic competition, and transport infrastructure is an important driving force for integrating regional resources and promoting economic development (
Wei-Guo Ma 2021). Research shows a positive impact of regional operational programs on regional entrepreneurial and socio-institutional capital (
Zhironkin and Cehlár 2022). This positive impact moves regions forward on the path of sustainable development, a phenomenon which has a practical impact on the efficiency of the disbursement of EU funds. Similarly, our research highlights the effects of EU funding in the sustainable transport sector on regional development in Romania. Structural funds are the main instrument for green project initiatives and have a positive impact on a country’s macroeconomic indicators (
Mach et al. 2021).
This paper is structured as follows. The Introduction introduces the reader to the topic of regional economic development and its relationship with the green economy and sustainable transport.
Section 2 provides a review of the most relevant studies in the field.
Section 3 is dedicated to the methodology and the main data sources used.
Section 4 is divided into three sub-sections:
4.1. The Distribution of ESIF Funds for Cohesion Policy Objective 7: “
Promoting sustainable transport systems and removing bottlenecks in major network infrastructures.”; 4.2. Some Evolution Patterns in Romanian Regional Economic Growth; and
4.3. The effects of ESIF Investments on Regional Economic Development. Section 5 presents the main discussion, while the last section,
Section 6, has been dedicated to our conclusions.
2. Literature Review
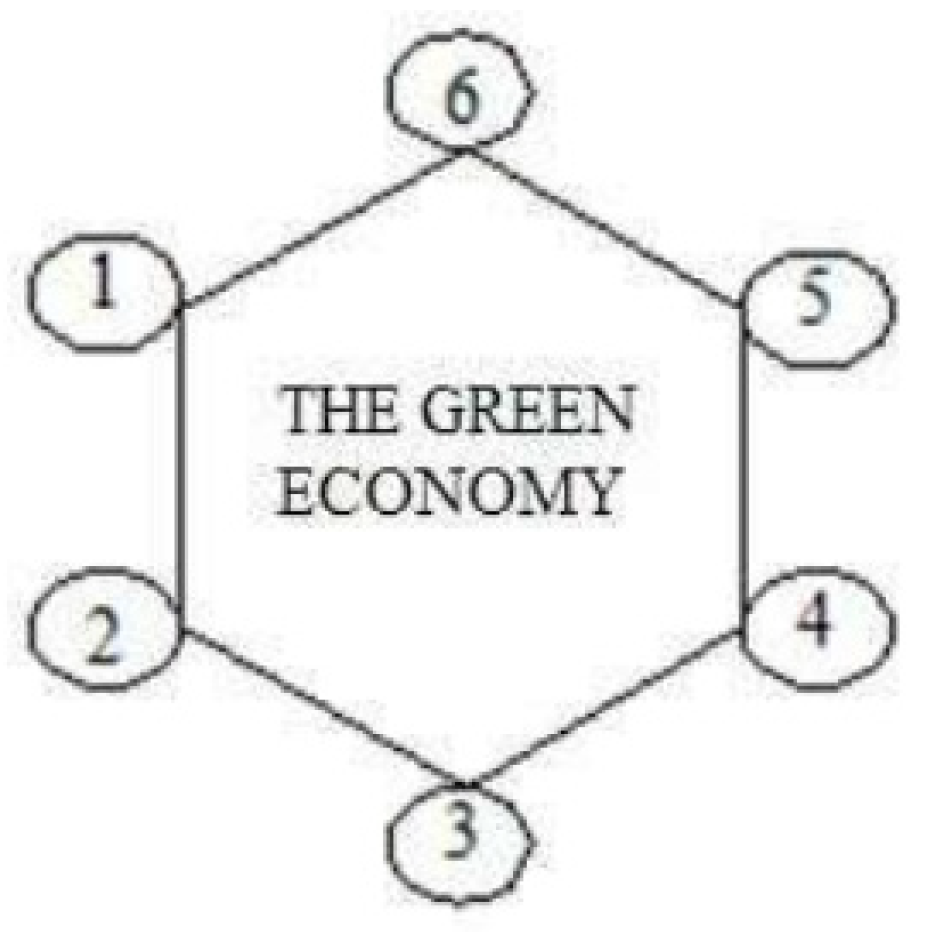
The literature review chapter is divided into three parts: 2.1. The Relationship Between Green Economy and Sustainable Development; 2.2. Brief Reflections on Sustainable Transport as One of the Components of the Green Economy; and 2.3. General Reflections on Investments in ESI funds. This division is based on Karl Burkart’s hexagon. According to Karl Burkart (
UNEP 2011), the green economy is located in a hexagon of “green” zones (
Figure 1).
2.1. The Relationship between Green Economy and Sustainable Development
The Secretary-General of the United Nations António Guterres (
UN 2023) argues that the green economy is the future, based on knowledge and social and technological innovation (
GEC 2023). According to the United Nations’ Environment Programme, the goal of the green economy is to ensure that natural resources are used for sustainable development while reducing carbon emissions and pollution, increasing energy and resource efficiency, and promoting economic growth and development (
UNEP 2011) as well as facilitate the improvement of social development (
ICC 2012). The improvement of low-carbon transport is a requirement of the green economy to deal with electricity intake and reduce global warming (
Zhu and Gao 2019). For this new economy, the issue of energy efficiency and the principle of low carbon emissions are of primary significance (
Bobylev et al. 2015). The green economy can contribute to the systematic improvement of the competitiveness of entities and lifestyles, supporting a nation’s social and economic development, and to the alignment of territorial and regional asymmetries (
Vertakova and Plotnikov 2016). Other authors (
Chapple et al. 2011;
Sulich 2020) have defined the green economy as an activity that reduces energy consumption and/or improves environmental quality through the use of less polluting means of transport. This is because the transport sector has both a negative environmental effect (ranking third in the world for carbon dioxide emissions) and a large potential for “green” growth models (
Hryhorak and Trushkin 2020).
In the UNEP report (
UNEP 2011), agriculture, cities, forests, waste management, industry, tourism, buildings, water, renewable energy, and transportation are the sectors that, together, constitute the green economy. The concept of green economy incorporates ideas related to sustainable development issues. Sustainable development goes hand in hand with an increased responsibility of companies, governments, and society as a whole to achieve a balance between current and future material and transport needs (
Zhironkin and Cehlár 2022). Human survival and development require the transition to a green economy (
Lavrinenko et al. 2019). The green economy is a system of economic activities that leads to the improvement of human life (
Ali et al. 2021;
Ciocoiu 2011) without seriously endangering the natural environment for future generations, i.e., humanity’s responsibility towards future generations (
Bina 2013).
On the other hand, the green economy is viewed as a paradigm for addressing environmental sustainability concerns, climate change, and economic growth (
Ciocoiu 2011). Regional economic growth is the subject of our research, that is, growth which is influenced by the impact of sustainable transport funding. Research shows (
Bobylev et al. 2015;
OJEU 2023) that the transition to a green economy will be achieved differently in different countries, in accordance with the degree of development, the socio-economic priorities, and the environmental culture varying depending on the unique characteristics of each nation’s natural, human, and physical capital. Thus, through our research, we will analyze the sustainable transport component as part of the green economy in the developing regions of Romania. In order to achieve the transition to a green economy, it is necessary to raise general awareness so that the population understands the need for a green economy (
Trică and Papuc 2013). However, the type of green economy will vary considerably from one nation to another, since it will depend on the specifics of each country, its natural and human capital, and its level of development (
Ardeleanu et al. 2012).
Decision makers at the state level play a key role in achieving a green economy, as its implementation largely depends on them (
Apostolache 2014). The transition to a new green economic model, based on sustainable development, is recognized to be one of the most important and best responses to global crises, particularly in terms of managing social and environmental problems (
Apostolache 2014). Integrating green economy growth into regional development strategies requires more attention to cross-sectoral cooperation, especially between environmental ministries and regional/local authorities (
Olsen et al. 2012). In the context of numerous crises and accelerating resource scarcity, the economic paradigm of “greening the economy” has assumed critical importance in regional and global processes of sustainable development (
UNECE 2023).
2.2. Brief Reflections on Sustainable Transport as One of the Components of the Green Economy
Following the financial year 2007–2013, the 2014–2020 period saw strategic programming of EU cohesion exercised in a new light, in line with the provisions of the Europe 2020 Strategy. These provisions included the following: each member state was to draft a national strategic document stating the country’s thematic development objectives and allocation of European funds through a Sustainable Development and Investment Partnership negotiated with the European Commission; the European Commission was to lay out a Common Strategic Framework; and Subsequent Programs needed to be set up, guaranteeing the member states’ steadfast commitment to accomplishing the goals set by the Union regarding the programming of community funds (
Russu 2019). According to the Investment Plan for Europe 2021, 500 million EUR were to be invested through the European Fund for Strategic Investments in the transport sector but also in other important sectors such as education, water, etc. (
European Commission 2016).
Regional development is a complex process involving several interdependent legislative and institutional components that establish new types of relationships between different sectors and areas of activity and between authorities and communities. In Romania, regional development has emerged as a necessity, on the one hand, to correct existing regional disparities and, on the other hand, to adopt and implement European Union legislation in this field. Regional economic development leads to an increase in regional quality of life and well-being, and quality of life is reflected in the regional GDP. In a study on the development of transport infrastructure in the center region of Romania and the need for improving regional connectivity published in 2022 (
Romanian Government 2022), it is mentioned that, at the level of economic indicators, the GDP is strongly and significantly correlated with its components related to industry (rho = 0.76,
p < 0.05), trade, transport, and storage (rho = 0.98,
p < 0.05). This shows that industry, trade, and transport are the sectors that drive the evolution of the GDP, and, among the main components of the GDP, a high and statistically significant correlation exists between industrial branches and trade, transport, and storage.
The Sustainable Transport Strategy of 2007–2013 and 2020–2030 includes sustainable transport policies focused on increasing the cost-effectiveness and attractiveness of transport modes with high potential in terms of transport capacity and environmental protection (
Militaru et al. 2021). Sustainable transport refers to transport modalities that are sustainable in terms of their effects on the environment and society. In the European Union, the main cause of greenhouse gas emissions is transport. This problem is global, but it can be solved locally. As we know, transportation enables people to access work, education, healthcare services, shops, and other services. Means of transport represent an important and very diverse category of indispensable tools of civilization, and, at the same time, they are generators of pollution of natural factors (
Militaru et al. 2021). According to
Karl Burkart (
2012), sustainable transport is one of the six main sectors of the green economy, with the others being renewable energy, green buildings, water management, waste management, and land management (
Burkart 2012). Our research aims to highlight the impact of the green economy and sustainable transport developed with the help of EU-funded projects and then analyze their role in the development of Romania’s economy in recent years but especially during current crises such as wars in the region or COVID-19.
Alonso et al. (
2015) found that, in urban areas where pollutants and, therefore, the effects of unsustainable transport structures are concentrated, sustainable mobility is a prerequisite for achieving sustainable cities. The transportation system in developing countries suffers from many problems such as traffic congestion and lack of reliable and safe public transport (
Abdel Wahed Ahmed and Abd El Monem 2020), which can lead to social inequalities or cause irreversible damage to the environment. Urban transportation has many detrimental effects that can influence sustainability goals (
Alonso et al. 2015). Lately, the emphasis has been on replacing traditional means of transport (in many cases physically and morally outdated) with ecological ones: bicycles, electric bikes, electric motorcycles, multiple-occupant vehicles, electric vehicles, green train services, and freight vehicles, hybrid cars, and monorails (
Abdel Wahed Ahmed and Abd El Monem 2020).
This transition to “green” transport requires a master plan on the level of public transport and beyond. The general objective of said master plan is to guide the planning, development, and maintenance of a prospective multimodal system of transportation that will contribute to the sustainable development of a city and region of the country in question. Developing a sustainable and environmentally friendly transportation system is the best solution for meeting the transportation needs of an ever-growing urban population (
CEF 2023). Green transportation has wide-ranging benefits, such as less or no environmental pollution, saving money, contributing to building a sustainable economy, and improving health (
Abdel Wahed Ahmed and Abd El Monem 2020). A sustainable urban transport system requires the consolidation of said system’s characteristics and its integrated management. According to
Abdel Wahed Ahmed and Abd El Monem (
2020), this integrated manner of management includes features such as mobility, accessibility, safety, social equity, efficiency, security, convenience, comfort, low carbon emissions, and environmental friendliness. Most studies on sustainable transport focus on the environmental impacts of motorized transport (
Török 2015) so sustainable development could be seen as only referring to these environmental impacts (
Tóth-Szabó and Várhelyi 2012;
Klimecka-Tatar et al. 2021). We cannot consider urban transport as an isolated aspect, as it should be put into perspective and studied together with other aspects of urban life. When we discuss urban transport, other aspects of urban life must be taken into account, and we should not isolate the matter. To address the significant contribution of transport (commercial transport) to greenhouse gas emissions, it is recommended that governments develop a green sustainable transport strategy (GTS). The main goal of green transportation is to minimize the negative impact of transportation on the environment while taking into account current and future transportation needs (
Wang et al. 2021). As a quality contribution to economic growth, the key is to improve the overall productivity of green factors. Previous research has focused on empirical analyses of growth rates and determinants of total factor productivity while paying less attention to the influence of green factors (
Wiederkehr et al. 2004). According to studies, an environmentally sustainable transport system is one in which transport does not threaten public health or ecosystems and meets access needs consistent with (a) the use of renewable resources below their rate of regeneration and (b) the use of non-renewable resources below the rate of regeneration of their renewable substitutes (
MEIP 2023a).
2.3. General Reflections on Investments in ESI Funds
On the 1 January 2007, Romania became a member of the European Union. Although being a member state entails both rights and obligations, Romania has received 54 billion EUR since its accession (
Ang and Marchal 2013). For the period 2021–2027, Romania will have 52 billion EUR at its disposal in this multiannual financial year, 17.4 billion EUR of which are allocated through the program created by the EU-NextGenerationEU for the health crisis. Governments have a key role in influencing private sector investments by improving the conditions for investment in sustainable transport infrastructure and setting investment policies (
Constantinescu et al. 2017). On the other hand, in terms of the importance of governance for accessing and implementing ESIF-funded projects, research shows that, in well-governed regions, there is a strong interest in fighting corruption and improving policies to attract greater funding, longer and more interregional projects, and smaller national co-financing (
Charron 2016;
Zsolt Darvas et al. 2021). Regions with good governance represent interest and security in the absorption of funds. On average, these regions receive more funds per capita, regardless of the level of economic development, unemployment, or other political factors. Current environmental and social challenges require new ways of managing economic development that take into account natural factors and improve the quality of people’s living conditions. For this reason, the concept of a new economy has emerged (
MEIP 2023b), alongside sustainable development, defined as development for future generations.
The focus of this research will be the financial and political instruments that can be used on a national or regional level to increase investments in carbon-intensive road transport infrastructure. Romania relies on the EU Cohesion Funds and Regional Development Funds for most of the funding needed for new transport infrastructure and the Task Force highlights this. The Romanian Government can also rely on the C4 component of sustainable transport from the NRRP (National Recovery and Resilience Plan) for the modernization of road infrastructure and sustainable transport. The program has a financial allocation of over 7000 million EUR (
MT 2015). The objectives of transport in Romania must, therefore, be in line with current EU policies. In 2011 the
White Paper on Transport was published, outlining clear objectives, such as an efficient and integrated mobility system, innovation for the future, including technology and behavior, and modern infrastructure and smart financing (
European Commission 2021c). Romania can also rely on the NEB (New European Bauhaus), as this trans-disciplinary approach is necessary for the challenges of our time. Financing opportunities for NEB objectives are realized through the European Regional Development Fund (ERDF) and the Program for the Environment and Climate Action (Life) (
EY Romania 2021). The mission of the NEB is to translate the European Green Pact into a tangible change in the quality of life, create a new lifestyle that combines sustainability with aesthetics, use less carbon, and be inclusive and affordable for all, respecting European and global diversity (
Boc 2017).
Urban planning is no longer just the result of the interaction between architecture, engineering, public health, and sociology but also includes computer science and urban technologies, the use of renewable energies, and increased energy efficiency (
Gacichevici 2021). At the regional level, the development of urban mobility and the provision of financial support can also be achieved through the Operational Program for Technical Assistance 2014–2020 (OPTA), complementing other programs receiving European funding such as ROP 2014–2020 and Priority Axis 4, including things such as bicycle track networks or the modernization of pedestrian routes in order to reduce CO2 emissions, a project complementing the “integrated urban mobility corridor” financed by the ROP (Regional Operational Program).
Taking into account all these theoretical observations, the aim of this research paper is to estimate the effects of ESIF investments targeting the thematic Objective 7 of the Cohesion Policy, “promoting sustainable transport systems and removing bottlenecks in major network infrastructure”, on regional economic development in Romania for the programming period 2014–2020. Therefore, the following hypotheses were put forward:
H1. ESIF investments positively influence, even if slightly, regional economic development in Romania.
H2. The regional governmental quality index positively influences regional economic development.
H3. There is a convergence effect between regions based on the initial value of the real GDP per capita.
H4. The governmental quality index exhibits a moderating effect on the relationship between ESIF investments and economic development. Therefore, the impact of ESIF investments on economic development is amplified by good governance quality.
3. Methodology
The main objective of this research is to quantify the impact of investments with structural instruments (POIM and ROP) aimed at promoting a sustainable transport system and eliminating bottlenecks in key network infrastructures on regional economic development in Romania’s eight development regions. We did not apply any specific selection criteria for the selection of development regions in Romania, as the country is already divided geographically and administratively into eight development regions. This pre-defined regional framework covers the entire territory of Romania, ensuring that our analysis is representative of the country’s extensive geographical, economic, and social diversity. By using all eight regions available within this established framework, our study inherently covers a wide range of urban and rural environments, economic structures, and demographic profiles, providing a holistic view of the impact of sustainable transport investment across Romania.
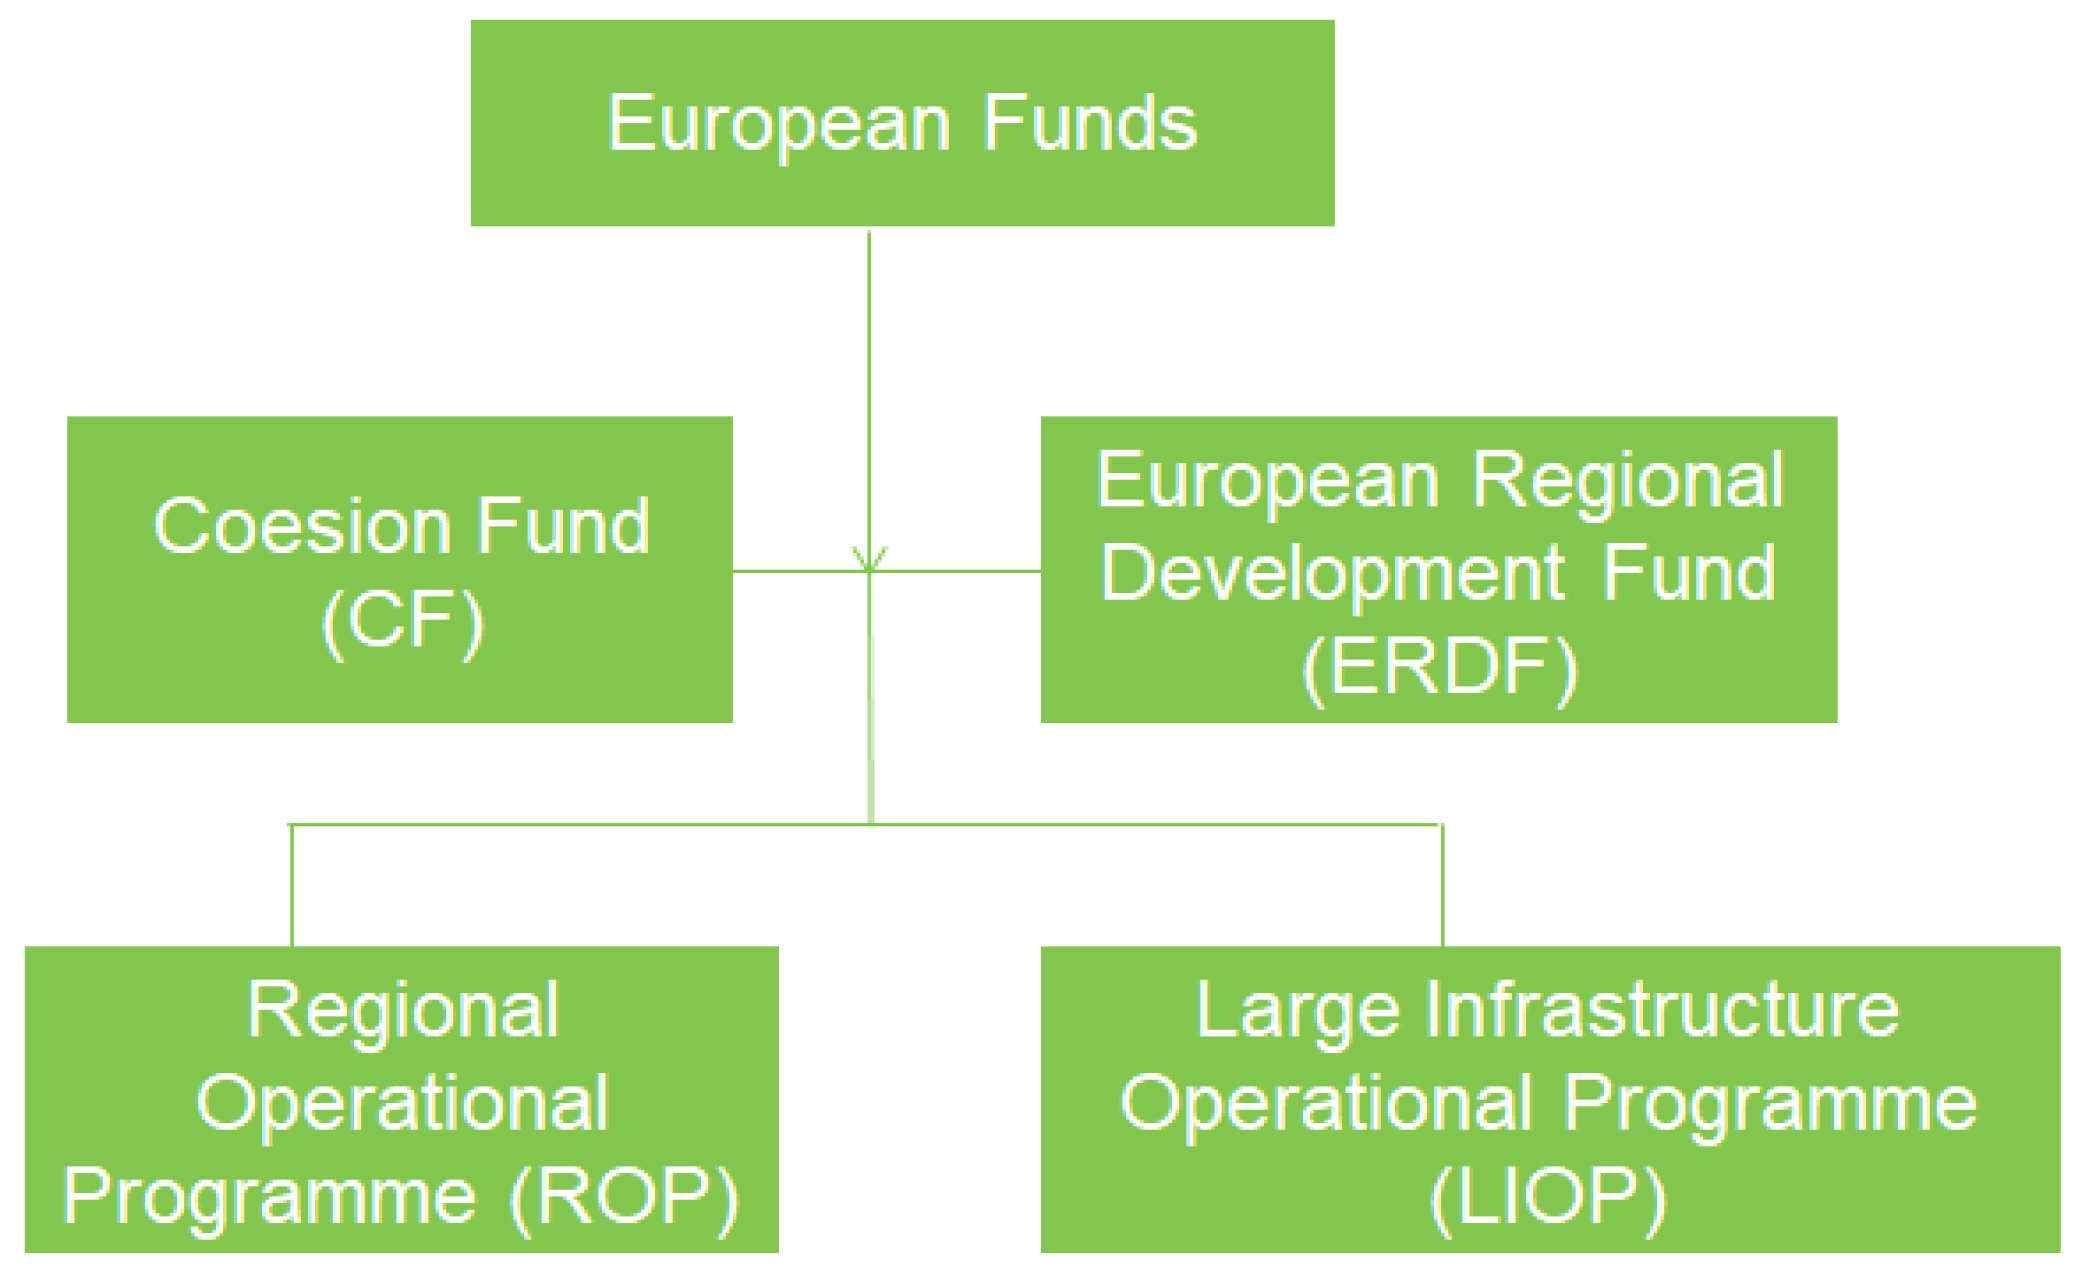
Our analysis will use a regression for panel data at the level of the eight development regions of the Romanian economy for the period 2014–2020, considering the implementation of the projects on the horizon “n + 3” years (having as the last available year the year 2022). The analysis focuses on capturing the effects of the implementation of the thematic objective OT7—“Promoting sustainable transport systems and removing bottlenecks in major network infrastructures”—financed by the ROP and the LIOP through two European funds, namely the Cohesion Fund (CF) and the European Regional Development Fund (ERDF). The Cohesion Policy includes 11 thematic objectives for economic development and growth for the period 2014–2020 (
European Commission 2020). The European Regional Development Fund (ERDF) invests in the social and economic development of all regions and cities in the EU. The Cohesion Fund (CF) invests in the environment and transport in less prosperous EU countries. These aspects are highlighted in
Figure 2.
In order to fulfill the objective of this research, statistical data were extracted from the “Open Data—List of operations/List of beneficiaries and operations for projects contracted on Operational Programmes”, published by the Romanian Government (
Romanian Government 2022).
From this database, the financial data of all projects contracted to fulfil the thematic objective OT7—“Promotion of sustainable transport systems and removal of bottlenecks in major network infrastructures”—were extracted, filtering the entire database by this objective and resulting in the main programs which financed OT7, that is, the LIOP and the ROP.
Thus, out of the 15,553 projects in the database, covering all 14 thematic objectives, the sample was narrowed down to a total of 380 projects that subscribed to the OT7 objective. Subsequently, only projects funded in the period 2014–2020 with the possibility of an extension “n + 3” years were selected, resulting in 364 projects funded to meet OT7. Data were aggregated at the regional level by location and by years after the project start date. The reporting currency was RON. A breakdown of the data collection procedure is detailed in
Appendix A.
In our econometric demarche, we excluded 13 projects contracted in 2022, using in the analysis a sample of 351 projects covering the period 2014–2021.
The choice of panel data regression models Dif-GMM and Sys-GMM as analytical tools was based on a comprehensive and methodologically rigorous approach to understanding the impact of sustainable transport investments on economic development in Romania. The initial phase involved testing different specifications using ordinary least squares (OLS) methods for both cross-sections (regions) and periods, incorporating fixed effects to account for unobserved heterogeneity across regions and time. This preliminary analysis served as a fundamental step towards understanding the underlying dynamics of the data and any fixed or random effects present.
The application of the Hausman test helped us determine the suitability of fixed and random effects models based on the consistency of the estimators. The unanimous indication of the consistency of random effects models (REM) guided the choice of model specification for the initial analysis. This step ensured that the model chosen best represented the characteristics of the data and balanced the unobserved heterogeneity with the efficiency of the estimators. The robustness check phase, which included estimation with the Dif-GMM and Sys-GMM methods, addressed specific econometric challenges not fully covered by the SEM method, in particular, dynamic relationships and endogeneity. GMM methods are particularly suitable for panel data where past outcomes may influence current outcomes and where endogenous relationships may exist between predictors and the outcome variable. Therefore, we switched to GMM for this phase.
The inclusion of the Sargan test in the GMM analysis phase was essential for assessing the validity of the instrumental variables used in the models to ensure that the instruments were not correlated with error terms, which would otherwise affect the reliability of the estimated coefficients and the overall validity of the model.
The dependent variable is the real GDP per capita transformed by the GDP deflator with a base of 2015 = 100.
The following were used as the explanatory variables:
Real ESIF investments per capita (RON)—ESIF investments were transformed into comparable prices using the GDP deflator with a fixed base of 2015 = 100.
The initial value of the real GDP per capita, which, at the beginning of the programming period of 2014, was expressed in comparable prices by deflation using the GDP deflator with a fixed base of 2015 = 100.
The quality of governance index at the regional level obtained through a survey conducted over three years (2013, 2017, and 2021) (
European Commission 2021d).
As a spillover effect variable, the GDP in neighboring regions (weighted average) was considered. This additional variable is constructed to reflect the spatial spillover effects of economic development.
The inclusion of the initial value of the real GDP per capita was determined by capturing the convergence effect. Capital flows towards the least developed region will cause the respective region to develop as well as the other regions, and their GDP per capita will be higher. These spatial feedback loops should, therefore, be integrated into the evaluation of PC (ESIF investments) effects on regional economic development to capture both direct and indirect (feedback) investment effects.
The European Quality of Government Index (EQI) captures average citizens’ perceptions and experiences regarding corruption, quality, and impartiality of three essential public services—health, education, and police—in their region of residence. The index is based on the largest survey conducted to date, measuring perceptions of the quality of government in the EU. The survey gathers the opinions and direct experience, in the areas of public health, education, and law enforcement, of over 129,000 respondents in a total of 208 regions from all 27 EU member states at the NUTS1 or NUTS2 level. The survey questions are based on the concept of quality of government as a comprehensive, multi-dimensional concept consisting of high impartiality and quality of public service delivery and low corruption.
The value of real GDP was taken from the National Accounts database of Eurostat, and the EQI index was taken for three survey years—2013, 2017, and 2021—from the study by
Charron et al. (
2014,
2015,
2019,
2022).
The general form of the panel data regression model is the following:
where
represents the eight regions,
represents time (period 2014–2021), and
,
are the parameters of the model.
This is a log–log model in which the slope parameter measures the relative change in economic growth because of a relative change in the value of ESIF investments. Thus, if investments increase by 1%, then the real GDP per capita increases, on average, by %, ceteris paribus.
In the application of panel data models, it is important to decide the type of model (with fixed effects or random effects). Therefore, it must be decided whether these effects are treated as fixed (FEM) or random (REM), which requires the application of the Hausman test. Applying the Hausman test initially involves estimating a random effects model. A high value of the chi-square statistic for the Hausman test, related to a p-value (prob.) lower than the significance threshold of 0.05, leads to significant differences between the coefficients, which requires rejecting the random effects as inconsistent, and concludes that the panel estimation based on fixed effects models (FEM) is more suitable. If the value of the respective test is relatively low (accompanied by a high p-value), it dictates the approach of random effects models (REM).
In the analysis of panel data models, homoscedasticity is checked with the White test, and, if the phenomenon is not present, the common remedy is to use heteroscedasticity-corrected standard errors, a strategy which is based on improving the standard deviations of the estimators without modifying the estimations of the coefficients.
Also, based on the Breusch–Pagan Lagrange Multiplier (LM) test, the consistency of the random effects was evaluated by comparing a random effects panel regression model with a simple regression.
The analysis also included a section of a robustness check focused on handling endogeneity as well as evaluating the stability of the estimated models when different estimation methods were used. Specifically, the analysis involved estimating models using various methods, such as fixed effects (FE), the generalized method of moments difference (Dif-GMM), and the system GMM method (Sys GMM). By using multiple estimation techniques, this analysis was aimed at determining whether the impact of the ESIF funds remained constant and reliable across different methodologies.
The random effects model (REM) assumes that individual-specific effects are uncorrelated to the explanatory variables. When this assumption is violated, the REM is inconsistent, and it might be more appropriate to use a fixed effects model or a method that allows for endogeneity, such as GMM.
GMM is a more flexible estimation method that, unlike REM, can handle endogeneity problems, assuming that there are valid instruments available. This is achieved by exploiting the orthogonality conditions between the instruments and the error term to estimate the parameters.
The problem of endogeneity typically arises from omitted variables, a measurement error of the variables included in the model, and/or simultaneity between the dependent and independent variables (
Barros et al. 2020).
Dif-GMM (difference GMM) and Sys-GMM (system GMM) are two estimation techniques used in econometrics to address endogeneity and unobserved heterogeneity in the analysis of panel data models. While both methods rely on the general framework of the generalized methods of moments, they differ in terms of the instruments used and how they handle data dynamics.
Consequently, a dynamic panel model was estimated in which the lagged dependent variable played the role of the predictor variable, to capture the persistence effect, as follows:
4. Empirical Results
4.1. The Distribution of ESIF Funds for Cohesion Policy Objective 7: “Promoting Sustainable Transport Systems and Removing Bottlenecks in Major Network Infrastructures”
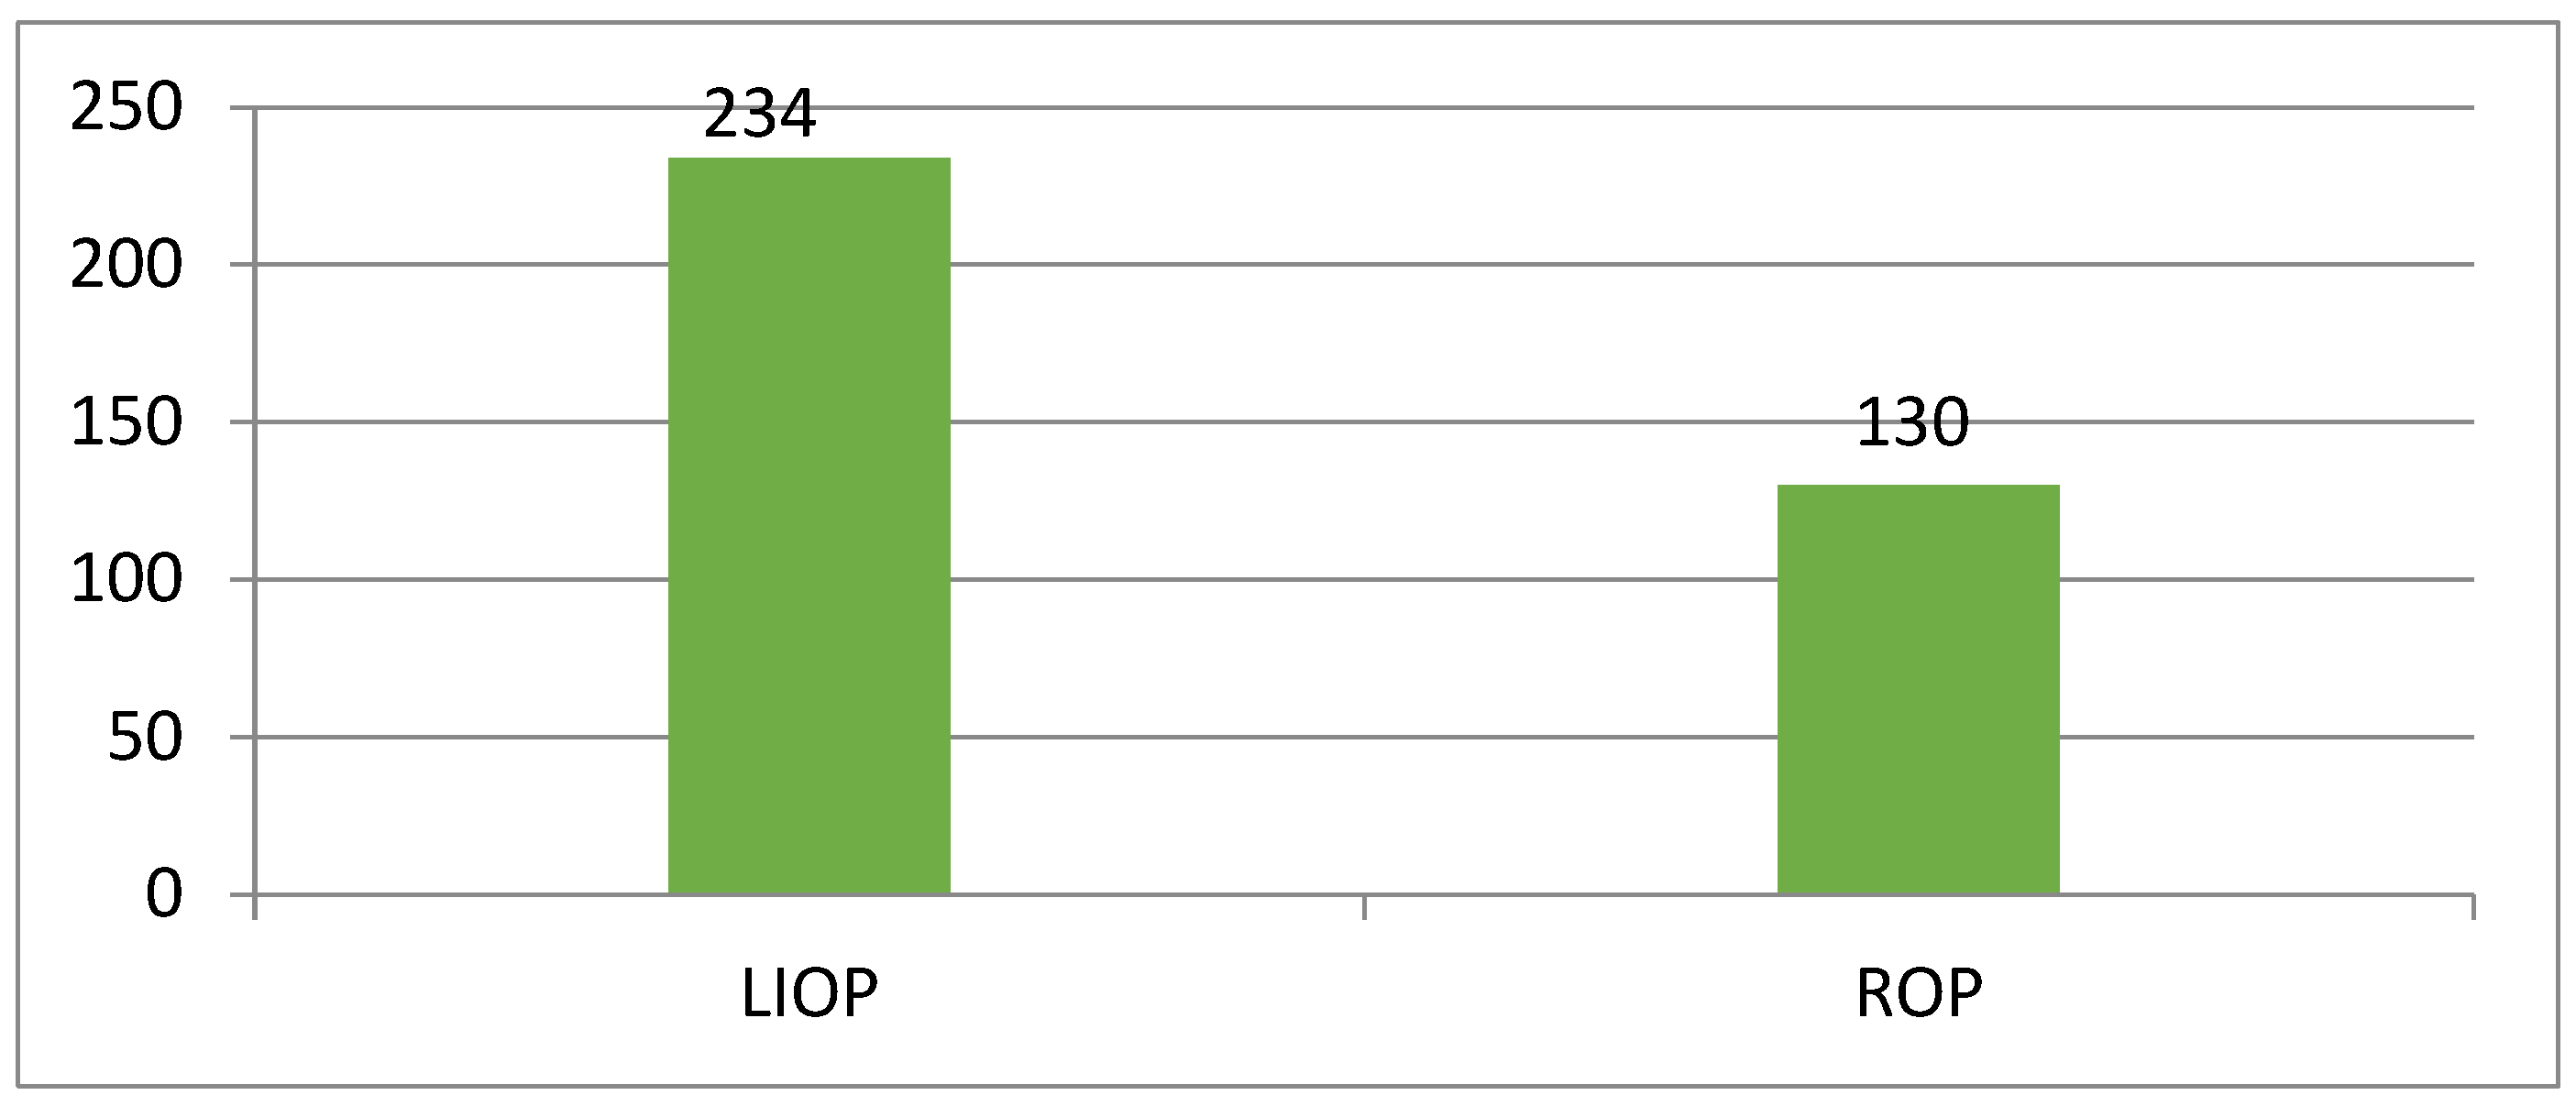
When analyzing the distribution of ESIF investments targeting the Cohesion Policy Objective 7 of “Promoting sustainable transport systems and removing bottlenecks in major network infrastructures”, it is possible to highlight 364 contracted projects, implemented at the regional level, by using two main operational programs, the POIM and the ROP. Thus, 234 projects have been implemented under the POIM and 130 projects under the ROP (
Figure 3).
Out of the 364 projects implemented, we selected the top 1 project in each region to analyze the objectives and results achieved. The criterion used to select the top one project in each region was the highest amount of eligible expenditure. By analyzing the table of the most relevant implemented projects (see
Appendix B), it can be highlighted that the projects’ objectives as well as their results have been successfully implemented and are in line with the main core desideratum of Policy Cohesion Objective 7.
Appendix B provides an example of good practice in each region.
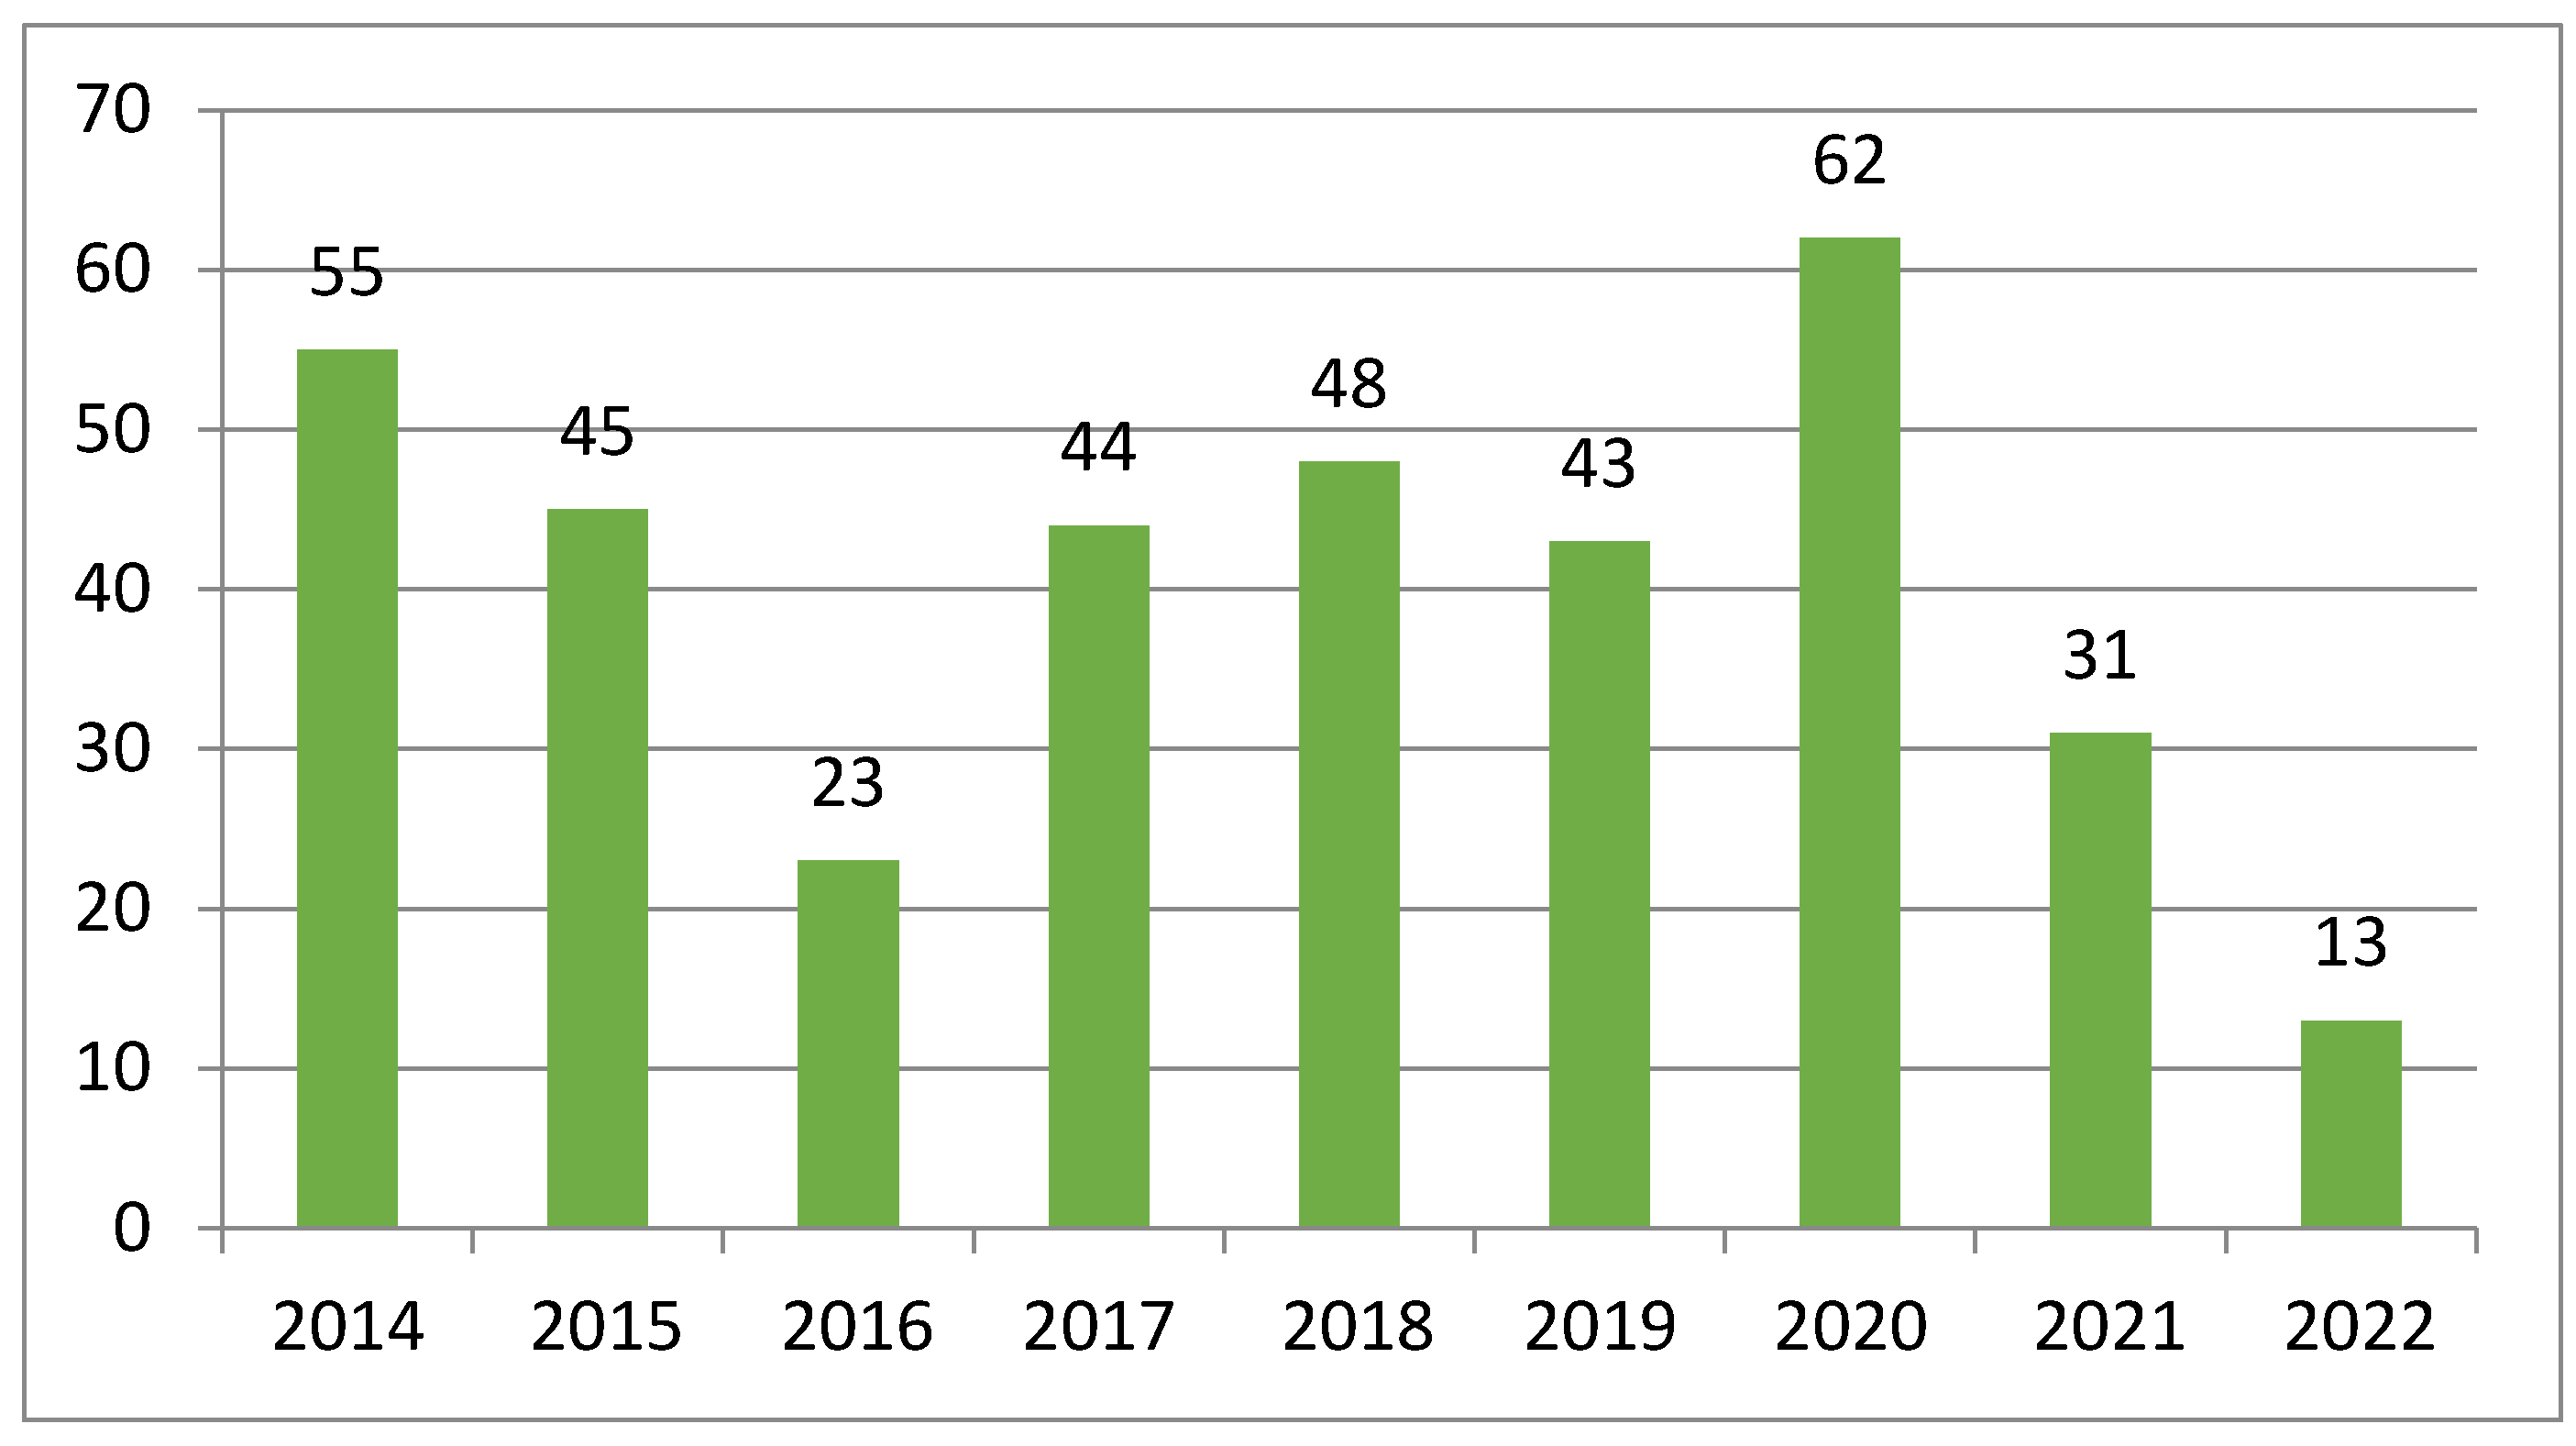
The year 2020 was the year in which most projects related to thematic Objective 7 (OT7) were implemented. Thus, as shown in
Figure 4, a total of 62 projects were implemented. The average number of projects per year was 40.4. The year 2022 was the year with the lowest number of projects, i.e., 13 projects. The low number of projects in that year was due to the fact that 2022 was the year of extension of the funding period.
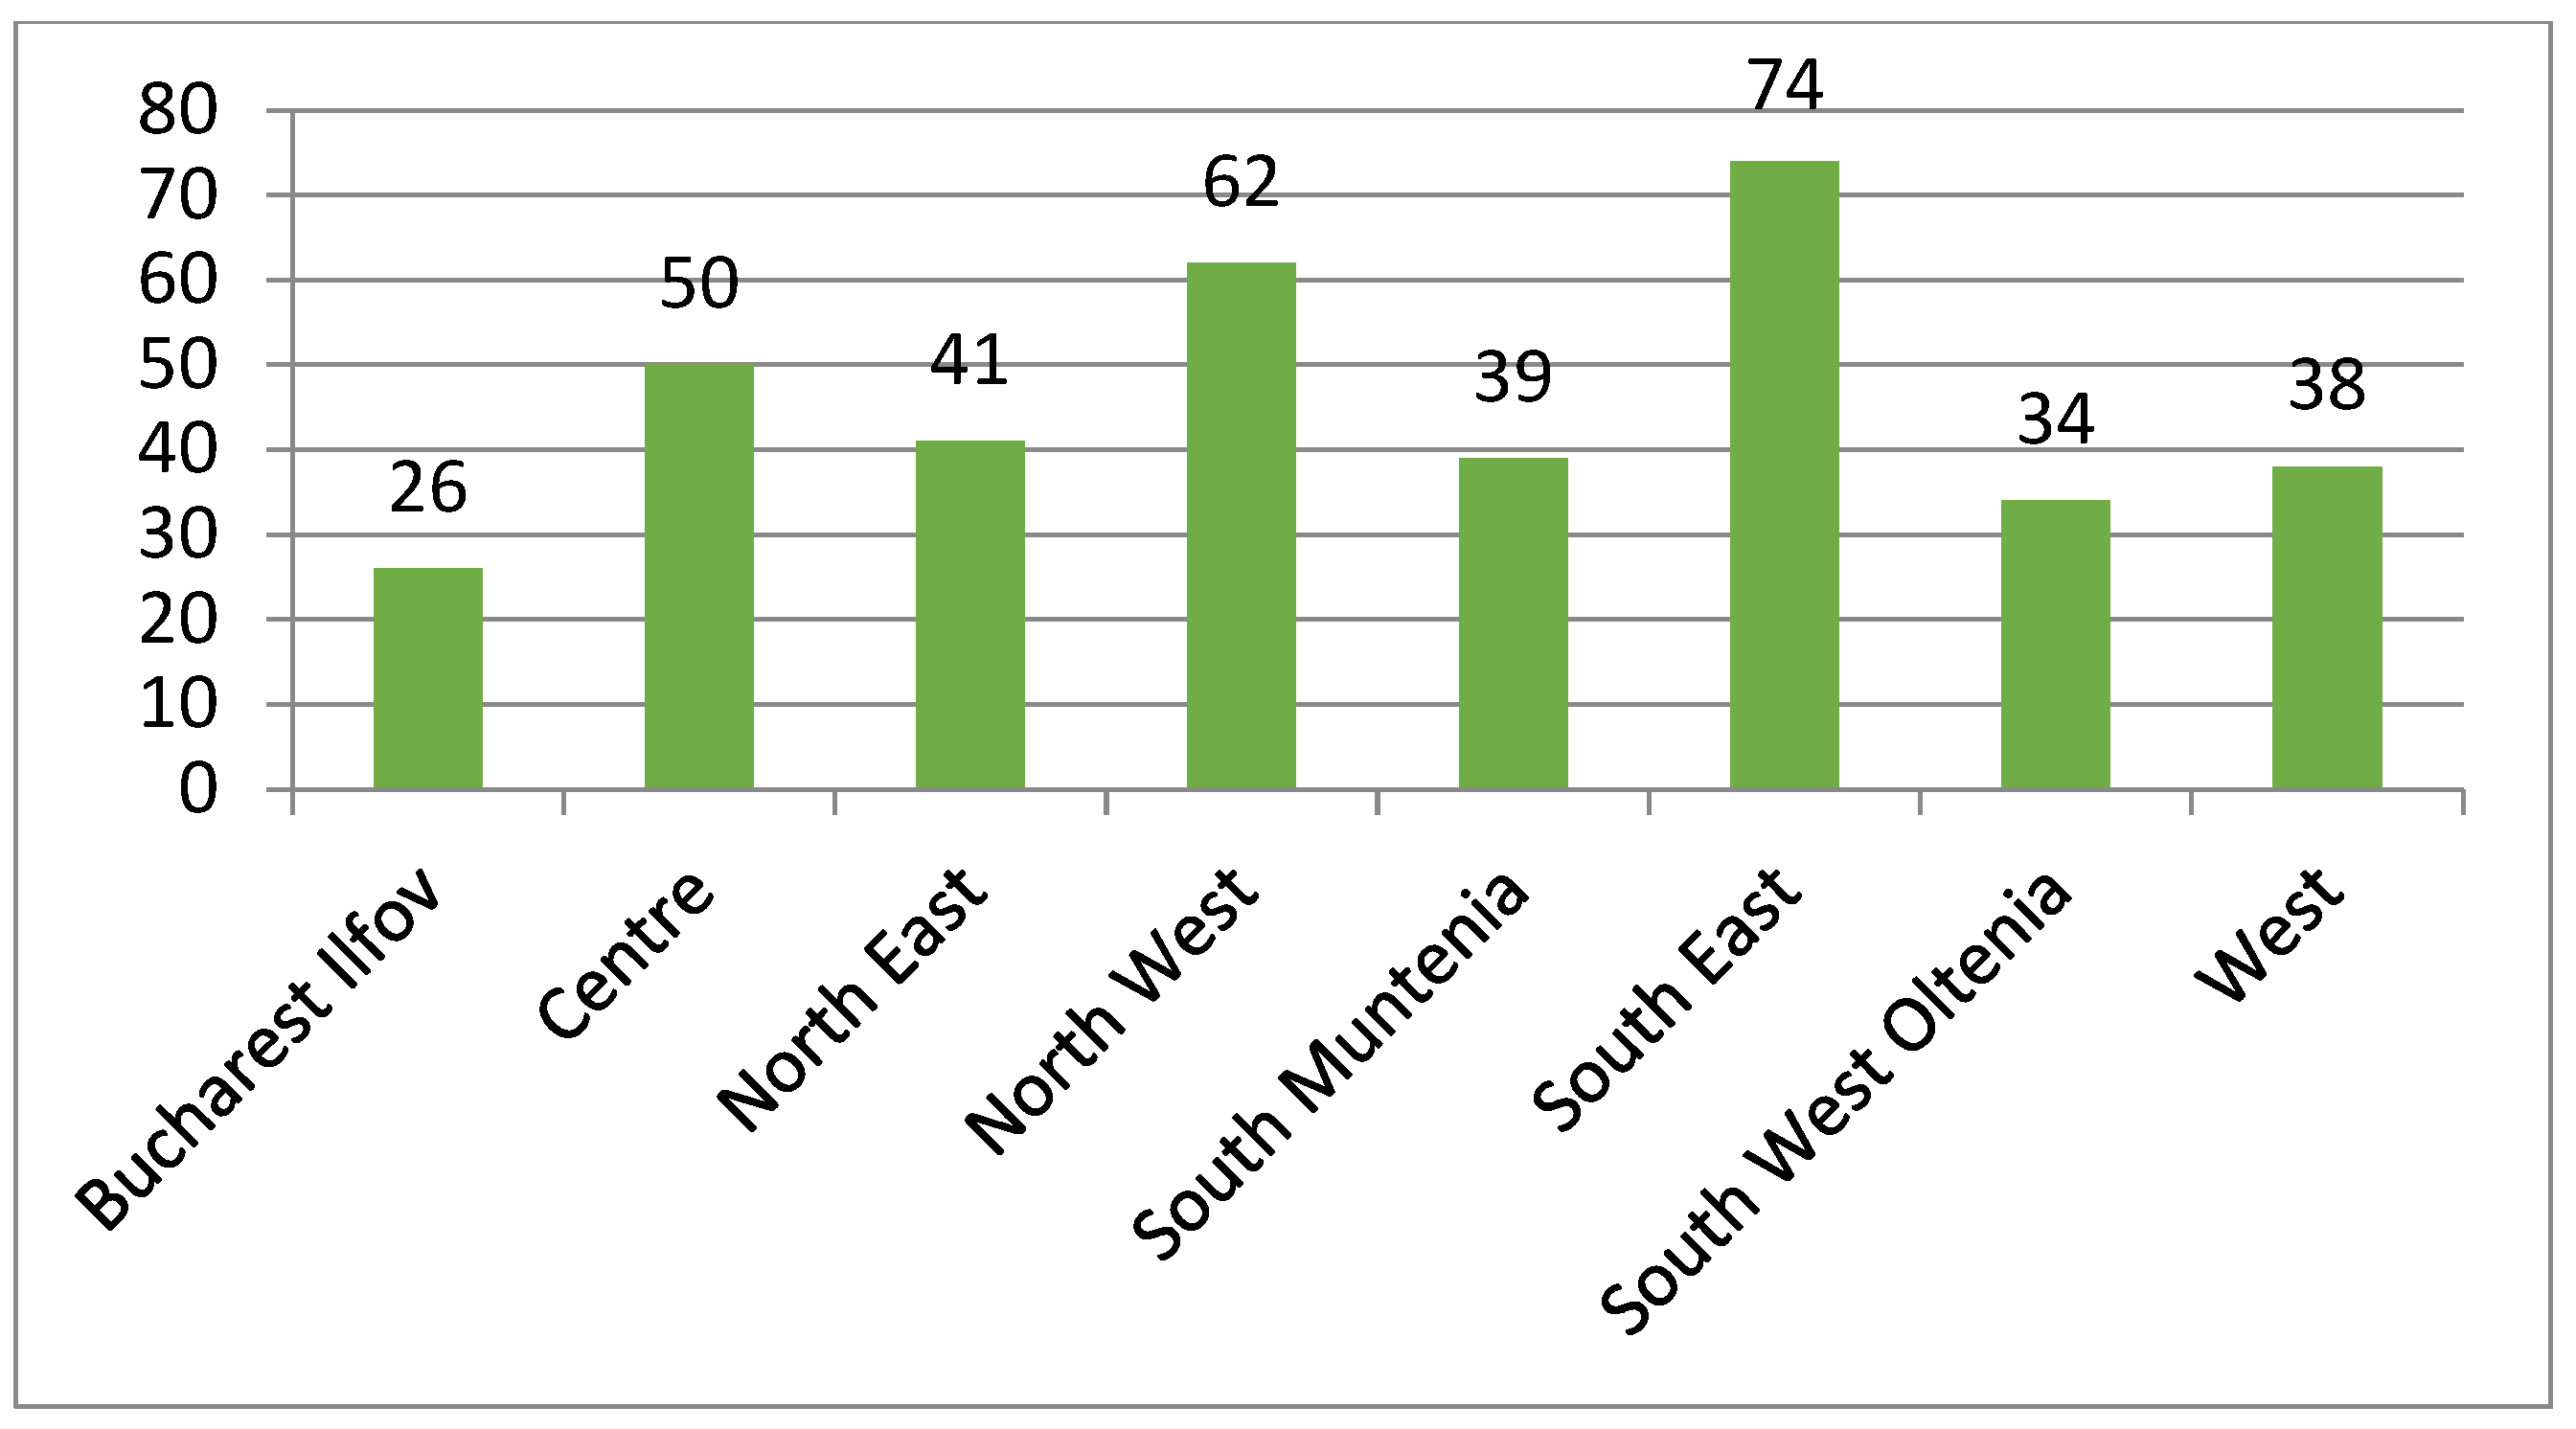
Figure 5 shows the distribution of the projects implemented across the eight development regions. Most projects were implemented in the south-east development region, with a total of 74 projects, followed by the north-west region, with 62 projects. The Bucharest Ilfov region had the fewest projects because it is the most developed one in the country, and thematic objective OT7 was also achieved through other sources of funding.
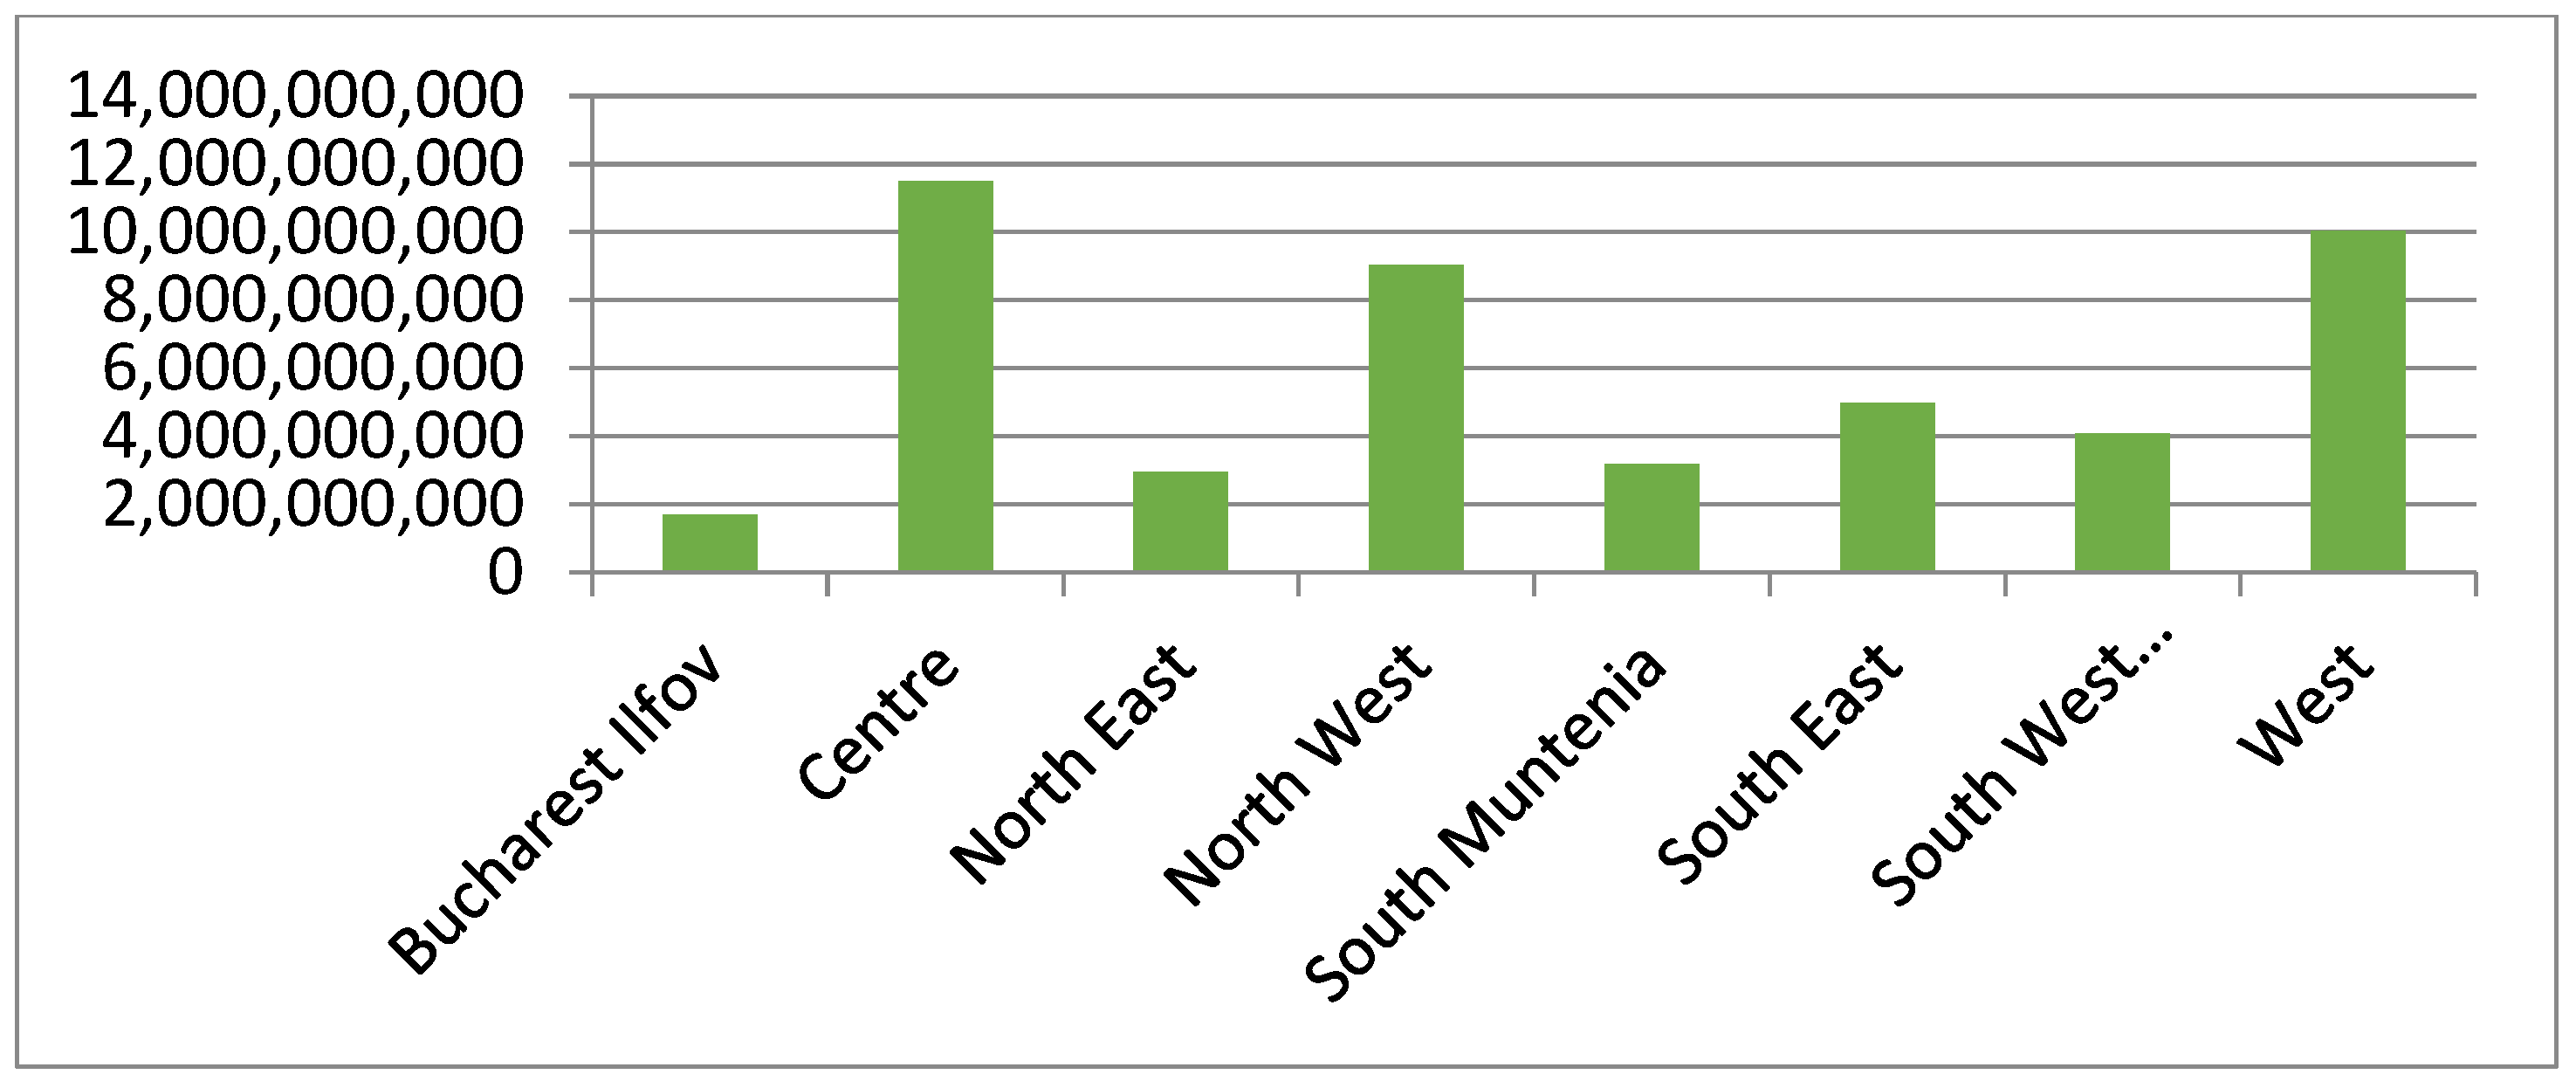
The highest amount of eligible expenditure, i.e., the value of the projects implemented (
Figure 6) was in the center region, with a value of 11,492,754,812 RON, followed by the west and north-west regions. The average eligible expenditure in the eight development regions was 5,933,391,000 RON.
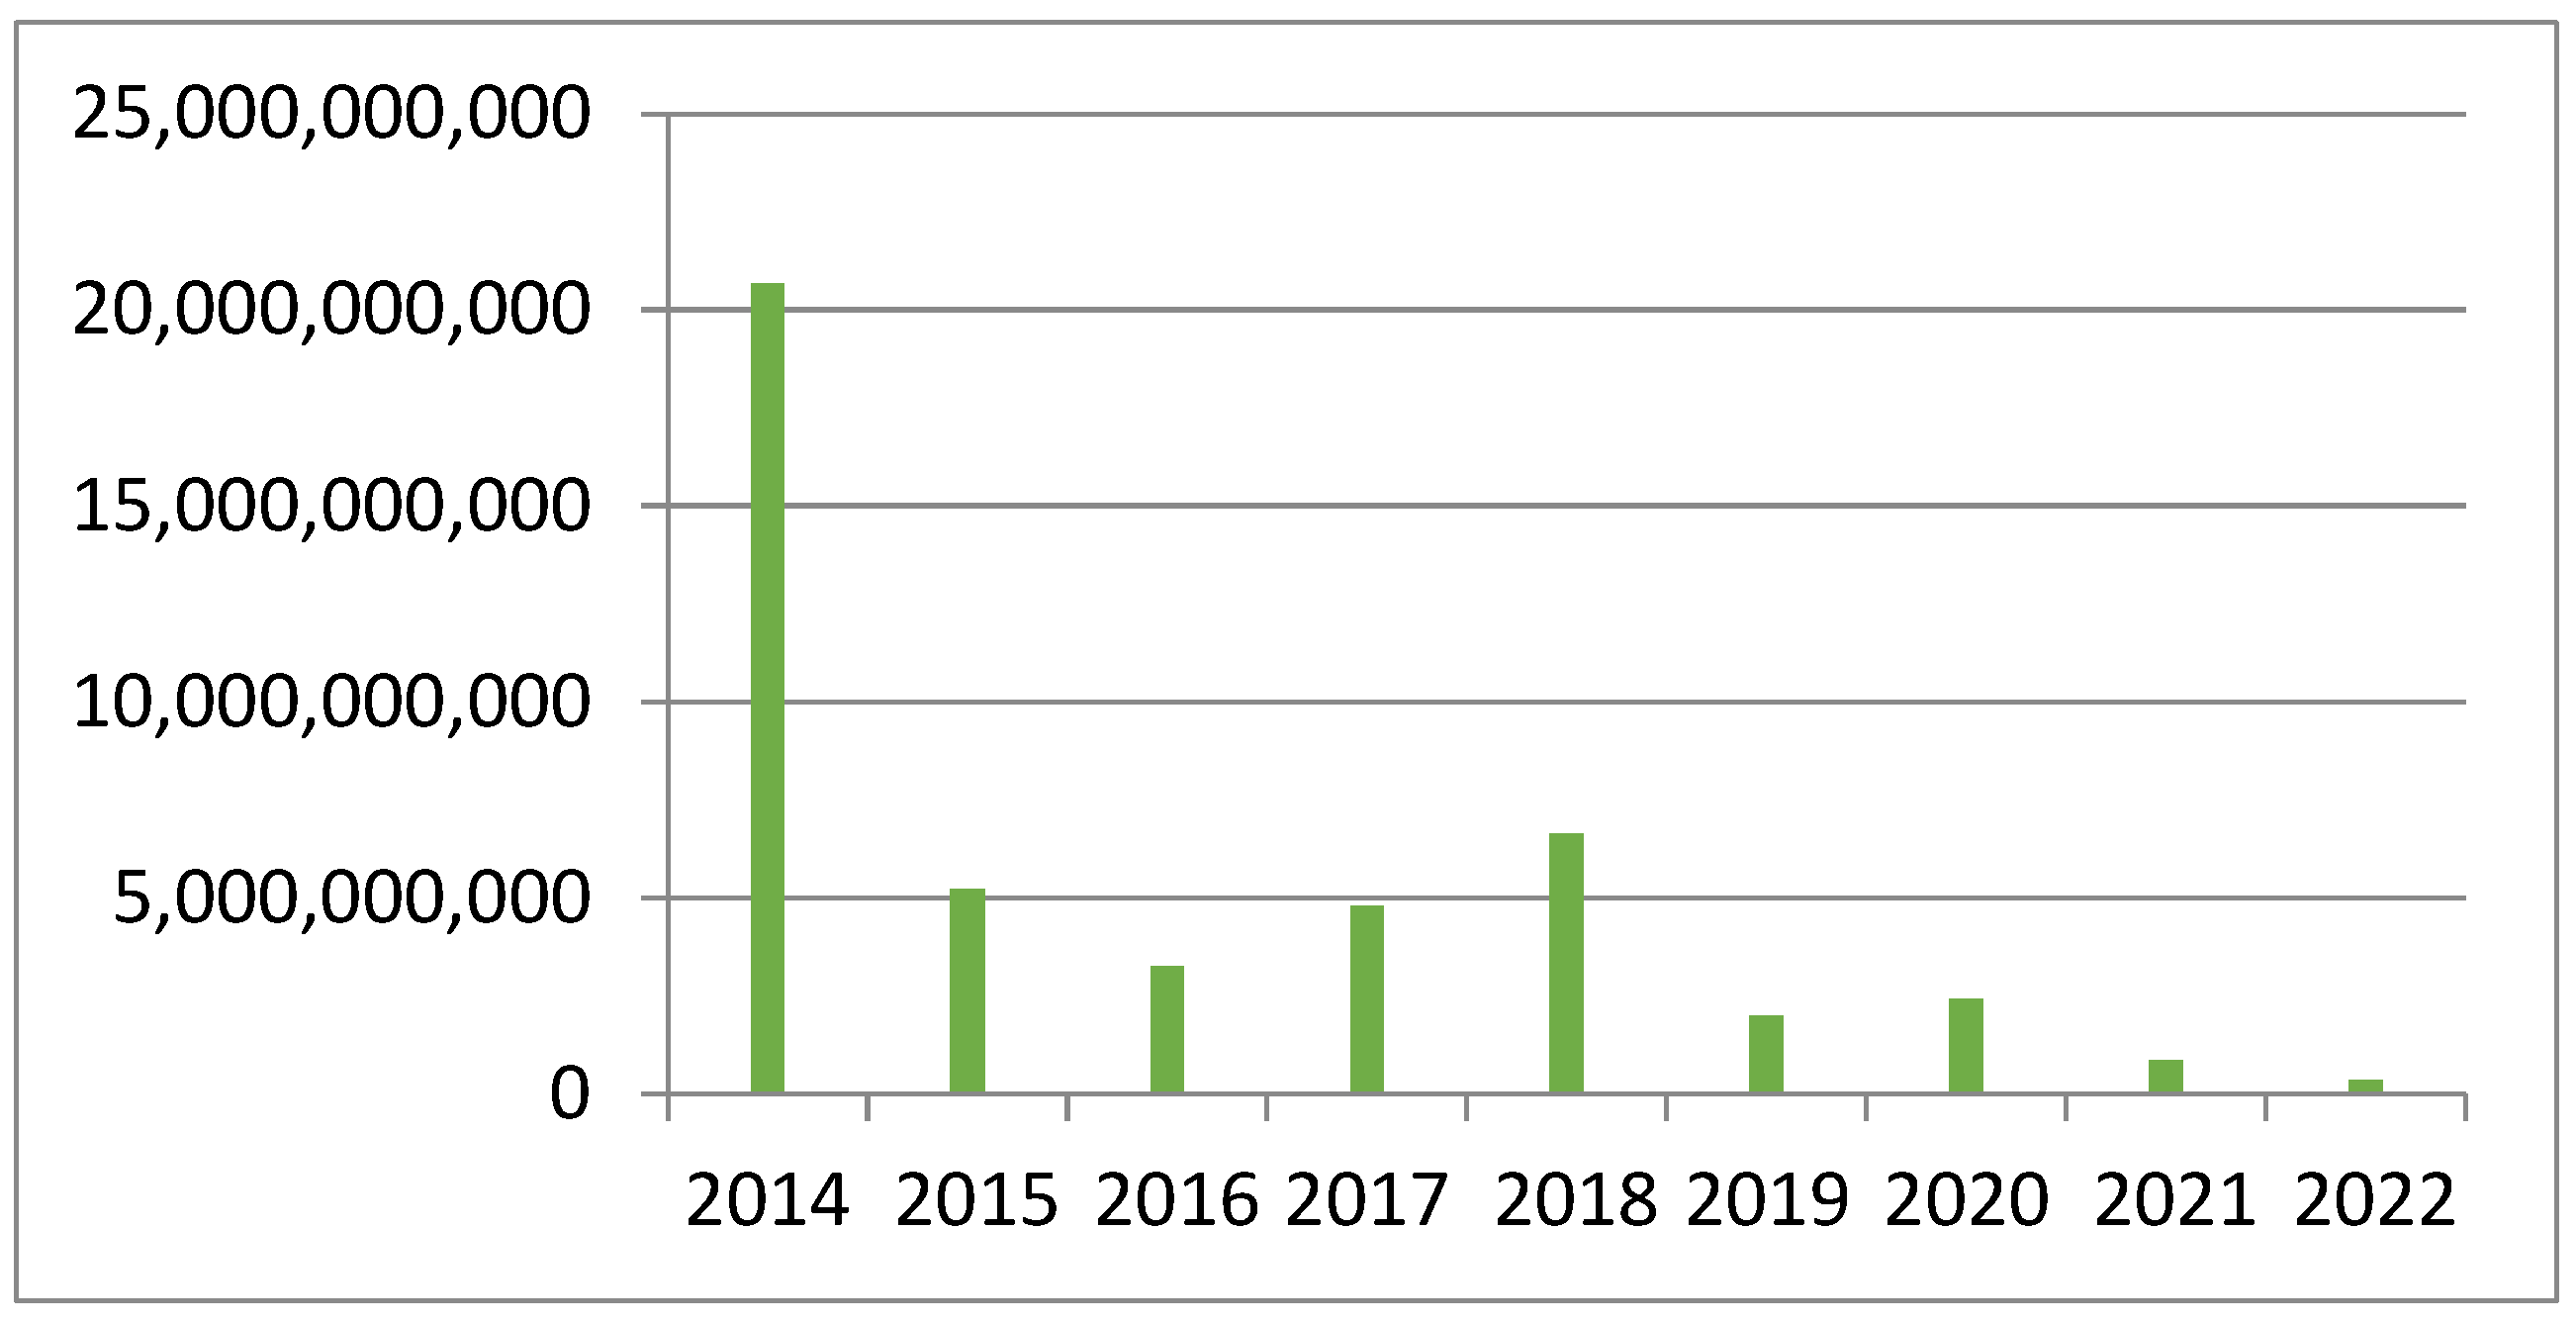
Figure 7 shows the distribution of eligible expenditure by year (2014–2022). As it can be seen, 2014 was the year in which the projects with the highest amount of eligible expenditure were implemented.
4.2. Some Evolution Patterns in Romanian Regional Economic Growth
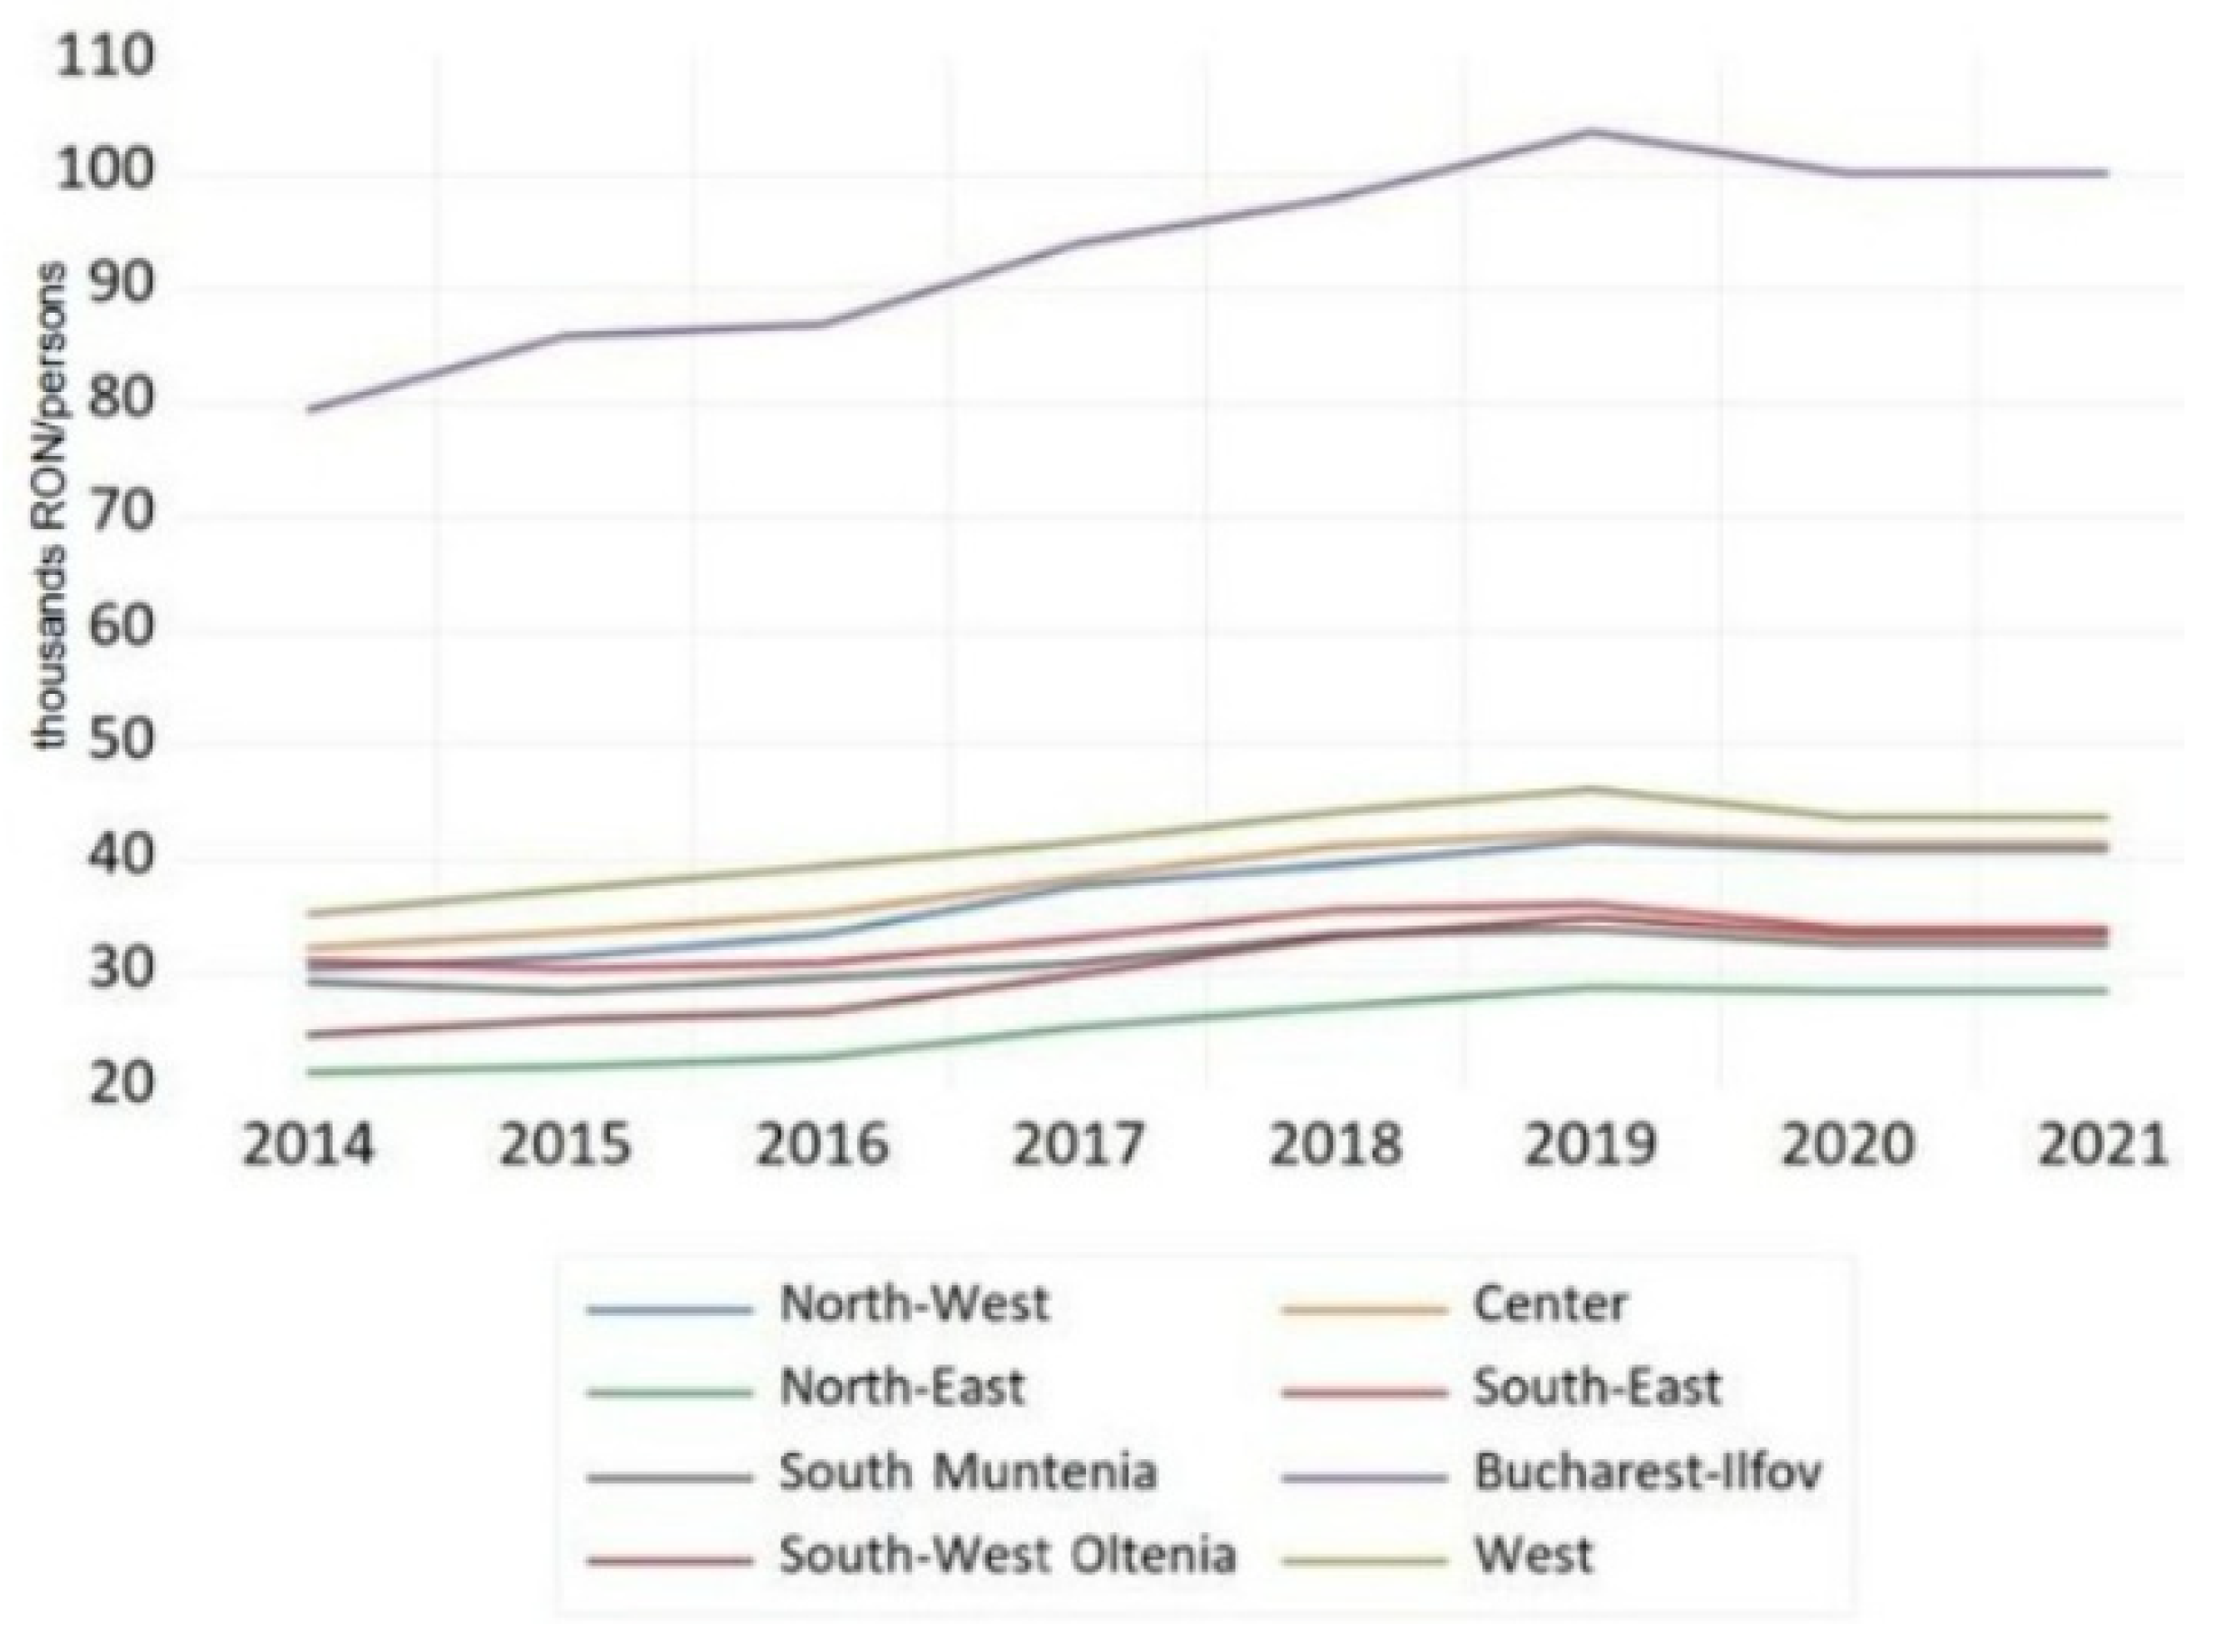
When analyzing the evolution of the real GDP per capita among the Romanian regions during the 2014–2021 period, Bucharest–Ilfov emerges as a clear outlier in terms of economic development (see
Figure 8). The region’s strong performance can be attributed to several factors, including its status as the country’s capital and largest city, its high concentration of businesses and industry, and its position as a major hub for commerce, finance, and technology.
Trailing significantly behind Bucharest–Ilfov are the west, center, and north-west regions. These regions also experienced economic growth during this period, albeit at a more modest pace. Their economies are generally more diverse, with a mix of agriculture, manufacturing, services, and emerging technology sectors contributing to their GDP. Additionally, these regions benefit from their geographical proximity to Western Europe, which can facilitate trade and investment.
However, the gap between Bucharest–Ilfov and these other regions suggests that there are substantial regional disparities in terms of economic development within Romania.
This underscores the importance of targeted policies and investments to promote more balanced regional development, particularly in areas such as infrastructure, education, and innovation, which can help stimulate economic development.
In conclusion, while Bucharest–Ilfov stands out as an outlier in terms of economic development over the 2014–2021 period, other Romanian regions like the west, center, and north-west have also made economic progress, demonstrating the potential for growth across the country.
4.3. The Effects of ESIF Investments on Regional Economic Development
In the first stage of our analysis, different specifications were tested, considering fixed effects models for both cross-sections (regions) and periods using the ordinary least squares method. The redundancy of fixed effects was tested to decide which of these models was suitable for modeling the sample (fixed effects, random effects, or both). The Hausman test was applied to determine the type of effects (fixed or random) in the estimated models, considering that a low probability in this test suggests the use of fixed effects, while, on the other hand, a high probability suggests the application of random effects. The results of the Hausman test unanimously highlighted the consistency of the estimator based on random effects (REM). In the estimated models, errors were corrected with robust standard errors. Also, the results of Breusch and Pagan’s Lagrangian multiplier test for random effects confirmed the choice of random effects.
Table 1 presents different specifications of the general model, alternatively testing the impact of different predictors for the random effects models and estimating the coefficients of these models. The analysis also comprises a robustness-checking section, in which the model was estimated using the GMM method in both of its versions (Dif-GMM and Sys-GMM). The Sargan test is crucial for the evaluation of the validity of differential GMM estimation results and for ensuring the reliability of the instrumental variables used in an analysis. If the test indicates a violation of over-identifying restrictions, this may indicate the presence of endogeneity problems or weak instruments, calling into question the reliability of the estimated coefficients. In the context of GMM differential estimation, the Sargan test examines whether the instruments used in the estimation are not correlated with the model’s error term. If the
p-value is greater than a specified significance level, this indicates that over-identifying restrictions are valid and that the instruments are exogenous within the model. The results of the Sargan test in our study showed that the instruments were valid.
The results obtained highlighted a positive and statistically significant impact on economic development, at the 1% significance level, of ESIF investments dedicated to promoting sustainable transport systems and removing bottlenecks in major network infrastructure, albeit to a small extent, confirming hypothesis H1. This demonstrates that investing in sustainable transport systems and improving infrastructure networks have positive effects on regional economic development. Despite the effect being small, it was statistically significant, suggesting that these investments are a valuable tool for promoting economic development. This variable had a significant positive effect across almost all models, suggesting that an increase in the ESIF funds per capita is associated with an increase in the GDP per capita. The effect varied across the models, with the strongest effect being registered in model 2 (REM).
The convergence effect, highlighted by the statistical significance of the initial GDP per capita, was revealed to lead to an increase in the real GDP per capita, thus validating hypothesis H3. Regions with a lower initial GDP per capita grew at a faster rate than those with a higher initial GDP per capita. This implies that a process of convergence was taking place, with poorer regions catching up with richer ones. The catch-up effect, often referred to as convergence in economic literature (
Solarin et al. 2023), is a phenomenon in which lower-income regions grow faster than higher-income regions, reducing income disparities over time. This effect is important in the context of regional economic development as it suggests that lagging regions have the potential to improve their economic status compared to more affluent areas. Moreover, reducing inequality among and within countries is one of the 17 goals in the 2030 Agenda for Sustainable Development.
This variable was significant in most models, and the effect was notably strong in models 2 to 5 and 8. Additionally, perceptions of the quality of governance also lead to economic development, with the EQI index utilized in our study exhibiting a positive and statistically significant impact on the regional GDP per capita, thus validating hypothesis H2. The quality of governance tends to encompass various factors, including the efficiency of public services, the level of corruption, the rule of law, and the respect of citizens’ rights. Good governance promotes transparency, reduces the risk of corruption, ensures the efficient use of resources, and creates a favorable environment for business and investment, leading to economic development. This variable was significant in several models, indicating a positive relationship between environmental quality and the GDP per capita. The statistical significance of the weighted average of the gross domestic product of neighboring regions suggests regional spillover effects, which can influence a region’s GDP per capita.
Furthermore, a positive impact of the previous period’s real GDP per capita on the current GDP per capita was also highlighted. This result is evidence of the persistence or autocorrelation of the real GDP per capita, meaning that regions that had a higher GDP per capita in the previous period are likely to have a higher GDP per capita in the current period. This finding indicates that regions with a high GDP per capita tend to maintain their economic momentum, suggesting a degree of stability and continuity in economic performance, which may be due to a variety of factors, such as robust industrial structures, strong institutional capacities, or high levels of human capital, which allow these regions to sustain their economic advantage over time. The results can also be interpreted in terms of path dependency.
Once a region develops a certain economic structure or achieves a certain level of wealth, it may be difficult to significantly change its economic trajectory in the short term. This could be due to institutional inertia, sunk costs, or the persistence of social and economic inequalities.
In order to evaluate the impact of ESIF investments on regional economic development and their relationship with the quality of governance, the statistical significance of the interaction term between the two was analyzed, which pointed out no potential impact, thus invalidating hypothesis H4. The positive sign of the interaction term highlights that the positive impact of ESIF investments would be even more pronounced in regions with a better quality of governance, but the impact was not statistically significant.
The interaction between the ESIF funds per capita and the initial GDP per capita and that between the ESIF funds per capita and the EQI were explored, but they showed limited significance.
A potential explanation could be that the interaction between ESIF investments and the quality of governance may have sector-specific impacts that are not captured in an aggregate measure of economic development, such as the GDP per capita, but still have significant impacts in specific sectors, like education or healthcare.
The robustness analysis based on the results of Dif-GMM and Sys-GMM maintained the same results, revealing that the main three hypotheses, that is, H1, H2, and H3, had been preserved and were fully validated.
Therefore, the investments made through the European Structural and Investment Funds (ESIFs) designed to promote sustainable transport had a positive impact on economic development, even if the effect was slight. This implies that regions receiving the respective funds experience a boost in their economic development. The funds could contribute to job creation, infrastructure improvement, or other factors that stimulate economic activity. However, the effect was found to be relatively small. The Wald test indicated the overall significance of the models, with all the models (except for model 2) showing a strong significance. R2 values provide insight into a model’s explanatory power, with the higher values seen in the R2 for model 6 (0.85) suggesting that variation within groups over time was well explained in this model. For the GMM models, the Sargan test investigates the validity of the instruments used. The probability values suggested that the instruments utilized in our study were valid.
Therefore, we can conclude the following: All the models showed that ESIF funds positively impact the regional GDP per capita, albeit to varying extents. Higher initial levels of GDP per capita generally lead to higher subsequent levels, indicating a persistence of economic status. Regional spillover effects and environmental quality also play a role in economic development. The consistency across the different models strengthened the reliability of these findings.
The quality of regional governance plays a crucial role in economic development. Regions with better governance, which implies, among other things, a more efficient public administration, a better implementation of policies, and lower levels of corruption, are likely to have a more favorable economic environment that stimulates development.
This study also confirmed a convergence effect between regions based on the initial value of the real GDP per capita. This suggests that regions with a lower initial GDP per capita grow faster than those with a higher initial GDP per capita, with all the other factors being constant. This could be the result of a catching-up process in which less developed regions grow faster to reach the level of more developed regions.
In conclusion, the data suggest that European funds intended to promote sustainable transport systems had a positive impact on Romanian regional development. This impact was moderated by the initial economic conditions and environmental quality, with evidence of regional spillover effects. These findings hold significant implications for policymakers in terms of prioritizing investment areas and understanding the multifaceted influences on regional economic development.
5. Discussion
This methodological approach reflects a rigorous and multi-layered analytical process that begins with the specification of the base model and moves to more complex and robust methods to address the complexity of the data and the research questions. The shift from the SEM to the GMM methodology is based on statistical tests such as the Hausman test and the Sargan test, which provide the most accurate and reliable information on how sustainable transportation investments affect regional economic development. This methodology recognizes the complexity of the relationships under study and takes a comprehensive approach to accurately model these relationships.
Starting with SEM, based on pre-testing, and moving to the GMM method for more detailed analysis and endogeneity concerns, this study not only increases the robustness of the results but also contributes significantly to the existing literature on this topic.
This study assesses the quality of regional governance and its role in economic development through a multifaceted approach, focusing on the perception of governance quality and its direct impact on the regional GDP per capita. Specifically, it uses the European Quality of Government Index (EQI) as a key indicator to evaluate regional governance. The EQI is comprehensive, incorporating factors such as the efficiency of public services, the level of corruption, the rule of law, and the respect for citizens’ rights, which are critical dimensions of good governance. This study uses the EQI, which aggregates perceptions and experiences of governance quality from the perspective of citizens and businesses within regions. The findings underline a positive and statistically significant relationship between the quality of governance (as measured by the EQI) and the regional GDP per capita. This relationship confirms the hypothesis that a better governance quality directly contributes to economic development. High EQI scores, indicative of good governance, are associated with higher levels of regional economic performance.
The results of this research clearly demonstrate the positive impact of ESIF investments in sustainable transport systems and eliminating bottlenecks in major network infrastructures on economic development. This demonstrates that investments in sustainable transport systems and the improvement of infrastructure networks have positive effects on regional economic development. The effect is statistically significant, suggesting that these investments are a valuable tool for promoting economic development.
From a policy perspective, this finding could justify the allocation of ESIF funds to sustainable transport and infrastructure projects. Policymakers could consider increasing funding in these areas to further boost economic development. These findings also have implications for sustainable development. The positive impact suggests that investments in sustainable transport and infrastructure could contribute to economic development without compromising environmental sustainability.
Perceptions of the quality of governance can also influence investment decisions. Regions with better governance are likely to attract more investments, further driving their economic development. Good governance is important not only for economic development but also for social development and the well-being of citizens. Regions with good governance tend to have better public services, lower levels of corruption, and higher degrees of social justice. Regions with good governance are more likely to compete effectively in the global economy, attract foreign direct investment (FDI), promote innovation, and create high-quality jobs, which, in turn, lead to sustainable economic development.
The convergence effect, highlighted by the statistical significance of the initial GDP per capita, has been revealed to lead to an increase in the real GDP per capita. Regions with a lower initial GDP per capita are growing at a faster rate than those with a higher initial GDP per capita. This means that there is a process of convergence taking place, whereby poorer regions are catching up with richer ones.
Despite the positive convergence trend, regions with a lower initial GDP per capita may still require continued policy attention and investment support to maintain the momentum of growth and address other potential challenges associated with economic development, such as environmental issues, infrastructure development, and social inequalities.
Taken together, these results highlight the importance of ESIF investments and good governance in fostering regional economic development. They also underscore the role of regional convergence in balancing economic development across regions. These findings can guide policy recommendations and future research directions, particularly in the context of regional development and EU funding.
Although the effect is small, it is important to note that these types of investments often have long-term effects that may not be immediately evident. Improved transport and infrastructure can lead to increased efficiency, productivity, and economic competitiveness over time.
6. Conclusions
This study confirms the positive role of ESIF investments in promoting sustainable transport on regional economic development. However, the impact is relatively small, suggesting that the volume of investments needs to be substantial in order to trigger significant growth. The quality of regional governance is also a crucial factor for economic development. Regions with a better governance quality demonstrate a higher rate of economic growth. This implies that, in addition to financial investments, the effective use of funds, which is often linked to the quality of governance, is crucial for economic development. This study reveals a convergence effect across regions, whereby regions with a lower initial GDP per capita grow faster than those with a higher initial GDP per capita, indicating a “catch-up” effect. The factors contributing to the catch-up effect are the following: 1. Lagging regions can achieve rapid growth by adopting and integrating technologies that have already been developed in more advanced regions. 2. Investments in education and training can improve the quality of the workforce in less-developed regions. 3. Improvements in governance and in the institutional framework can create a more favorable environment for economic activity. 4. Investments in infrastructure (transport, utilities, and communications networks) can significantly reduce transaction costs and connect lagging regions to larger markets, stimulating economic activity and growth. 5. Targeted policy interventions and financial support, such as those provided by the ESIFs, can support the development of lagging regions by funding projects in the areas of infrastructure, education, and technology.
The quality of regional governance and its role in regional economic development are reflected in regional development policies, which have a strong instrumental character, and in the European Union’s funds, which contribute to the financing of sectorial policies such as, for example, agricultural policy, social policy, environmental protection policy, and sustainable development policy. Romania’s policies are correlated with the policies of the European Union. Regional governance, in the sense intended in our study, can be measured by referring to the efficiency of access to the EU funds needed for the development of sustainable transport, taking into account the administrative diversity at the level of each region and the cooperation with regional and local authorities as well as with community administration, for example, by sharing best practices and results or by establishing partnerships between regional institutions open to voluntary association.
This study identifies the mechanisms through which the quality of governance affects economic development. The first one comprises transparency and corruption reduction: good governance increases transparency and accountability in public administration. This creates a more predictable and secure environment for business and investment. Second, effective governance ensures that public resources are allocated and used efficiently, maximizing the impact of investments, including those in sustainable transport and infrastructure, on economic growth. The third one is centered around the business and investment climate: the quality of governance shapes the overall business environment, influencing investment decisions, operational costs, and the competitiveness of regions. A favorable governance environment attracts investments, stimulating economic activity and growth. By using the European Quality of Government Index (EQI) as its central measure, this study effectively captures the quality of regional governance and demonstrates its significant role in fostering economic development. The positive correlation between governance quality and the regional GDP per capita underlines the crucial importance of efficient, transparent, and accountable governance structures in promoting sustainable economic growth.
This finding provides a strong basis for policy recommendations aimed at improving governance standards to foster regional development.
The limited impact of ESIFs on promoting sustainable transport can be attributed to a complex interplay of adequate funding, administrative efficiency, strategic orientation, and contextual factors. Addressing these challenges requires streamlined administrative processes, increased capacity building for project management, strategic planning to align investments with regional needs, and comprehensive evaluation mechanisms to assess and adjust funding strategies for greater effectiveness.
From a policy perspective, these conclusions can guide decision making and re-source allocation in the following ways:
Increase and Improve the Use of ESIFs: Given the positive impact of ESIF investments tackling sustainable transport on economic development, policymakers should consider increasing these investments. Moreover, efforts should be made to ensure that these funds are used efficiently and effectively, contributing to substantial economic development.
Improve Governance Quality: Enhancing the quality of regional governance should be a priority. Good governance practices can ensure the efficient use of investments and foster an environment that is conducive to economic development.
Target Less Developed Regions: The existence of a convergence effect suggests that focusing resources on less developed regions can be effective. As these regions have been shown to grow faster, targeted investments could promote balanced regional development and reduce economic disparities.
The main limitation of this study is the time period, as a longer period of analysis might reveal different results as well as refine the measures of key variables and explore alternative model specifications. On the other hand, the period of analysis (2014–2020) for assessing the impact of European Structural and Investment Funds (ESIFs) on sustainable transport in Romania includes economic fluctuations, policy changes, and external events, all of which can affect the allocation and effectiveness of ESIFs as well as the broader context of sustainable transport development. In the analysis of the 2014–2020 period, our study did not explicitly account for potential changes in economic conditions or policy priorities that might have influenced the outcomes of ESIF investments in sustainable transport in Romania. While these factors—ranging from economic fluctuations to shifts in EU and national policy priorities and major events such as the COVID-19 pandemic—undoubtedly affect the effectiveness and focus of infrastructure investments, our methodology was primarily designed to assess direct impacts without taking into account these dynamic external variables. The following are among the factors not explicitly accounted for in our study that could have influenced the outcomes of ESIF investments: 1. EU Policy Priorities: The EU’s emphasis on sustainable development and Cohesion Policy may have influenced the prioritization of sustainable transport projects. The launch of the European Green Deal towards the end of the study period (2019) may also reflect a shift in priorities, which could have affected project implementation and funding. 2. Socio-political Changes: Events such as elections, changes in government, or shifts in regional governance structures could affect the continuity and focus of sustainable transport projects. 3. COVID-19 Pandemic: Although primarily affecting the world in 2020, the onset of the COVID-19 pandemic could have had a significant impact on the latter part of the study period, affecting the use of public transport and project implementation timescales and potentially shifting priorities towards health and safety. The inclusion of policy event studies or more nuanced qualitative analyses could capture the interplay between policy changes, economic trends, and investment outcomes. By addressing these issues, subsequent research can provide deeper insights into optimizing ESIF use under different conditions, ultimately improving policy recommendations for sustainable transport development in Romania.
Thus, future research directions in the field of the impact of EU funds on regional development in Romania can have multiple valences. Firstly, the projects implemented and analyzed in our research can be examples of good practice. Secondly, future research could be developed at the European level and include studying the impact of major events such as the COVID-19 pandemic on public transport systems and sustainable mobility trends. Also, further research is needed regarding the environmental outcomes of ESIF-funded transport projects, including reductions in greenhouse gas emissions, improvements in air quality, and contributions to climate change mitigation.

 ,
, 


