Article

Exploring the Dynamics of Profitability–Liquidity Relations in Crisis, Pre-Crisis and Post-Crisis

Department of Controlling, Financial Analysis and Valuation, Poznań University of Economics and Business, al. Niepodległości 10, 61-875 Poznań, Poland
*
Author to whom correspondence should be addressed.
Int. J. Financial Stud. 2024, 12(1), 16; https://doi.org/10.3390/ijfs12010016
Submission received: 8 December 2023 / Revised: 31 January 2024 / Accepted: 1 February 2024 / Published: 10 February 2024

Abstract

:
The aim of this study is to verify the stability of the profitability–liquidity relationship over time, as well as to determine this relationship in terms of its level and structure. In this context, three main research questions were formulated. First, is the profitability–liquidity relationship stable in times of crisis? Second, what is the profitability of companies with high and low liquidity? Third, what is the liquidity of companies with high and low profitability? This study uses a self-organizing map (SOM), a data visualization technique that is a type of artificial neural network trained in an unsupervised manner. A dataset covering the period from 2019 to 2021, consisting of 300 Polish companies from the wholesale and retail sectors, was used. The main results of this study indicate that: (1) companies with a balanced profitability–liquidity relationship in the pre-crisis period (2019) maintained this relationship in the crisis (2020) and post-crisis periods (2021); (2) companies in the clusters with the relatively highest and lowest profitability have the relatively lowest and moderate liquidity both before and after the crisis period; (3) the majority of companies during non-crisis periods demonstrate that profitability is not reliant on liquidity, suggesting an absence of a clear relationship; (4) in the post-crisis period, companies with the relatively lowest operating cash flow margin (OCFM) exhibited the relatively highest net profit margin (NPM) and other profitability ratios, as opposed to the pre-crisis and crisis periods. This study fills the gap resulting from the incomplete—most of all static—understanding of the relationship between profitability and liquidity. Moreover, this study employs a self-organizing map (SOM) which has not been used in the literature regarding the research area undertaken.

1. Introduction

Explaining the origins of performance disparities between companies is a fundamental theoretical and empirical concern, particularly within the domains of corporate finance and strategic management. “Although different theories have tried to illuminate the reasons why some firms are more profitable than others, and a large amount of research has considered and explored different factors that may impact firm performance, the issue of firm profitability continues to be an actual, significant and inexhaustible phenomenon that attracts the attention of many researchers and practitioners” (Pervan et al. 2019, p. 968).
The literature suggests that a firm’s internal factors have a greater influence on its performance than external ones (Hawawini et al. 2003; Makhija 2003). The debate typically focuses on liquidity as a crucial factor that affects short-term performance. However, empirical studies on the relationship between liquidity and short-term performance produce contradictory outcomes. Some studies have confirmed a positive relationship (Hirsch et al. 2014; Nunes et al. 2012), no relationship (Jaworski et al. 2018; Sur and Chakraborty 2011) or—most often—a negative relationship (Eljelly 2004; Maçãs Nunes et al. 2009).
Holding liquidity in the short term may reduce profitability, but it could ultimately improve it in the medium to long term. The bolstering effect of increased liquidity is rooted in healthy fundamentals that enhance stakeholder confidence and reduce the risk of bankruptcy (Nanda and Panda 2018). Interestingly, Vieira (2010) ascertained that over the medium term, the majority of companies sampled were unable to maintain both high liquidity and low profitability. Conversely, those companies with high liquidity and profitability—or low liquidity and profitability—tended to remain in these states.
The relationship between liquidity and profitability remains incompletely understood, the reason for which may be the factors that disrupt this relationship. One factor to be explored is the concept of crisis. While prior studies have looked into how companies performed during crises, none of these studies have delved into the specific variations in company performance comparing pre-crisis, crisis, and post-crisis periods (Cheong et al. 2021).
This study fills the gap resulting from the indicated incomplete understanding of the relationship between profitability and liquidity. Moreover, this study employs a self-organizing map (SOM)—the data visualization technique being a type of artificial neural network trained in an unsupervised manner—which has not been used in the literature regarding the research area undertaken, enabling conclusions to be obtained that explain the partially disparate research results presented in the literature. A dataset spanning from 2019 to 2021, comprising 300 Polish companies from the wholesale and retail trade sector, was used.
The aim of the current study is to verify the stability of the profitability–liquidity relationship over time, as well as to determine this relationship in terms of its level and structure. This study enhances the academic discussion and has implications for business practice.
The results of this study indicate that companies with a balanced profitability-liquidity relationship in the pre-crisis period maintain this relationship during the crisis and in the post-crisis periods, although the levels of profitability and liquidity ratios decline. Secondly, the results of this study show that companies in the clusters with the relatively highest and lowest profitability have the relatively lowest and moderate liquidity both before and after the crisis of 2020. On the other hand, the group of companies with the relatively highest liquidity tends to have relatively moderate profitability. Moreover, concerning the majority of companies during non-crisis periods, the relationship between profitability and liquidity aligns with the midpoint of Gentry’s curve (Gentry 1976). Thirdly, an interesting phenomenon emerged in the post-crisis period of 2021, with companies having their relatively lowest levels of operating cash flow margin (OCFM) while also having their relatively highest levels of net profit margin (NPM) and other profitability ratios, and vice versa. This phenomenon is particularly striking when compared to the years 2019 and 2020 characterized by a “normal” convergence of OCFM, NPM and other profitability ratios.
The structure of the paper is as follows: Section 2 presents the literature review and research questions; Section 3 describes the methodology used in this study (including sample, variables and analytical approach); Section 4 shows the results of the research, and finally, Section 5 is devoted to discussion and conclusions, as well as the future research directions.

2. Literature Review and Research Questions

Maximizing profit while ensuring sustainability is crucial to a company’s long-term survival. The literature has extensively examined the changing trends in corporate profitability over time and scrutinized the influence of internal (firm-specific) and external (industry-specific) factors on this phenomenon (Nanda and Panda 2018). As far as theoretical basis is concerned, the researchers are engaged in a debate regarding whether a company’s performance is primarily shaped by its internal resources, as posited by the resource-based theory, or by external factors emanating from the broader economic environment, as suggested by system theory (Cheong et al. 2021).
The literature suggests that a firm’s internal factors have a greater influence on its performance than external ones (Hawawini et al. 2003; Makhija 2003). The debate typically focuses on liquidity as a crucial factor that affects short-term performance. However, empirical studies on the relationship between liquidity and short-term performance produce contradictory outcomes. Some studies have confirmed a positive relationship (Hirsch et al. 2014; Nunes et al. 2012), no relationship (Jaworski et al. 2018; Sur and Chakraborty 2011) or—most often—a negative relationship (Eljelly 2004; Maçãs Nunes et al. 2009), potentially because of the cost savings in maintaining liquid assets and using cheaper funding sources. However, this negative relationship could potentially manifest only in the short term. In the medium to long term, inadequate liquidity may lead to reduced profitability, augmented loan demands, and insufficient cash flow, thereby engendering a cycle that adversely impacts a company’s performance (Hirigoyen 1985).
Holding liquidity in the short term may reduce profitability, but it could ultimately improve it in the medium to long term. The bolstering effect of increased liquidity is rooted in healthy fundamentals that enhance stakeholder confidence and reduce the risk of bankruptcy (Nanda and Panda 2018). Indeed, many studies suggest that higher liquidity and profitability decrease the likelihood of firm failure (Ratajczak 2023).
Interestingly, Vieira (2010) ascertained that over the medium term, the majority of companies sampled were unable to maintain both high liquidity and low profitability. Conversely, those companies with high liquidity and profitability—or low liquidity and profitability—tended to remain in these states. Byczkowska and Kuciński (2018) observed that over the long term, a significant level of reported profits feeds into a company’s cash flow, and this has a positive impact on their ability to pay. This could potentially explain the phenomenon of high liquidity and profitability maintained by certain companies.
Kowerski (2016) contends that assuming a linear correlation between profitability and using static liquidity ratios does not comprehensively reflect the topic at hand. Instead, a relationship that follows an inverted U-shape may be more appropriate (Gentry 1976). This implies that profitability is not favored with either very high or very low liquidity levels. When liquidity values are small, boosting liquidity could enhance profitability until a certain threshold is surpassed. However, once that threshold is passed, increasing liquidity may ultimately lead to decreased profitability.
The relationship between liquidity and profitability remains incompletely understood, the reason for which may be factors that disrupt this relationship. One factor to be explored is the concept of crises. While prior studies have looked into how companies performed during the global financial crisis, none of these studies have delved into the specific variations in company performance comparing pre-crisis, crisis, and post-crisis periods (Cheong et al. 2021). However, Lee et al. (2017) highlighted that crises affect company profitability by influencing various internal factors. Vieira’s (2010) empirical research on a group of publicly listed Portuguese companies indicates that economic hardship has a detrimental impact on the business outcomes of non-financial companies. Meanwhile, Adelopo et al. (2018) separated three periods of pre-crisis, crisis and post-crisis in order to examine bank profitability in the Economic Community of West African States.
The observed diversity in how profitability and liquidity relate suggests the presence of factors that influence the subject relationship. However, only a limited number of authors have explored this phenomenon. Jaworski and Czerwonka (2021) discovered two notable moderators that significantly influence both the strength and direction of the relationship between profitability and liquidity: private sector lending and the development of capital markets. Undoubtedly, these factors are potentially linked to the crisis phenomenon. Consequently, there remains a lack of clarity regarding the impact of both industry-specific and firm-specific factors on a company’s performance, especially in times of crisis.
A lack of understanding of the stability of the profitability–liquidity relationship leads to partially incompatible results, as the inclusion of pre-crisis, during the crisis and post-crisis periods in a research sample distorts the results of such research. This is of particular practical importance because, as Chow et al. (2018) point out, macroeconomic uncertainty such as the global financial crisis poses a significant challenge to companies’ resource allocation decisions.
The stability of the subject relationships is a crucial consideration, particularly in light of the current economic climate. Many economic principles are being challenged due to vastly different macroeconomic conditions. For instance, the Federal Reserve Board’s policy of injecting liquidity into the financial system lacks a scale of comparison. While some authors have addressed this issue, they have only done so in relation to banks and other financial institutions, not businesses. As demonstrated by the recent pandemic crisis, economic principles remain effective. However, it may take more or less time to translate one phenomenon into another. Research on the stability of the relationship between profitability and liquidity will enhance comprehension of the transmission of macroeconomic signals among companies, particularly in diverse industries. This will enable the implementation of appropriate state support policies during future crises, which is crucial given that some companies profited during market turbulence (Shakina and Barajas 2014).
Considering the existing knowledge on the relationship between profitability and liquidity, as well as the research method employed, this paper formulated the following research questions:
  • Is the profitability—liquidity relationship stable in times of crisis?
  • What is the profitability of companies with high and low liquidity?
  • What is the liquidity of companies with high and low profitability?
It is worth mentioning here that this study did not forcefully formulate hypotheses, but instead focused on posing problems and research questions. Through this approach, many interesting interpretations were provided, which is acceptable in the fields of economics, finance, and management sciences. In accordance with the recommendations of scientific methodologists, it was recognized that hypotheses are not always necessary in these fields of science. If these conditions were to be met, they would have to be simultaneously new, general, clear, non-contradictory, and testable. The authors have concluded that meeting all of these conditions would be somewhat impossible, due in part to the nature of the subject matter covered, the method employed in this study, as well as its limited framework.

3. Methodology

3.1. Sample

This study uses a dataset spanning from 2019 to 2021, comprising 300 Polish companies from the wholesale and retail trade sector, both listed and unlisted. These companies belonged to the G section as per the Polish classification of economic activity (PKD). The section includes: wholesale and retail sales (i.e., sales not requiring processing) of all types of goods; provision of services related to the sale of goods; the repair of motor vehicles and motorcycles. After eliminating outliers and observations with missing data, as is required by the adopted research methodology, this study utilized 255 companies during the years 2019 and 2020, and 241 companies in 2021. To eliminate univariate outliers, z-scores were computed and all individual variable observation results that were not within the range of −3.29 and +3.29 were deleted.
This study used data from the EMIS service provided by an ISI Emerging Markets Group company. EMIS randomly selected an initial sample of 300 companies as part of its on-demand data service to minimize the number of observations with missing variables that are components of profitability and liquidity indicators. It should be noted that the sample, consisting of companies that reliably report financial data, may have some bias, although this may not be a significant issue.

3.2. Variables

As far as variables are concerned, accrual profitability was reflected by net profit margin (NPM), operating return on assets (OROA) and return on equity (ROE). Liquidity was reflected by current ratio (CURTR), quick ratio (QR) and cash ratio (CR). The operating cash flow margin (OCFM) is treated as a cash profitability measure. Generally, cash efficiency ratios, e.g., OCFM, have characteristics that make them synthetic performance measures at the intersection of profitability and liquidity that are more resistant to creative accounting activities than profitability ratios, and as such should be used more often as the primary synthetic performance measures (Nowicki 2023). Thus, as synthetically as possible, with the help of seven indicators and taking into account their advantages and disadvantages, a holistic picture of the company’s profitability and liquidity was created.

3.3. Analytical Approach

This study utilizes the data visualization method of the self-organizing map (SOM), commonly referred to as Kohonen’s map. SOMs belong to the category of artificial neural networks, which are trained through unsupervised, competitive learning to acquire a low-dimensional, discrete representation of the input space derived from the training samples. Such a representation adopts the form of a map that safeguards the core features of the input data. Self-organizing maps (SOMs) generally use a two-dimensional grid as their primary topology, but they can also utilize one-dimensional, multi-dimensional and irregular grids (Miljković 2017).
This method was chosen primarily for its exploratory nature, which offers the potential to break free from inconclusive results concerning the subject relationship obtained by more commonly used methods. Self-Organizing maps provide a straightforward way to gain insight into the data structure, allowing for the falsification of some of the results presented in the literature and the development of new hypotheses. To our knowledge, this method has not been previously applied to either profitability or liquidity, nor has the relationship between the two been explored. Tonidandel et al. (2018) suggested that “advances in data science, such as data mining, data visualization, and ML, are extremely well-suited to address numerous questions in the organizational sciences given the explosion of available data. Despite these opportunities, few scholars in our field have discussed the specific ways in which the lens of our science should be brought to bear on the topic of big data and big data’s reciprocal impact on our science.” This comment also applies, to a lesser extent, to the discipline of finance.
In this method, each neuron on a map is depicted by an n-dimensional weight vector w = (w1, …, wn), where n is the dimension of the input vectors, i.e., the number of variables used to depict observations. The map’s weights are determined through a learning process in which the neurons gain comprehension of the fundamental patterns underlying the data. During this process, a distance measurement is used to compare all data vectors to all weight vectors. For each input vector, the weights of the nearest neuron are adjusted to decrease the distance between the input vector and the neuron. Next, the weights of all neurons located in its neighborhood are also adjusted, but the extent of the change is directly related to the distance between them on the map. This weight adjustment extends to all nearby neurons, and the radius of this neighborhood gradually decreases as learning proceeds using a predefined function. This procedure is repeated until a specified stopping criterion is met (Du Jardin and Séverin 2012).
Self-organizing maps are well-regarded for their clustering, visualization, and classification capabilities. In today’s era of ever-expanding datasets, especially in the natural sciences, the importance of visualization is increasing. Self-organizing maps offer several appealing attributes in this context: they do not rely on assumptions about data distributions, can seamlessly handle large datasets, and have proven valuable in numerous practical applications (Wehrens 2007). One of the most popular neural network architectures is the self-organizing map (SOM) (Miljković 2017). While there are multiple methods to map a high-dimensional dataset into two dimensions, with principal component analysis being the most commonly used, SOM offers numerous advantages (Wehrens 2007).
For this study, we used the Kohonen library (Wehrens and Johannes 2023) in R to create the maps. Supporting calculations were performed in Excel. A rectangular map consisting of 16 neurons was used, with 4 per row and 4 per column. While somewhat arbitrary, this configuration corresponds to empirical practices (Cottrell and Rousset 1997). The learning rate (alpha) is a set of numbers that changes gradually from 0.05 to 0.01 over 700 times, as the complete dataset is presented to the network (rlen). The radius of the neighborhood should begin with a value that covers 2/3 of all unit-to-unit distances, changing gradually from this value to zero. To normalize the SOM, the features were scaled to unit variance using a common approach (the mean was subtracted from each observation and divided by the standard deviation).
Although it is feasible to identify clusters manually by studying heatmaps and generating narratives about distinct regions on a map, this research study implemented hierarchical clustering provided by the Kohonen library (Wehrens and Johannes 2023). Ideally, the clusters discovered ought to be adjacent on the map, but this is not always possible depending on the distribution of underlying variables. The clusters’ quantity was determined by the expert technique, observing their adjacency and economic meaning on the map. The order of the nodes is shown in Appendix D.

4. Results

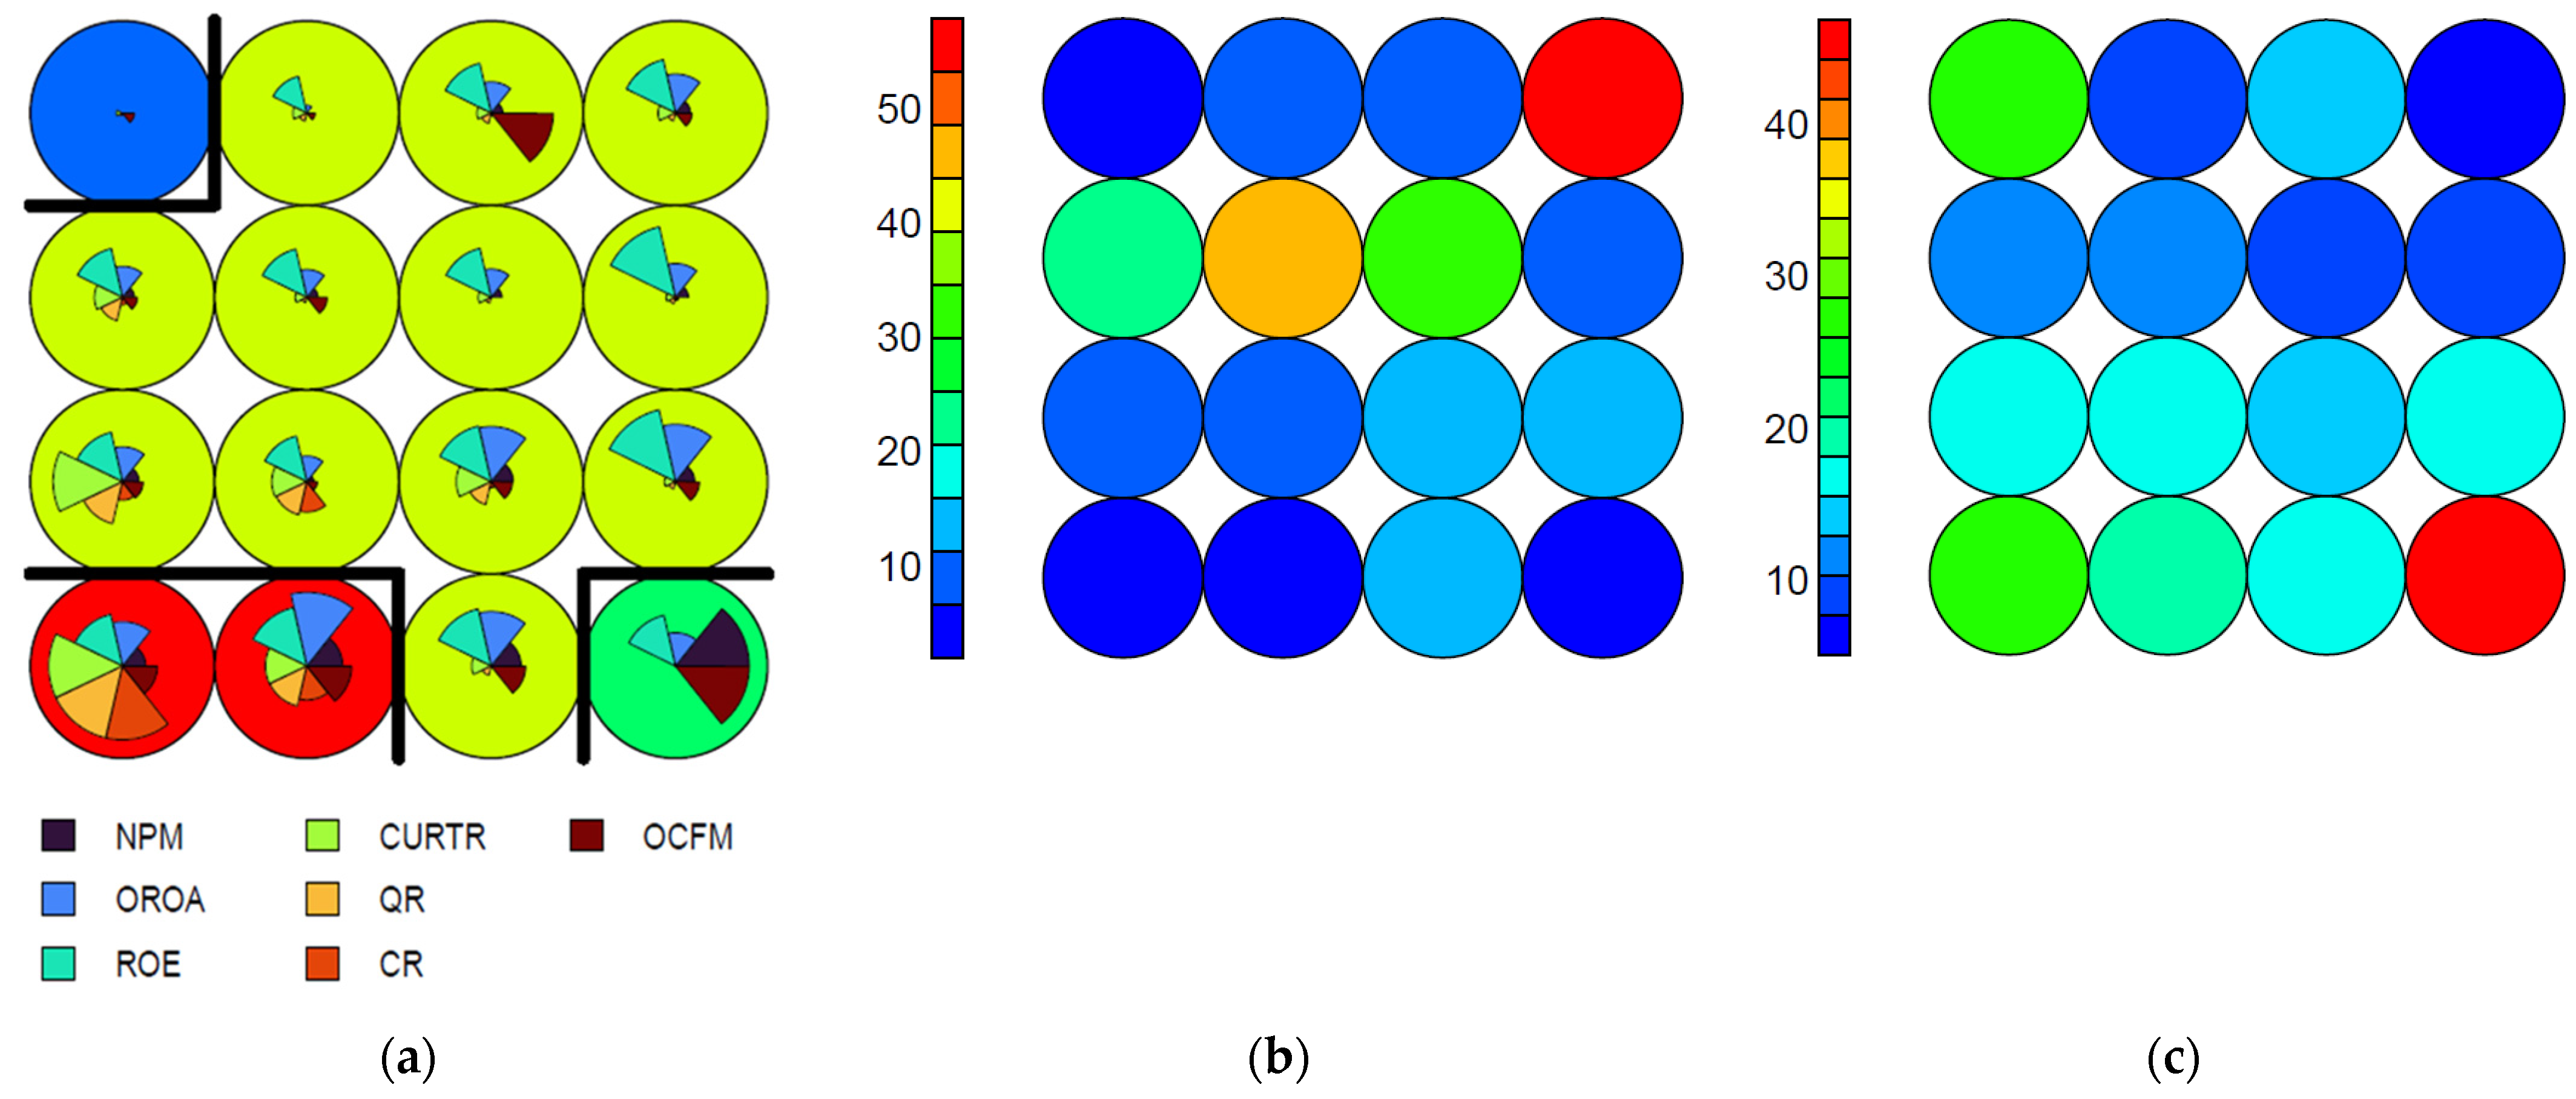
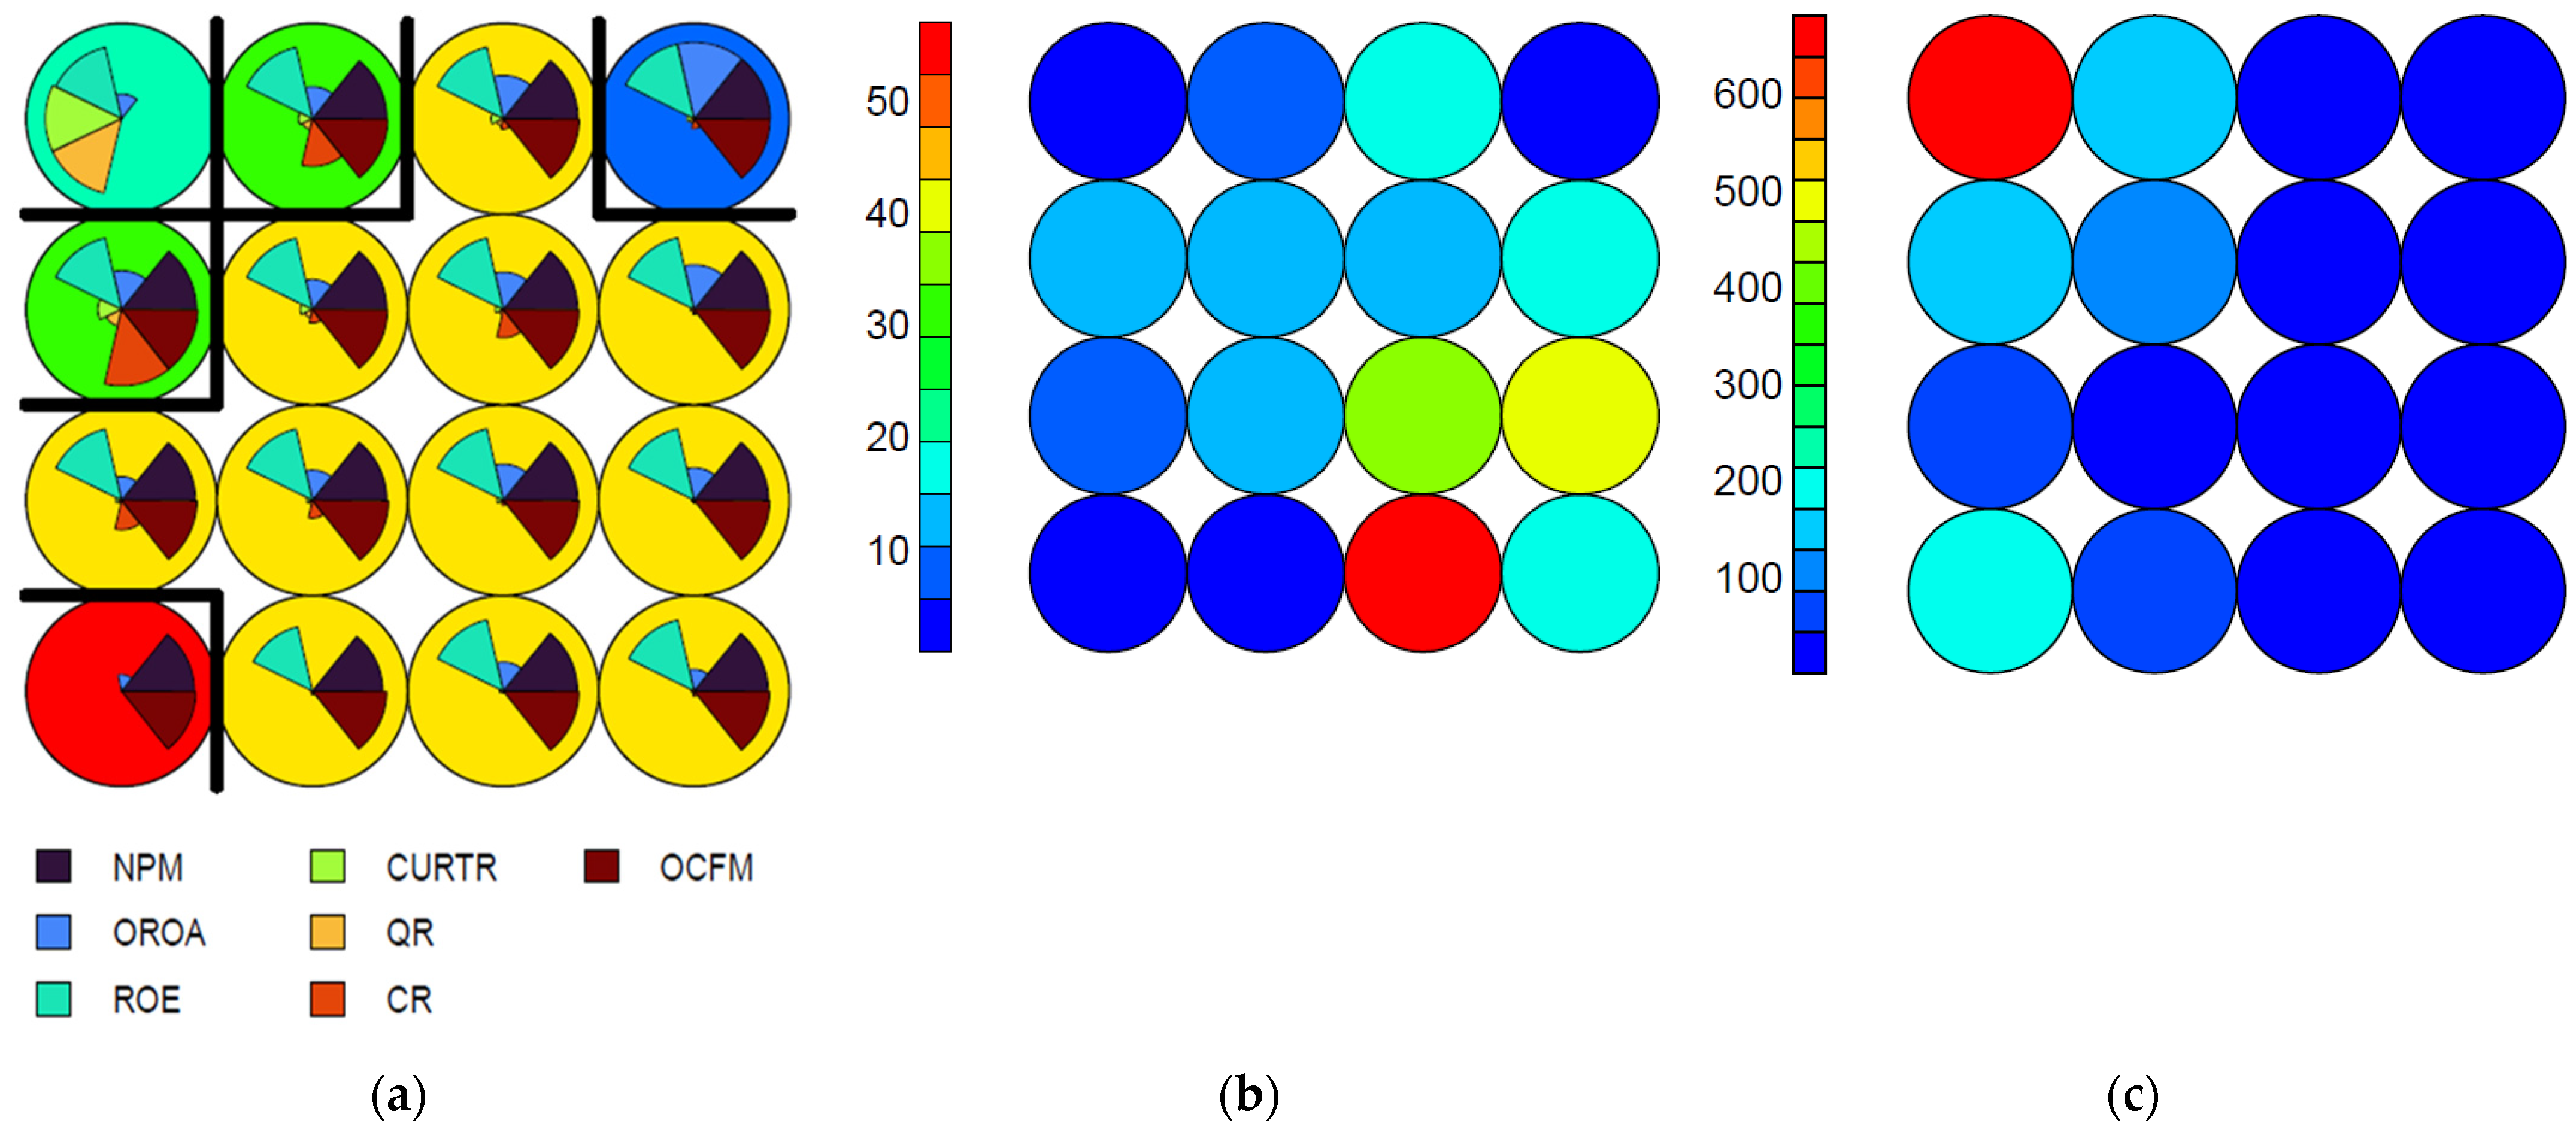
4.1. Codes, Node Counts, and Neighbor Distance Plots in 2019, 2020, and 2021

The results of this study concern the codes, node counts, and neighbor distance plots for the years 2019–2021. The last two types of plots allow for an in-depth interpretation of the main area of interest, namely the codes plot, and also permit a visual assessment of its quality.
The maps for 2019 are shown in Figure 1.
By examining the weight vectors distributed on the map, individuals can identify patterns and the distribution of variables and observations. Weight vectors are then illustrated through individual representations of variable magnitudes for each node using a “fan” diagram. Afterward, the self-organizing map (SOM) nodes are clustered to group similar observations with similar “fan” patterns.
As can be seen in Figure 1a, four basic groups of companies can be distinguished in 2019, which are similar in terms of net profit margin (NPM), operating return on assets (OROA), return on equity (ROE), current ratio (CURTR), quick ratio (QR), cash ratio (CR), and operating cash flow margin (OCFM). The first group of companies is located in the most numerous cluster containing 12 nodes marked in green. These are companies with a diverse but relatively moderate level of ratios. Here, it should be noted that the relative level ratio—as the name suggests—is due to comparison with other companies. The second group of companies—in the nodes marked in red—is characterized by relatively high profitability (both accrual and cash) as well as relatively high liquidity. The third cluster, marked in green, contains companies with relatively moderate to high levels of profitability (both accrual and cash) but at the same time, the relatively lowest levels of liquidity. The last, blue cluster identified in 2019 contains companies with the relatively lowest levels of all ratios examined in this study. These four clusters can be labeled with simplified buzzwords, acting as convenient descriptors for subsequent analysis: “ordinary” companies, “liquid & profitable” companies, “illiquid & profitable” companies, and “near bankruptcy” companies.
Figure 1b illustrates the number of observations assigned to each node on the map. This provides insight into the quality of the map, with an ideal sample distribution being uniform. The presence of large values in specific areas, such as node 16, may indicate the benefit of a larger map. However, an excessively large map can result in undesirable empty nodes.
The plot presented in Figure 1c demonstrates the distance between every node and its adjacent ones. Areas with a low neighbor distance indicate similar node groups, while larger distances indicate more dissimilar nodes and natural boundaries between node clusters. The research sample shows a relatively large distance in node 5, while nodes in the upper right corner of the plot show a small distance.
Average profitability and liquidity of companies in 2019—based on scaled values of the variables—in each node are shown in Table 1. For example, the fourth node (“illiquid & profitable” companies) shares a similar level of OCFM as the fifteenth node (“ordinary” companies) despite being characterized by incomparably higher levels of NPM.
In terms of methodology, it is worth noting that the Kohonen library presents the normalized variables as the default plot. However, in some circumstances, a more practical and comprehensible visualization would be to present the variables prior to scaling. By using weight vectors across the map, all dimensions can be viewed simultaneously, which is unsuitable for a high-dimensional SOM. However, with only seven dimensions, heatmaps are still valuable. The heatmap enables the visualization of the distribution of a single variable across the map. Typically, the process of investigating a SOM involves generating various heatmaps, followed by comparing them to identify notable regions and their attributes (Lynn 2014). This can be accomplished because the positions of the individual observations do not vary from one visualization to another.
Detailed information regarding the companies in 2019 is displayed through the heatmaps presented in Appendix A. Regarding research results, it is worth noting that respective nodes are quite diverse in comparison to 2021, and especially 2020. Furthermore, it is evident that companies exhibiting the highest relative levels of profitability (excluding OROA) and the lowest relative levels of profitability are those demonstrating the lowest levels of liquidity, while companies with moderate profitability display varying degrees of liquidity. The cluster of companies with the highest liquidity, on the other hand, is characterized by moderate profitability.
The results of this study concerning the codes, node counts, and neighbor distance plots for 2020 are shown in Figure 2.
As can be seen in Figure 2a, five main groups of companies were distinguished in 2020, indicating a greater variety of companies than in 2019. The first group of companies—which can also be described as “ordinary” companies—is located in the yellow-marked cluster. The second cluster, marked in bright green, includes companies with relatively moderate (OROA) to high (NPM, ROE, and OCFM) levels of profitability and CR but at the same time low levels of CURTR and QR. Interestingly, companies in this cluster differ from “ordinary companies” only in that they have the relatively highest level of CR. In fact, this is the only cluster containing companies with such a level of CR. The third group of companies—in the nodes marked in turquoise—is characterized by relatively high ROE, CURTR, and QR only. The fourth cluster, marked in red, contains companies with relatively high levels of NPM and OCFM only. The fifth cluster, marked in blue, consists of companies which are unique, in that they are the only ones with the relatively highest levels of profitability (both accrual and cash) and the lowest levels of liquidity.
The plot in Figure 2b indicates large values in the third and eighth nodes. The plot in Figure 2c indicates that there is a relatively large distance in the thirteenth node.
Average profitability and liquidity of companies in 2020—based on scaled values of the variables—in each node are shown in Table 2.
In-depth information about the companies in 2020 is shown in the heatmaps in Appendix B. Regarding research results, it is worth noting that respective nodes are very similar except from CR, and—to a lesser extent—OROA. What is particularly interesting is that in 2020, unlike in 2019 and 2020, the lowest value of the NPM map is in a completely different place than the lowest values of the OROA and ROE maps, despite the fact that they are all ratios of accrual profitability. As far as the relationships of the highest profitability as well as the lowest profitability with the lowest liquidity are concerned, in contrast to 2019 and 2021, there are no clear patterns in 2020.
The results of this study concerning the codes, node counts, and neighbor distance plots for 2021 are shown in Figure 3.
Six main clusters of companies may be identified in 2021, as shown in Figure 3a. This indicates an increase in diversity among companies. There are two reasons for this. Firstly, the research methodology used a baseline of 2019 and outliers were only removed in this year. Secondly, the aftermath of the 2020 crisis may have caused companies to diverge further. The first, the most numerous group of companies, which are characterized by a relatively high level of OCFM and relatively moderate levels of other ratios, is marked in orange. The second cluster, marked in bright green, includes companies with a relatively high level of OCFM, and relatively low levels of other ratios. The third cluster, marked in red, is characterized by relatively moderate to high levels of profitability, and the relatively lowest levels of liquidity. The fourth, light green cluster, is characterized by a relatively high level of NPM only. The fifth cluster, marked in light blue, is the only one that contains companies with relatively high liquidity readings. The last cluster, marked in dark blue, contains companies with balanced and at the same time moderate levels of all ratios.
The plot in Figure 3b indicates large values in a few nodes, mainly the eleventh and twelfth. The plot in Figure 3c indicates that there is a relatively large distance in the thirteenth node—the one associated with relatively high levels of liquidity.
Average profitability and liquidity of companies—based on scaled values of the variables—in each node are shown in Table 3.
In-depth information about the companies in 2021 is shown on the heatmaps in Appendix C. Regarding the research results, it is worth noting that respective nodes are very similar in terms of liquidity, and less in terms of profitability (accrual and cash). Of particular interest may be the companies grouped in node 5, which are characterized by the relatively lowest OCFM, and at the same time the relatively highest NPM. This is quite unusual, even more so considering 2019 and 2020, where the same node, in this case node 4, had the relatively highest levels of OCFM and NPM. The similar strange regularity in 2021 can be observed in node 16, where the highest indications for OCFM are the lowest for the other profitability ratios. Moreover, it can be seen that companies with the highest profitability (accrual and cash) as well as the lowest profitability are those with the lowest or moderate liquidity, while companies with moderate profitability have various levels of liquidity, although the conclusions drawn from Table 3 may be somewhat more nuanced than those drawn from the heatmaps in Appendix C, as the heatmaps show only relatively large differences in the levels of the indicators. The cluster of companies with the highest liquidity, on the other hand, is characterized by moderate profitability.

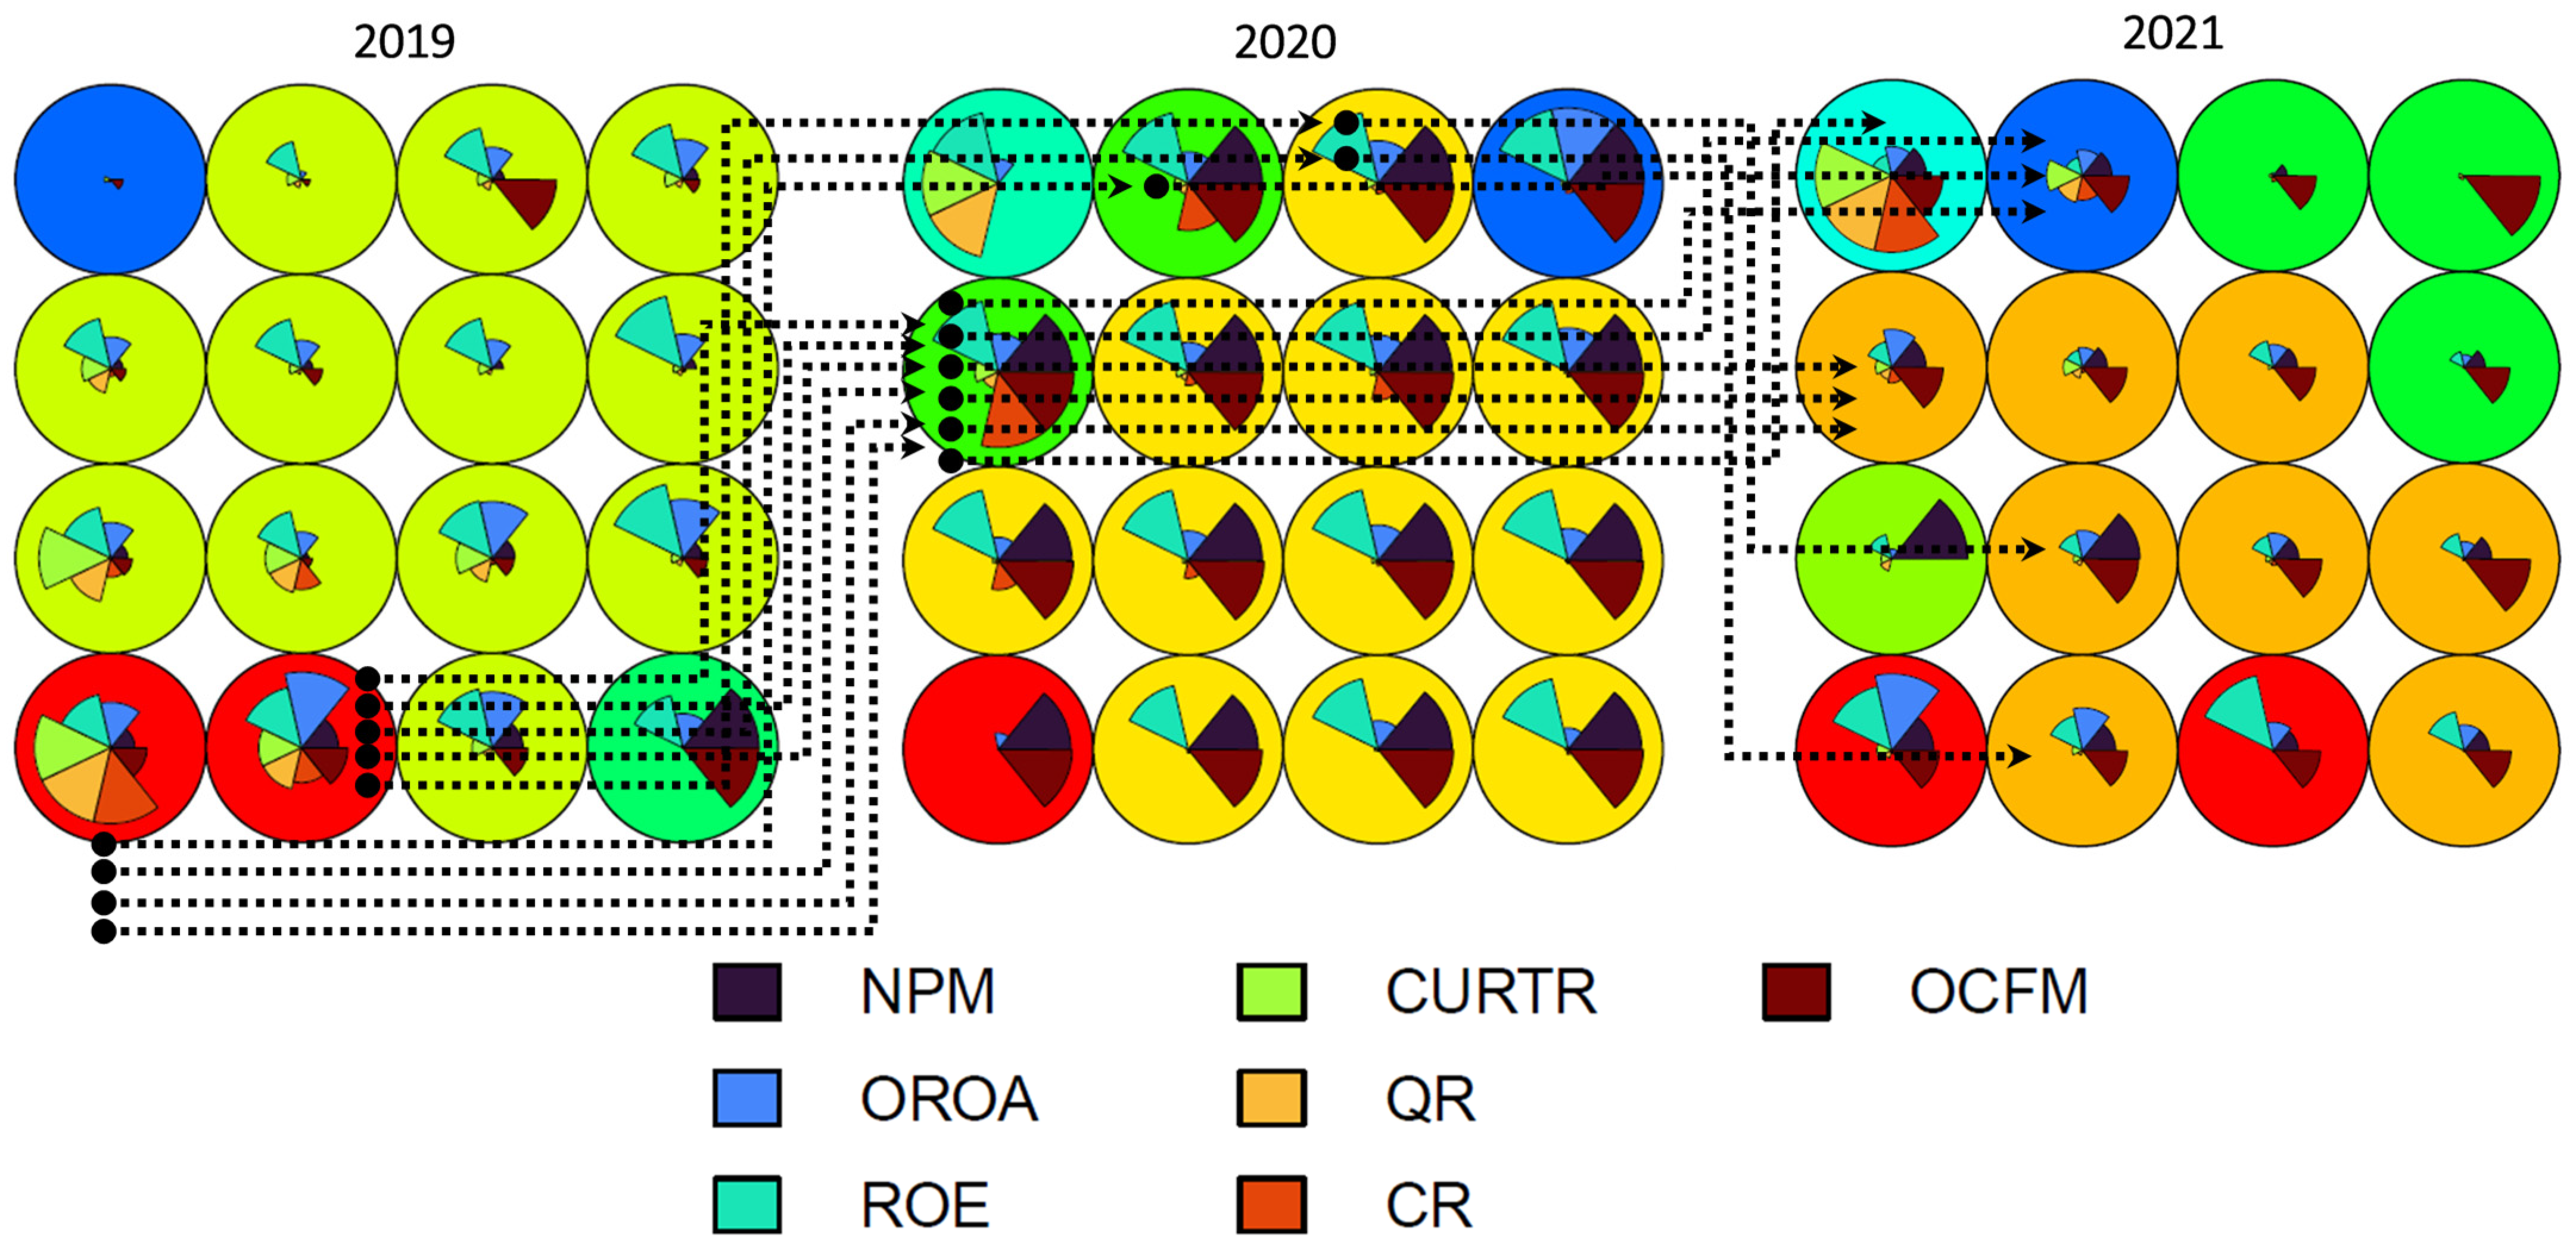
4.2. The Trajectory of High Profitability—High Liquidity Companies over 2019–2021

The results of this study concern the stability of the profitability—liquidity relationship over time. The stability—using Kohonen’s maps—is shown, when the same companies are located in nodes with similar characteristics of the variables over the years studied. The most interesting relationship, i.e., the high profitability—high liquidity relationship in the pre-crisis, during the crisis, and in the post-crisis periods is presented in Figure 4.
As can be seen in Figure 4, in 2019, the nodes with relatively high levels of liquidity and profitability are nodes 1 and 2 (red color). These nodes included 10 companies, of which 9 are shown due to the lack of data in 2020 for the 10th company. As many as seven of these nine companies were in 2020 at nodes 9 and 14 (green color), i.e., the nodes with the most balanced levels of profitability and liquidity ratios in that year. This means that these companies are mostly following the same path. And although the liquidity of these companies in 2020 dropped significantly relative to 2019, they are still the most balanced companies, i.e., those maintaining both profitability and liquidity. Interestingly, these companies were characterized by the relatively highest CR. At the same time, none of the companies with the relatively highest liquidity and profitability in 2019 were in the node of companies with the relatively highest liquidity and lowest profitability in 2020, i.e., the thirteenth node marked in light blue. In 2021, seven out of the nine initially analyzed companies were in balanced nodes, specifically nodes nine, thirteen, and fourteen, although in six cases, the balance meant relatively moderate levels of liquidity and profitability. Generally, it can be noted that companies that had a balanced profitability–liquidity relationship in the pre-crisis period maintained this relationship during the crisis and in the post-crisis, although the level of these ratios in the analyzed research sample declined.

5. Discussion, Limitations and Future Research

This study utilizes the self-organizing map (SOM) data visualization technique, a method not previously explored within the field it addresses. This approach allows for conclusions that reconcile the partially conflicting research results found in the existing literature. Consequently, this study enriches the academic discourse and carries implications for practical application in business.
This study’s results, which cover three different time frames, offer a new perspective on the issue identified by Cheong et al. (2021) who claimed that “although there has been a myriad of research works explaining the effect of the crisis on firm performance, no study has attempted to examine the determinants of both accounting and market-based measures of firm profitability over the pre-crisis, crisis and post-crisis periods.” Still, in the previous research, liquidity appears to have a limited impact as it only influences the return on equity in the period following the crisis (Cheong et al. 2021). In a similar vein, Nanda and Panda (2018) found that in the post-crisis period, size and liquidity were significantly and positively related, whereas leverage was significantly and negatively related to profitability. In detail, their study confirmed that Indian manufacturing firms can enhance their profitability by maintaining sufficient liquidity. Firms may incur some short-term costs for maintaining liquidity, but in the long run, it has a positive impact on profitability. Accordingly, their study supports the hypothesis that an increase in firm size and liquidity enhances profitability, while leverage discourages profitability. During the crisis, both debt and the availability of cash were important elements (Notta and Vlachvei 2014). Moreover, while the agency theory of free cash flow argues that accumulating corporate cash can lead managers to invest in projects that decrease value, maintaining high cash reserves is advised during a crisis to ensure corporate liquidity (Jensen 1986). In terms of the pre-crisis period, the debt–equity ratio and liquidity play significant roles and have opposite effects on corporate profits, one negatively and the other positively (Nanda and Panda 2018). In particular, companies with pre-existing financial adaptability possess a higher capacity to seize investment prospects, are far less dependent on internal funds for investment, and outperform less adaptable firms during the crisis (Arslan-Ayaydin et al. 2014).
Following the established causal link where liquidity influences profitability, this study concludes that during non-crisis periods, low liquidity is a necessary but insufficient condition for the exceptionally high profitability. Furthermore, given that the highest levels of liquidity were recorded for companies with moderate profitability, the relationship between profitability and liquidity may deny the shape of a line of an inverted “U” letter (Adamczyk and Waśniewski 2018; Gentry 1976; Kowerski 2016) and suggest—at least at first glance—the shape of an area of a “D” letter. These companies with high liquidity and moderate profitability are protected against bankruptcy due to their liquidity. However, they face limitations on significant performance for the same reason.
In summary, for the majority of companies during non-crisis periods, the relationship between profitability and liquidity aligns with the midpoint of Gentry’s curve (Gentry 1976). This signifies that profitability is not reliant on liquidity, suggesting an absence of a clear relationship. Differing findings in studies (showing positive or negative relationships) might stem from intra-industry variations. This echoes Hawawini et al. (2003) who indicated that exceptional firms significantly differ in performance from others in the same industry, where firm-specific assets outweigh industry factors. This implies that liquidity’s impact on profitability may only be significant for exceptional companies, aligning with Awad et al. (2013) who found negligible statistical impacts of average liquidity levels on profitability. Still, the interpretation could go further as according to Hirigoyen (1985), profitability and liquidity not only result from each other but also impose limitations on one another.
Considering that an interesting phenomenon emerged in the post-crisis period of 2021, with companies having their relatively lowest levels of OCFM while also having their relatively highest levels of NPM, it is worth reaching out to Nowicki (2023) who argued that cash efficiency ratios are more resilient to creative accounting practices than accrual profitability ratios and, as such, should be used more frequently as primary synthetic efficiency measures, which currently seem to be dominated by accrual profitability ratios. In general, we can say that different ratios react in different ways and at different speeds. In this context, an interesting study was undertaken by Nanda and Panda (2018) claiming that NPM reacts to changes in debt more swiftly than ROA, and in detail, that the initial adverse effect on ROA caused by a substantial debt change is relatively smaller compared to NPM, and it diminishes more rapidly than NPM.
This study has limitations in sample selection, year selection, and the method used. Specifically, it is biased towards a particular country and industry, which reduces the generalizability of its findings. Additionally, using only one year (2019) as a baseline is a limitation. Including more years would be valuable, especially since crises have different characteristics. Furthermore, there are various ways of defining pre- and post-crisis periods, as well as the crises themselves. Official data from state statistical offices are used to determine when the crisis has ended, as is common practice in most studies. However, it is important to note that the consequences of the crisis can be nuanced and prolonged, and the recovery process can be lengthy. Therefore, 2020 can be considered the central crisis period. It is important to note that the post-crisis period does not necessarily mean that it is a completely positive time for companies. Finally, although SOM has advantages with its intuitive visual presentation, it does not provide statistically validated numbers to prove the results. Another limitation of this study is the comparability with previous studies due to its unique methodology. In future research, it may be necessary to combine the advantages of SOM clustering with classical regression analysis or classification.
The research conducted can be continued in several directions. First, the relationship should be studied for selected companies, such as young ones, or listed ones, etc. In this context, Varum and Rocha (2013) argue that small and medium-sized enterprises act as stabilizers during economic downturns, while the performance of larger firms appears to decline more rapidly. Small firms are more agile and better equipped to adapt to changes in their external environment, thereby experiencing less hardship during economic adversities. Second, incorporating moderators into the research is advisable. For example, Jaworski and Czerwonka (2021) suggest that various factors can moderate the strength and direction of this correlation, linked to macroeconomic and institutional circumstances. Furthermore, exploring distinct industry profiles could offer valuable insights. For instance, Chambers and Cifter (2022) highlighted that “across a broad analysis of seven U.S. industrial sectors, Jose et al. (1996) found that proactive management of liquidity is linked to increased profitability in several industries, although not universally across all sectors.”

6. Conclusions

The aim of this study was to verify the stability of the profitability–liquidity relationship over time, as well as to determine this relationship in terms of its level and structure. This study’s primary findings are as follows.
Firstly, it can be generally noted that companies with a balanced profitability–liquidity relationship in the pre-crisis period maintain this relationship during the crisis and in the post-crisis periods, although the levels of profitability and liquidity ratios in the analyzed research sample declined.
Secondly, the results of this study show that companies in the clusters with the relatively highest and lowest profitability have the relatively lowest or moderate liquidity both before and after the crisis. Thus, it can be noted that every company with very high profitability is characterized by low liquidity, which of course does not mean that every company with low liquidity is characterized by very high profitability. Moreover, companies with relatively moderate profitability have different levels of liquidity. On the other hand, the group of companies with the relative highest liquidity tends to have relatively moderate profitability. However, these patterns are not evident during a crisis.
Thirdly, an interesting phenomenon emerged in the post-crisis period of 2021, with companies having their relatively lowest levels of OCFM while also having their relatively highest levels of NPM. This phenomenon is particularly striking when compared to 2019 and 2020, when the same companies had the highest levels of both OCFM and NPM simultaneously. This unusual pattern is again evident in 2021 when examining companies with the relatively highest OCFM but the relatively lowest accrual profitability ratios. The years 2019 and 2020 are characterized by a “normal” convergence of the highest levels for OCFM and most profitability ratios.

Author Contributions

Conceptualization, P.R., J.N. and D.S.; methodology, P.R., J.N. and D.S.; validation, P.R. and D.S.; formal analysis, P.R.; investigation, P.R.; resources, P.R., J.N. and D.S.; data curation, P.R., J.N. and D.S.; writing—original draft preparation, P.R., J.N. and D.S.; writing—review and editing, P.R. and D.S.; funding acquisition, D.S. All authors have read and agreed to the published version of the manuscript.

Funding

This publication was financed from the state budget under the program of the Minister of Education and Science (Poland) under the name “Science for Society”. Project number: NdS/543640/2021/2022, amount of co-financing: 155.125 PLN, total value of the project: 699.200 PLN.

Informed Consent Statement

Not applicable.

Data Availability Statement

Data are available on the paid platform EMIS provided by an ISI Emerging Markets Group company.

Conflicts of Interest

The authors declare no conflicts of interest.

Appendix A. Heatmaps for 2019

Ijfs 12 00016 i001

Appendix B. Heatmaps for 2020

Ijfs 12 00016 i002

Appendix C. Heatmaps for 2021

Ijfs 12 00016 i003

Appendix D. The Order of the Nodes

Ijfs 12 00016 i004

References

  1. Adamczyk, Adam, and Piotr Waśniewski. 2018. Is Excess Liquidity Real? The Analysis of Relationship between Liquidity and Profitability. Zeszyty Naukowe Uniwersytetu Szczecińskiego Finanse Rynki Finansowe Ubezpieczenia 92: 11–21. [Google Scholar] [CrossRef]
  2. Adelopo, Ismail, Robert Lloydking, and Venancio Tauringana. 2018. Determinants of Bank Profitability before, during, and after the Financial Crisis. International Journal of Managerial Finance 14: 378–98. [Google Scholar] [CrossRef]
  3. Arslan-Ayaydin, Özgür, Chris Florackis, and Aydin Ozkan. 2014. Financial Flexibility, Corporate Investment and Performance: Evidence from Financial Crises. Review of Quantitative Finance and Accounting 42: 211–50. [Google Scholar] [CrossRef]
  4. Awad, Ibrahim, Fahema Jayya, Ibrahim Awad, and Fahema Jayya. 2013. Working Capital Management, Liquidity and Profitability of the Manufacturing Sector in Palestine: Panel Co-Integration and Causality. Modern Economy 4: 662–71. [Google Scholar] [CrossRef]
  5. Byczkowska, Magdalena, and Andrzej Kuciński. 2018. Ocena Płynności Finansowej Przedsiębiorstw Na Podstawie Analizy Rachunku Przepływów Pieniężnych. Zeszyty Naukowe Małopolskiej Wyższej Szkoły Ekonomicznej w Tarnowie 38: 85–100. [Google Scholar] [CrossRef]
  6. Chambers, Nurgul, and Atilla Cifter. 2022. Working Capital Management and Firm Performance in the Hospitality and Tourism Industry. International Journal of Hospitality Management 102: 103144. [Google Scholar] [CrossRef]
  7. Cheong, Carol, Huy Viet Hoang, and David Mcmillan. 2021. Macroeconomic Factors or Firm-Specific Factors? An Examination of the Impact on Corporate Profitability before, during and after the Global Financial Crisis. Cogent Economics & Finance 9: 1959703. [Google Scholar] [CrossRef]
  8. Chow, Yee Peng, Junaina Muhammad, A. N. Bany-Ariffin, and Fan Fah Cheng. 2018. Macroeconomic Uncertainty, Corporate Governance and Corporate Capital Structure. International Journal of Managerial Finance 14: 301–21. [Google Scholar] [CrossRef]
  9. Cottrell, Marie, and Patrick Rousset. 1997. The Kohonen Algorithm: A Powerful Tool for Analysing and Representing Multidimensional Quantitative and Qualitative Data. In Biological and Artificial Computation: From Neuroscience to Technology. Lecture Notes in Computer Science (Including Subseries Lecture Notes in Artificial Intelligence and Lecture Notes in Bioinformatics). Berlin and Heidelberg: Springer, vol. 1240 LNCS, pp. 861–71. [Google Scholar] [CrossRef]
  10. Du Jardin, Philippe, and Eric Séverin. 2012. Forecasting Financial Failure Using a Kohonen Map: A Comparative Study to Improve Model Stability over Time. European Journal of Operational Research 221: 379–96. [Google Scholar] [CrossRef]
  11. Eljelly, Abuzar M. A. 2004. Liquidity—Profitability Tradeoff: An Empirical Investigation in an Emerging Market. International Journal of Commerce and Management 14: 48–61. [Google Scholar] [CrossRef]
  12. Gentry, James. 1976. Management Perceptions of the Working Capital Process. Champaign: College of Commerce and Business Administration, University of Illinois at Urbana. Available online: https://core.ac.uk/download/pdf/4835142.pdf (accessed on 10 December 2023).
  13. Hawawini, Gabriel, Venkat Subramanian, and Paul Verdin. 2003. Is Performance Driven by Industry—Or Firm-Specific Factors? A New Look at the Evidence. Strategic Management Journal 24: 1–16. [Google Scholar] [CrossRef]
  14. Hirigoyen, Gerard. 1985. Rentabilité et Solvabilité. Direction et Gestion, 3, 13–26.—References—Scientific Research Publishing. Available online: https://www.scirp.org/(S(351jmbntvnsjt1aadkozje))/reference/referencespapers.aspx?referenceid=2170423 (accessed on 5 December 2023).
  15. Hirsch, Stefan, Jan Schiefer, Adelina Gschwandtner, and Monika Hartmann. 2014. The Determinants of Firm Profitability Differences in EU Food Processing. Journal of Agricultural Economics 65: 703–21. [Google Scholar] [CrossRef]
  16. Jaworski, Jacek, and Leszek Czerwonka. 2021. Meta-Study on the Relationship between Profitability and Liquidity of Enterprises in Macroeconomic and Institutional Environment. Decision 48: 233–46. [Google Scholar] [CrossRef]
  17. Jaworski, Jacek, Leszek Czerwonka, and Magdalena Mądra-Sawicka. 2018. Zależność Między Rentownością a Płynnością Finansową w Sektorze Przetwórstwa Spożywczego w Polsce. Roczniki Naukowe Stowarzyszenia Ekonomistów Rolnictwa i Agrobiznesu 20: 58–63. [Google Scholar] [CrossRef]
  18. Jensen, Michael. 1986. Agency Costs of Free Cash Flow, Corporate Finance, and Takeovers. American Economic Review 76: 323–29. [Google Scholar]
  19. Jose, Manuel L., Carol Lancaster, and Jerry L. Stevens. 1996. Corporate returns and cash conversion cycles. Journal of Economics and Finance 20: 33–46. [Google Scholar] [CrossRef]
  20. Kowerski, Mieczysław. 2016. Zależność Między Rentownością a Płynnością Finansową Ma Kształt Odwróconego U. Prace Naukowe Uniwersytetu Ekonomicznego We Wrocławiu 440: 338–48. [Google Scholar] [CrossRef]
  21. Lee, Chien Chiang, Mei Ping Chen, and Shao Lin Ning. 2017. Why Did Some Firms Perform Better in the Global Financial Crisis? Economic Research-Ekonomska Istraživanja 30: 1339–66. [Google Scholar] [CrossRef]
  22. Lynn, Shanel. 2014. Self-Organising Maps for Customer Segmentation Using R. Available online: https://www.shanelynn.ie/self-organising-maps-for-customer-segmentation-using-r/ (accessed on 5 December 2023).
  23. Maçãs Nunes, Paulo J., Zélia M. Serrasqueiro, and Tiago N. Sequeira. 2009. Profitability in Portuguese Service Industries: A Panel Data Approach. The Service Industries Journal 29: 693–707. [Google Scholar] [CrossRef]
  24. Makhija, Mona. 2003. Comparing the Resource-Based and Market-Based Views of the Firm: Empirical Evidence from Czech Privatization. Strategic Management Journal 24: 433–51. [Google Scholar] [CrossRef]
  25. Miljković, Dubravko. 2017. Brief Review of Self-Organizing Maps, 1252–57. Available online: https://ieeexplore.ieee.org/document/7973581 (accessed on 1 December 2023).
  26. Nanda, Swagatika, and Ajaya Kumar Panda. 2018. The Determinants of Corporate Profitability: An Investigation of Indian Manufacturing Firms. International Journal of Emerging Markets 13: 66–86. [Google Scholar] [CrossRef]
  27. Notta, Ourania, and Aspasia Vlachvei. 2014. The Impact of Financial Crisis on Firm Performance in Case of Greek Food Manufacturing Firms. Procedia Economics and Finance 14: 454–60. [Google Scholar] [CrossRef]
  28. Nowicki, Jarosław. 2023. Rentowność czy wydajność gotówkowa? Syntetyczny pomiar efektywności w kontekście działań z zakresu kreatywnej rachunkowości. In Analiza ekonomiczna w warunkach niepewności. Edited by Cezary Kochalski. Poznań: Wydawnictwo Uniwersytetu Ekonomicznego w Poznaniu, pp. 102–17. [Google Scholar] [CrossRef]
  29. Nunes, Paulo Maçãs, Ana Viveiros, and Zélia Serrasqueiro. 2012. Are the Determinants of Young SME Profitability Different? Empirical Evidence Using Dynamic Estimators. Journal of Business Economics and Management 13: 443–70. [Google Scholar] [CrossRef]
  30. Pervan, Maja, Ivica Pervan, and Marijana Ćurak. 2019. Determinants of Firm Profitability in the Croatian Manufacturing Industry: Evidence from Dynamic Panel Analysis. Economic Research-Ekonomska Istrazivanja 32: 968–81. [Google Scholar] [CrossRef]
  31. Ratajczak, Piotr. 2023. Holistyczna koncepcja procesu bankructwa przedsiębiorstwa. In Analiza ekonomiczna w warunkach niepewności. Edited by Cezary Kochalski. Poznań: Wydawnictwo Uniwersytetu Ekonomicznego w Poznaniu, pp. 118–34. [Google Scholar] [CrossRef]
  32. Shakina, Elena, and Angel Barajas. 2014. The Dynamics of Intellectual Resources during the Economic Crisis. Economic Research-Ekonomska Istrazivanja 27: 861–81. [Google Scholar] [CrossRef]
  33. Sur, Debasish, and Kaushik Chakraborty. 2011. Evaluating Relationship of Working Capital and Profitability: A Study of Select Multinational Companies in the Indian Pharmaceutical Sector. The IUP Journal of Management Research: IJMR 10: 7. [Google Scholar]
  34. Tonidandel, Scott, Eden B. King, and Jose M. Cortina. 2018. Big Data Methods: Leveraging Modern Data Analytic Techniques to Build Organizational Science. Organizational Research Methods 21: 525–47. [Google Scholar] [CrossRef]
  35. Varum, Celeste Amorim, and Vera Catarina Rocha. 2013. Employment and SMEs during Crises. Small Business Economics 40: 9–25. [Google Scholar] [CrossRef]
  36. Vieira, Renato Schwambach. 2010. The Relationship between Liquidity and Profitability. An Exploratory Study of Airline Companies between 2005 and 2008. Unpublished Master’s thesis, Umeå University, Umeå, Sweden. Available online: http://www.diva-portal.org/smash/get/diva2:409560/FULLTEXT01.pdf (accessed on 7 December 2023).
  37. Wehrens, Ron. 2007. Self- and Super-organizing Maps in R: The Kohonen Package. JSS Journal of Statistical Software 21: 1–19. Available online: http://www.jstatsoft.org/ (accessed on 7 December 2023).
  38. Wehrens, Ron, and Kruisselbrink Johannes. 2023. Package ‘kohonen’ Title Supervised and Unsupervised Self-Organising Maps. Available online: https://cran.r-project.org/web/packages/kohonen/kohonen.pdf (accessed on 2 December 2023).
Figure 1. Kohonen’s map characteristics in 2019: (a) node weight vectors and node clusters; (b) node counts; (c) neighbor distance.
Ijfs 12 00016 g001
Figure 2. Kohonen’s map characteristics in 2020: (a) node weight vectors and node clusters; (b) node counts; (c) neighbor distance.
Ijfs 12 00016 g002
Figure 3. Kohonen’s map characteristics in 2021: (a) node weight vectors and node clusters; (b) node counts; (c) neighbor distance.
Ijfs 12 00016 g003
Figure 4. The high profitability—high liquidity relationship in the pre-crisis, during the crisis, and in the post-crisis periods.
Ijfs 12 00016 g004
Table 1. Average values of variables for nodes in 2019.
NodeNPMOROAROECURTRQRCROCFM
V10.910.54−0.033.354.245.391.03
V22.282.540.671.311.952.251.65
V31.641.230.53−0.06−0.26−0.321.00
V46.44−0.21−0.12−1.29−0.92−0.383.49
V50.17−0.10−0.263.082.091.040.12
V6−0.87−0.72−0.650.921.451.97−0.53
V70.781.280.390.910.710.050.16
V80.461.432.04−0.59−0.40−0.370.33
V9−0.34−0.36−0.310.480.740.16−0.25
V10−0.42−0.58−0.37−0.56−0.55−0.380.10
V11−0.46−0.55−0.30−0.47−0.52−0.41−1.19
V12−0.23−0.171.91−0.70−0.47−0.19−0.98
V13−1.65−2.47−5.31−0.90−0.72−0.42−0.44
V14−1.58−1.95−1.56−0.41−0.35−0.34−0.66
V15−0.37−0.35−0.22−0.39−0.19−0.182.75
V16−0.010.180.15−0.19−0.36−0.33−0.14
Table 2. Average values of variables for nodes in 2020.
NodeNPMOROAROECURTRQRCROCFM
V1−0.27−1.75−14.50−0.94−0.64−0.62−0.25
V2−0.77−3.44−1.40−0.67−0.46−0.44−0.23
V30.04−0.440.06−0.41−0.36−0.540.04
V4−0.03−1.190.01−0.51−0.44−0.360.04
V5−0.02−0.980.03−0.14−0.130.990.00
V60.06−0.300.06−0.12−0.050.350.18
V70.100.320.08−0.05−0.17−0.350.07
V80.06−0.050.09−0.58−0.50−0.470.05
V90.160.590.072.422.053.570.14
V100.05−0.310.050.780.720.12−0.06
V110.090.450.080.190.160.930.07
V120.151.210.15−0.39−0.28−0.360.18
V13−15.60−0.880.049.9411.52−0.63−15.73
V140.06−0.110.061.011.111.99−0.01
V150.151.060.090.790.55−0.060.12
V160.454.510.700.040.10−0.090.11
Table 3. Average values of variables for nodes in 2021.
NodeNPMOROAROECURTRQRCROCFM
V11.553.552.290.640.30−0.100.18
V20.681.240.510.19−0.04−0.34−0.15
V3−0.150.262.96−0.82−0.44−0.260.11
V4−0.110.080.75−0.68−0.53−0.390.08
V54.89−0.98−0.120.210.86−0.51−5.78
V63.060.27−0.060.070.22−0.171.23
V7−0.070.08−0.20−0.080.020.370.29
V80.12−0.49−0.06−0.70−0.37−0.392.51
V90.800.92−0.040.770.911.560.66
V10−0.15−0.32−0.561.080.720.17−0.20
V11−0.22−0.110.01−0.31−0.40−0.42−0.47
V12−0.52−0.81−0.66−0.67−0.60−0.34−0.08
V130.840.32−0.366.798.589.670.66
V140.290.08−0.502.752.672.740.06
V15−1.24−1.49−1.44−0.43−0.260.26−0.41
V16−2.59−1.66−1.60−0.29−0.08−0.283.74
Disclaimer/Publisher’s Note: The statements, opinions and data contained in all publications are solely those of the individual author(s) and contributor(s) and not of MDPI and/or the editor(s). MDPI and/or the editor(s) disclaim responsibility for any injury to people or property resulting from any ideas, methods, instructions or products referred to in the content.

