Article

Board Expertise Background and Firm Performance

Department of Accounting, Chaoyang University of Technology, 168 Jifong E. Road, Wufong District, Taichung City 41349, Taiwan
*
Author to whom correspondence should be addressed.
Int. J. Financial Stud. 2024, 12(1), 17; https://doi.org/10.3390/ijfs12010017
Submission received: 10 December 2023 / Revised: 7 February 2024 / Accepted: 10 February 2024 / Published: 14 February 2024

Abstract

:
This study presents a novel financial performance forecasting method that combines the threshold technique with Artificial Neural Networks (ANN). It applies the threshold regression method to identify the factors within the board of directors that influence the financial performance of traditional industries in Taiwan. The findings indicate that the ANN method effectively predicts financial performance by using relevant board structure data. Furthermore, the empirical results suggest that boards with more members demonstrate increased profitability. Additionally, a more significant presence of board members with accounting expertise contributes to more consistent profits. In contrast, an increased presence of members with financial expertise has a more pronounced impact on profitability.

1. Introduction

Traditional industries, including sectors such as metal machinery, the chemical industry, and subsistence industries, have played pivotal roles in Taiwan’s economic development, trade, and industrial evolution over the years. However, in recent years we have witnessed the emergence of economic powerhouses and the rapid progress of regional economic and trade partnerships like ASEAN, resulting in significant changes to the global economic and trade landscape. As a result, these industries are now operating within a new and highly competitive environment. In this era of rapid transformation, these industries must identify the essential factors that will enable them to maintain and enhance their positions on the international stage.
Investors seek to achieve multiple objectives through the election of a company’s board of directors. They aim to enhance corporate governance, safeguard the rights and interests of shareholders, and anticipate that the board will contribute expertise to improve the decision-making prowess of the board itself. Ultimately, this is expected to enhance the company’s overall performance. Consequently, whether the board of directors can positively impact corporate performance has remained a significant research focus in management and academia.
While many studies have explored the relationship between the board of directors’ characteristics and company performance, a notable need exists for more in-depth articles examining the professional backgrounds of the board members and CEOs and how their leadership qualities influence financial performance. This gap in research underscores the need for a more comprehensive understanding of the intricate dynamics between leadership, professional expertise, and corporate financial outcomes.
Over the past four decades, numerous studies have identified the common attributes of effective corporate boards. Board structure has consistently taken center stage in scholarly discussions among the myriad factors explored. The primary roles of a board of directors encompass leadership and decision-making. Board members hold a prominent position where they oversee the bigger picture, conduct macro-level analysis and assessments in line with the organization’s overarching vision, steer the general direction of the company, and guide the company’s proactive responses to societal shifts. The fundamental purpose of the board of directors is to govern the company, making it the backbone of the entire organization. Jensen and Zajac (2004) have contended that boards comprising highly educated members tend to be more amenable to embracing changes in a company’s structure or strategy. This receptivity arises from their ability to mitigate systemic risks associated with future changes, owing to their unique strategic perspectives, nimble problem-solving abilities, and in-depth comprehension of their respective businesses. Numerous studies, including those conducted by Hambrick and Mason (1984) and Kor and Sundaramurthy (2009), have reached a consensus that top management possessing specialized knowledge, particularly a deep understanding of the business and its operational intricacies, tends to lead to more effective business operations. Educational qualifications serve as a crucial indicator of knowledge, with degrees in finance, accounting, economics, research, and law being particularly relevant due to their extensive application in corporate governance.
Recent studies provide compelling evidence for the intricate link between board composition and performance. Amini and Zhang (2022) explored the impact of “industry-specific human capital” on board composition, demonstrating a positive correlation between relevant board member experience and firm risk management effectiveness. Similarly, Aguilera et al. (2021) highlight the importance of “functional expertise” on boards, finding that firms with directors possessing financial expertise exhibit superior financial performance, particularly during periods of economic downturn. Beyond expertise, the broader background of board members also plays a crucial role. A study by Francoeur et al. (2021) examined the impact of “boardroom gender diversity” on firm performance, revealing a positive association between diverse boards and higher return on assets (ROA) and return on equity (ROE). Likewise, Luo et al. (2020) investigated the effect of “board age diversity”, with results suggesting that a balanced age mix on boards can enhance firm innovation and performance, particularly in technology-intensive industries. However, the relationship between board makeup and performance remains nuanced. As Klein and Zurbrügg (2023) pointed out, the effectiveness of specific board characteristics hinges on various moderating factors, including firm size, industry context, and corporate governance practices. Moreover, boardroom dynamics, leadership, and information flow between the board and management play significant roles in translating individual expertise and diverse backgrounds into tangible performance gains.
This paper emphasizes the critical role of board composition in organizational success. Business managers are advised to recruit board members with diverse expertise in accounting and finance to enhance decision-making and financial oversight. They should carefully evaluate board size to balance diverse perspectives with efficient communication. Additionally, managers must monitor for unethical profit management practices, leveraging predictive analytics for strategic insights. Contextualizing their findings within their specific industry and organizational context is crucial for effective implementation and sustained growth.
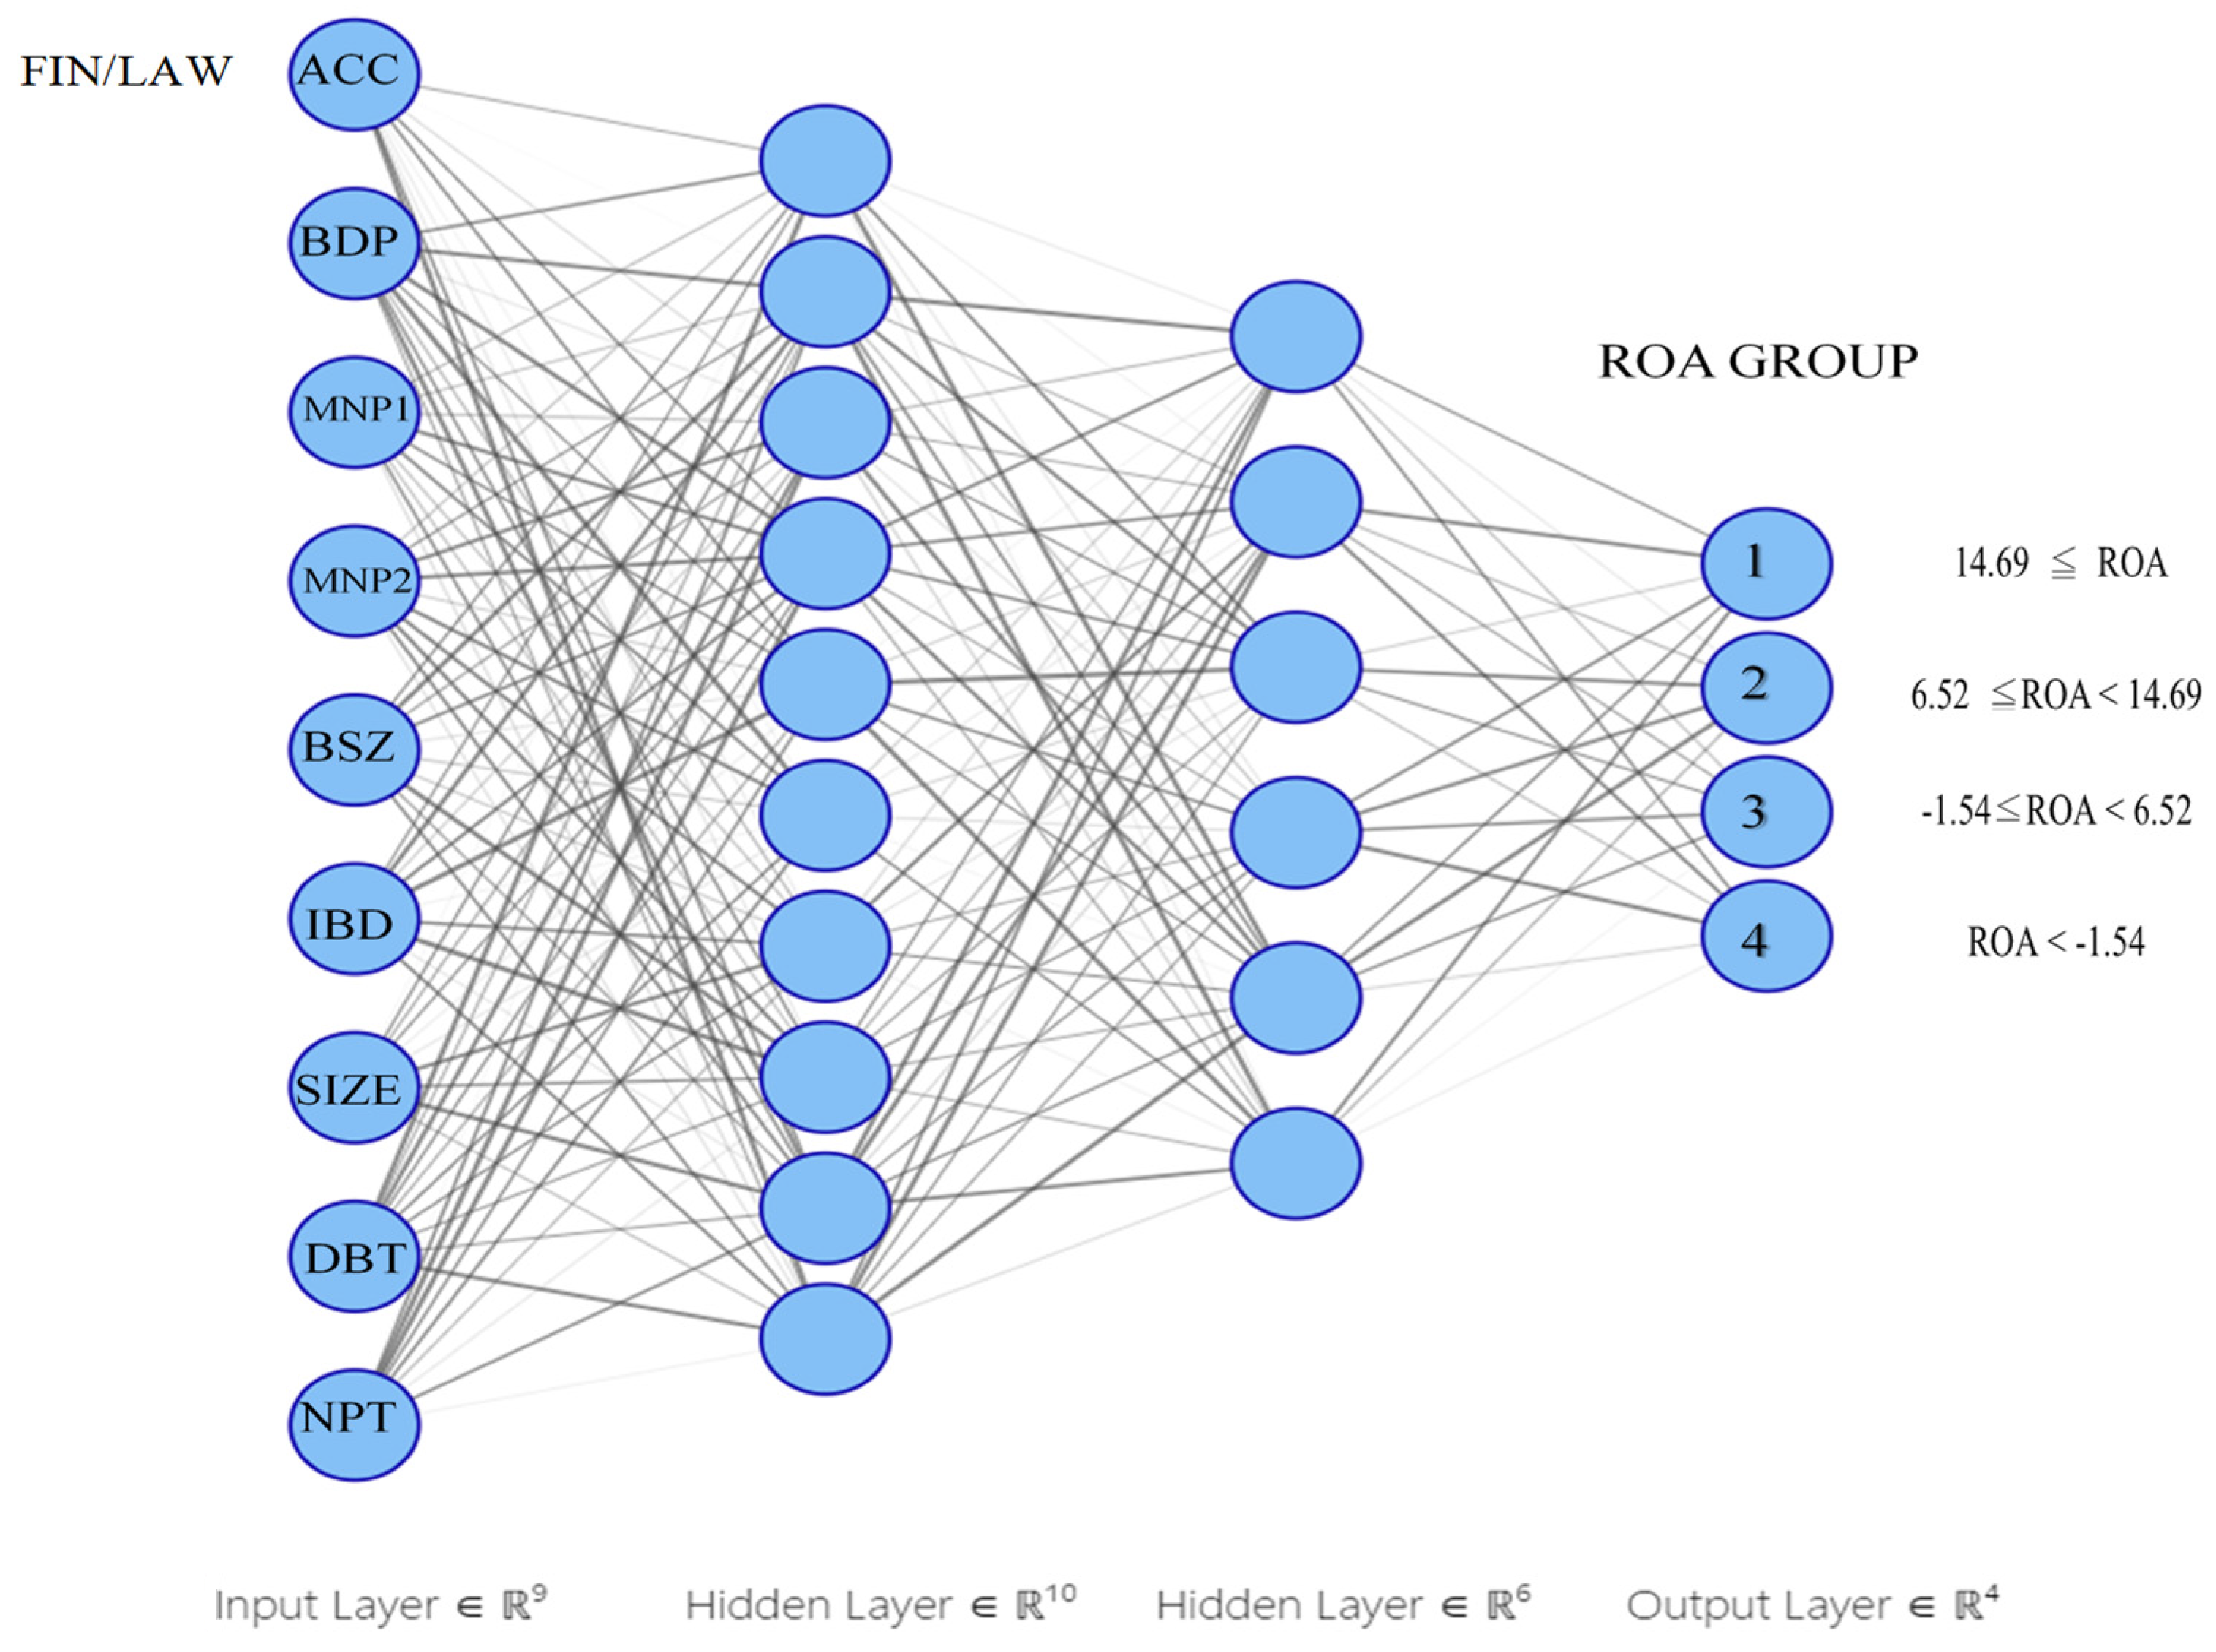
In pursuing this investigation, this paper has harnessed a vast dataset comprising 5309 observations across 331 companies, spanning from 2000 to 2021, as its research foundation. The employed methodology centers on applying the threshold analysis technique to unveil the influence of board characteristics on business performance, focusing on identifying overarching trends regarding Return on Assets (ROA). These findings subsequently serve as the bedrock for developing an Artificial Neural Network (ANN) tailored for forecasting financial performance. Compared to existing research, this paper sets itself apart through its innovative approach, offering a novel research model within this domain.
This paper represents one of the pioneering attempts to meld the ANN model with the multi-threshold technique to predict a firm’s ROA based on the attributes of its board of directors. The research outcomes reveal that a board of directors boasting a more significant number of members with accounting qualifications contributes to a consistent and stable increase in ROA. Conversely, an augmented presence of members with financial expertise yields a more pronounced yet less stable impact on ROA. Moreover, members with legal expertise appear to exert no significant favorable influence on ROA. Furthermore, directors holding more company shares exhibit the capacity to enhance ROA, but this effect materializes only when ROA surpasses the threshold of 14.96%. Additionally, when considering the factor of simultaneously serving on the board of directors, the positive effect becomes more prominent. In essence, directors who are actively engaged in managing and participating in the company’s decision-making processes exhibit a heightened ability to bolster profitability.

2. Related Literature

Fueled by market growth and increasing complexity, the ever-expanding business landscape presents firms with a critical challenge: securing essential resources for survival and success. Resource Dependence Theory (RDT) offers a powerful lens through which to examine this dynamic, highlighting how organizations rely on external resources and how this dependence shapes their actions and, ultimately, their performance. Within this framework, boards of directors emerge as critical players tasked with strategically acquiring and managing these resources.
RDT emphasizes the significance of board expertise in building bridges to critical resources. Boards with members possessing relevant industry experience, financial literacy, and functional expertise are better equipped to attract investments, partnerships, and talent (Krishnan and Santos 2008; Rynes et al. 2007). This expertise empowers them to assess opportunities, build trust with external stakeholders, and navigate complex resource dependencies effectively. By leveraging their knowledge and networks, they can unlock doors to critical resources that drive firm growth and competitiveness.
However, RDT goes beyond mere expertise, recognizing the value of board diversity in accessing a more comprehensive range of resources. The educational backgrounds, professional affiliations, and past experiences of board members bring unique perspectives and networks to the table (Boone and Lüdema 2018). This diversity fosters innovation, enhances problem-solving, and opens doors to previously untapped resources, ultimately enriching the firm’s resource portfolio. By embracing diversity, boards gain access to a broader spectrum of knowledge, connections, and experiences, allowing them to identify and secure resources that may have been overlooked with a more homogenous composition.
RDT acknowledges that resource dependence is not without its nuances. While larger boards offer the potential for broader expertise and diverse perspectives, concerns about communication complexity and efficiency can arise (Adams and Ferreira 2007). Similarly, attracting highly qualified board members might involve increased compensation, necessitating a careful cost-benefit analysis. Additionally, the effectiveness of board composition hinges on factors like firm size, industry context, and internal governance practices (Hambrick 2005). Recognizing these trade-offs and moderating factors is crucial for optimizing board composition and ensuring that resource acquisition efforts translate into tangible benefits for the firm.
Emerging research continues to solidify the link between board composition and resource acquisition, consequently impacting performance. Amini and Zhang (2022) found a positive correlation between industry-specific board experience and risk management effectiveness, highlighting the role of expertise in securing critical resources. Similarly, Aguilera et al. (2021) demonstrated that firms with financially literate boards exhibited superior financial performance, suggesting access to capital as a potential benefit. These findings, alongside others exploring the positive impact of board diversity (Francoeur et al. 2021; Luo et al. 2020), showcase the increasingly recognized role of board composition in resource acquisition and firm success.
By adopting an RDT perspective, we understand how boards navigate resource dependencies and influence firm performance. Recognizing the interplay between expertise, diversity, and moderating factors is crucial for optimizing board composition and securing the resources that drive sustainable success in our ever-evolving business landscape.
In the realm of corporate governance research, the common thread is the measurement of business performance (Hakim and Liu 2021; Li and Patel 2019). This focus stems from businesses’ fundamental goal, profit generation, and the paramount importance of safeguarding shareholders’ rights and interests. Additionally, discussions about the impact of corporate governance extend to areas such as earnings management (Warfield et al. 1995; Klein 2002; Chang et al. 2007), earnings forecast errors (Hlel et al. 2020), and the influence of accountants issuing going concern opinions (DeFond et al. 2002; Wu et al. 2011). Amidst this, corporate governance is bifurcated into internal and external governance, with the board of directors serving as the core of internal governance. Consequently, when exploring the supervisory mechanisms of corporate governance, the board of directors’ soundness, composition, and characteristics emerge as standard independent variables.
The educational background of board members imparts diverse perspectives and mindsets regarding the company’s ultimate goals, which can significantly influence its performance and purpose. Educational backgrounds offer nuanced insights into an individual’s values and preferences, influenced by variations in educational programs (Hambrick and Mason 1984). The educational diversity among board members is linked to the financial performance of companies, with a stronger positive relationship observed for firms with higher levels of internationalization (Carpenter 2002). Additionally, women and directors with accounting backgrounds tend to enhance compassion and reciprocity in CSR decision-making, especially in companies with larger boards (Nguyen and Huang 2020).
The board plays a pivotal role in mitigating agency problems, and the effectiveness of this role is closely linked to its composition (Fama and Jensen 1983). Typically, the board of directors comprises internal and external directors. Since 2002, Taiwan has mandated that newly established companies must have at least two independent directors on their boards. This move aims to bring impartial and objective professionals into managerial roles, thus enhancing the quality and efficiency of board decision-making. However, concerns exist about performance evaluation’s supervisory function and objectivity when internal directors are involved in a company (Weisbach 1988). Additionally, unfamiliarity with the company may lead to increased communication costs for the board (Pucheta-Martínez and Gallego-Álvarez 2020).
In recent years, directors’ characteristics have become a new focus in board characteristics, including gender, expertise, education level, industrial background, and experience. Researchers have shown that senior managers’ specific skills can enhance business operations from the social capital perspective, and gender diversity on boards can enhance corporate value (Kor and Sundaramurthy 2009; Kim and Starks 2016). Higher levels of education, professional knowledge, generalist skills, and experience among board members are associated with improved firm performance (Jensen and Zajac 2004; Hakim and Liu 2021). Furthermore, industry experience among directors is linked to enterprise value, and experiences from upstream and downstream industries can bring benefits in terms of information and industry expertise, potentially outweighing any concerns about conflicts of interest (Dass et al. 2014). Finally, directors from the same geographical area as the company may have stronger local connections due to their understanding of the local business environment, which can significantly impact the company’s value (Sun 2021).
Various factors likely moderate the impact of board expertise and background. Board size, composition (independence, diversity), and internal firm environment (culture, leadership structure) can influence how effectively their expertise is utilized (Adams and Ferreira 2007; Hambrick 2005).
Based on the reviewed literature, we propose the following hypotheses:
Larger boards offer the potential for broader expertise and diverse perspectives, which may lead to improved decision-making and firm performance. However, concerns exist about communication complexity and potentially reduced efficiency in larger boards.
Hypothesis 1.
Boards with a higher number of members demonstrate increased profitability.
Accounting expertise equips board members to understand financial information better, assess risk, and monitor management financial decisions, potentially leading to more consistent and stable profitability.
Hypothesis 2.
A more significant presence of board members with accounting expertise contributes to more consistent profits.
Given the financial nature of a firm’s performance, financial expertise may positively influence profitability compared to other types of expertise.
Hypothesis 3.
An increased presence of members with financial expertise has a more pronounced impact on profitability than expertise in other domains.
This study is motivated by the pressing need to comprehensively address gaps in the existing research, explore the potential insights advanced methodologies can yield, and investigate the evolving economic landscape that demands a deeper understanding of the dynamics within boardrooms. Through these efforts, it aims to contribute knowledge that can inform both academia and industry, ultimately enhancing the grasp of the critical factors shaping corporate financial outcomes.

3. Research Methodology

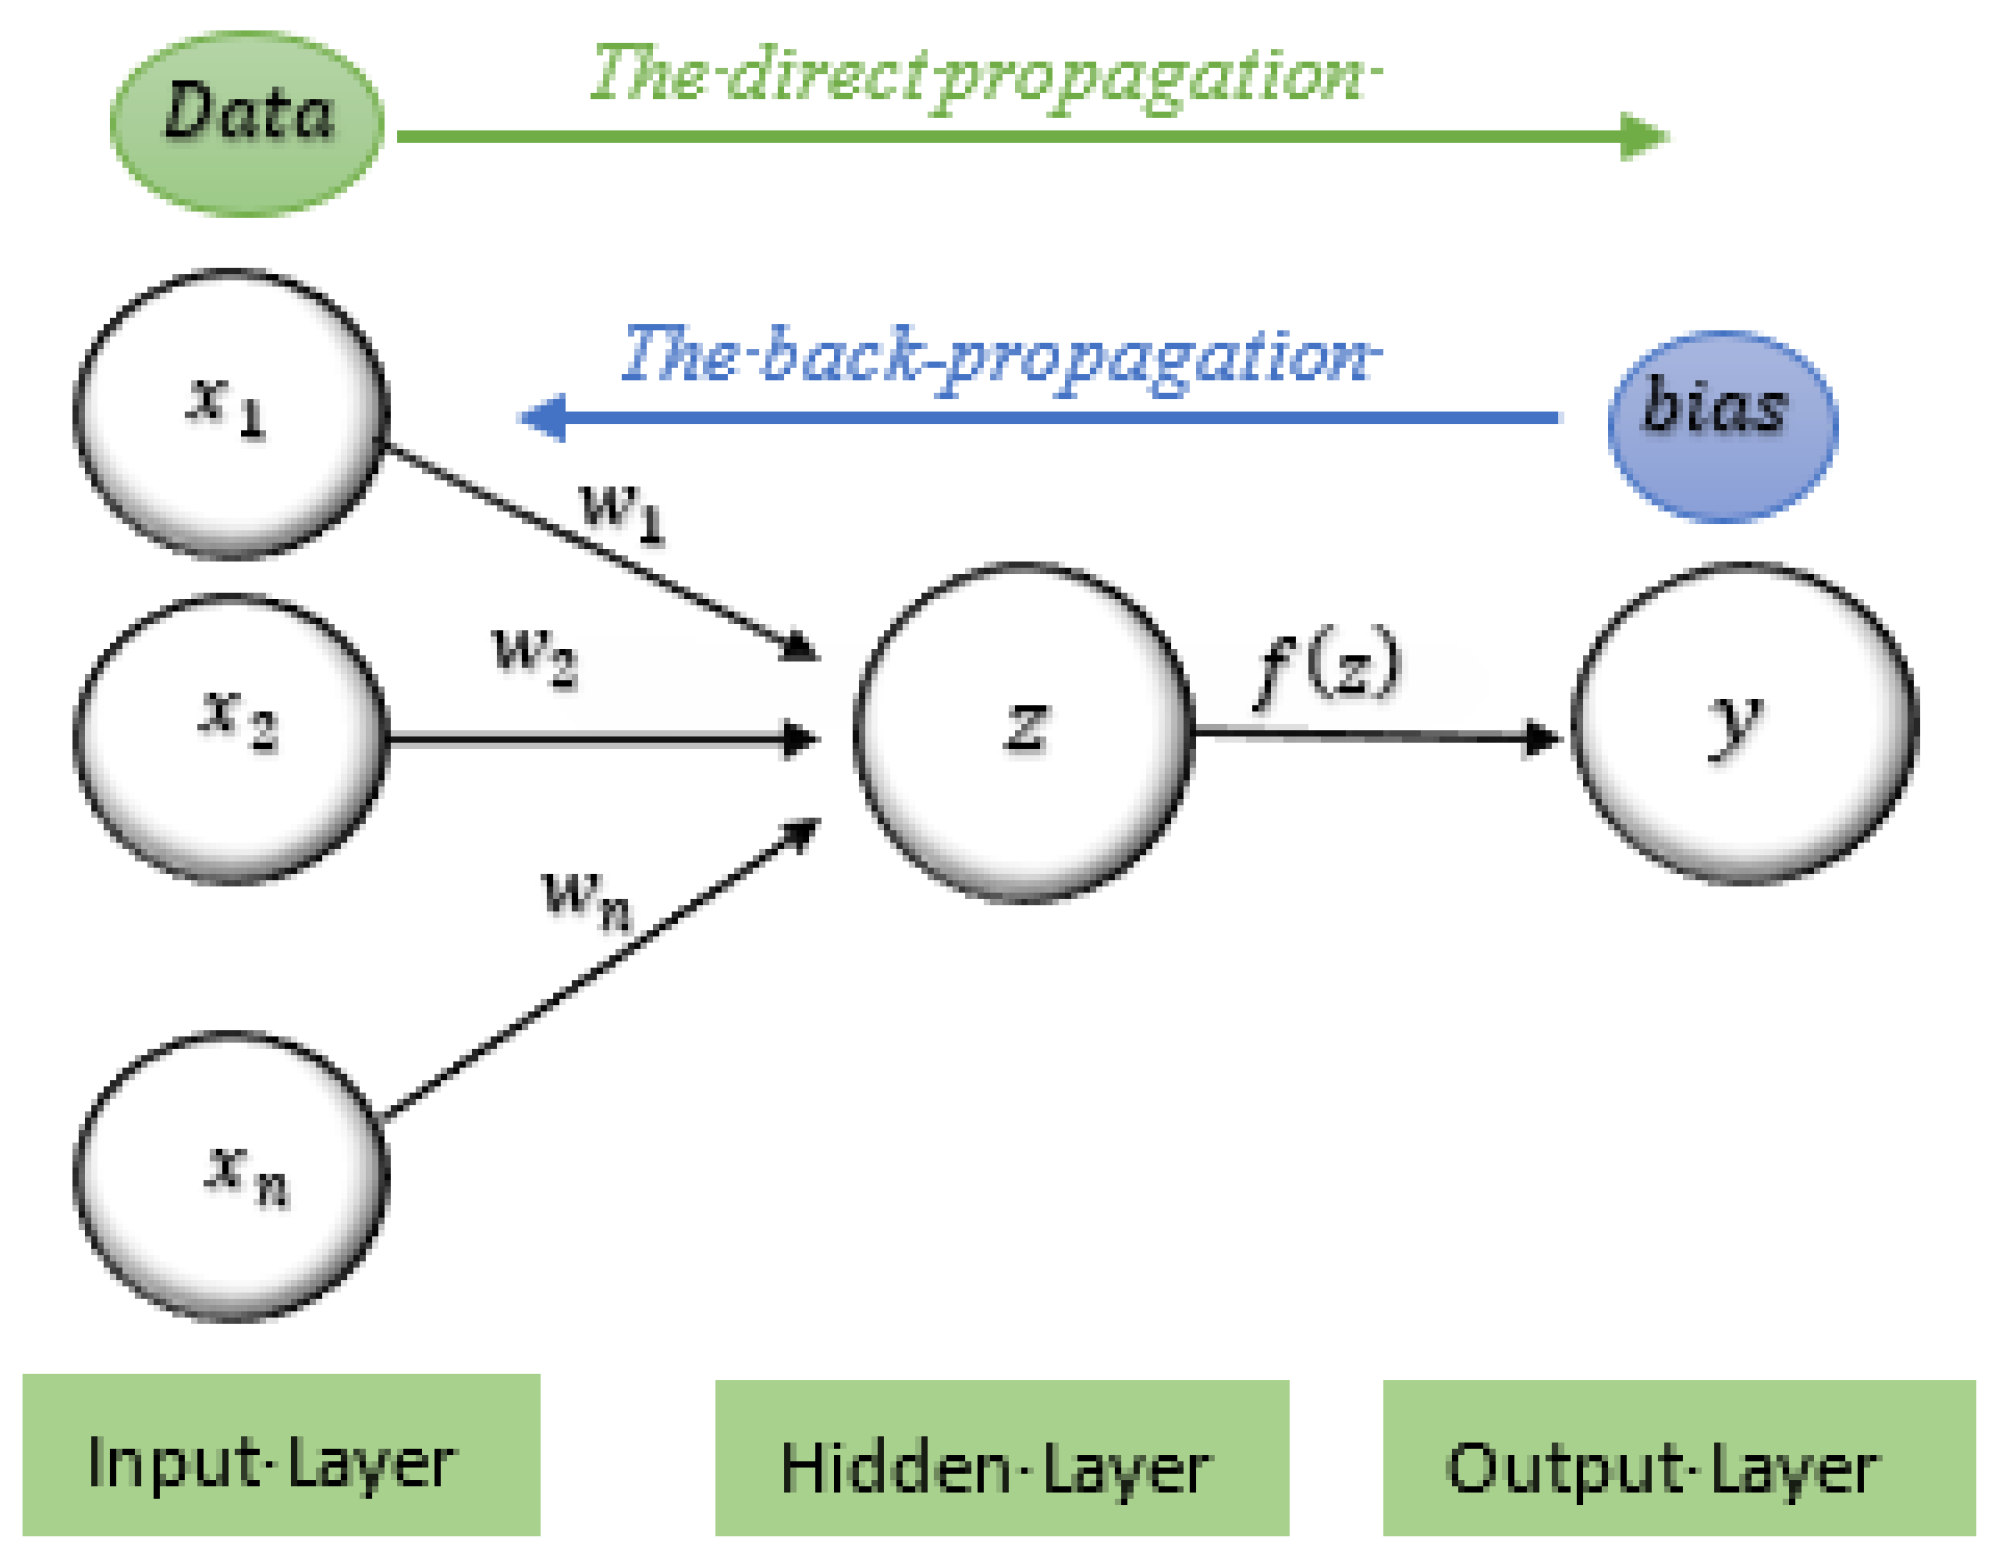
The ANN architecture is derived from the idea of simulating the human brain. Like humans, ANNs learn by experience, saving and using those experiences in the right situations. An ANN usually organizes neurons into layers, each responsible for a specific task. An ANN usually has three layers, an input layer, a hidden layer, and an output layer: (1) The input layer provides the network with the necessary data. The number of neurons in the input layer corresponds to the number of input parameters given to the network, and these input parameters are assumed to be in vector form. (2) The hidden layer contains hidden neurons that connect input values to output values. A neural network may have one or more hidden layers primarily responsible for processing the neurons of the input layer and delivering information to the neurons of the output layer. These neurons are suitable for classifying and identifying the relationship between input parameters and output parameters. (3) The output layer contains output neurons which transfer the output information of computations from the ANN to the user. An ANN can be built to have multiple output parameters. The problem will decide the number of neurons in the input layer, the output layer, and the number of hidden layer neurons; the input will decide the number of hidden layers. However, choosing the type and quantity of input parameters has a class effect on the quality of the network. The mathematical model of a straight-propagation ANN is presented as follows:
y x = f i = 1 n w i x i
where y(x) is the output value according to the variable x; f is the activation or transfer function; wi is the link weight of neuron xi; xi is the input value. Figure 1 explains the nature of the operating principle of a direct propagation ANN for the network’s training. Specifically, the training process often uses a back-propagation algorithm to find the derivative for each parameter in the network.
The straight propagation phase consists of six steps, as follows:
The input parameter vector is input to the neurons in the input layer:
a ( 0 ) = x
At the jth hidden layer neuron, the value of the signal received from the input layer is summed up as the weighted ( w 1 , w 2 …,   w n ) sum of all the input data by adding all the products of each input data and the association weights (z) between the hidden layers and input class. b is the bias coefficient.
z i n j = b o j + i = 1 n x i w i j
Then, the activation function (transfer function) will be used to convert the received value into the output value.
z j = f ( z i n j )
Next, the output value at the hidden layer neuron j continues to be transmitted to the output neuron k in the same way as from the input layer to the hidden layer.
y i n k = e o k + j = 1 p z j v j k
Then, the transfer function is used to compute the output value of the neuron at the output layer.
y k = f ( y i n k )
The direct propagation phase ends, and the network will move to the back-propagation phase.
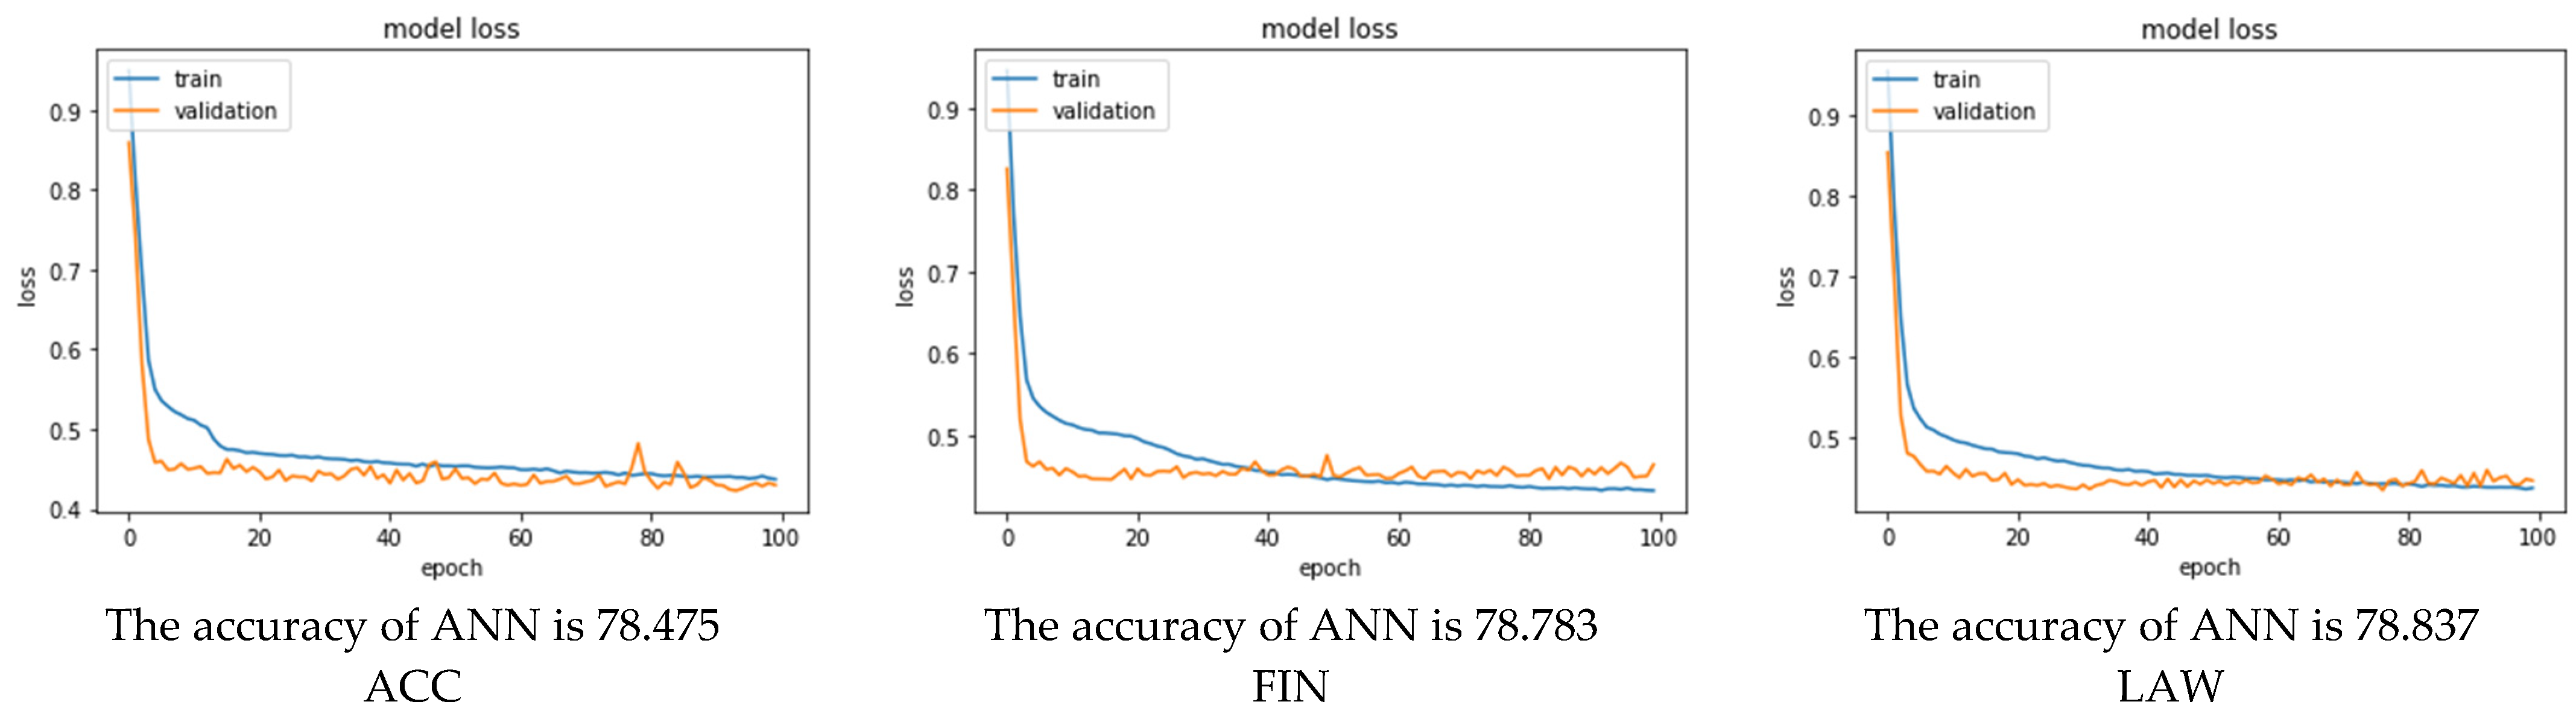
During the input phase, the input data includes input and actual values. Following this, for each data set, each corresponding output error is calculated. This value is called the loss function (Cost Function—J).
J = t k y k
From the cost function just found, we calculate the derivative of this function according to the weight ( v 1 , v 2 …, v n ) between the hidden layer—the output layer, and the weight between the input layer—the hidden layer.
w i j = J w i j
v j k = J v j k
Next, the association weight value between the hidden layer and the output layer and the link weight value between the input layer and the hidden layer are adjusted simultaneously.
w i j n e w = w i j o l d + α w i j
v j k n e w = v j k o l d + α v j k
While ANN has a well-established presence in financial modeling, our study’s originality lies in its unique combination of an ANN and multi-threshold analysis within the specific domain of corporate governance and financial performance prediction.

4. The Data and Empirical Results

4.1. Data

This study utilizes relevant data comprising 5309 observations of the boards of directors from 331 companies spanning the period from 2000 to 2021 as its research sample. These companies belong to Taiwan’s traditional industries and are listed on the Taiwan Stock Exchange. The data are sourced from the Taiwan Economic Journal (TEJ). After excluding non-available values, 5309 observations are used to (i) detect significant threshold values for financial performance, (ii) present the factors influencing financial performance, and (iii) construct an Artificial Neural Network (ANN) model for predicting financial performance.
The choice of Taiwan and traditional industries as the study’s focus is motivated by the unique economic context, the historical significance of these industries, the diverse challenges they encounter, and the potential policy implications. This selection enables a comprehensive and context-rich exploration of the relationship between board characteristics and financial performance in an evolving economic landscape.
This study delves into the connection between board member characteristics and financial performance, explicitly emphasizing individual education and majors (including accounting, finance, and law) as variables for measuring directors’ strengths. It also considers factors such as the management level’s shareholding ratio, the size of the board of directors, and the number of external directors and supervisors to predict the financial performance of Taiwan’s traditional industries using an ANN model.
Table 1 summarizes the estimation and definition of variables in the empirical model, including financial performance (ROA), the professional background of the board directors (ACC, FIN, LAW), board of directors and managers (BDP, MNP1, MNP2, BSZ, IBD), and control variables (SIZE, DBT, NPT).
Table 2 provides an overview of the main statistical parameters of the data used in the study. The mean and median values of ROA are 6.52 and 6.08, respectively, indicating that ROA is reasonably consistent across enterprises, except for instances with a maximum value of 63.3 and a minimum value of −53.12. The mean of accounting expertise (ACC) among the board of directors is 7%, higher than that of finance (FIN) and law (LAW) at 3%. There is a noticeable variation in board power (BDP) among companies, with a standard deviation of 14.84%. The mean values of MNP1 and MNP2 are 1.14 and 4.93, respectively, indicating a relatively high proportion of directors concurrently serving as board members.
Table 3 analyzes the correlations between variables. The relationship between ROA and ACC exhibits a notably positive association, while the relationship between ROA and FIN shows the opposite direction. The association between ROA and LAW is not as significant. Multicollinearity, a situation where two or more predictors are highly linearly related, is assessed in this study. All absolute correlation coefficients are less than 0.6, indicating the absence of multicollinearity.
This study primarily focuses on the impact of board member professionalism on ROA. Figure 2 presents ROA, ACC, FIN, and LAW scatter plots.

4.2. Empirical Results

4.2.1. Testing for the Threshold Model

This study uses a threshold regression model to investigate the influence of the board of directors’ professional background on corporate profitability. According to Hansen (1999, 2000), the threshold regression model is built based on the data pool set. The regression is as follows:
R O A i , t = C + δ 1 R O A i , t j = 0 m Ψ j Φ i t ; τ + β 1 A C C i , t + β 2 F I N i , t + β 3 L A W i , t + β 4 B D P i , t + β 5 M N P 1 i , t + β 6 M N P 2 i , t + β 7 B S Z i , t + β 8 I B D i , t + β 9 S I Z E i , t + β 10 D B T i , t + β 11 N P T i , t + ε i , t
This study uses the OLS method to estimate the threshold regression model threshold. It uses the Bootstrap method to simulate the LRT test with asymptotic distribution to calculate the F-statistics and p-values of the variables to test for the existence of thresholds of the model. Each test is performed using a bootstrap of 1000 iterations. Table 4 presents the results of testing for threshold values in the Return on Assets (ROA) variable using the Bai–Perron methodology. This analysis aims to identify critical points in ROA where significant changes or shifts in a company’s financial performance occur. These threshold values help to distinguish different regimes or states in the behavior of the ROA. Identifying thresholds in financial data can have important implications for understanding the dynamics of a company’s financial performance, making it a valuable aspect of statistical analysis.
The results analyzed above show that the impact under these thresholds exists in the sample data set under consideration. The estimated values for the three thresholds are shown in Table 4: 14.69%, 6.52%, and −1.54%, respectively. These three threshold values divide the sample set into four groups based on whether the value of the return on asset ratio (ROA) variable is less than or greater than the threshold estimates. Thus, the sample data are divided into four groups with ROA in the range ROA < −1.54, −1.54 ≤ ROA < 6.52, 6.52 ≤ ROA < 14.69, and 14.69 ≤ ROA.

4.2.2. Empirical Results

The model automatically segments the data into four groups for regression analysis based on detecting three thresholds. The outcomes of this process are presented in Table 5. Board members with accounting expertise exhibit a positive influence, particularly in the group where −1.54 ≤ ROA < 14.69, prominently in the 6.52 ≤ ROA < 14.69 range.
Conversely, board members with financial expertise demonstrate a clear positive impact on ROA when ROA is either below −1.54 or exceeds 14.69. On the other hand, board members with legal expertise predominantly have a detrimental effect on ROA, with the most significant impact observed when ROA is below −1.54%.
Board size (BDS) generally contributes positively to ROA, particularly in Groups 2 and 3. The positive influence of MNP1 on ROA is exclusively notable in Group 4. Meanwhile, the positive impact of MNP2 is observed across all groups and is especially significant when the ROA is less than 6.52.
The correlation between MNP1 and a positive effect on ROA is exclusive to Group 4, whereas MNP2 exhibits a positive influence across all groups, with heightened significance when ROA is below 6.52. A larger board size (BSZ) corresponds to a higher ROA. Conversely, a higher proportion of independent board members (IBD) correlates with a lower ROA, indicating that independent board members may still need to exert their control in this regard. It is worth noting that a larger company size (SIZE) does not necessarily lead to higher ROA, however, this is true when the debt (DBT) level is low.
In Group 1, where ROA values are higher (positive), if the coefficient for “board members with financial expertise” is positive, it implies that an increase in the presence of such board members is associated with a higher ROA, which is typically expected. In Group 4, where ROA values are lower (negative), if the coefficient for “board members with financial expertise” is negative (when interpreted inversely), it implies that an increase in the presence of such board members is associated with an even lower (more negative) ROA, suggesting that, in Group 4, board members with financial expertise may have a detrimental effect on ROA.
Group 3 poses a challenge because it encompasses a wide range of ROA values, including negative and positive ones. The coefficients for independent variables in Group 3 should be interpreted cautiously due to this mixed range of ROA values. The interpretation may vary depending on this group’s specific values of ROA. When interpreting these coefficients, it is essential to consider the context and the actual data points.
The multifaceted impact of board members with financial and legal expertise on ROA underscores the importance of considering industry dynamics, economic conditions, and company-specific factors when interpreting these associations within different ROA groups. The interplay of these factors contributes to the complexity of understanding how board expertise influences a company’s financial performance.
The problem requires predicting ROA from the board and accounting data, so the input layer contains the relevant values collected, and the output layer contains the ROA value from the network. Then, proceed with building a network or choosing a network structure by choosing the number of layers and the number of hidden neurons in each layer for the network.
Typically, an Artificial Neural Network (ANN) design starts with a single hidden layer. The number of neurons in this hidden layer is gradually adjusted until the network’s output error reaches an acceptable level and the desired output value is achieved. A second hidden layer is introduced if the number of neurons is too large (exceeding 50) and the error remains unacceptable. This iterative process continues until the desired error rate and output accuracy are attained. In this study, we constructed a neural network with two hidden layers, each containing ten and six neurons, respectively. Figure 3 illustrates the architecture of the ANN used for predicting the ROA.
With the network structure selected, we proceed to the training step of the network. In essence, training the network is the process of adjusting the weights. These link weight values default to random at the beginning of network construction, then, during network training, the network algorithms adjust the above values.
Performance graph observation through network construction is used to evaluate the network and consider overfitting. The mean square error (MSE) is displayed at the loop location (Epoch) for the best efficiency of network construction.
Figure 4 depicts the error of the ANN model, showing that the predictive accuracy of the ROA of the model, including ACC, FIN, and LAW, is 78.475%, 78.783%, and 78.837%, respectively, compared with the actual data.
When the board of directors has more members with accounting qualifications, it will help to steadily increase the ROA value. In contrast, more members with financial expertise have a more extreme influence, which is not a stable contributor to ROA. Moreover, members with legal expertise do not have any significant positive influence. Directors holding more company shares can increase the ROA value only when the ROA is more excellent than 14.96%. However, the positive effect is more pronounced when considering the element of managers serving concurrently on the board of directors. Thus, the directors promote improving profits when managing and participating in the company’s business decisions.
The larger the number of board members, the higher the ROA, however, the opposite is true with more independent board members. This result shows that independent members need to promote more of their obligations to control the activities of the companies. The company’s total assets only partially have a positive effect on ROA, especially for companies with a high ROA. At the same time, the debt ratio is purely the minus of ROA.
In the context of corporate governance and the impact of board characteristics on financial performance, this statement is not universally supported by theory alone. The relationship between the educational diversity of board members and financial performance is complex and multifaceted, and it can vary depending on various factors and contexts. Therefore, it is essential for empirical research, like the study mentioned in the question, to investigate and provide empirical evidence on the relationship between the educational diversity of board members and financial performance within a specific context or dataset. Empirical research can help validate or refute the theoretical notions and provide insights into the practical implications of board diversity for financial outcomes in real-world scenarios.

5. Conclusions

The research results show that, for companies in traditional industries that are listed on the Taiwanese stock market, the composition of the board of directors impacts the business’s financial performance.
Boards with more members may have a greater capacity for overseeing corporate governance. A greater representation of board members with accounting expertise tends to lead to more consistent corporate profits, whereas an increased presence of members with financial expertise results in more pronounced profit fluctuations. Additionally, in the case of companies with lower profits, managers may face pressure from loan contracts or receive limited attention from investors, potentially leading to heightened practices related to profit management. Managers may aim to maximize their benefits. At this time, the return on assets is high, and the managers obtain the expected benefits. Thus, to restrain the profit management behavior of managers, enterprises need to have a broader view and have specific judgments and analyses in each enterprise to build organizational structure and procedures. The operation of the board of directors is more effective because of the industry’s characteristics, the enterprise’s size, the capital structure, and the performance of the enterprise. Finally, this study used deep learning and big data techniques to build an Artificial Neural Network (ANN) model that specializes in predicting the ROA of companies based on most factors related to board structure, with a prediction accuracy of over 78%.
While the research confirms a link between board composition and financial performance in traditional Taiwanese companies, the impact of specific expertise reveals intriguing nuances. Larger boards, per Hypothesis 1, might enhance decision-making capacity due to broader expertise, but communication challenges remain a concern. Hypothesis 2 is validated, as board members with accounting expertise promote stable profits through better financial oversight. Interestingly, Hypothesis 3’s predicted substantial impact of financial expertise was found to likely lead to profit fluctuations, suggesting a focus on aggressive, short-term gains over long-term stability. This paper delves further, highlighting potential profit management practices in low-profit companies due to external pressure, emphasizing the need for closer monitoring. Notably, it introduces an Artificial Neural Network model capable of predicting a company’s return on assets with impressive accuracy based on board structure factors. In conclusion, this research offers valuable insights by analyzing how different expertise and factors like board size impact performance, aiding companies in optimizing their board composition for informed decision-making and sustainable success.

Author Contributions

Conceptualization, C.-Y.L. and B.T.-T.-N.; methodology, B.T.-T.-N.; software, B.T.-T.-N.; validation, C.-Y.L., C.-R.W. and B.T.-T.-N.; formal analysis, C.-Y.L., C.-R.W. and B.T.-T.-N.; data curation, C.-R.W.; writing—original draft preparation, C.-Y.L., C.-R.W. and B.T.-T.-N.; writing—review and editing, C.-Y.L., C.-R.W. and B.T.-T.-N.; visualization, B.T.-T.-N.; supervision, C.-Y.L. All authors have read and agreed to the published version of the manuscript.

Funding

This research received no external funding.

Informed Consent Statement

Not applicable.

Data Availability Statement

The data are sourced from the Taiwan Economic Journal (TEJ). After excluding non-available values, 5309 observations are used.

Conflicts of Interest

The authors declare no conflict of interest.

References

  1. Adams, Renée D., and Daniel Ferreira. 2007. Board size and composition: A comparison of U.S. and U.K. listed firms. Journal of Financial Economics 85: 781–821. [Google Scholar]
  2. Aguilera, Ruth V., Alvaro Cuervo-Cazurra, and Francesco Perrini. 2021. Board functional expertise and firm financial performance: The moderating role of economic downturns. Strategic Management Journal 42: 206–34. [Google Scholar]
  3. Amini, Mohammad, and Fang Zhang. 2022. Industry-specific human capital and board oversight: Evidence from risk management effectiveness. Journal of Accounting and Economics 119: 101445. [Google Scholar]
  4. Bai, Jushan, and Pierre Perron. 2003. Computation and analysis of multiple structural change models. Journal of Applied Econometrics 18: 1–22. [Google Scholar] [CrossRef]
  5. Boone, Linda E., and Maaike A. Lüdema. 2018. Boardroom diversity: Why do the board directors’ gender and professional qualifications matter? Review of Business and Economic Literature 63: 349–89. [Google Scholar]
  6. Carpenter, Mason A. 2002. The implications of strategy and social context for the relationship between top management team heterogeneity and firm performance. Strategic Management Journal 23: 275–84. [Google Scholar] [CrossRef]
  7. Chang, Ruey-Dang, Chin-Jung Fang, and Yi-Cheng Tseng. 2007. Central agency problem and earnings management: An investigation of board structure and external monitoring mechanism. Journal of Management 24: 17–39. [Google Scholar]
  8. Dass, Nishant, Omesh Kini, Vikram Nanda, Bunyamin Onal, and Jun Wang. 2014. Board expertise: Do directors from related industries help bridge the information gap? The Review of Financial Studies 27: 1533–92. [Google Scholar] [CrossRef]
  9. DeFond, Mark L., K. Raghunandan, and K. R. Subramanyam. 2002. Do non–audit service fees impair auditor independence? Evidence from going concern audit opinions. Journal of Accounting Research 40: 1247–74. [Google Scholar] [CrossRef]
  10. Fama, Eugene F., and Michael C. Jensen. 1983. Separation of ownership and control. The Journal of Law and Economics 26: 301–25. [Google Scholar] [CrossRef]
  11. Francoeur, Claude, D. Lafond, and Marc Roy. 2021. Boardroom gender diversity and firm performance: A meta-analysis. Academy of Management Journal 64: 431–61. [Google Scholar]
  12. Hakim, Muhammad Saiful, and Chih Liang Liu. 2021. Generalist or Specialist? The Skill of CEO and Director That Really Matter to Firm Performance. Modern Economy 12: 1768–81. [Google Scholar] [CrossRef]
  13. Hambrick, D. C. 2005. Just How Much Does the CEO Matter? Harvard Business Review 83: 92–99. [Google Scholar]
  14. Hambrick, Donald C., and Phyllis A. Mason. 1984. Upper echelons: The organization as a reflection of its top managers. Academy of Management Review 9: 193–206. [Google Scholar] [CrossRef]
  15. Hansen, Bruce E. 1999. Threshold effects in non-dynamic panels: Estimation, testing, and inference. Journal of Econometrics 93: 345–68. [Google Scholar] [CrossRef]
  16. Hansen, Bruce E. 2000. Sample splitting and threshold estimation. Econometrica 68: 575–603. [Google Scholar] [CrossRef]
  17. Hlel, Khawla, Ines Kahloul, and Houssam Bouzgarrou. 2020. IFRS adoption, corporate governance and management earnings forecasts. Journal of Financial Reporting and Accounting 18: 325–42. [Google Scholar] [CrossRef]
  18. Jensen, Michael, and Edward J. Zajac. 2004. Corporate elites and corporate strategy: How demographic preferences and structural position shape the scope of the firm. Strategic Management Journal 25: 507–24. [Google Scholar] [CrossRef]
  19. Kim, Daehyun, and Laura T. Starks. 2016. Gender diversity on corporate boards: Do women contribute unique skills? American Economic Review 106: 267–71. [Google Scholar] [CrossRef]
  20. Klein, April. 2002. Audit committee, board of director characteristics, and earnings management. Journal of Accounting and Economics 33: 375–400. [Google Scholar] [CrossRef]
  21. Klein, Peter, and Philipp Zurbrügg. 2023. The contingent effects of board expertise and diversity on firm performance: A meta-analysis and review. Journal of Management Studies 60: 34–82. [Google Scholar]
  22. Kor, Yasemin Y., and Chamu Sundaramurthy. 2009. Experience-based human capital and social capital of outside directors. Journal of Management 35: 981–1006. [Google Scholar] [CrossRef]
  23. Krishnan, Ravi, and Fernando Martin Santos. 2008. Board composition and the acquisition of complementary knowledge: A theoretical and empirical exploration. Strategic Management Journal 29: 867–88. [Google Scholar]
  24. Li, Mingxiang, and Pankaj C. Patel. 2019. Jack of all, master of all? CEO generalist experience and firm performance. The Leadership Quarterly 30: 320–34. [Google Scholar] [CrossRef]
  25. Luo, Xin, Ming Yu, and Min Yan. 2020. Board age diversity and firm innovation: The moderating role of industry technological intensity. Journal of Business Research 116: 401–12. [Google Scholar]
  26. Nguyen, T. Thanh Binh, and Qi-Wen Huang. 2020. Impact of gender and education on corporate social responsibility: Evidence from Taiwan. Problems and Perspectives in Management 18: 334. [Google Scholar] [CrossRef]
  27. Pucheta-Martínez, María Consuelo, and Isabel Gallego-Álvarez. 2020. Do board characteristics drive firm performance? An international perspective. Review of Managerial Science 14: 1251–97. [Google Scholar] [CrossRef]
  28. Rynes, Steven L., John A. Colbert, and Kenneth A. Brown. 2007. The role of human capital in corporate governance: Theoretical foundations and research directions. Journal of Management 33: 397–424. [Google Scholar]
  29. Sun, Liang. 2021. Does the location of directors’ additional positions matter? A new dimension of board structure. Global Finance Journal 49: 100648. [Google Scholar] [CrossRef]
  30. Warfield, Terry D., John J. Wild, and Kenneth L. Wild. 1995. Managerial ownership, accounting choices, and informativeness of earnings. Journal of Accounting and Economics 20: 61–91. [Google Scholar] [CrossRef]
  31. Weisbach, Michael S. 1988. Outside directors and CEO turnover. Journal of Financial Economics 20: 431–60. [Google Scholar] [CrossRef]
  32. Wu, TsingZai C., Jeng-Ren Chiou, and Li Cheng. 2011. The Influence of Corporate Governance on a CPA’s Going-concern Opinion for Financially Distressed Firms: An Empirical Study for Firms Listed in the Taiwan Stock Exchange. Tai Da Guan Li Lun Cong 21: 187. [Google Scholar]
Figure 1. Operating mechanism of ANN.
Ijfs 12 00017 g001
Figure 2. Plot Scatter of Relationship between ROA and Board’s Background. (a) ACC vs. ROA, (b) FIN vs. ROA, (c) LAW vs. ROA.
Ijfs 12 00017 g002
Figure 3. ANN for Predicting ROA.
Ijfs 12 00017 g003
Figure 4. The model loss of the ANN models.
Ijfs 12 00017 g004
Table 1. Variable definition.
VariableDefinition
Financial Performance
R O A i t The return on the asset after tax, before interest, and depreciation.
Board and Managers (BSM)
A C C i t Percentage of accounting professional background of board directors, supervisors, and managers.
F I N i t Percentage of finance professional background of board directors, supervisors, and managers.
L A W i t Percentage of law professional background of board directors, supervisors, and managers.
B D P i t A measure of the board’s power. The shareholding ratio of board directors and supervisors is calculated as the total number of shares held by the board and supervisors divided by the total number of shares.
M N P 1 i t A measure of the manager’s power. The proportion of shares held by the company’s managers in the company’s announcement to the company’s total issued shares. Formula: number of shares held by managers ÷ total number of shares × 100
M N P 2 i t A measure of the manager’s power. The proportion of shares held by all managers of the company to the total issued shares of the company refers to the shares held by managers plus the number of shares held by natural person directors who also serve as managers. Formula: number of shares held by managers (including concurrent directors and supervisors) ÷ total number of shares × 100
B S Z i t The natural log of the number of directors in the board of directors.
I B D i t The natural log of the number of independent directors on the board of directors.
Control Variables (CTL)
S I Z E i t Total assets are the natural log of total assets at the end of the period.
D B T i t The debt ratio is calculated as the total liabilities of total assets
N P T i t Net profit rate before tax and depreciation.
Table 2. Statistics Summary.
VariablesMeanMedianMaximumMinimumStd. Dev.Obs.
ROA6.526.0863.30−53.126.745309
ACC0.070.000.710.000.105309
FIN0.030.000.430.000.065309
LAW0.030.000.440.000.065309
BDP24.8321.28100.000.0014.845309
MNP11.140.1721.640.002.385309
MNP24.932.0558.320.007.275309
BSZ0.860.851.320.300.145309
IBD0.190.000.600.000.205309
SIZE6.756.698.834.770.625309
DBT43.8845.03101.970.6916.805309
NPT10.6510.46619.96−2989.8849.725309
Table 3. Correlation Analysis.
Prob.ROA ACC FIN LAW BDP MNP1 MNP2 BSZ IBD SIZE DBT
ACC0.07***1
FIN−0.09***0.22***1
LAW0.01 0.02 0.00 1
BDP0.15***−0.05***0.01 0.05***1
MNP10.08***0.06***−0.06***0.03**−0.03**1
MNP20.10***−0.03**−0.12***−0.10***0.18***0.36***1
BSZ0.05***0.09***0.09***0.03**0.03*−0.17***−0.24***1
IBD0.14***0.52***0.11***0.04***0.00 0.04***−0.02 0.26***1
SIZE0.10***0.02 0.11***0.11***−0.14***−0.14***−0.28***0.46***0.07***1
DBT−0.22***−0.08***0.03**−0.05***−0.08***−0.01 −0.03**−0.02 −0.05***0.16***1
NPT0.25***0.04***0.00 0.01 0.02*0.02 0.02 0.02 0.03**0.09***−0.05***
Note: ***, **, and * represent the 1%, 5%, and 10% significant levels, respectively.
Table 4. Testing for the Threshold of Return on Assets (ROA).
Thresholds τ 1 τ 2 τ 3
14.69 ***
[29.68]
6.52 ***
[28.40]
−1.54 ***
[26.13]
Note: The threshold variable is ROA. The maximum threshold applied for detection is 5. Statistics in [.] are critical values based on Bai and Perron (2003), which show all τ values of ROA are significant at the 1% level. *** indicates statistical significance at the 1% level.
Table 5. Factors Affecting ROA at Different Groups.
VariablesROA < −1.54
(Group 1)
−1.54 ≤ ROA < 6.52
(Group 2)
6.52 ≤ ROA < 14.69
(Group 3)
14.69 ≤ ROA
(Group 4)
Group[1][2][3][4]
C−35.46***−1.85**10.93***16.22***
ACC−1.92 0.42 1.57**−1.79
FIN11.98***−1.72**−3.02**5.68**
LAW−10.58***−0.10 −2.11*3.36
BDP−0.01 0.01***0.00 0.04***
MNP1−0.13 −0.02 −0.02 0.14***
MNP20.09***0.04***0.01 0.00
BSZ2.73**0.17 0.20 2.66**
IBD−2.66***0.19 −0.14 −0.38
SIZE4.28***0.70***−0.27**−0.61**
DBT−0.01 −0.01*−0.01**−0.03***
NPT0.01***0.02***0.05***0.18***
Number of Obs.38424591930536
Group4321
R2:0.839
Adj.R2:0.837
F-Statistic583.342 ***
Note: ***, **, and * represent the 1%, 5%, and 10% significant levels, respectively. ROA is the after-tax return on assets.
Disclaimer/Publisher’s Note: The statements, opinions and data contained in all publications are solely those of the individual author(s) and contributor(s) and not of MDPI and/or the editor(s). MDPI and/or the editor(s) disclaim responsibility for any injury to people or property resulting from any ideas, methods, instructions or products referred to in the content.

