
The Overall Design of Variable Diameter Ducted Fan in the Aircraft


National Key Laboratory of Rotorcraft Aeromechanics, Nanjing University of Aeronautics and Astronautics, Nanjing 210016, China
*
Author to whom correspondence should be addressed.
Aerospace 2022, 9(7), 387; https://doi.org/10.3390/aerospace9070387
Submission received: 15 June 2022
/
Revised: 7 July 2022
/
Accepted: 15 July 2022
/
Published: 18 July 2022
(This article belongs to the Section Aeronautics)
Abstract
:Variable diameter rotor can improve the flight performance of the aircraft both in hovering and forward flying and a duct can improve the rotor performance further both in force and efficiency. In previous studies, those two parts are always studied in the one-factor-at-a-time method, and the duct is lack diameter change so that it cannot cooperate with the variable diameter rotor. In this paper, the Chinese utility helicopter Z9 is taken as the prototype, and the structural parameters of the variable diameter ducted fan (VDDF) are selected by an orthogonal experiment method. Based on the momentum-element theory, the aerodynamic theoretical model of the disk is established, and the structural parameters that can achieve the best efficiency in hover/propulsion and the best lift/thrust force ratio under different modes are obtained in the orthogonal range by computational fluid dynamics method. The structural parameters of the VDDF under the set working conditions are obtained by a technique for order of preference by similarity to ideal solution (TOPSIS) evaluation and the flight performance of the aircraft equipped with the VDDF is superior to the prototype: The max takeoff weight raises 25%; the hover ceiling raises 90%; the cruise altitude raises 11%; the cruise speed raises 23% and the max speed raises further. However, a better engine may be needed to provide greater power.
1. Introduction
One of the most serious obstacles to limiting helicopter speed is the problem of air compression of the leading edge on blades and air separation of the trailing edge on blades. For this reason, Bell Helicopter Inc. cooperated with Boeing Inc. to develop the tiltrotor [1]. However, the design of conventional tiltrotor aircraft is a compromise between helicopter mode and propeller mode, and the hovering/propulsion efficiency in both modes has decreased. Therefore, a variable diameter tiltrotor is proposed [2]: a large diameter disk is used in helicopter mode while a small diameter disk is used in propeller mode. A report from NASA indicates that the larger disk reduces the hovering power required by decreasing its reduced velocity while the smaller disk reduces the power required in level flight by increasing its efficiency of propulsion [3]. Later, Xue. et al. built the improved momentum-element model on the variable diameter tilt-rotor (VDTR) and studied its flexible multi-body dynamic model to verify the benefits of aerodynamics and designed a model motion on a test-bed [4]. Mistry and Gandhi examined rotor power reductions achievable through a combination of radius and rotation per minute (RPM) variation and got the best combination under different conditions of weight and height [5]. Cole et al. used the propeller power required during steady-level flight as a metric for efficiency and analyzed the aerodynamic characteristic of blade inboard under different working conditions [6]. Since a conventional variable diameter rotor is still a compromise to some extent, considering the increasing/pushing effect of the duct on the rotor, a variable diameter ducted fan (VDDF) concept is proposed: a variable diameter rotor with a variable diameter duct. The enhancements of the duct to the rotor have been studied in the relevant research. Oweis GF et al. used laser Doppler and particle image velocimetry to detect the vortex in the tip wake to characterize the degree of tip leakage, finding that the duct can greatly reduce tip leakage [7,8]. Graf et al. Studied the influence of duct edge shape on the performance of duct fans through experimental means [9], finding that a smaller leading edge radius of the duct has better performance under forwarding flight, while a larger leading edge radius is preferred under hovering flight. Yilmaz et al. studied the performance characteristics of ducted fans at zero angles of attack through experiments [10], finding that if the duct shape is optimized with an annular wing, the propulsion efficiency can be further improved.
The above-mentioned relevant researches have studied the advantages of variable diameter rotor and ducted fan respectively but did not study and analyze those two parts together. Moreover, only a single variable is designed or only the one-factor-at-a-time method is used in these studies, which may have design contingencies.
The objective of this paper is to establish a model to select the structural parameters of VDDF for obtaining appropriate structural parameters in both hover and forward flight to achieve the hover and propulsion efficiency that is comparable to that of conventional helicopter and propeller aircraft and raise the flight performance of the prototype. The momentum-element model is used to choose the appropriate rotor speed and collective pitch in the orthogonal field. The design variables include the blades’ twist angle, chord length, and number, as well as the ducts’ foil, rotor-duct relative position, length, and taper angle. The orthogonal experiment model to build orthogonal tables for both rotor and duct is developed. The momentum-element model and orthogonal experiment model are validated with the experimental results as well as with the calculated results from ANSYS CFD. The technique for order of preference by similarity to the ideal solution (TOPSIS) model is established to evaluate the quality of different design variables at different levels. Finally, the power calculation model is established to validate the expected flight performance.
2. Rotor Aerodynamic Calculation Modeling and Optimal Selection Model
2.1. The Momentum-Element Model
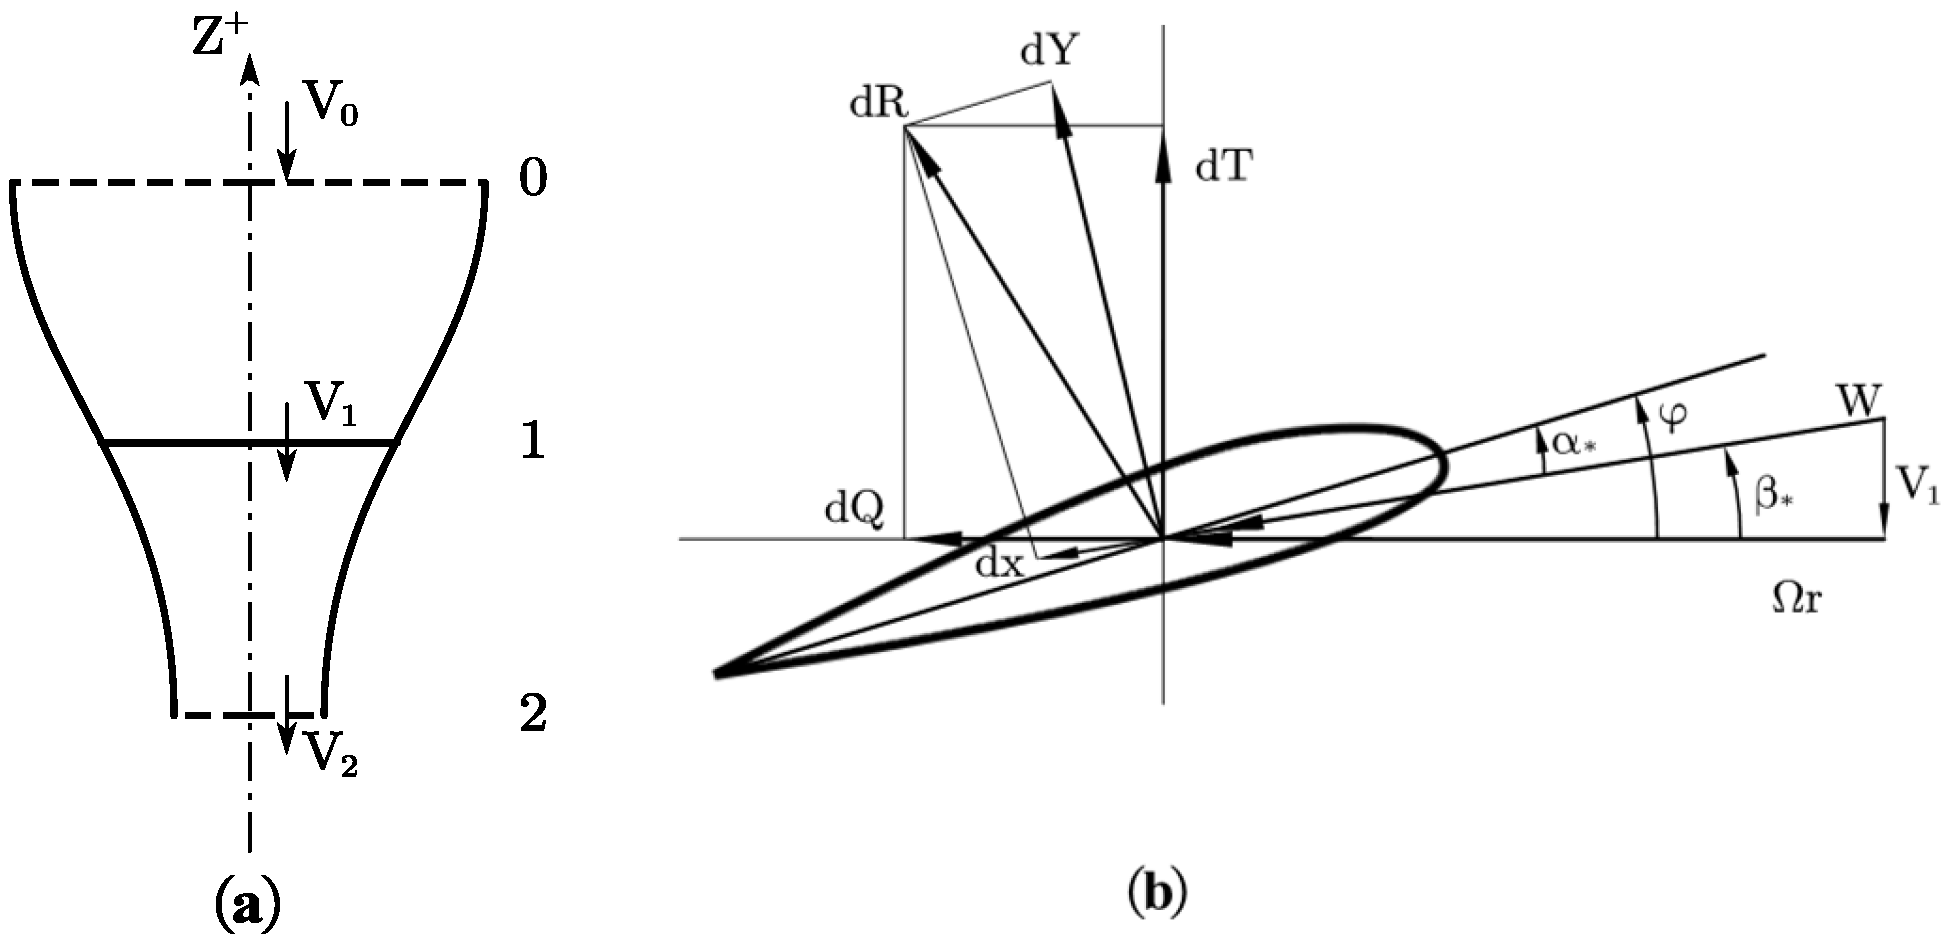
The momentum-element model describes the airflow in the duct in the momentum theory to calculate the induced velocity at the rotor disk and the force on rotor blades in the element theory. Considering the main working condition of the VDDF, the airflow is taken as an axial flow. To a sole disk, the airflow in momentum theory shown in Figure 1a is used to take the rotor as an actuator disk that pushes the air downward and is subject to an upward reaction. The Z+ axis is the direction where the lift force and thrust point, and the reverse is the direction where the inlet airflow velocity point. For a blade of the rotor, the blade consists of infinite elements and the force of a blade depends on the certain geometrical characteristics of each element as shown in Figure 1b.
The paper defines the force coefficient and power coefficient as follows:
According to the momentum theory, the force coefficient is:
The momentum theory only studies the aerodynamic characteristics of the rotor disk from the change of airflow velocity without considering the geometric characteristics and fluid viscosity of the rotor disk. The element theory obtains the aerodynamic characteristics of the whole rotor by treating the blade as an infinite number of blade elements, analyzing the motion and force of each blade element, and finally integrating them. The force in a blade element segment consists of lift and drag. However, due to the small flow angle and the drag component being much smaller than the lift component, it is approximately considered that the force is equal to the lift and the lift coefficient is a linear function before the stall point in the calculation. For the disk of rectangular blades, the force coefficient in element theory is:
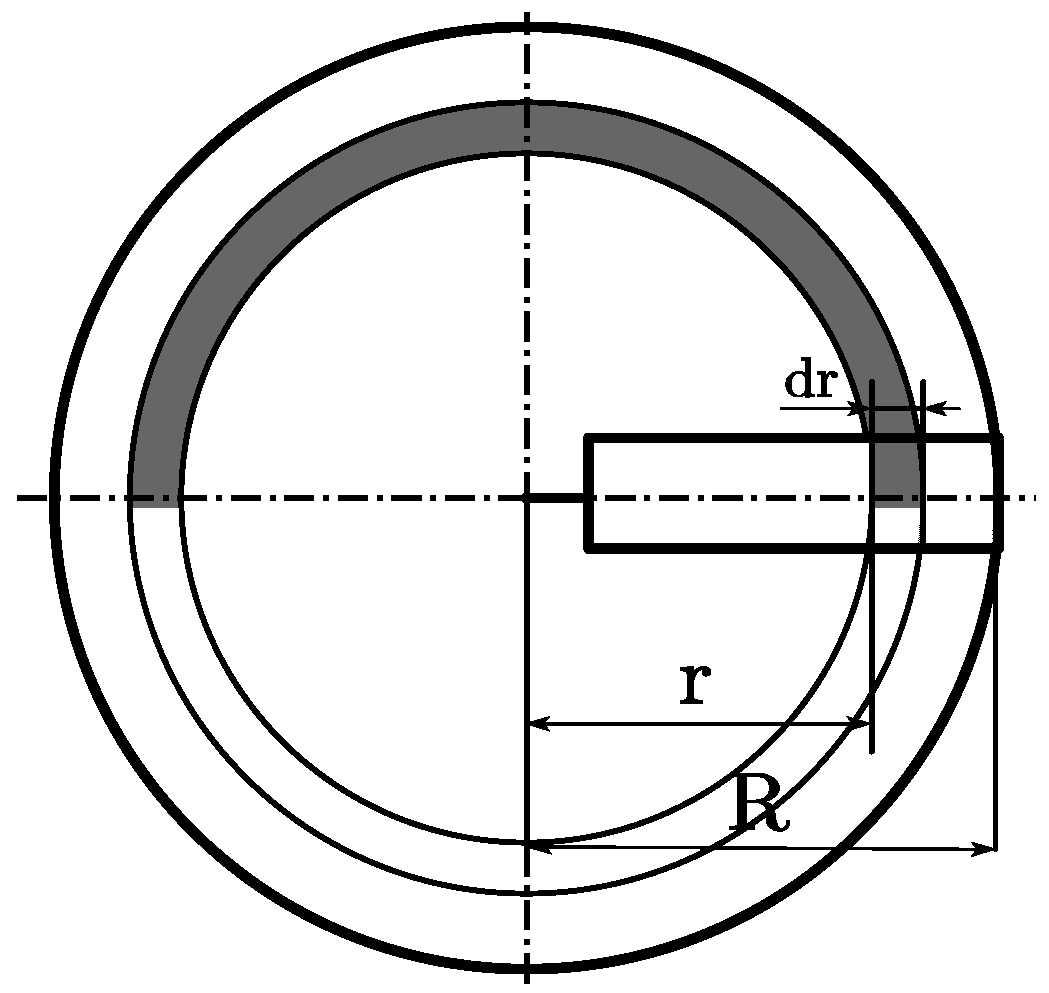
Although the element theory gives more accurate aerodynamic characteristics under the geometric structure, the induced velocity of the disk plane is required as the input. The momentum-element model takes the circular ring with the thickness dr at the radius r of the disk as shown in Figure 2, and the Equations (3) and (4) obtain the induced velocity at the element through the Newton iteration method and then obtain the force at the element. Then, the element theory is used to integrate the whole rotor disk to obtain the whole force.
Since the duct in the study is a body obtained by the rotation of an airfoil, which is different from the traditional duct theoretical model [11], the computational fluid dynamics (CFD) method of multiple reference frame (MRF) models are used to calculate the aerodynamic characteristics of the VDDF. The MRF method can better meet the analysis requirements and less calculation time, and can accurately consider the aerodynamic impact caused by geometric interference. In hovering, the outer flow field boundary of the duct axial direction is the pressure inlet and the pressure outlet respectively, and the circumferential far-field boundary is the pressure outlet. The interface boundary is used to transfer the flow field information between the rotating inner flow field in the duct and the outer flow field. The inlet boundary turns into the velocity inlet in the forward flight and the circumferential far-field boundary turns into the wall to prevent the leakage of inlet velocity in the outer flow field. The flow regime is the steady constant air, and its pressure and density depend on the flight altitude. The coupled implicit solver and RNG k-ε viscous model are used. The numerical stability is defined as the convergence condition of 10e-6, which is generally acceptable for fluid research.
2.2. Optimal Selection Model
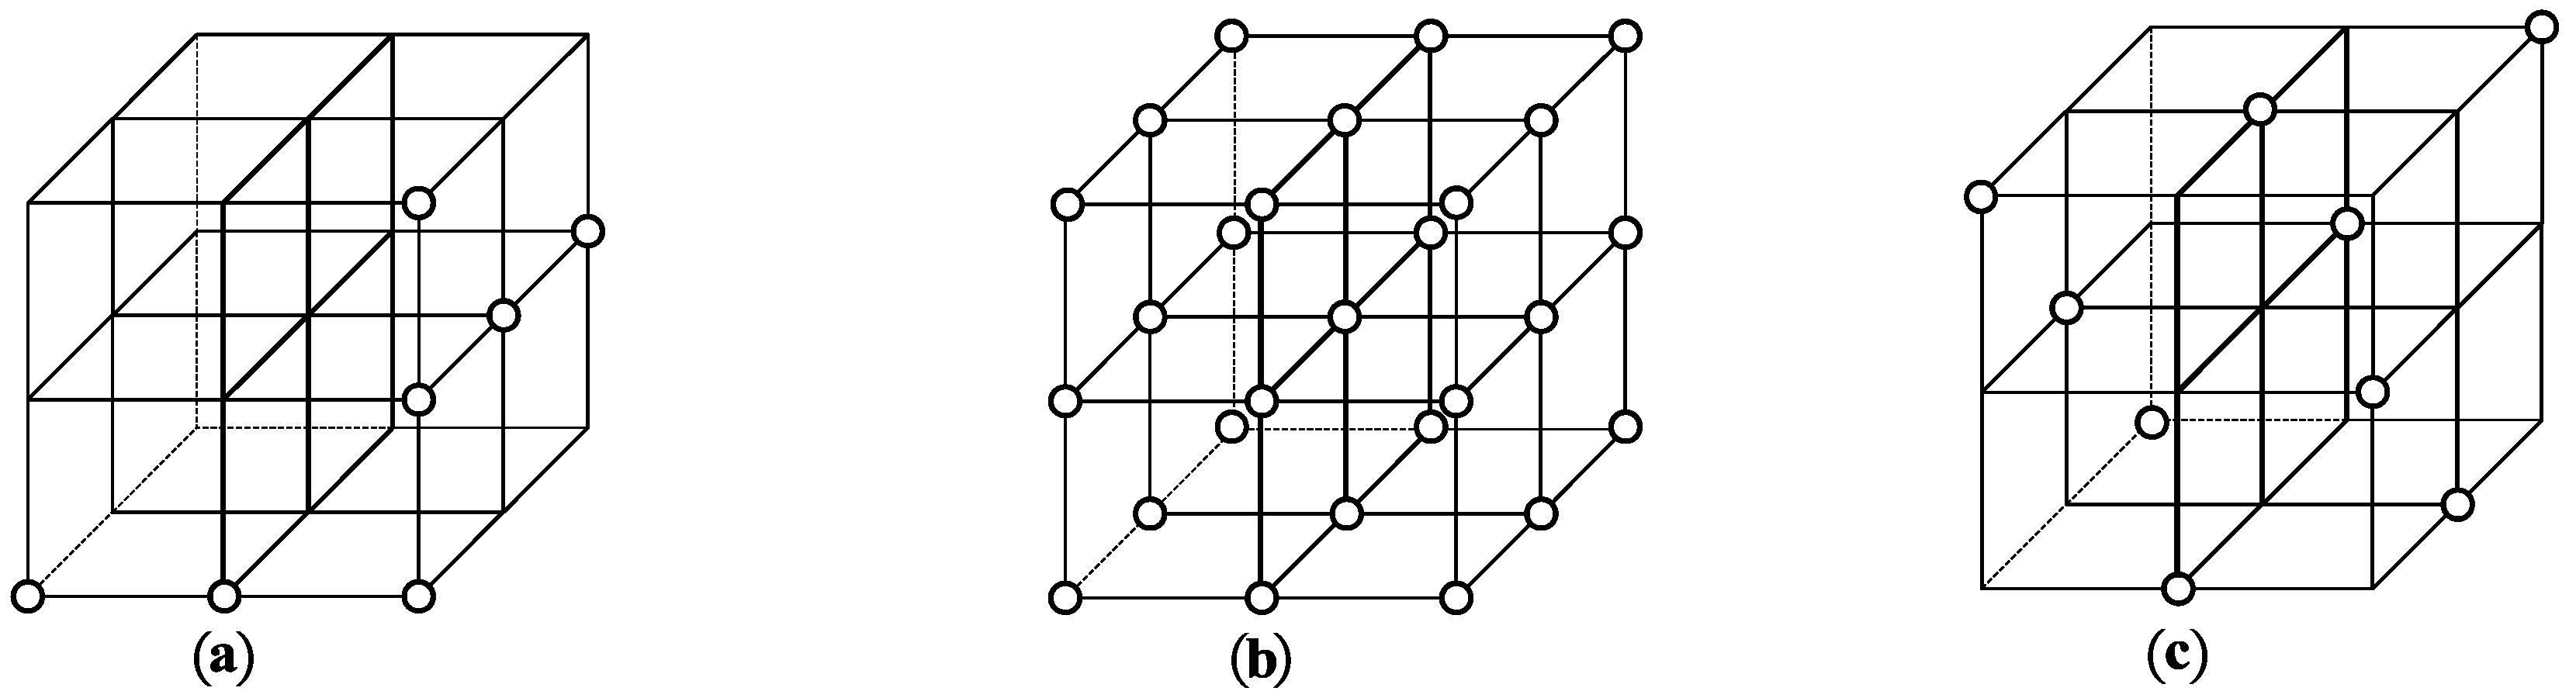
The sample selection is established by the orthogonal table. The one-factor-at-a-time method is mostly used in the study of structural parameters of ducted fans [12,13,14], that is, only one parameter is changed each time and the influence of different parameters on aerodynamic characteristics is studied one by one by analogy. The advantage of this method is that the number of experiments is fewer but the representativeness of experiments is poor. Different conclusions may be drawn by using different cyclic orders, and the interaction between factors cannot be considered. However, if a comprehensive experiment design with all factors arranged in full order is adopted, the advantage is that there is no missing combination but too many experiments. Orthogonal experiment design extracts representative experiment points from the comprehensive experiment design for experiments. Due to the balanced distribution of experiment points, the orthogonal experiment design can better represent the situation of all combinations and represent all samples with fewer experiment times [15]. An example of distributions of experimental points with different design methods is shown in Figure 3.
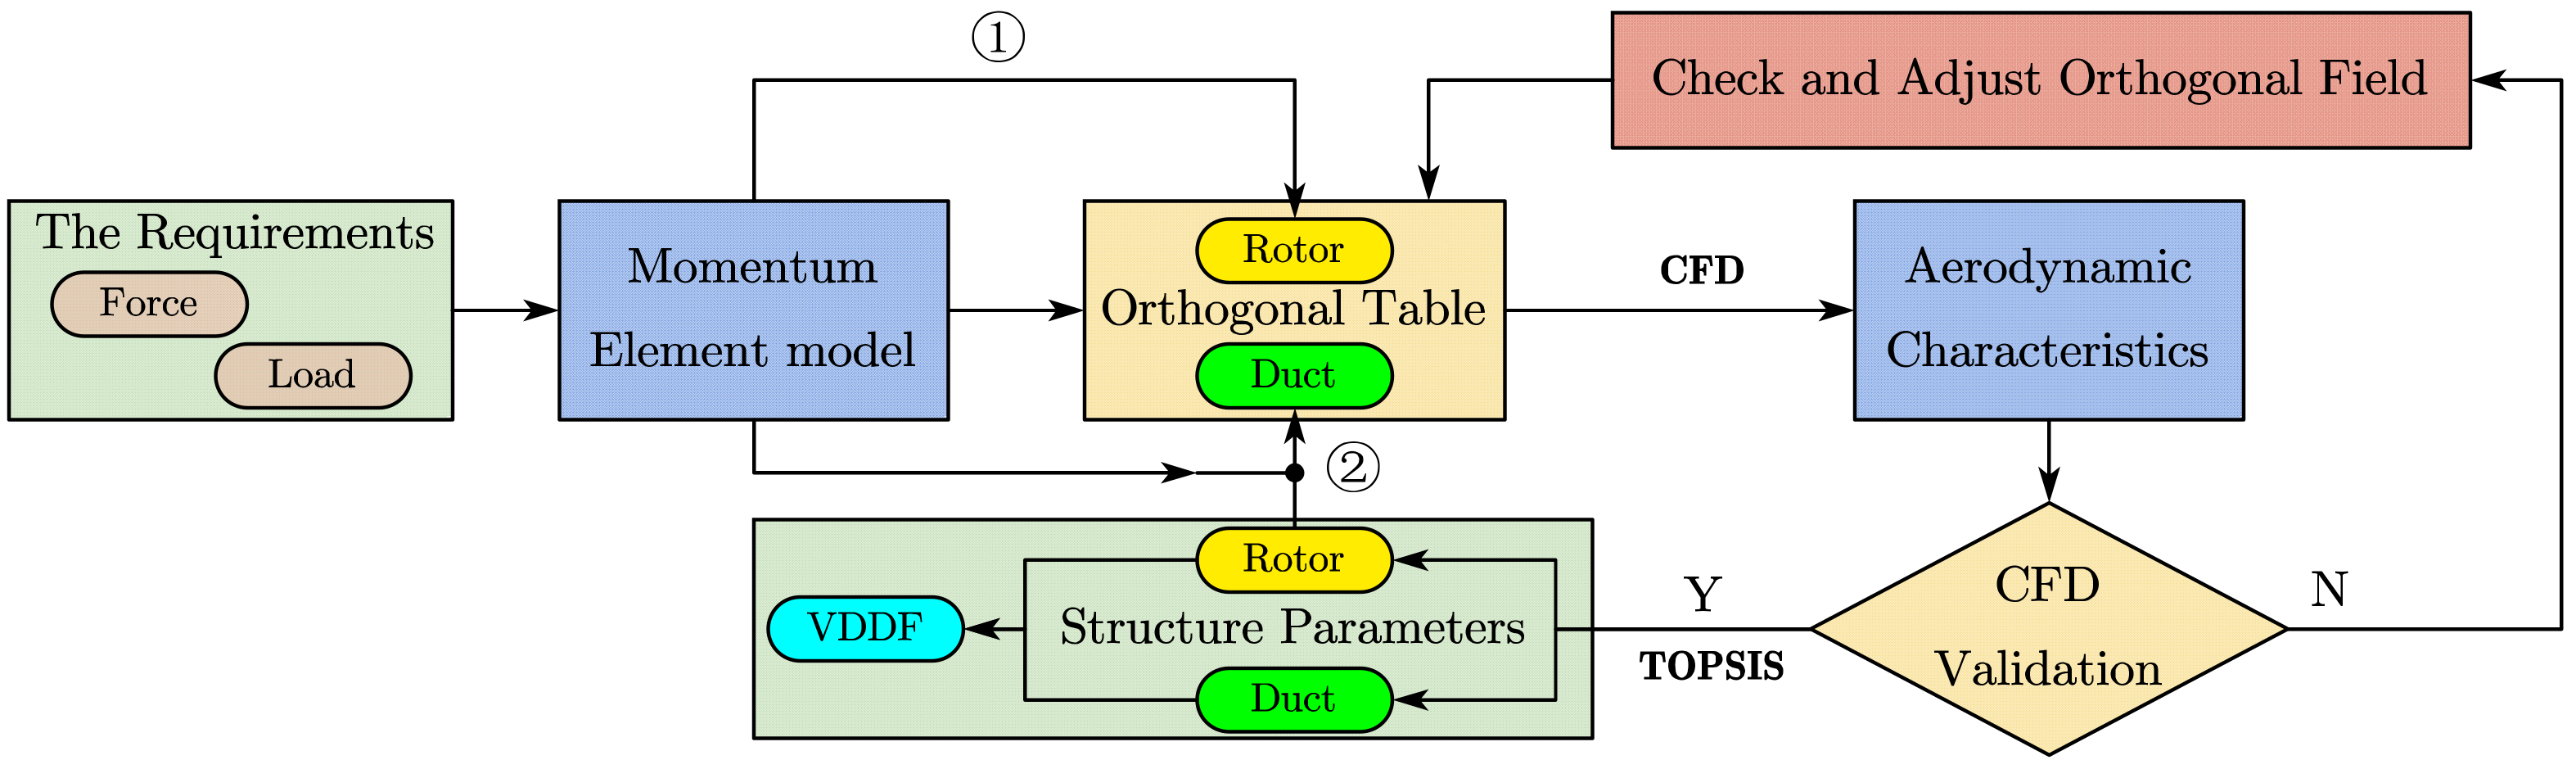
For a specific orthogonal experiment, the following steps are necessary: (1) Define the purpose of the experiment and determine the evaluation index; (2) Select factors and determine the level; (3) Select the orthogonal table to design the header; (4) Define the experimental scheme, carry out the experiment and get the results; (5) Statistical analysis of the experimental results; (6) Carry out validation experiments for further analysis. The paper uses an open-source tool Allpairs, which is tested valid under standard orthogonal experiments, to build the mixed orthogonal table [16]. Compared with the traditional mathematical orthogonal table, this tool provides a fast hybrid design method and fewer K value calculation requirements. Firstly, the orthogonal parameter range of the rotor disk in the duct is determined by the prototype, relevant research, and the momentum-element model. After the orthogonal rationality is validated by CFD, the structural parameters of the rotor disk are obtained through TOPSIS evaluation. Based on this parameter, the orthogonal parameter range of the duct is selected according to the general aerodynamic characteristics of the duct [17]. Then the structural parameters of the duct are determined through CFD validation and TOPSIS evaluation. Finally, the structural parameters of the VDDF are obtained. The orthogonal experiment flow is shown in Figure 4.
In a typical orthogonal table shown in Table 1, the K value, which represents the aerodynamic characteristic under a certain level of design factors, is:
where t represents design variables and m represents design levels.
The hover efficiency, which is also called the figure of merit (FM), is:
The propulsion efficiency, also known as the forward flight efficiency, is:
If the thrust is below zero caused by too much resistance in a forward flight, the propulsion efficiency is calculated as zero. The force ratio, which represents the beneficial effect that the duct makes on the rotor, is:
The results of Equations (6)–(8) are the aerodynamic characteristics in Table 1 and RL is the force ratio in hover flight while RT is the force ratio in forward flight.
TOPSIS is used to evaluate the different levels of the design variables to achieve structural parameters that are relatively suitable in both hover and forward flight. The validated K values are inputs to the TOPSIS. Assuming that there are n evaluation variables and m characteristics, construct a matrix with n rows and m columns. The element Kij in the matrix represents the value of the jth characteristics of the ith variable. The matrix is normalized as:
and the Euclidean distance of index vector to the best and worst value is:
wj is a weight value in Equation (10), the entropy method is used here to eliminate data sensitivity. S is the rank value determining the final result, and the higher the S better the result:
3. Power Calculation Modeling and Flight Performance Model
The power calculation is modeling to draw the flight envelope. The total power coefficient mk consists of the profile drag power coefficient mkx, effective power coefficient mkyx, and induced power coefficient mki. For a rectangular blade, Kp is always set as 1 in mkx. The paper takes the moment of the rotor Mk as a comparison to the CFD value.
The blade drag coefficient Cx in mkx has a functional relationship with blade lift coefficient Cy, scatter data are obtained in Profili. For the convenience of calculation, the quadratic function is used to fit it. Although the Reynolds number will be different due to different flight conditions, which will affect the lift and drag coefficients, this effect is so small in the whole calculation domain that the error reflected in the power can be ignored. The fit curve of Cx to Cy is shown in Figure 5.
The J value in mki will change according to the collective pitch. In the J value under hovering, is the gain factor, and θ0 is the datum root angle while θ1 is the using root angle.
In the J value under forwarding, the effect of speed is in consideration: is the gain factor, and V0 is the datum forward speed while V1 is the using forward speed.
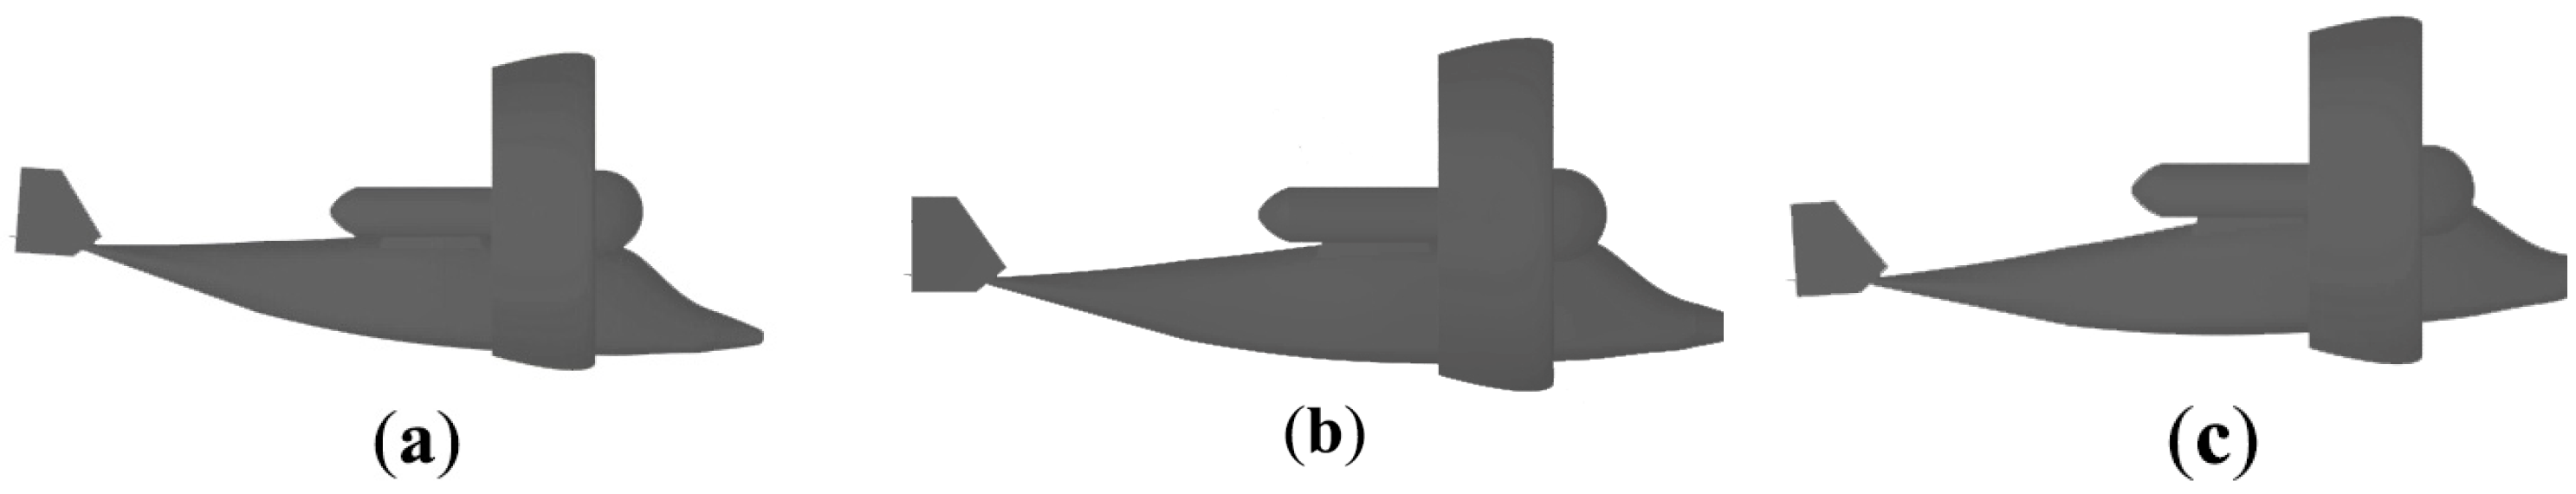
In the forward flight condition, the pitch angle of the aircraft is a very important variable, which determines the lift on the wing and the aircraft resistance (that is, the required output thrust of the VDDF). Through CFD calculation of the aircraft at different pitch angles, the lift and drag coefficients of the aircraft are obtained, and the data are fitted. In the calculation process, the characteristic area of the aircraft is selected as the upper surface area of the airfoil, and the VDDF is always horizontal and does not pitch synchronously with the aircraft. The different pitch of aircraft is shown in Figure 6.
The lift coefficient of the aircraft Cyc is:
where G is the max take-off weight (MTOW) of the retrofit object. The drag coefficient of the aircraft Cxc is:
where X is the drag force in the forward flight direction.
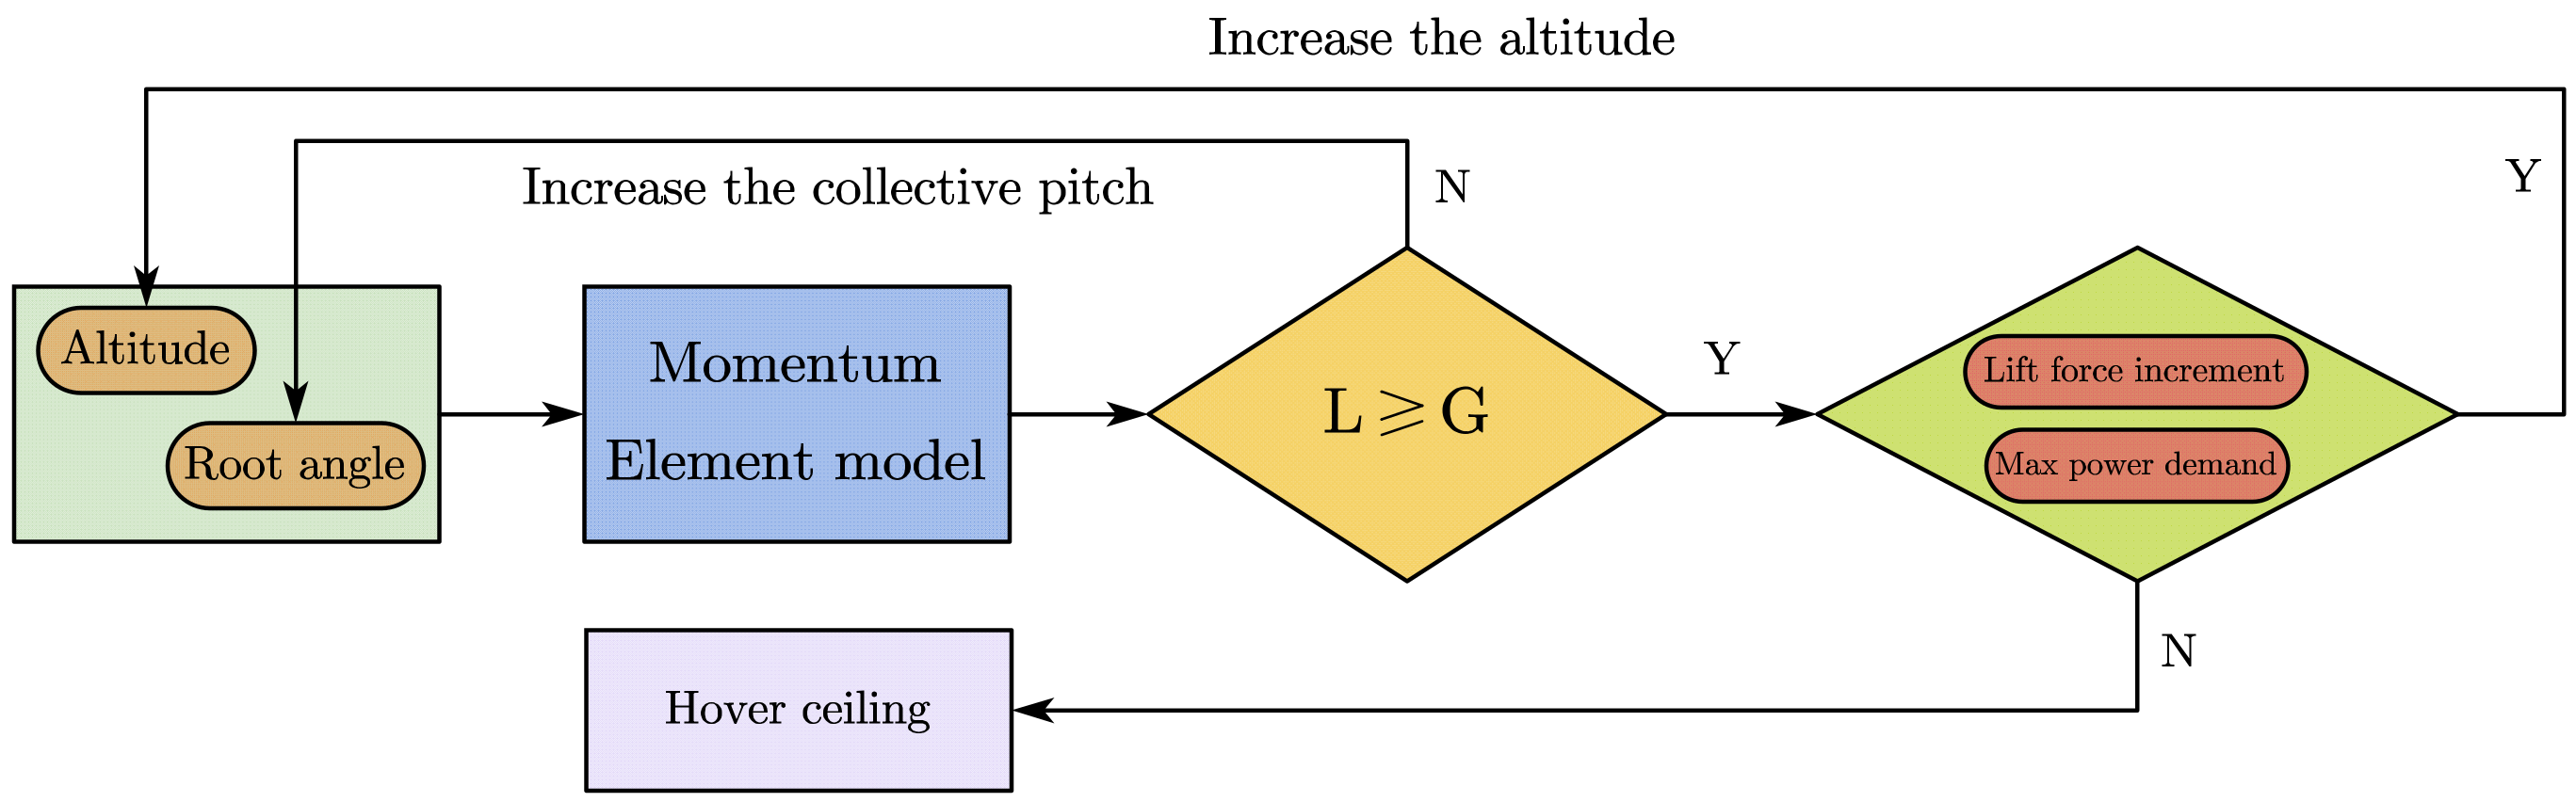
Vertical flight performance calculation is used to determine the vertical climb rate at different altitudes. It is an important flight performance calculation for VDDF working in helicopter mode. Through the momentum-element theory and the fitted RL, the force on the aircraft in vertical flight can be calculated. Considering the small vertical rise rate, the paper assumes that the aircraft is moving at a steady and uniform speed at any time in vertical flight without considering the vertical body wind resistance. The hover ceiling calculation flow is shown in Figure 7.
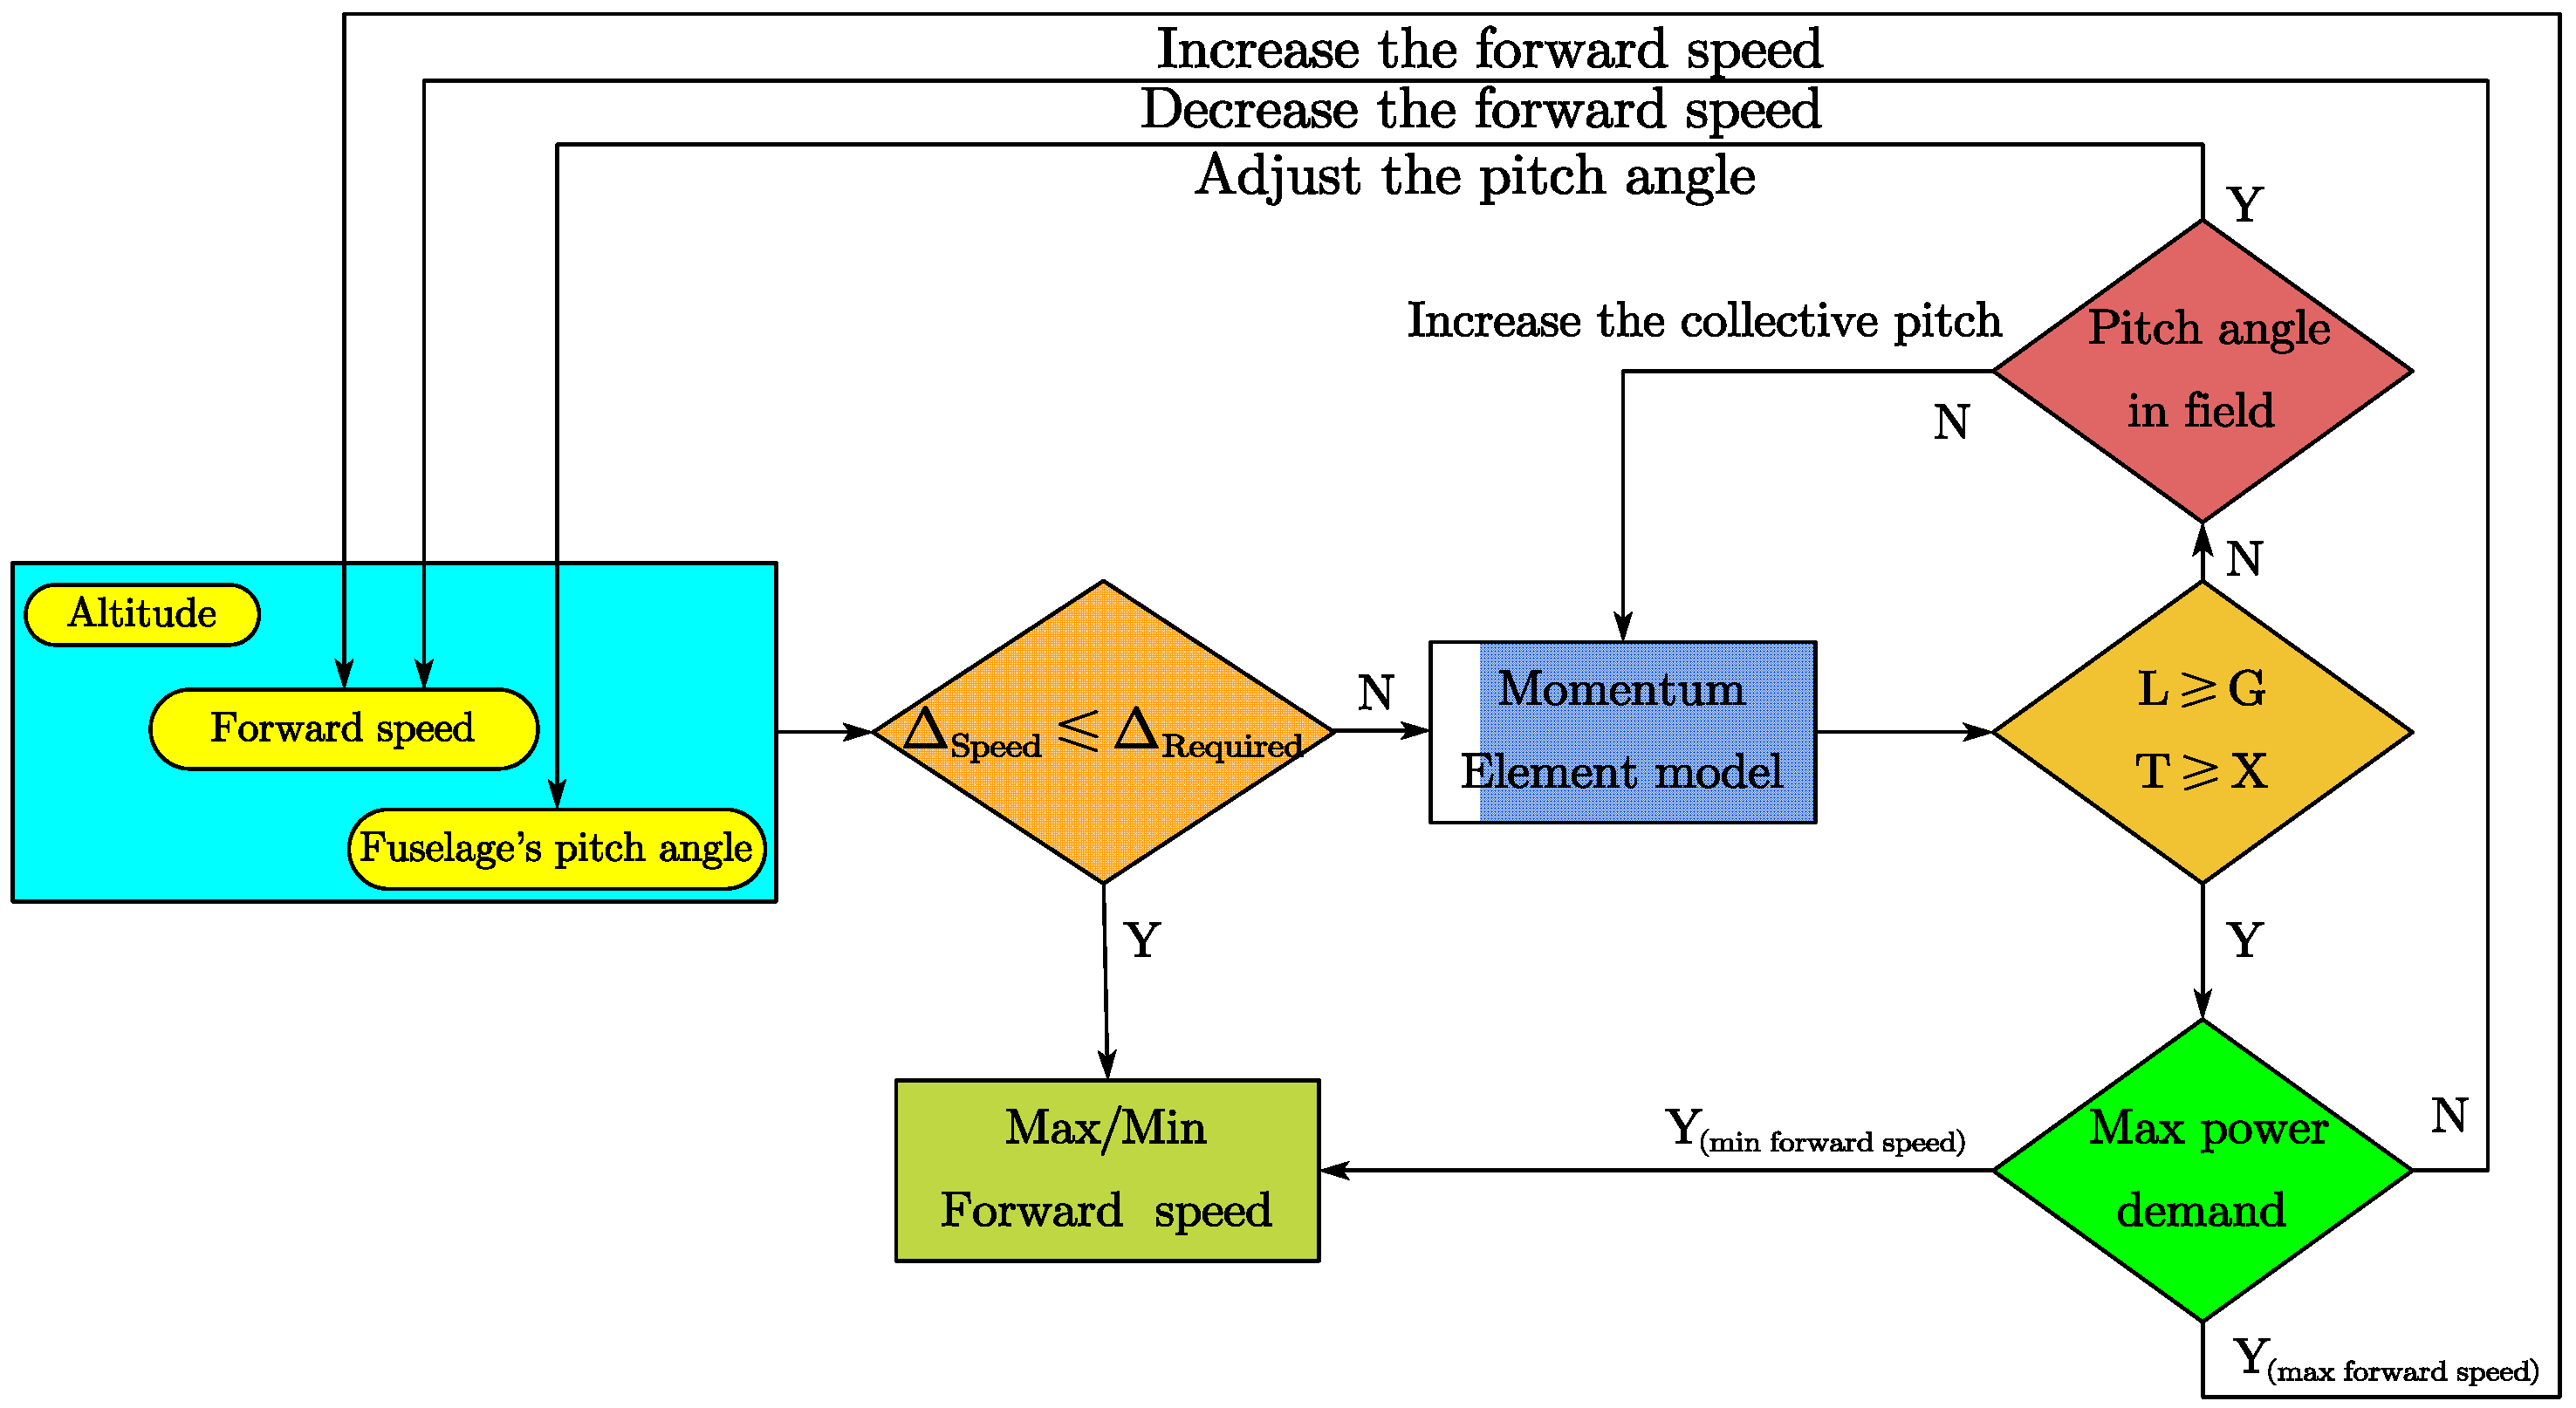
The hover ceiling calculation is used to select the proper turboshaft engine. The goal of the hover ceiling is predetermined, and the max power demand can be achieved in the process. The selected engine is a constraint condition in the flight envelope process. Under the condition that the given altitude meets the lifting demand of the aircraft and the engine limit, adjust the pitch of blades in the VDDF and the pitch angle of the aircraft in the forward flight to obtain different speeds. Record the maximum and minimum level flight speeds at different altitudes to obtain the flight envelope of the whole flight process. Different from the conventional aircraft, the aircraft applied by the VDDF can be hovering when at and below the hovering ceiling, where the minimum level speed is 0. Noting that the minimum level flight speed calculation generally only needs to meet the lifting requirements while the maximum level flight speed calculation needs to consider the engine limit. When the minimum level flight speed is equal to or greater than the maximum level flight speed, the flight envelope calculation ends. The flight envelope calculation flow is shown in Figure 8.
4. Validation and Results
4.1. Design Goal
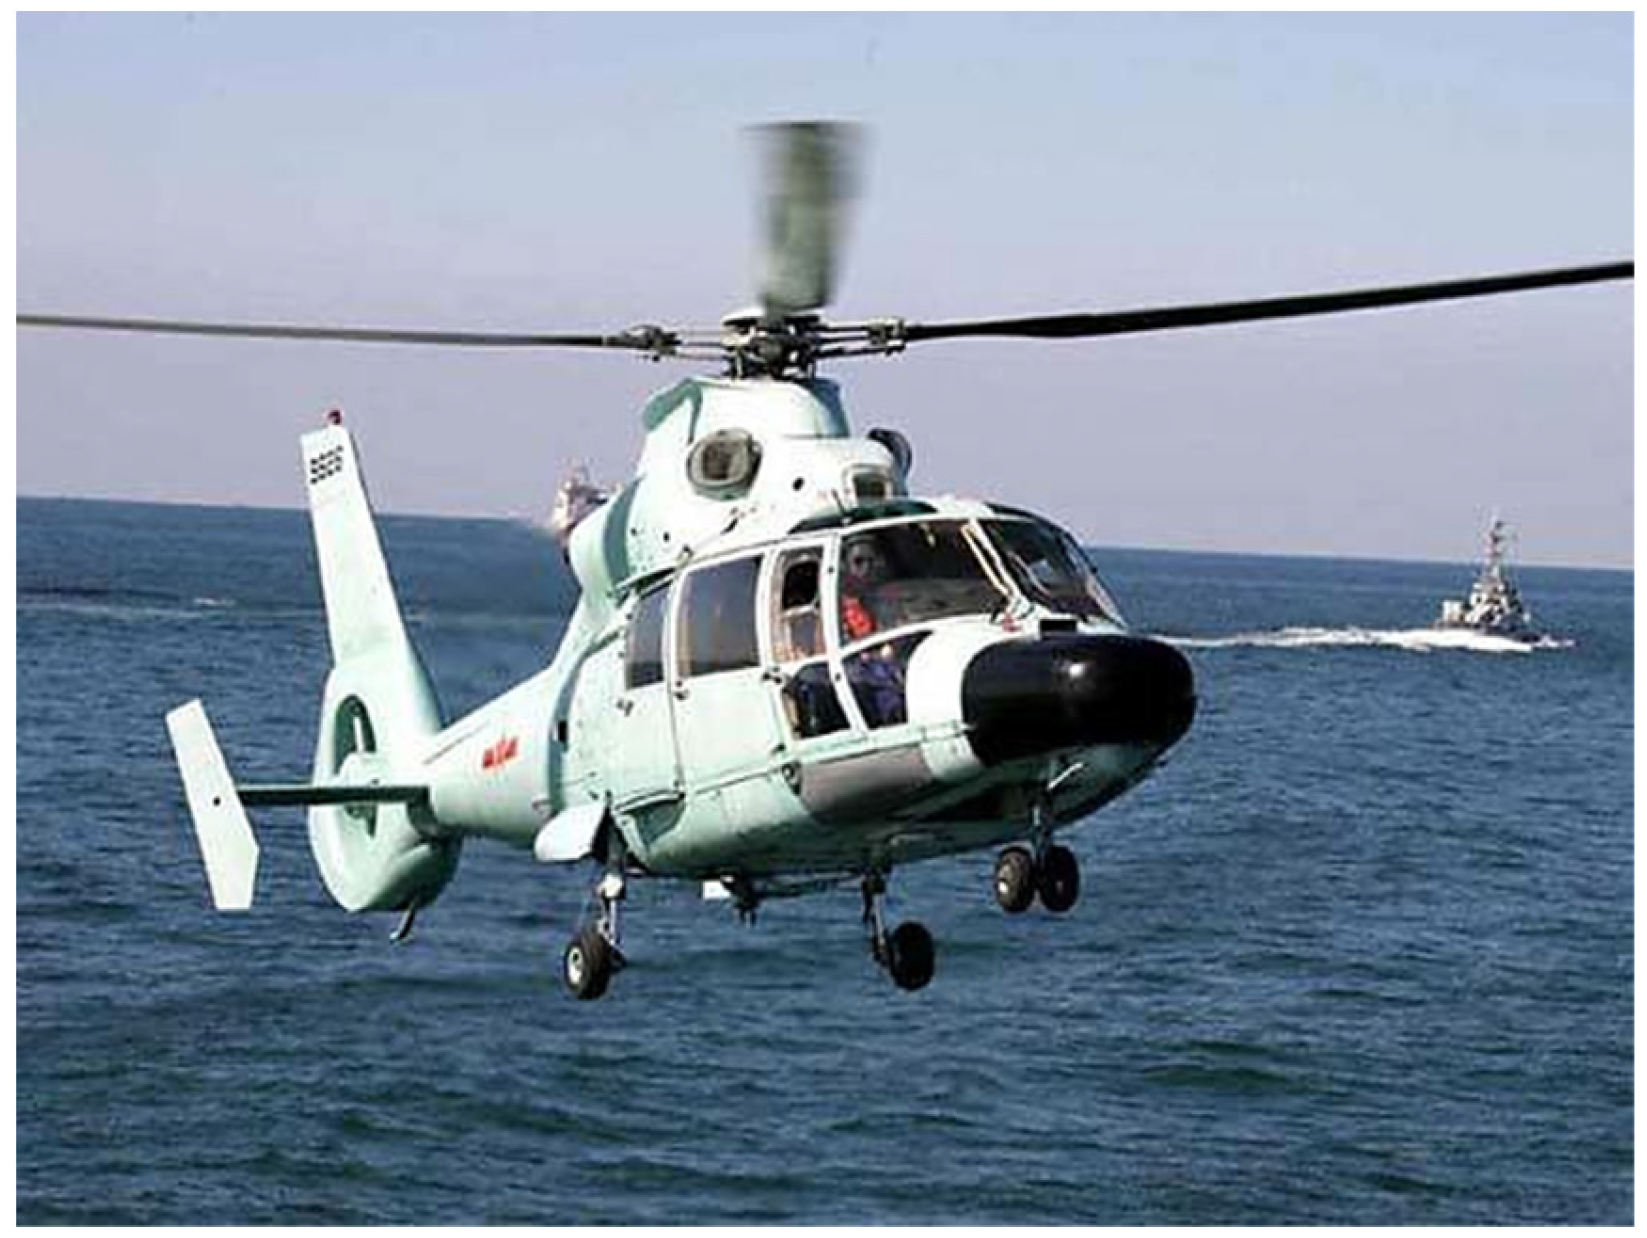
The paper takes the Chinese Z-9 (NATO code “Haitun”) helicopter shown in Figure 9 as the retrofit object of the VDDF, making necessary modifications to the airframe concerning the relevant engineering experience, and putting forward the flight performance objectives that meet the general tilt-rotor aircraft [18]. The V-22 tilt-rotor aircraft, which is relatively successful and widely equipped, is the reference object for the modification of Z-9 in this paper. The diameter change ratio refers to a wind tunnel test of a 1/6th scale VDTR [19]. The design objective is to improve the flight performance such as hover ceiling, cruise altitude, and cruise speed after the prototype [20] is equipped with a VDDF, and the hover and forward flight efficiency can meet the requirements of conventional helicopters and propeller aircraft. The flight performance of the prototype and the design goal is mentioned in Table 2.
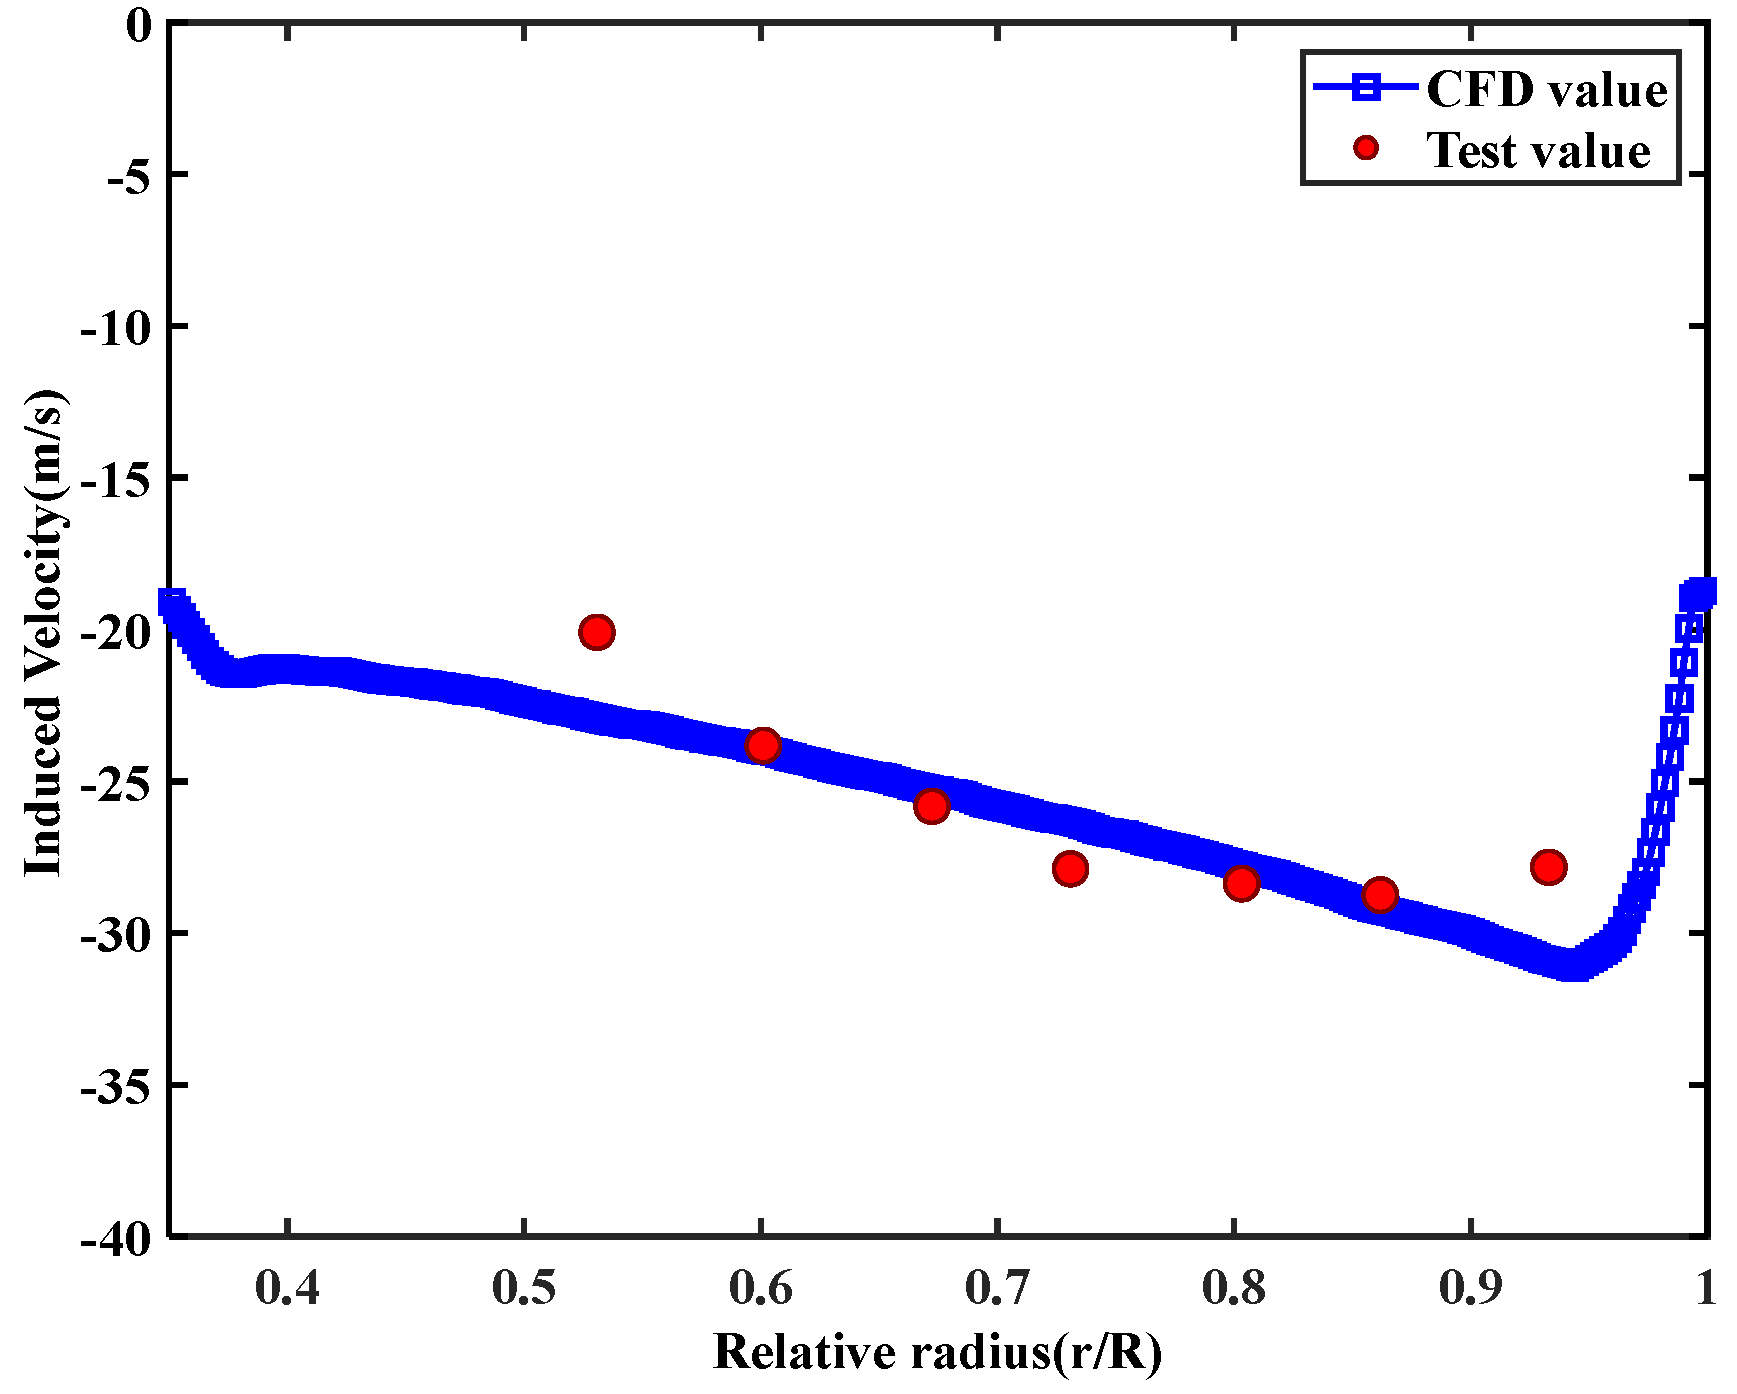
To the validation of the CFD and momentum-element model, the induced velocity at the rotor disk fits with the test values at a splendid level. The comparison error between CFD calculation and test values in the relevant research and the cross-validation error between the rotor’s momentum-element model and CFD are both about 0.1 [21] as shown in Figure 10 and Table 3. This indicates that the CFD method and the momentum-element model are credible and reasonable.
4.2. The Orthogonal Experiment on VDDF
4.2.1. The Orthogonal Experiment on the Rotor
Firstly, the orthogonal experimental design is carried out for the rotor. The geometric invariants are guided by the momentum-element model, setting sea level as the hovering altitude, and the takeoff weight is 5000 kg. The set height during forward flight is 5 km, and the forward flight speed is 360 km/h. The load requirement on the rotor disk is about 90 kg/m2, which is conventional in tiltrotor aircraft when hovering [22]. Before the orthogonal experiment, the invariable geometric parameters of the rotor are prepared as shown in Table 4.
The root angle, twist angle, chord length, and the number of blades are A, B, C, and D in the design variables, and the design levels are 1~5; The FM, RL, η, and RT are marked as A, B, C, and D in aerodynamic characteristics. The blade’s root angle can be adjusted by collective pitch, and the other structural parameters are geometric invariants. In the orthogonal experimental design, one round is in hover flight and the other is in forward flight, each round has , counting a total of 42 samples. The orthogonal parameters field of the rotor disk are shown in Table 5.
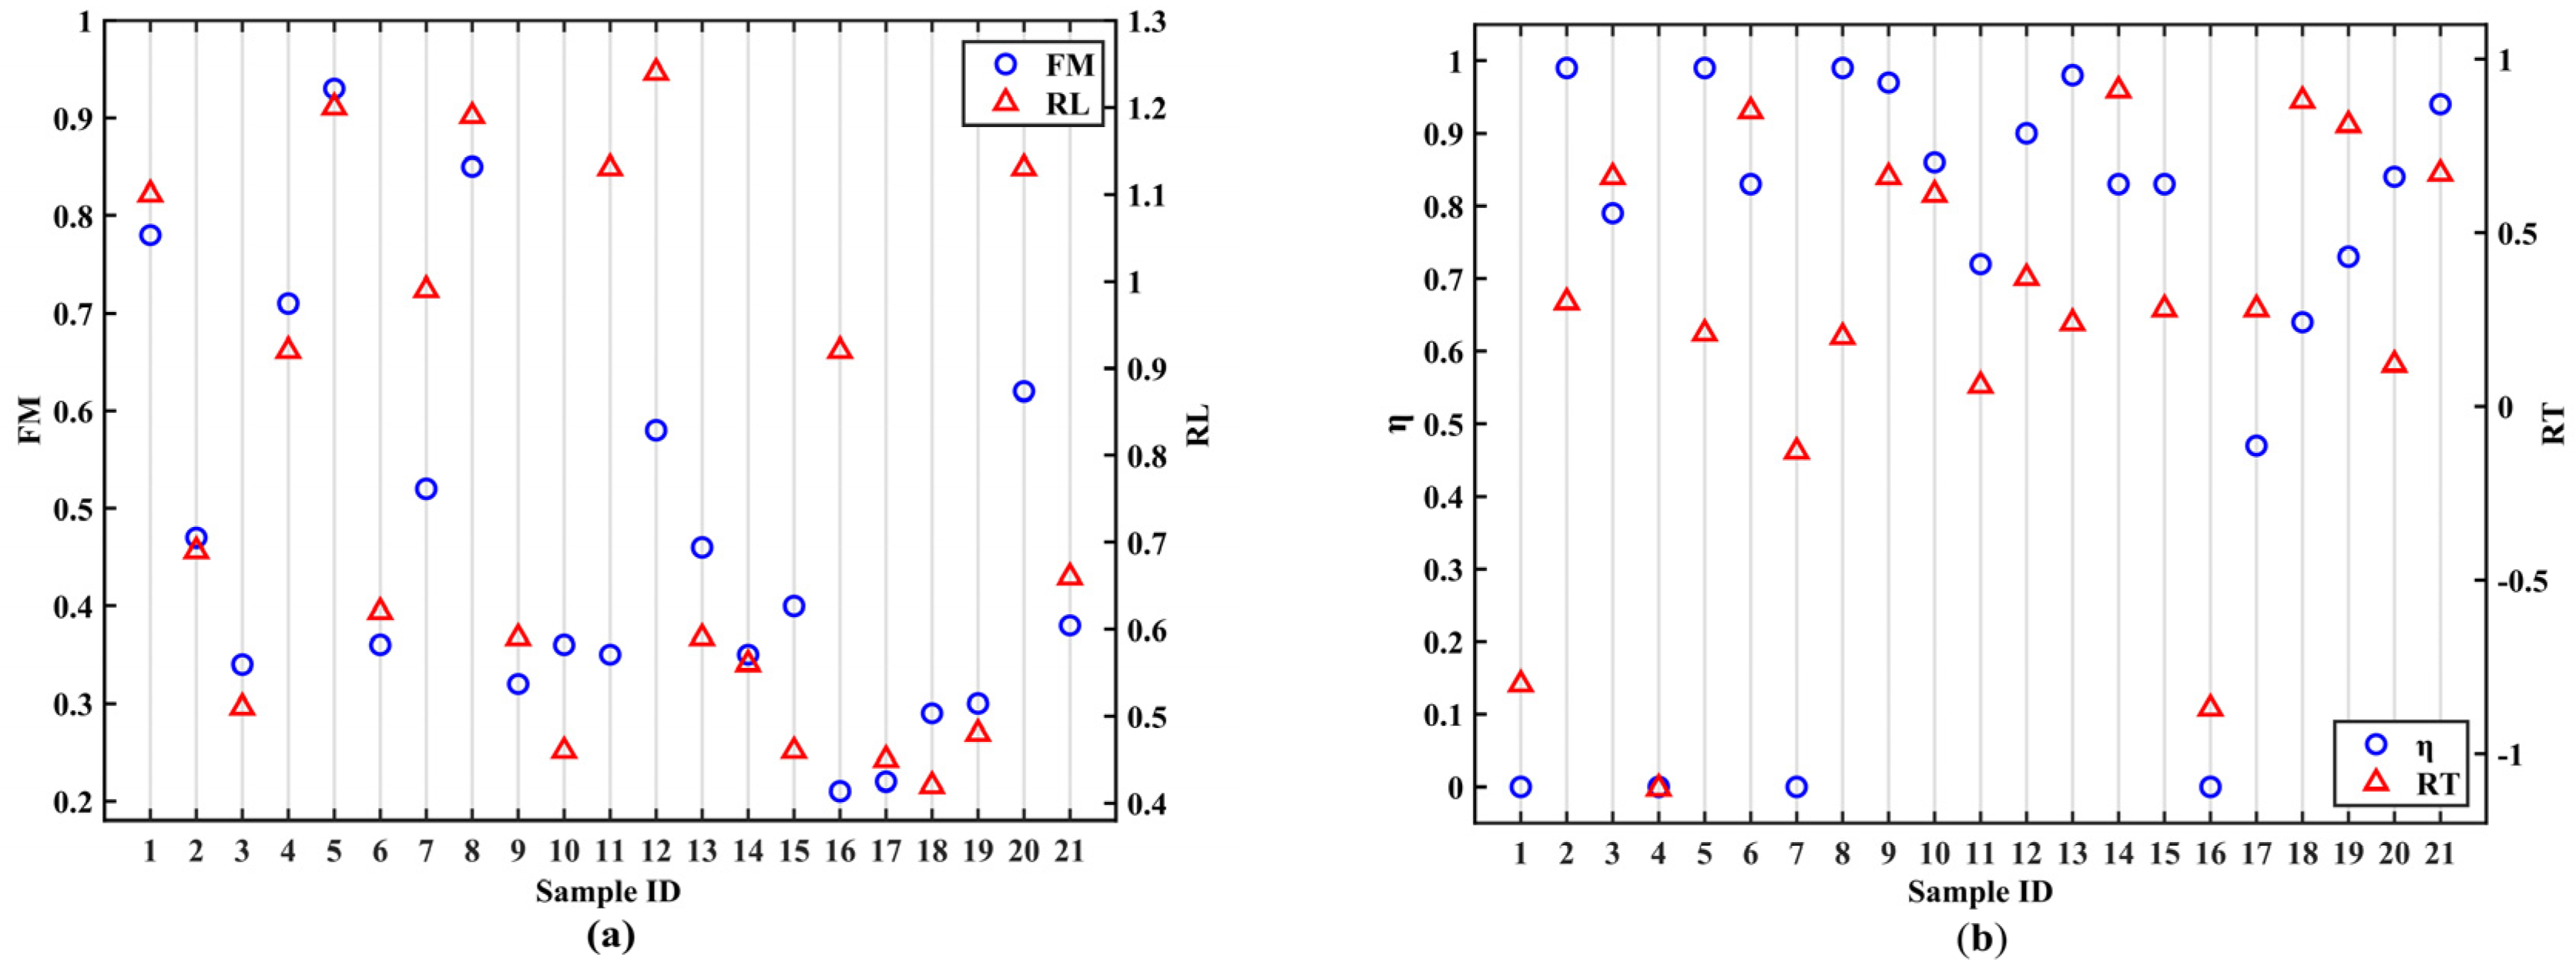
The rotor’s sample results are presented in the form of a scatter chart shown in Figure 11 to avoid long data tables. From the results, it is indicated that the best efficiency may not lead to the best force ratio but a poor efficiency tends to have a poor force ratio.
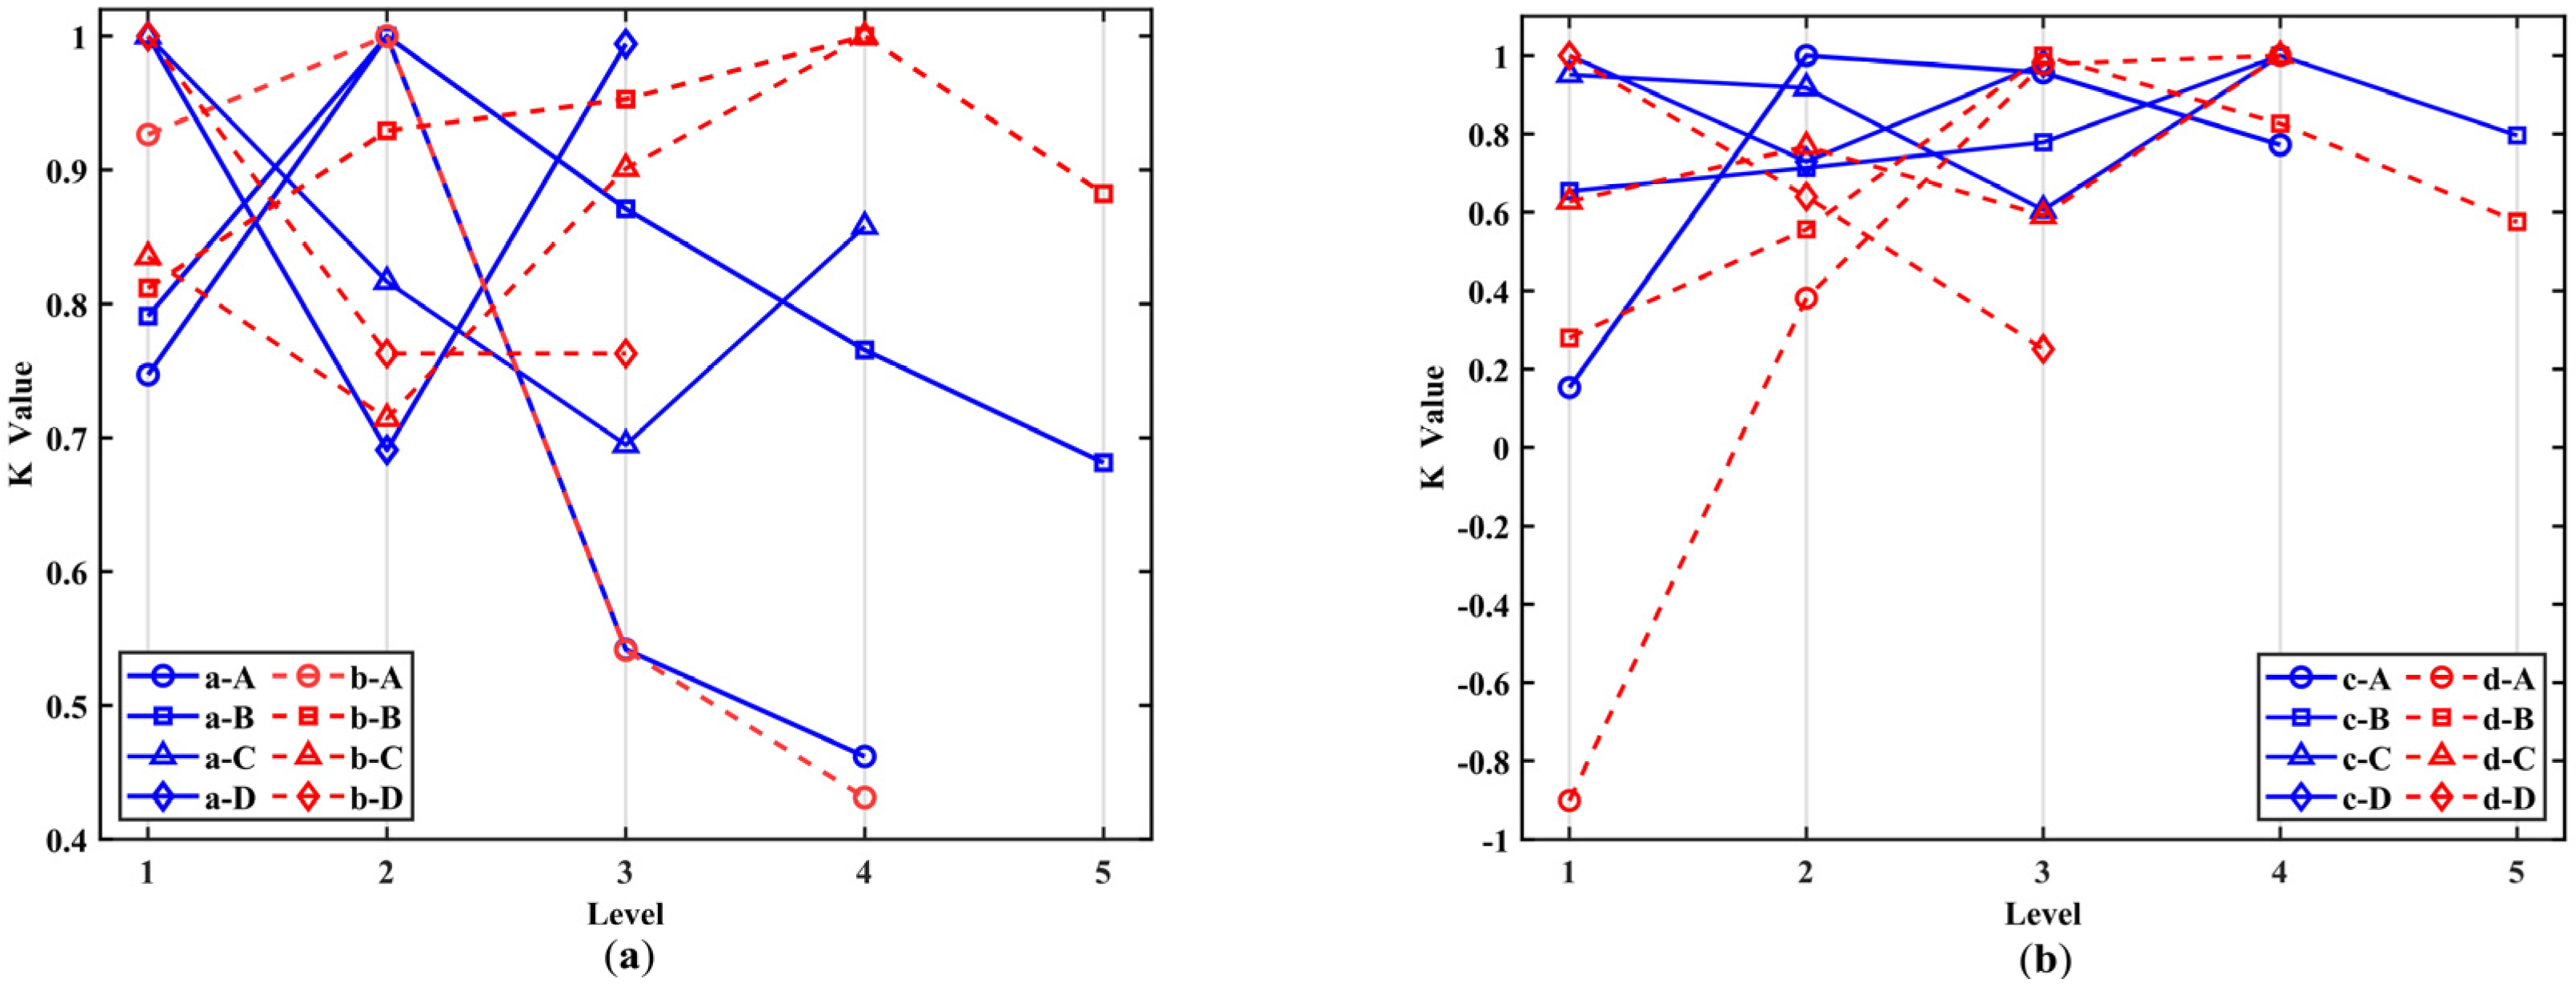
Those results can lead to K values as shown in Figure 12, and the K values are normalized to show the quality of design variables at different levels.
Through the sample calculation, the corresponding four optimal samples of aerodynamic characteristics are acquired according to K values and the combination is obtained. The orthogonal rationality is validated by CFD as shown in Table 6: The three optimal samples reach the expected optimal value, and the deviation of forward flight efficiency may be due to the influence of the duct’s inlet velocity on the blade’s angle of attack (AOA) during forward flight.
Through the CFD validation results, it is considered that the sample set of the rotor disk in the orthogonal experiment can characterize all the samples of the rotor disk. Take K values of rotor disk as input for TOPSIS evaluation and the rank value is obtained as shown in Figure 13. The numbers 1~5 marked above bars are design levels.
The structural parameters of the rotor disk determined according to the TOPSIS scoring results are shown in Table 7. The root angle is manipulated by a collective pitch during flight and is not given as a structural parameter.
4.2.2. The Orthogonal Experiment on the Duct
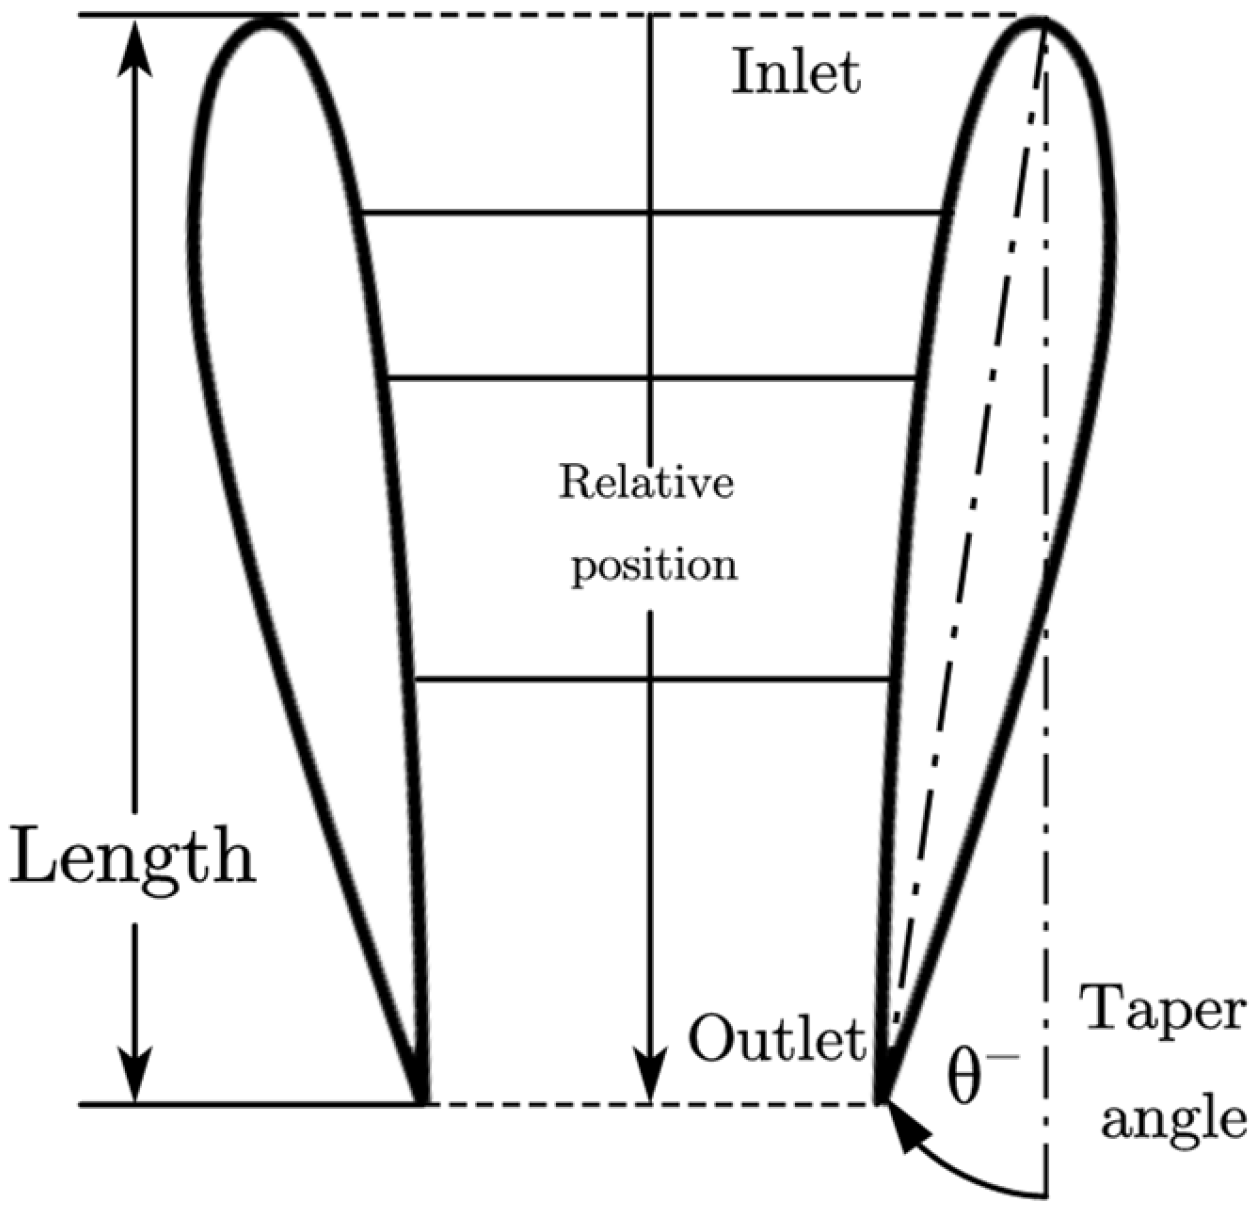
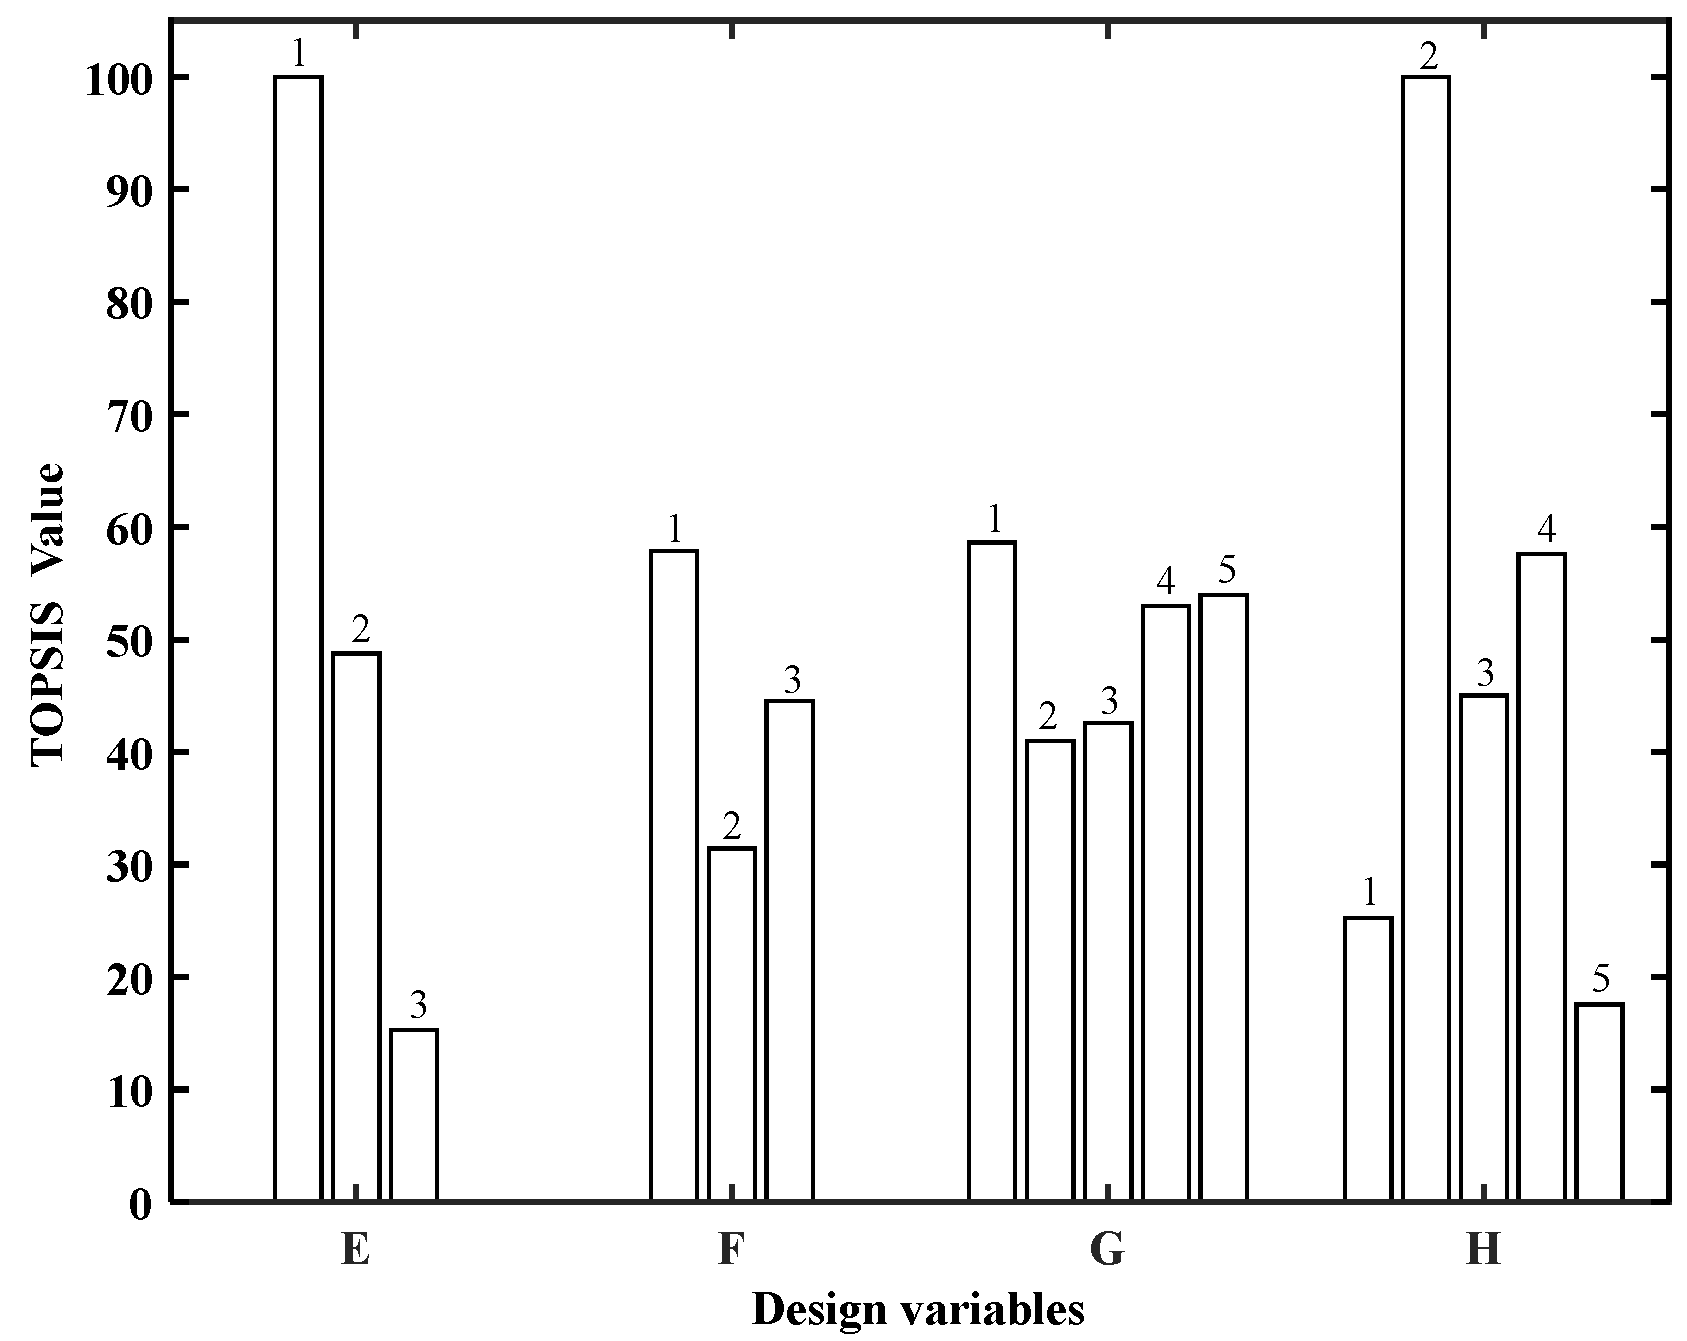
Since the rotor’s structural parameters are determined, the next step is to select the one in the duct. The duct is an annular airfoil. The airfoil, the relative rotor-duct position, the duct length, and the duct taper angle are marked as E, F, G, and H in design variables, and the design level is 1~5. The length of the duct is positively correlated with the thickness of the duct, which represents the size of the duct. Duct length and taper angle directly affect the windward area of the duct body in forward flight. The duct’s structure scheme is shown in Figure 14.
The root angle is adjusted to the optimal value according to the momentum-element model by the collective pitch: 36.9° in hover and 76° in forward flight. In the orthogonal experimental design with one round in hover flight and the other in forward flight, each round has , counting a total of 50 samples. The hovering set altitude is sea level, and the takeoff weight is 5000 kg. The set height for forward flight is 5 km, and the forward flight speed is 360 km/h. The orthogonal parameters field of the duct are shown in Table 8.
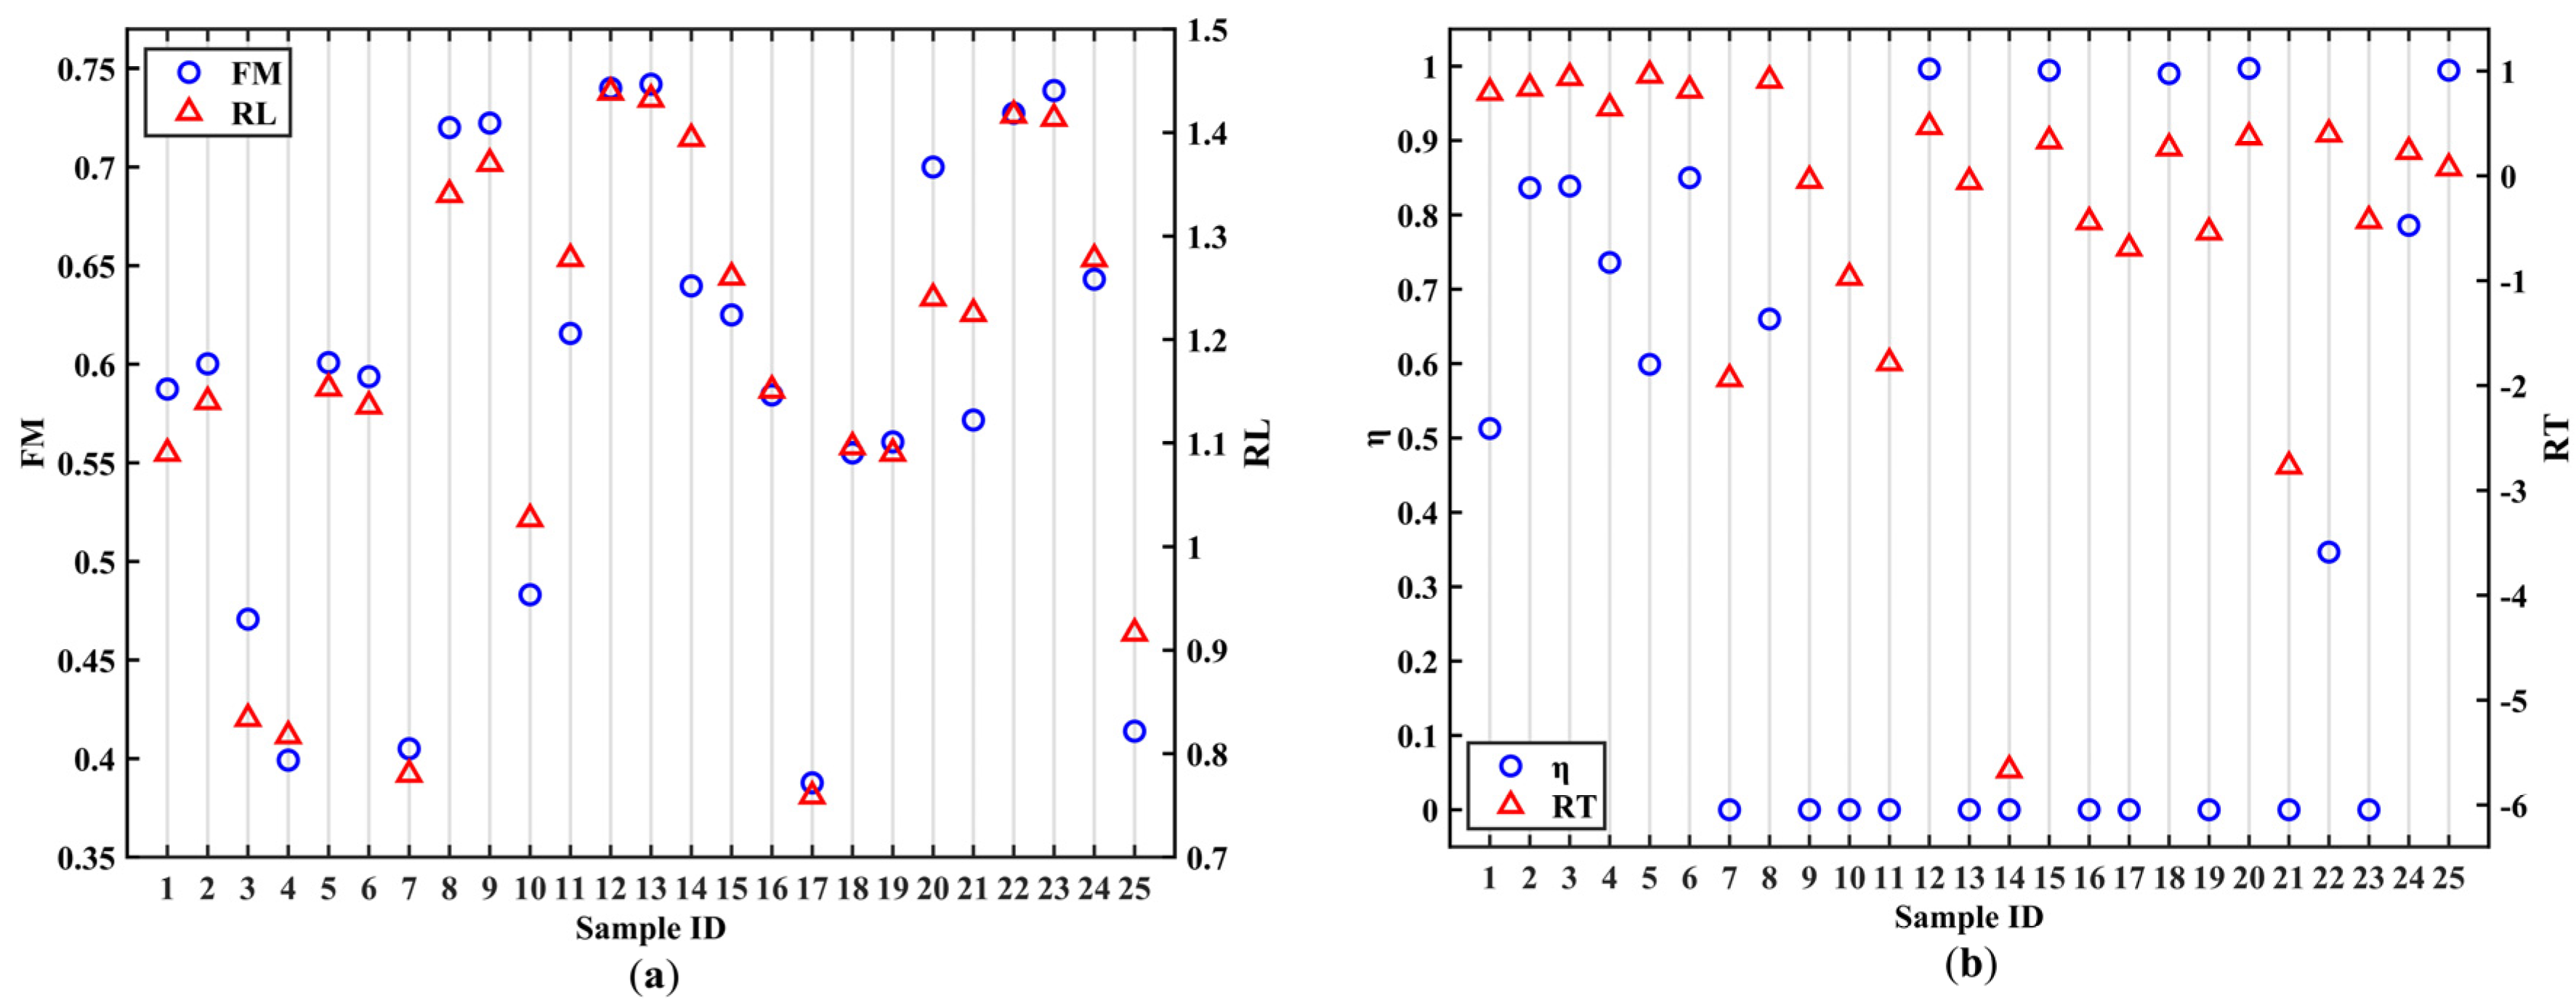
The duct’s sample results are presented in the form of a scatter chart shown in Figure 15 to avoid long data tables. From the results, it is also indicated that the best efficiency may not lead to the best force ratio but a poor efficiency tends to have a poor force ratio.
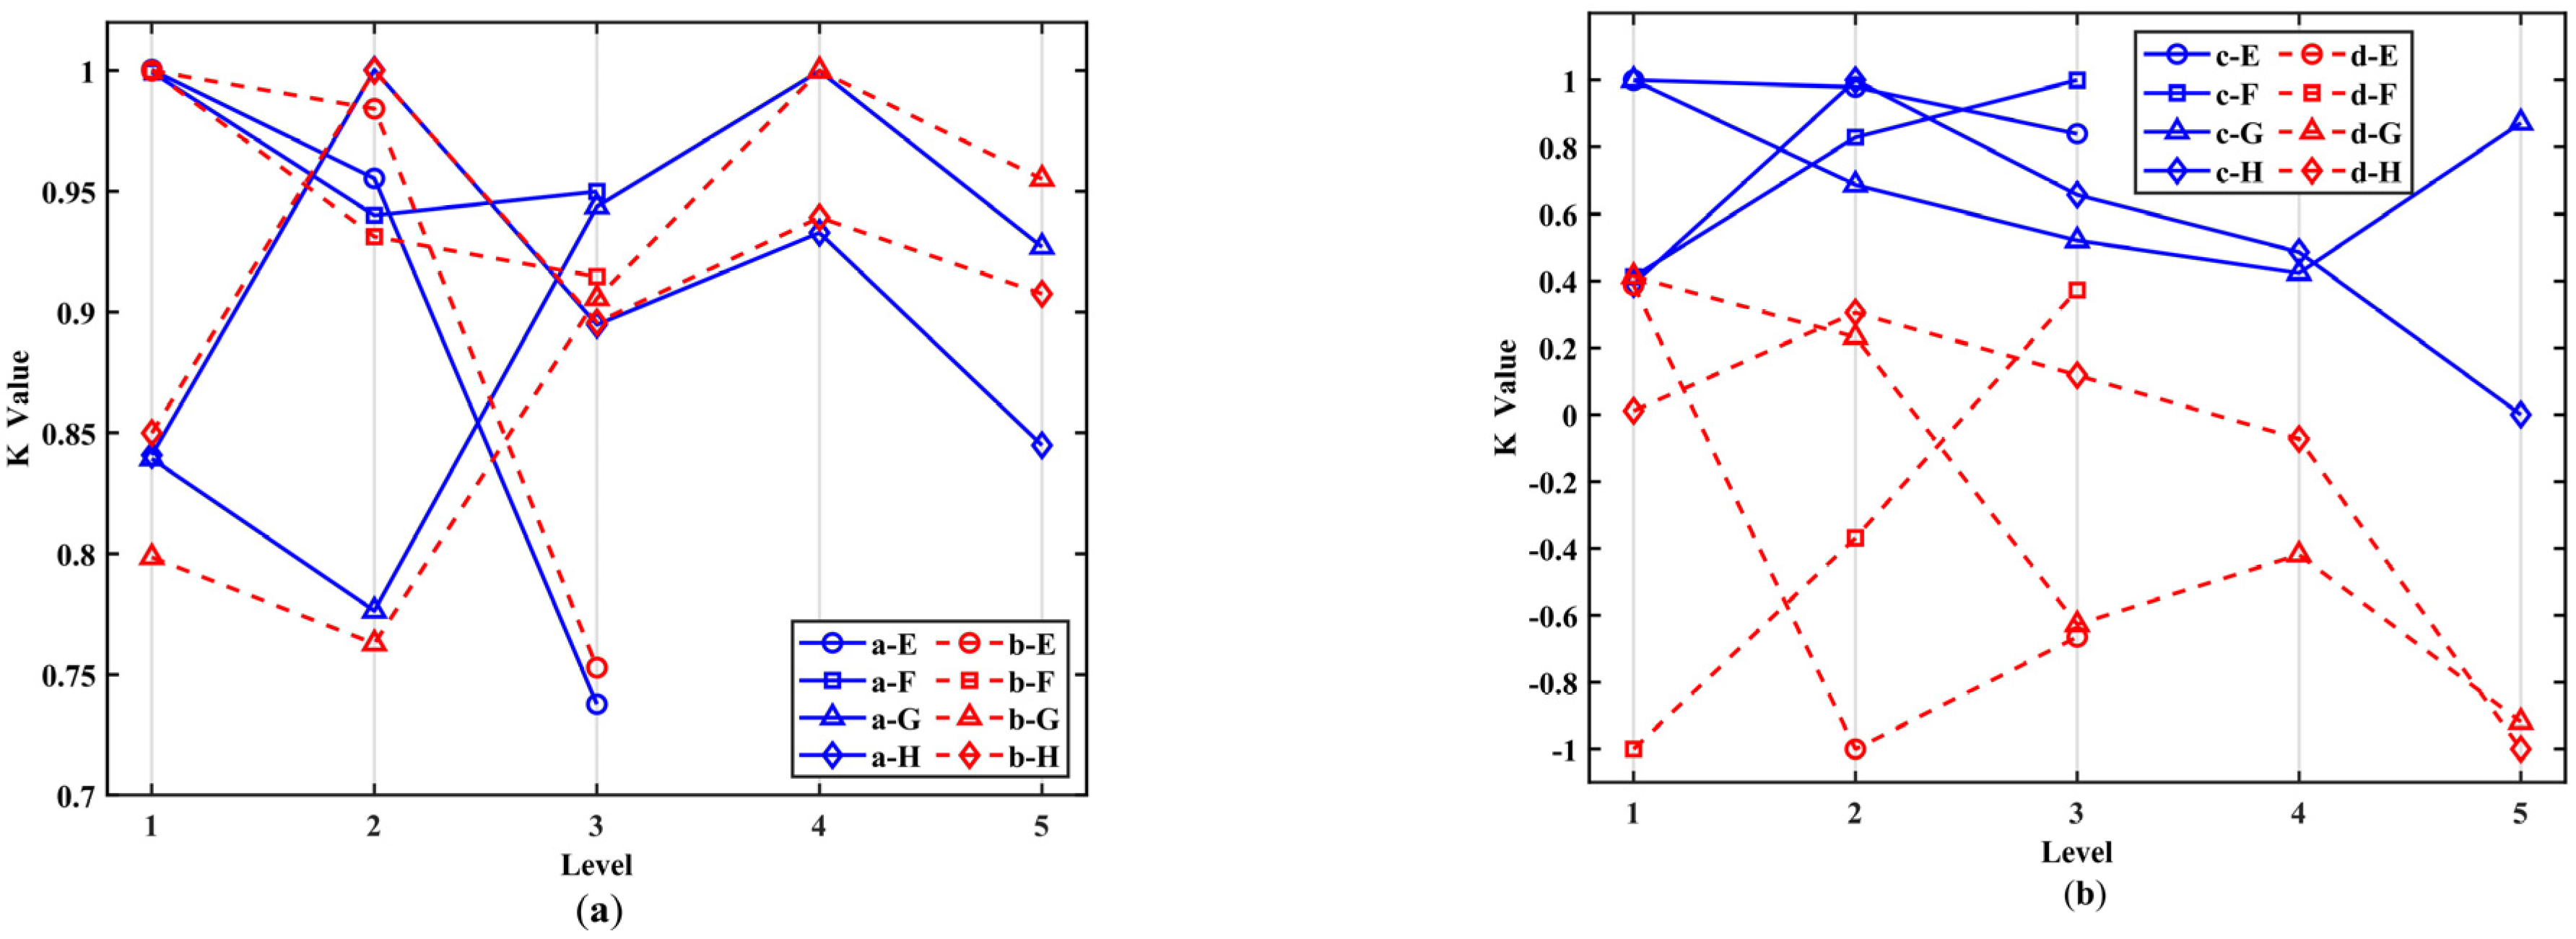
Those results can lead to K values as shown in Figure 16, and the K values are normalized to show the quality of design variables at different levels.
After the sample calculation and the optimization of K values, the expected optimal value is also reached except for the forward flight efficiency as shown in Table 9.
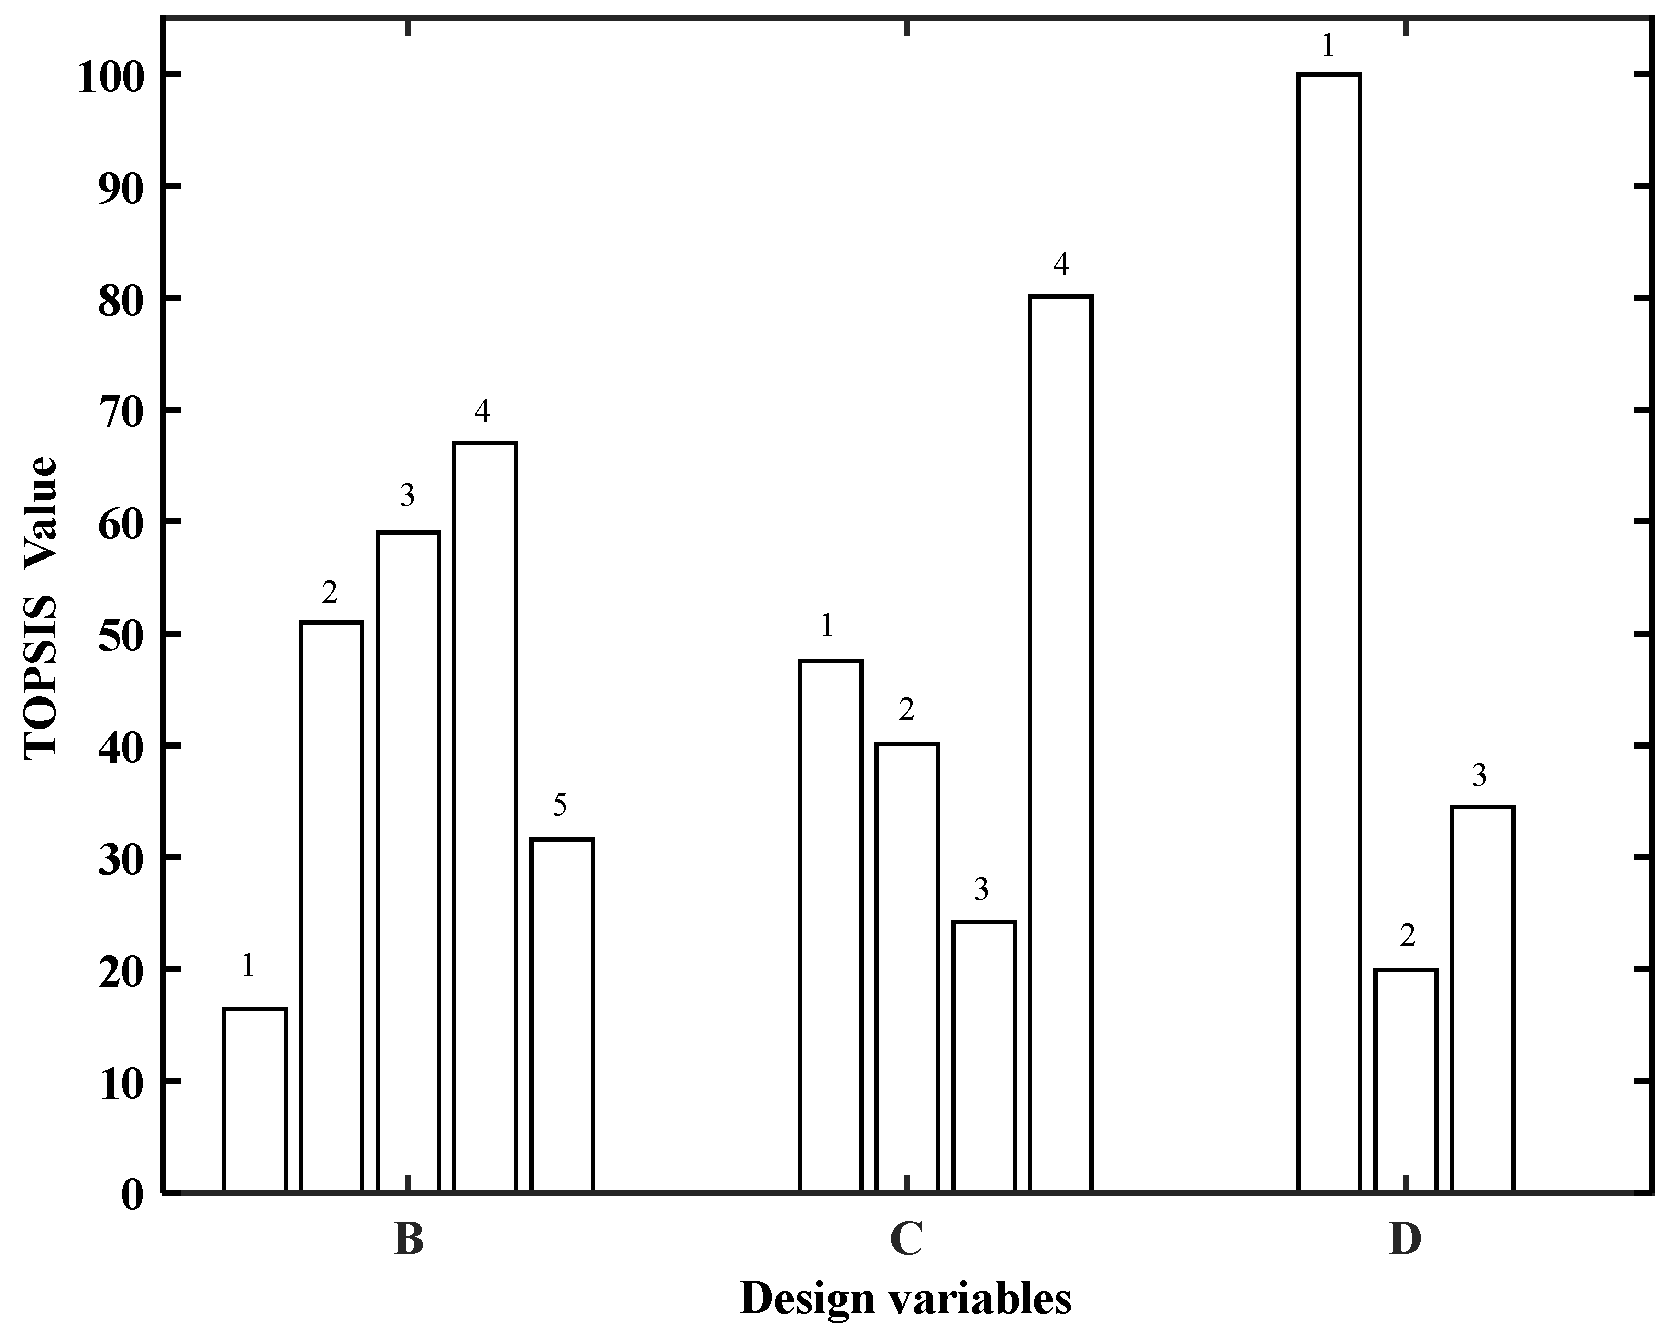
From the CFD validation results, it is considered that the sample set of the duct in the orthogonal experiment can characterize all the samples of the duct. Take K values of the duct as input for TOPSIS evaluation and the rank value is obtained as shown in Figure 17. The numbers 1~5 marked above bars are design levels.
The structural parameters of the duct determined according to the TOPSIS scoring results are shown in Table 10.
4.3. Flight Performance Validation
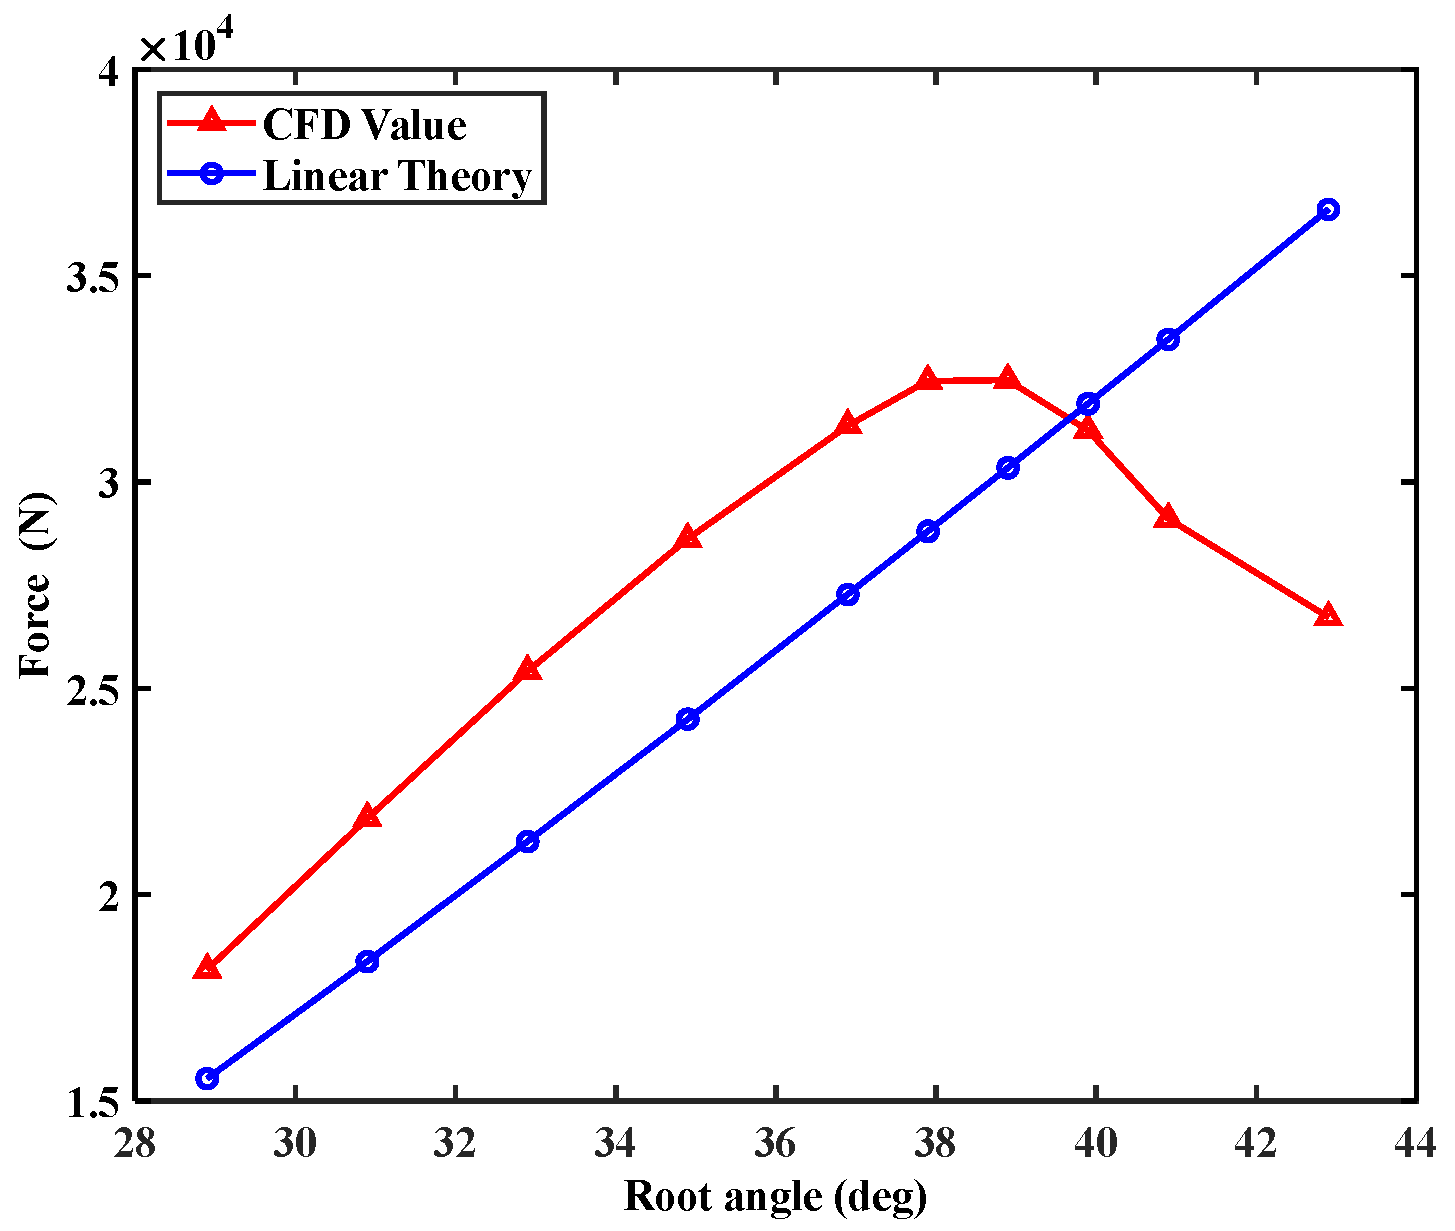
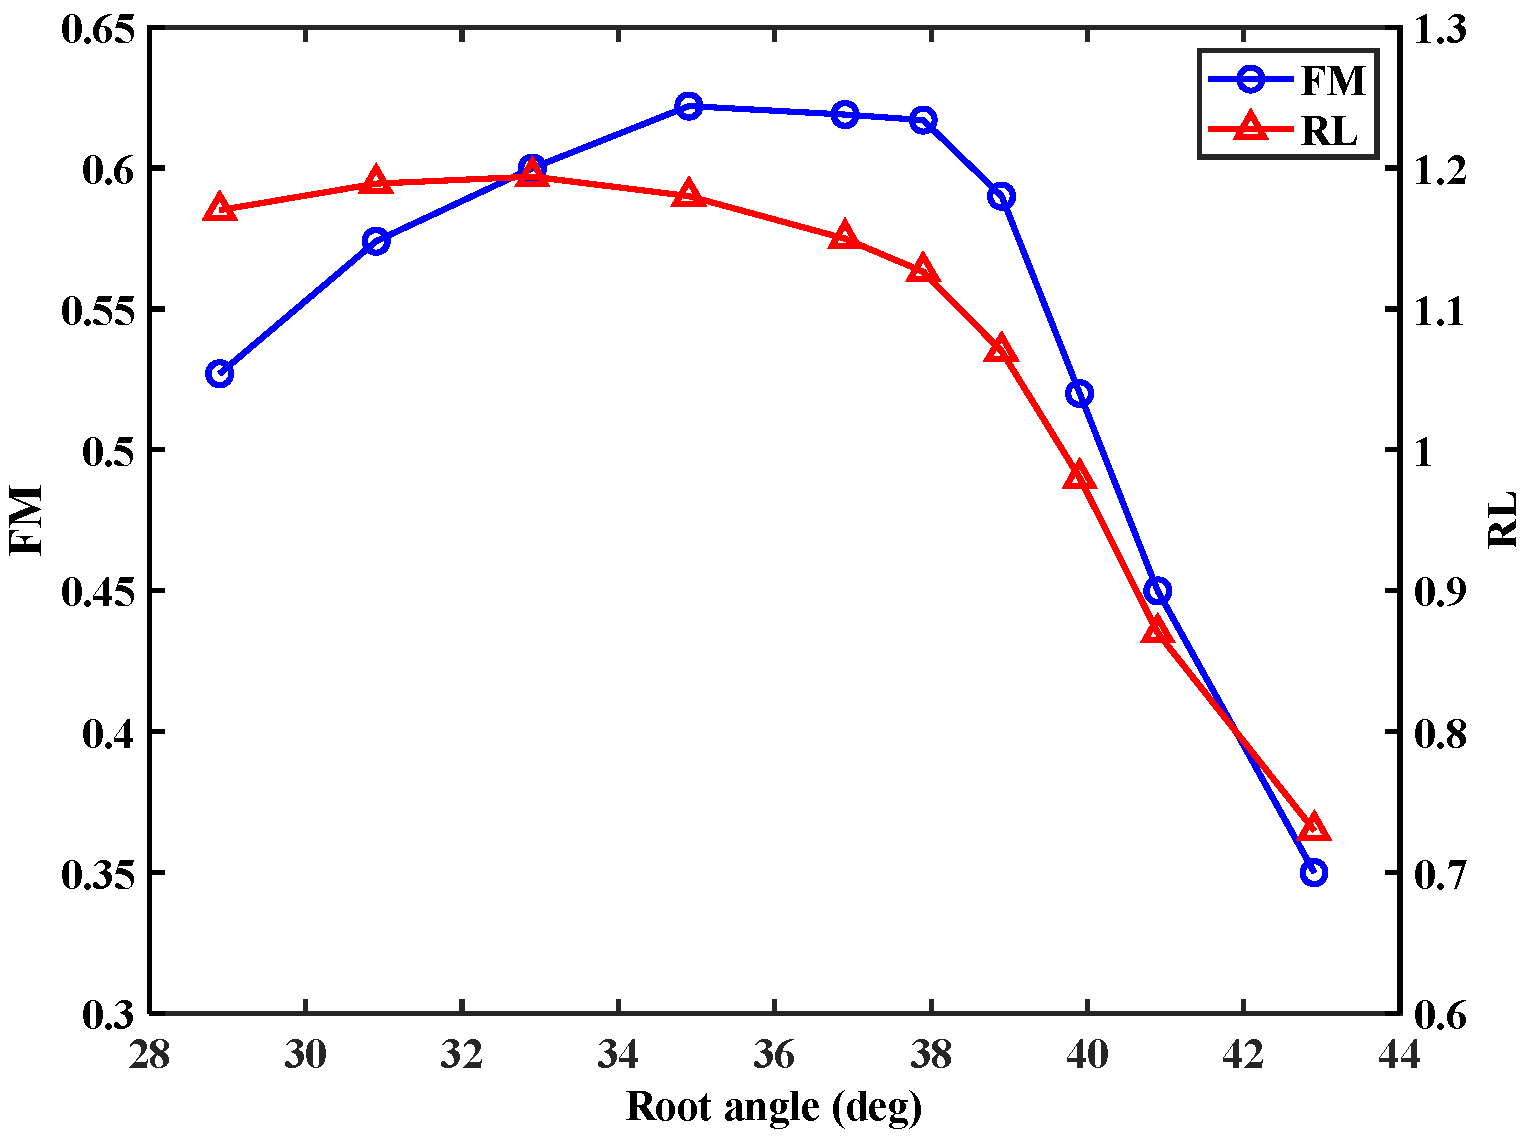
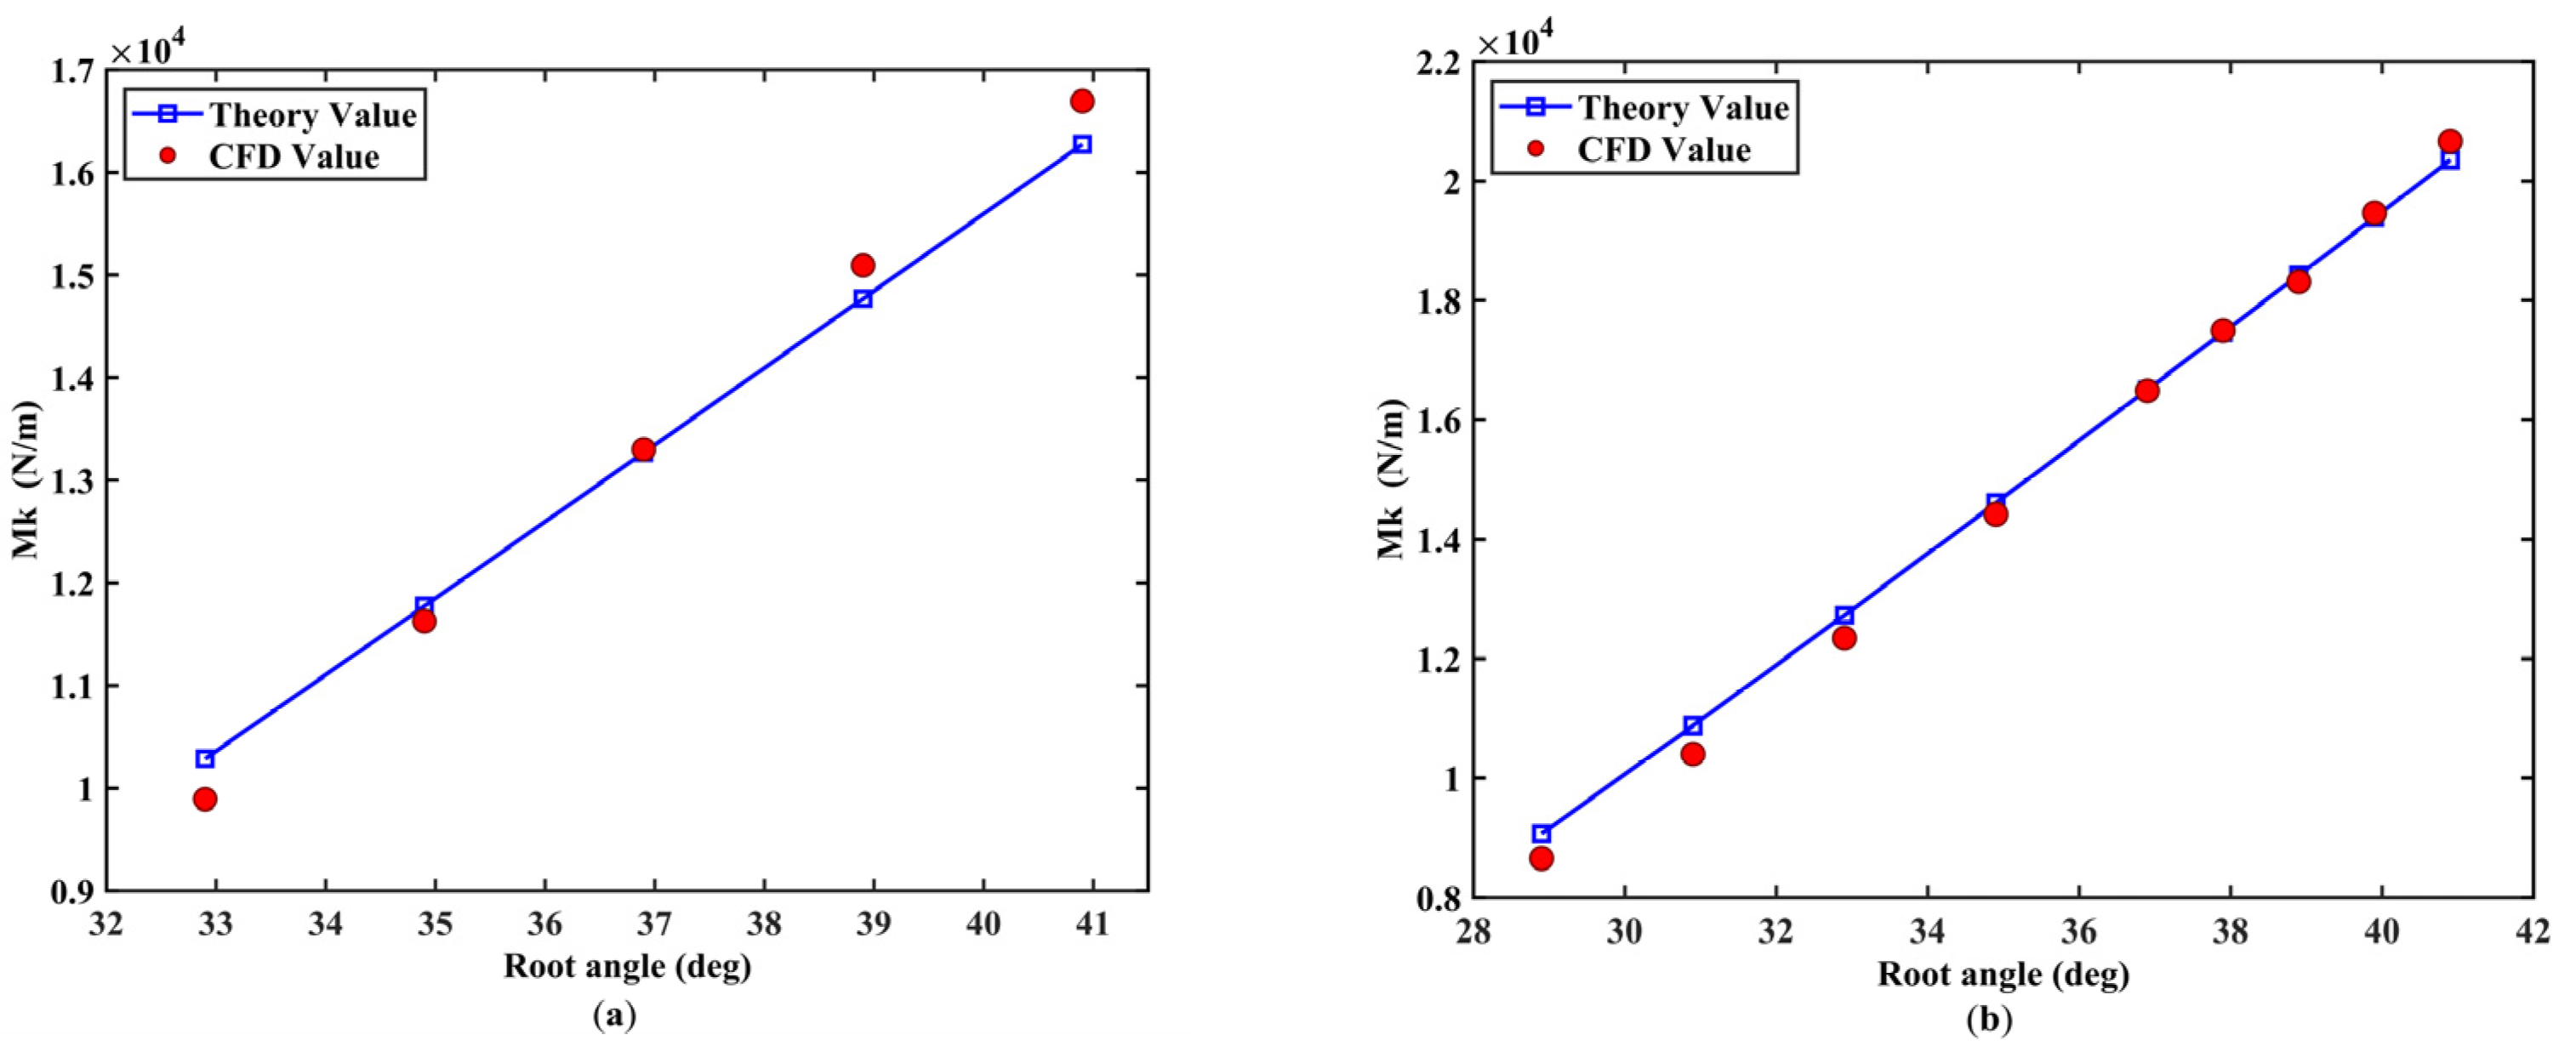
Based on the sample data of the orthogonal experiment and the collective pitch control according to the inlet velocity of the duct in hover and forward flight, the root angle is adjusted, and the rotor speed is calculated according to the momentum-element model. Before fitting the hovering performance coefficient, it is necessary to determine the variation range of blade pitch during hovering flight. To ensure that the blade lift section is in the linear section of the non-stall zone as shown in Figure 18 and the hovering efficiency can reach the level of the conventional helicopter as shown in Figure 19, the variation range of the root angle through the collective pitch is taken as 32.9°−37.9°. At the same time, within the collective pitch range, the RL of VDDF is also above 1 as shown in Figure 19, which is in line with the equipment purpose of the duct.
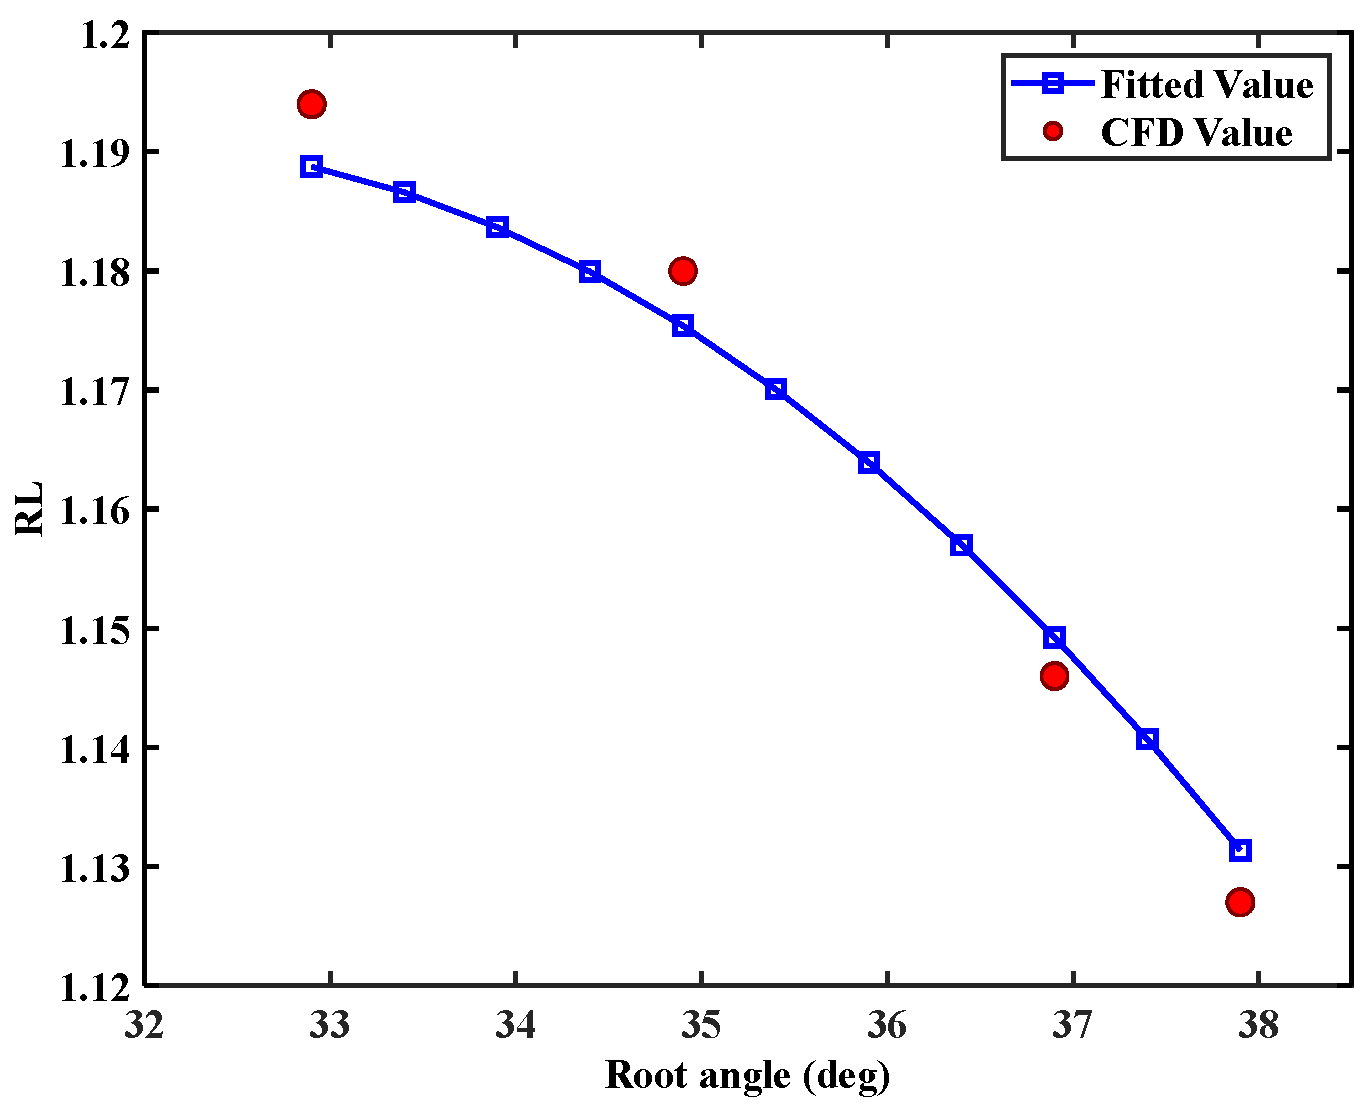
RL and Mk are fitted within the collective pitch range, and the fitting degree meets engineering requirements after CFD validation as shown in Figure 20 and Figure 21.
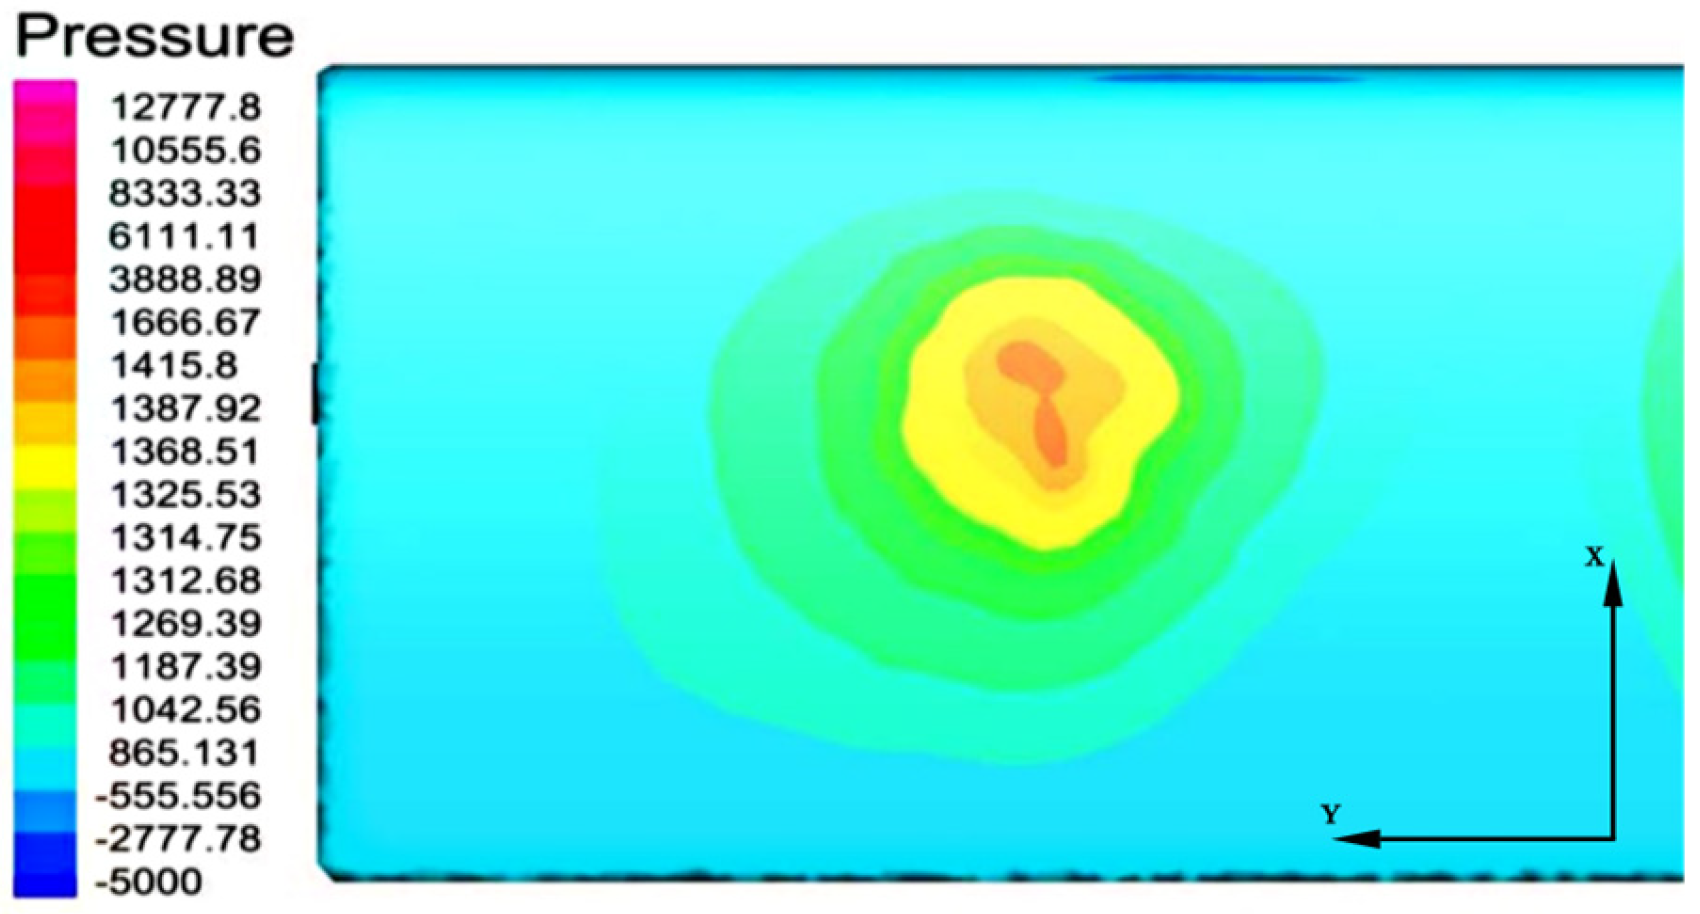
Furthermore, the rotor speed needs to be further increased in hover flight to compensate for the download effect of the duct wake on the wing (about 10~15% of the lift of the ducted fan). The download effect comes from the interference of the duct wake on the wing, which is the largest during hovering and decreases with the tilting of the ducted fan and the increase of the aircraft’s forward speed. Under the high-speed forward flight, there is no area on the wing disturbed by the duct wake, and the downloading force on the wing is zero. In Figure 22, whose X-axis points to the forward flight direction and the Y-axis points to the wing tip on the left side, the download pressure is concentrated in the wake region of the duct and produces a circumferential divergence on the upper surface of the wing. It is worth noting that, due to the vortex effect of the wake, the area with the highest download pressure is not directly on the central axis of the duct.
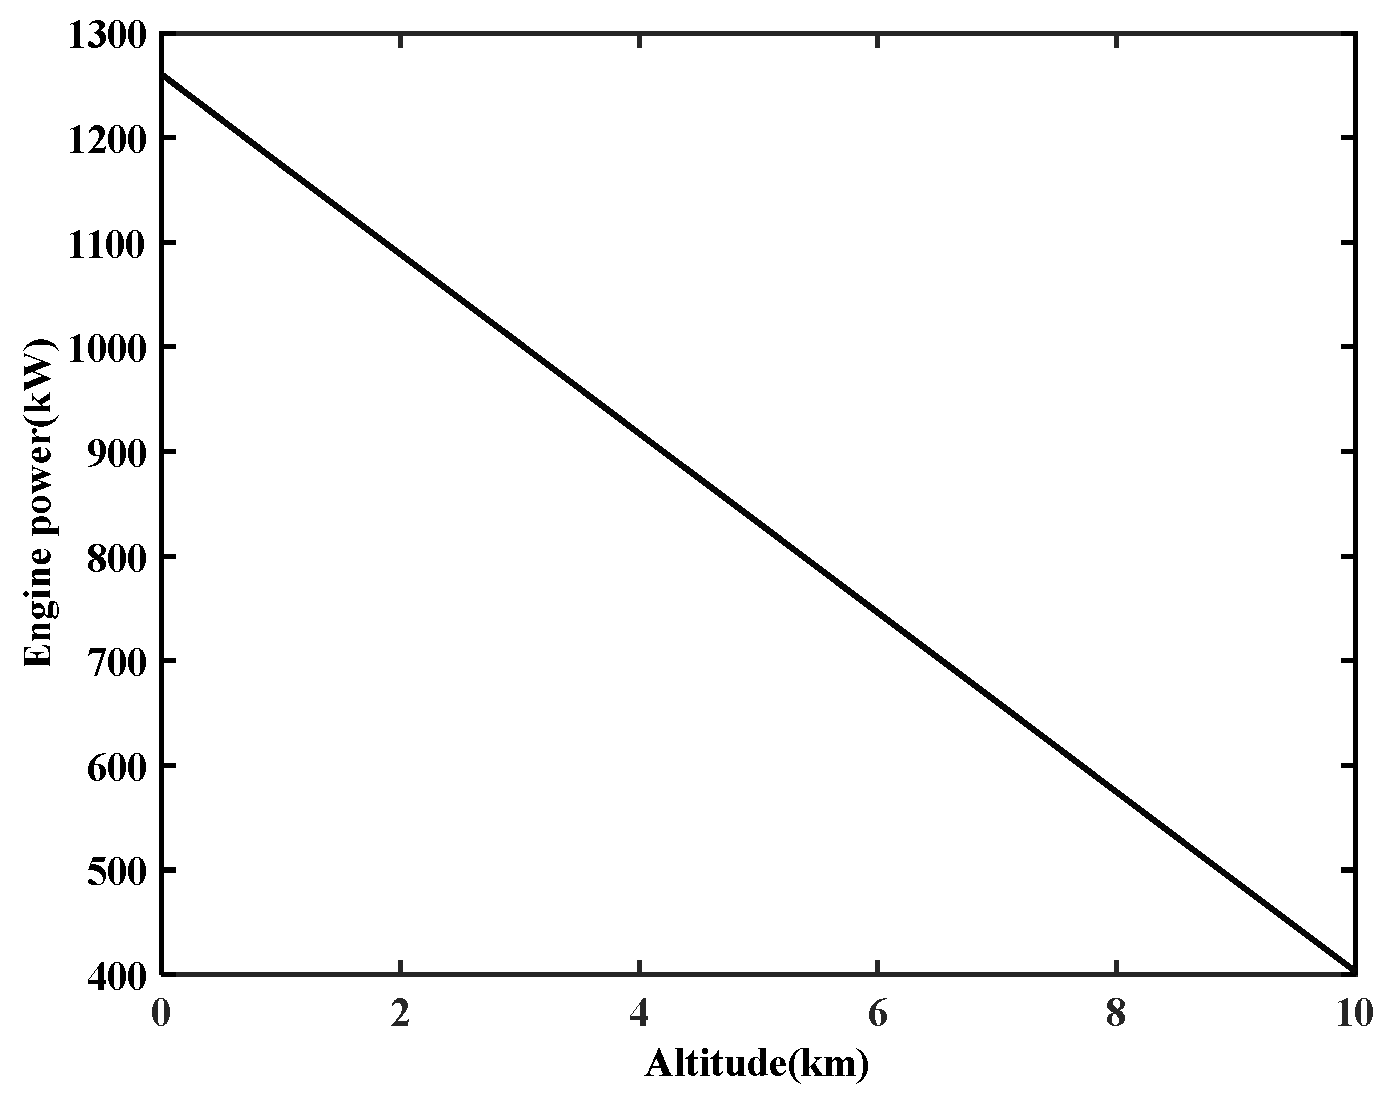
Taking into account the design goal requirements, the maximum download effect, the tonnage matching engine series [23], and the altitude characteristics of typical turboshaft engines [24] as shown in Figure 23, Ardiden 3C [25], whose max engine power is about 1500 kW, is selected as the powerplant of a single VDDF. The hovering speed is set at 68.2 rad/s, the rotor root angle is 33.8° at sea level, the hovering ceiling is 2 km, and the rotor root angle is 37.9°.
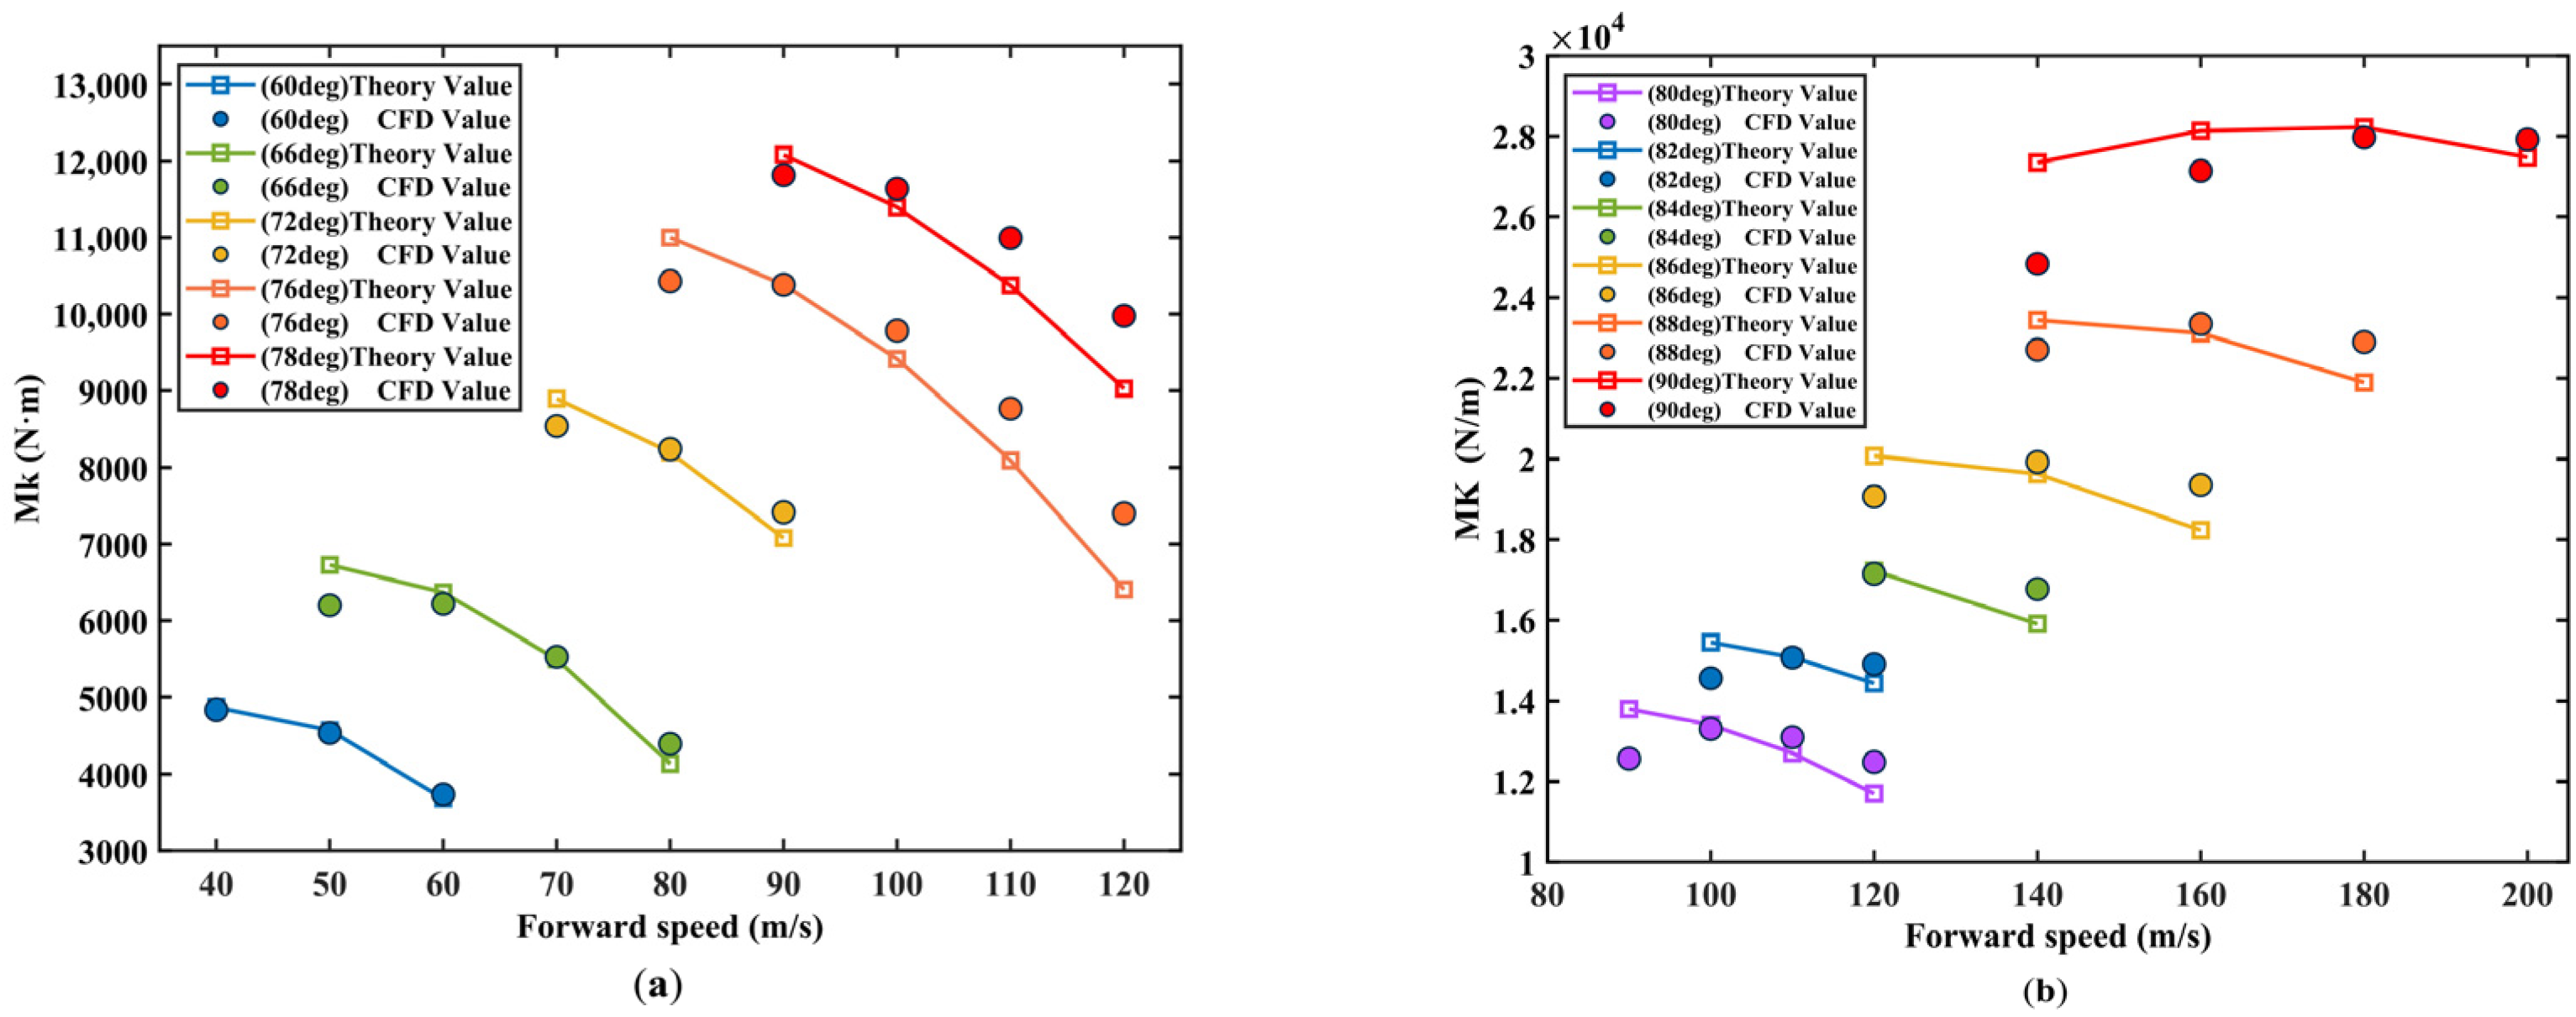
To ensure the applicability of the calculation model under different forward flight conditions, the Mk is theoretically calculated and compared with the CFD calculated value under the orthogonal range of different pitch and forward flight speeds as shown in Figure 24. In the case of binary, the orthogonal arrangement is a comprehensive arrangement. Noting that it is necessary to ensure that the blade AOA does not exceed the stall point of the lift line and is not too small or even negative. The range of blade AOA was selected from 5° to 15°.
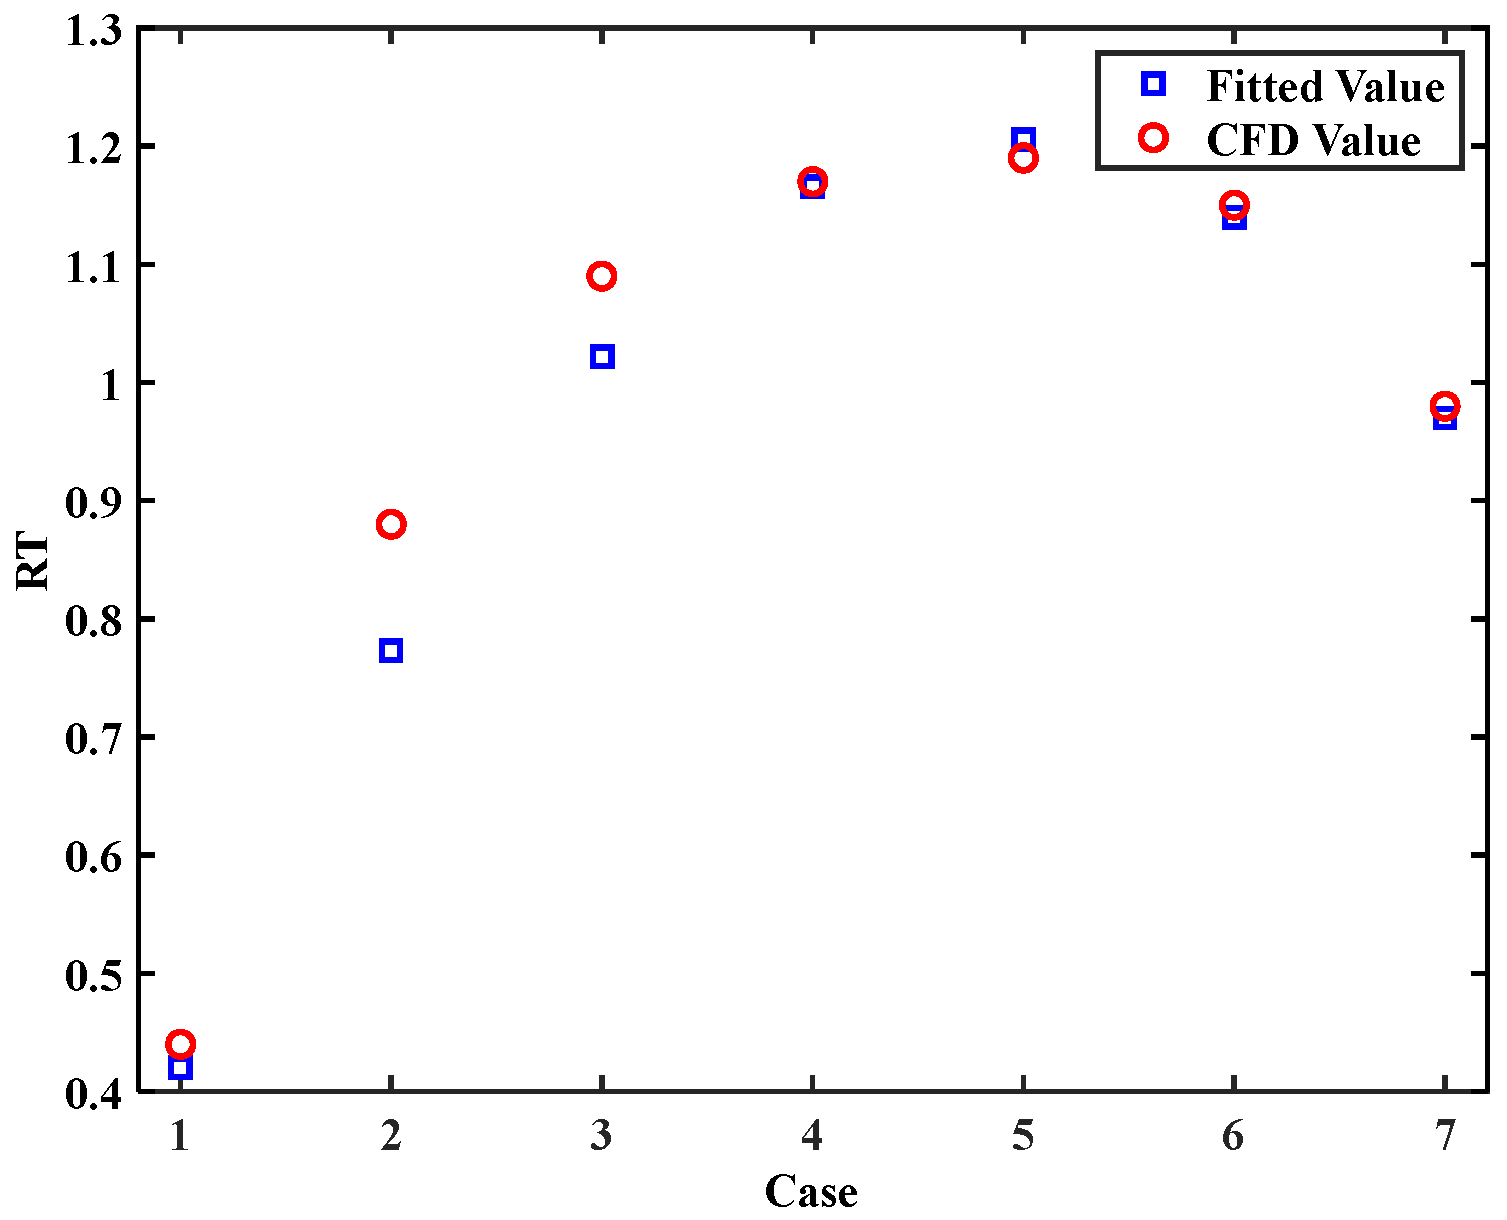
RT is also fitted well with the CFD calculation in different forward flight conditions as shown in Figure 25 and gives a fitting case in the forward speed of 120 m/s.
Through the comparison of theoretical calculation and CFD calculation of different pitch and forward flight speeds, the maximum error between the two is about 0.1, which meets the engineering requirements. The theoretical method will be used to calculate the power of VDDF.
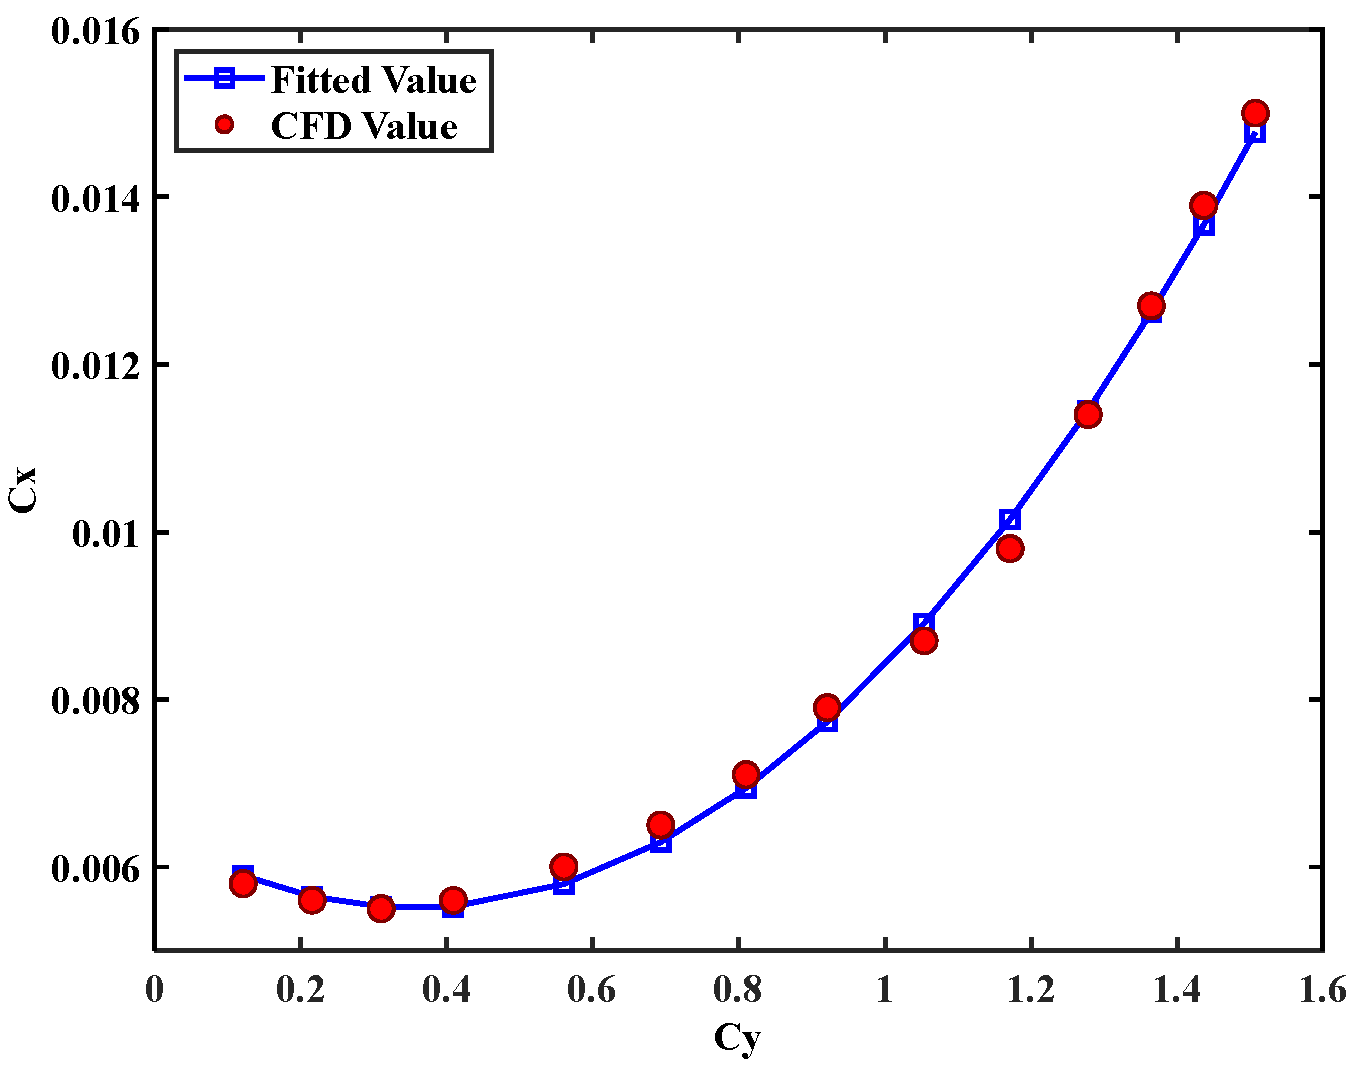
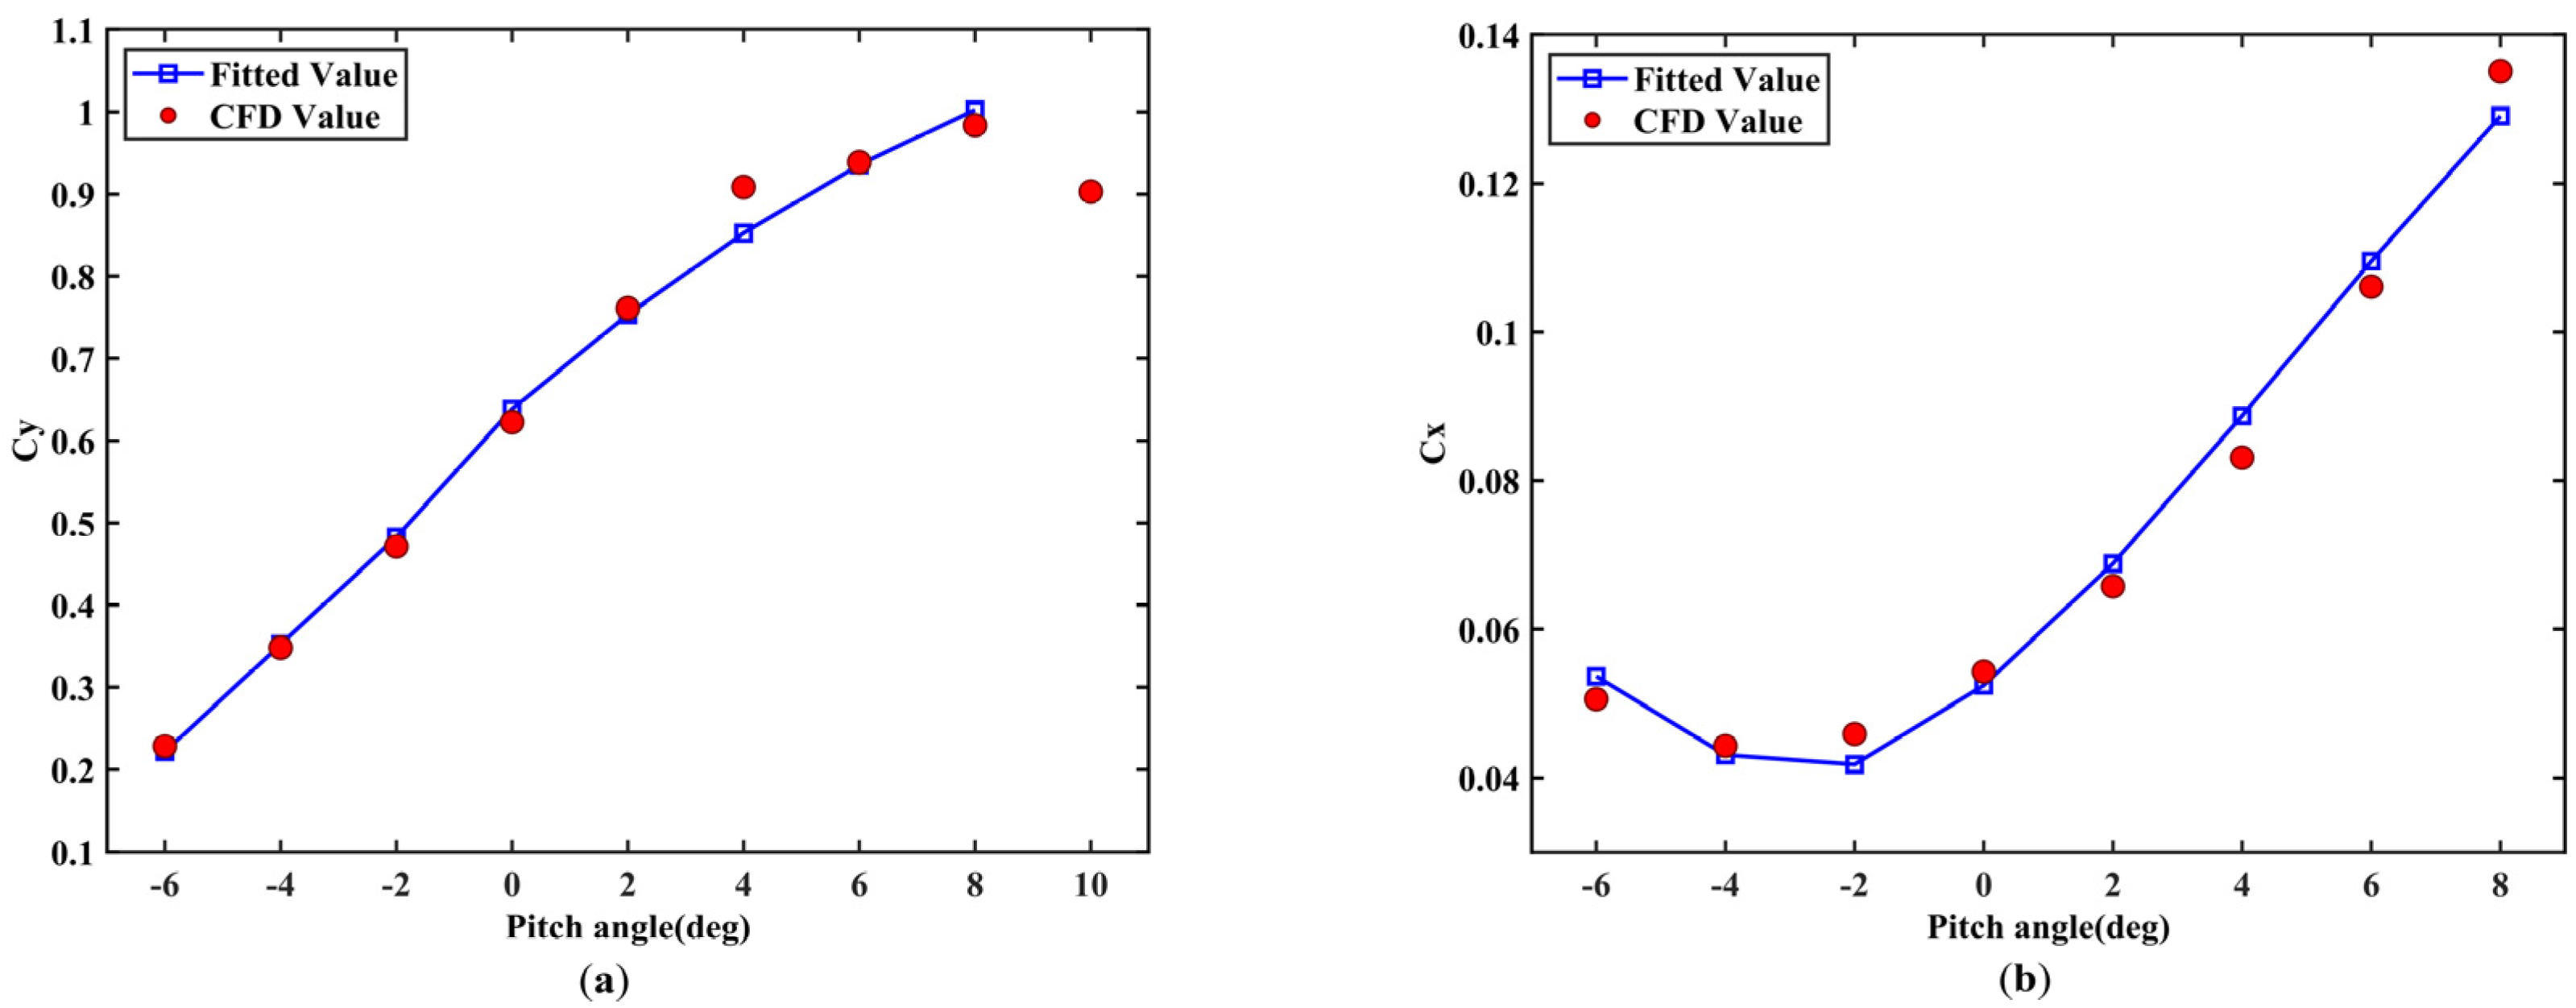
In the aircraft pitch fitted results as shown in Figure 26, the maximum error of lift and drag coefficients at different pitching angles is about 0.1, which can represent the actual lift and drag coefficients of the aircraft at different pitch angles. From the lift coefficient, it can be known that the aircraft enters into a stall after exceeding 8°, and −6°−8° is taken as the variation range of aircraft pitch angles.
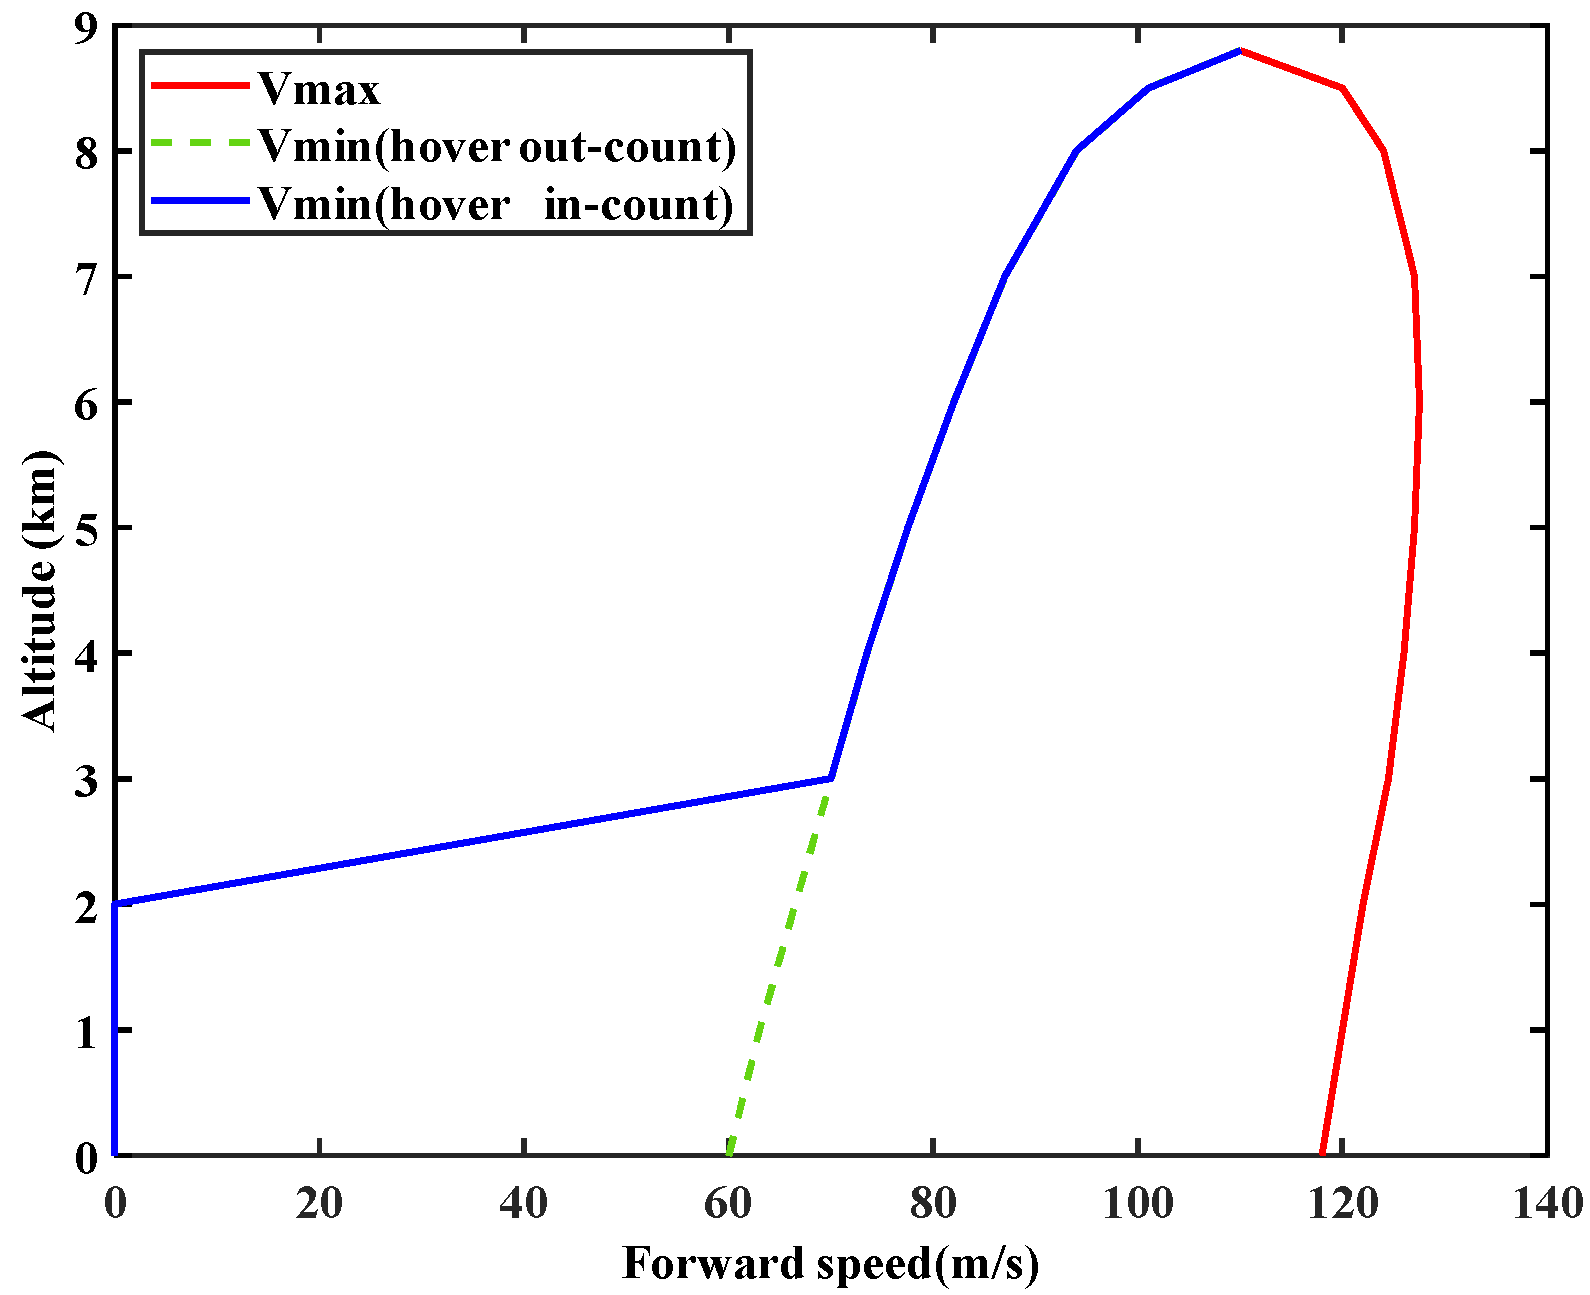
Using the above power calculation model and fitted data, the flight performance of the aircraft equipped with VDDF can be seen visually from the flight envelope shown in Figure 27. The maximum level flight speed at 6 km is 127.5 m/s, and the maximum service lift limit is 8.8 km. In the actual flight process, the actual flight envelope should be modified according to the flight test data due to the influence of the structural stiffness, strength, and handling stability of the airframe.
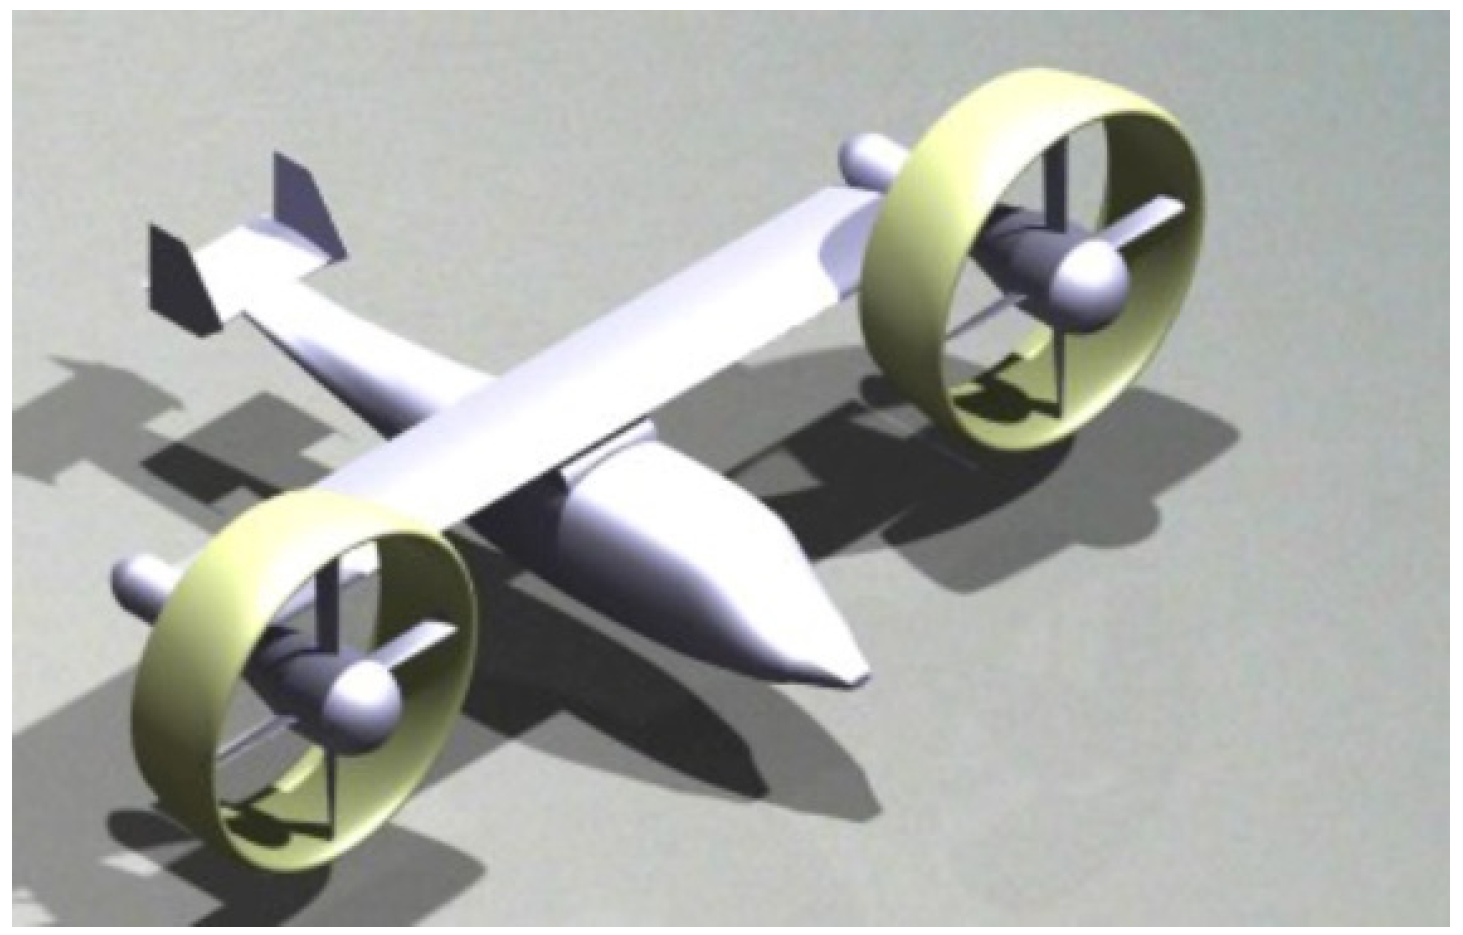
According to the set working goal, the rotor root angle is 75° at 5 km altitude as a cruise state in 36 0 km/h forward speed and η reaches 0.72. The CFD calculation shows that all flight performances reach goal values. In the calculation, the maximum takeoff weight of the whole aircraft is set and the slipstream effect between the VDDF and the airframe is considered. Figure 28 gives a view of the eventually designed retrofit.
5. Discussion
In this paper, the orthogonal experiment model is creatively proposed to select the structural parameters of VDDF. Through TOPSIS evaluation and CFD validation, the structural parameters of VDDF under hover and forward flight conditions are obtained, and the flight performance of the retrofit is validated to meet the requirements. It is worth noting that better flight performance is available but engines may put forward higher requirements. Compared with previous relevant studies, the sample range is larger, the orthogonality is better, and it is more convincing. During the study, the following conclusions were obtained from the orthogonal optimization results:
- For the rotor in the duct, a larger blade aspect ratio, and smaller blade twist can obtain a better FM; smaller blade aspect ratio and larger blade twist are suitable for forward flight. Four blades are the best in both modes.
- For the duct body, the larger size and the ahead relative position of the rotor-duct are more suitable for the hovering flight; the smaller size and the rear relative position of the rotor-duct are more suitable for the forward flight. However, it should be noted that the relative position should not be too close to the duct inlet or outlet to avoid weakening the lifting/propelling effect of the duct and causing irrationality in the structural layout. The aerodynamic characteristics are the best when the duct taper angle is −4° in both modes.
Mentioning the novelty of the research, the research innovatively combined the variable diameter rotor and variable diameter duct as a component for an overall design. Although the aerodynamic methods, orthogonal methods, and evaluation methods used in the study are all well-developed methods, the object of the research, the established calculation process, and the iterative method are innovative. The research not only considers the optimal aerodynamic characteristics of the rotor and the duct itself but also comprehensively considers the mutual interference between the two through the orthogonal method and TOPSIS evaluation, which is a great improvement compared to previous related research. Furthermore, the VDDF concept can be developed to modularity, which means that VDDF can not only be applied to existing aircraft but also to common vehicles like flying cars. Because of the excellent vectorial, future research should focus on the aerodynamic characteristics in the transition flight phase and the application of VDDF on common vehicles.
Due to the limitations of numerical simulation, the selection of specific structural parameters still needs a wind tunnel test and ground flight test. However, the calculation method, orthogonal experimental model, and relevant conclusions in the paper can provide a qualitative reference for follow-up research on the structural design, overall design, flight performance calculation, and control method design of VDDF, and have beneficial value.
Author Contributions
Conceptualization, Y.G.; methodology, Y.G.; validation, Y.X.; formal analysis, Y.X.; writing—original draft preparation, Y.X.; writing—review and editing, Y.G.; funding acquisition, Y.G. All authors have read and agreed to the published version of the manuscript.
Funding
This research was funded by Priority Academic Program Development of Jiangsu Higher Education Institutions.
Institutional Review Board Statement
Not applicable.
Informed Consent Statement
Not applicable.
Data Availability Statement
Not applicable.
Conflicts of Interest
The authors declare no conflict of interest.
References
- Martin, S.; Ostlund, R. V-22 Osprey developmental status. In Proceedings of the Aircraft Design and Operations Meeting, Seattle, WA, USA, 31 July–2 August 1989; p. 2113. [Google Scholar]
- Fradenburgh, E. Development of the TRAC variable diameter rotor concept. In Proceedings of the VTOL Research, Design, and Operations Meeting, Atlanta, GA, USA, 17–19 February 1969; p. 221. [Google Scholar]
- Brender, S.; Mark, H.; Aguilera, F. The Attributes of a Variable-Diameter Rotor System Applied to Civil Tiltrotor Aircraft; NASA: Washington, DC, USA, 1996.
- Xue, L.; Shao, S.; Zhang, C. Design of a Variable-diameter Tilt-rotor. Mech. Sci. Technol. Aerosp. Eng. 2008, 27, 1202–1206. [Google Scholar] [CrossRef]
- Mistry, M.; Gandhi, F. Helicopter performance improvement with variable rotor radius and RPM. J. Am. Helicopter Soc. 2014, 59, 17–35. [Google Scholar] [CrossRef]
- Cole, J.A.; Krebs, T.; Barcelos, D.; Bramesfeld, G. Influence of Propeller Location, Diameter, and Rotation Direction on Aerodynamic Efficiency. J. Aircr. 2021, 58, 63–71. [Google Scholar] [CrossRef]
- Oweis, G.F.; Fry, D.; Chesnakas, C.J.; Jessup, S.D.; Ceccio, S.L. Development of a Tip-Leakage Flow—Part 1: The Flow Over a Range of Reynolds Numbers. J. Fluids Eng. 2006, 128, 751–764. [Google Scholar] [CrossRef]
- Oweis, G.F.; Fry, D.; Chesnakas, C.J.; Jessup, S.D.; Ceccio, S.L. Development of a Tip-Leakage Flow Part 2: Comparison Between the Ducted and Un-ducted Rotor. J. Fluids Eng. 2006, 128, 765–773. [Google Scholar] [CrossRef]
- Graf, W.; Fleming, J.; Ng, W. Improving ducted fan UAV aerodynamics in forward flight. In Proceedings of the 46th AIAA Aerospace Sciences Meeting and Exhibit, Reno, NV, USA, 7–10 January 2008; p. 430. [Google Scholar]
- Yilmaz, S.; Erdem, D.; Kavsaoglu, M.S. Performance of a ducted propeller designed for UAV applications at zero angle of attack flight: An experimental study. Aerosp. Sci. Technol. 2015, 45, 376–386. [Google Scholar] [CrossRef]
- Su, L. Aerodynamic Performance Calculation of Ducted Fan and Optimization of Duct Profile Parameters. Master’s Thesis, Tsinghua University, Beijing, China, 2019. [Google Scholar]
- Gao, Y. CFD Analysis of Helicopter Ducted Tail Rotor on Aerodynamic Characteristics and Impact of Structural. Master’s Thesis, Nanjing University of Aeronautics and Astronautics, Nanjing, China, 2010. [Google Scholar]
- Li, X.; Guo, Z.; Liu, Z. Influence of ducted fan profile parameters on aerodynamic characteristics. J. Natl. Univ. Def. Technol. 2016, 38, 28–33. [Google Scholar] [CrossRef]
- Feng, X. Research on the Design of Ducted Blades of A Rotorcraft. Master’s Thesis, Nanjing University of Aeronautics and Astronautics, Nabjing, China, 2019. [Google Scholar]
- Jorgensen, P.C. A Closer Look at All Pairs Testing. In Software Testing, 4th ed.; Auerbach Publications: New York, NY, US, 2013; pp. 395–406. [Google Scholar]
- Cem Kaner, J.; Bach, J. Developing the Right Test Documentation. In Proceedings of the Pacific Northwest Software Quality Conference, Portland, OR, USA, 17–18 October 2001. [Google Scholar]
- Xu, J.; Fan, N.; Zhao, S. The study on aerodynamic characteristics of duct body of ducted fan aircraft. J. Proj. Rocket. Missiles Guid. 2009, 29, 174–178. [Google Scholar]
- Zuo, Z. Tiltrotor Aircraft Conceptual/Preliminary Design and Optimization. Master’s Thesis, Nanjing University of Aeronautics and Astronautics, Nanjing, China, 2016. [Google Scholar]
- Matuska, D.; Dale, A.; Lorber, P. Wind Tunnel Test of a Variable-Diameter Tiltrotor (VDTR) Model; NASA: Washington, DC, USA, 1994.
- Zhang, Y. Future development of helicopter transport aircraft in China. China Eng. Sci. 2002, 8, 1–7. [Google Scholar]
- Lee, H.D.; Kwon, O.J. Detailed aerodynamic analysis of a shrouded tail rotor using an unstructured mesh flow solver. Trans. Jpn. Soc. Aeronaut. Space Sci. 2004, 47, 23–29. [Google Scholar] [CrossRef] [Green Version]
- Zhang, C.; Guo, C. Overall Design of the Helicopter, 1st ed.; National Defense Industry Press: Beijing, China, 2006. [Google Scholar]
- Hu, X. Handbook of World’s small and medium Aero Engines, 2nd ed.; Aviation Industry Press: Beijing, China, 2006. [Google Scholar]
- Seven, M.G. Helicopter Aerodynamic Manual, 2nd ed.; National Defense Industry Press: Beijing, China, 1978. [Google Scholar]
- Ardiden 3C, The First Jointly-Developed Aero Engine to be Entirely Certified in China. Available online: https://www.safran-group.com/products-services/ardiden-3c-first-jointly-developed-aero-engine-be-entirely-certified-china (accessed on 1 June 2022).
Figure 1.
Rotor’s airflow in the momentum-element model. (a) Momentum theory description. (b) Element theory description.
Figure 1.
Rotor’s airflow in the momentum-element model. (a) Momentum theory description. (b) Element theory description.

Figure 2.
The circular element in the momentum-element model.

Figure 3.
Distribution of experimental points with different design methods. (a) One-factor-at-a-time experiment. (b) Comprehensive experiment. (c) Orthogonal experiment.
Figure 3.
Distribution of experimental points with different design methods. (a) One-factor-at-a-time experiment. (b) Comprehensive experiment. (c) Orthogonal experiment.

Figure 4.
Orthogonal experiment flow.

Figure 5.
Lift drag coefficient of NACA23012 airfoil.

Figure 6.
Schematic diagram of aircraft pitching. (a) Negative pitch. (b) Horizontal. (c) Positive pitch.
Figure 6.
Schematic diagram of aircraft pitching. (a) Negative pitch. (b) Horizontal. (c) Positive pitch.

Figure 7.
Hover ceiling calculation flow.

Figure 8.
Flight envelope calculation flow.

Figure 9.
Z-9 helicopter prototype.

Figure 10.
The induced velocity at the rotor disk.

Figure 11.
Aerodynamic characteristics of rotor samples. (a) Hover flight. (b) Forward flight.

Figure 12.
The rotor’s normalized K value curve. (a) Hover flight. (b) Forward flight.

Figure 13.
TOPSIS evaluation of rotor disk.

Figure 14.
Duct’s structure scheme.

Figure 15.
Aerodynamic characteristics of duct samples. (a) Hover flight. (b) Forward flight.

Figure 16.
The duct’s normalized K value curve. (a) Hover flight. (b) Forward flight.

Figure 17.
TOPSIS evaluation of duct.

Figure 18.
VDDF lift force calculation in hovering.

Figure 19.
Hovering aerodynamic characteristics under different rotor root angles.

Figure 20.
RL fitted curve.

Figure 21.
Hovering Mk calculation at sea level. (a) 58 rad/s database. (b) 65 rad/s database.

Figure 22.
Download pressure nephogram of wing surface.

Figure 23.
Altitude characteristics of a typical turboshaft engine.

Figure 24.
Forwarding Mk calculation at 5 km in 56 rad/s. (a) 60°~78° database. (b) 80°~90° database.
Figure 24.
Forwarding Mk calculation at 5 km in 56 rad/s. (a) 60°~78° database. (b) 80°~90° database.

Figure 25.
RT fitted cases in 120 m/s database.

Figure 26.
The Cy and Cx of aircraft in different pitch angles. (a) Cy fitted curve. (b) Cx fitted curve.
Figure 26.
The Cy and Cx of aircraft in different pitch angles. (a) Cy fitted curve. (b) Cx fitted curve.

Figure 27.
The flight envelope of the retrofit.

Figure 28.
The retrofit equipped with VDDF.


Table 1.
A typical orthogonal table.
| Sample ID | Design Variables | Aerodynamic Characteristics | ||||||
|---|---|---|---|---|---|---|---|---|
| A | B | … | T | a | b | … | x | |
| 1 | A1 | B1 | … | T1 | a11 | a12 | … | a1x |
| 2 | A2 | B1 | … | T1 | a21 | a22 | … | a2x |
| n | Am | Bm | … | T1 | an1 | an1 | … | anx |
Table 2.
Flight performance of prototype and design goal.
| Performance | Prototype | Design Goal |
|---|---|---|
| Max Takeoff Weight | 4000 kg | 5000 kg |
| Hover ceiling(OGE) | 1050 m | 2000 m |
| Cruise altitude | ≤4500 m | ≥5000 m |
| Cruise speed | 293 km/h | ≥360 km/h |
| FM | - | 0.6 |
| - | 0.7 |
Table 3.
Validation of the CFD and momentum-element model.
| Rotor Force | Error | |
|---|---|---|
| CFD | Comparison Value | |
| 79.6 N | 88.2 N [Test] | 0.09 |
| 128 N | 143 N [Theory model] | 0.1 |
Table 4.
Invariable geometric parameters of the rotor in the orthogonal experiment.
| Geometry | Parameter | |
|---|---|---|
| Blade airfoil | NACA23012 | |
| Rotor radius R | 3 m (hover flight) | 2 m (forward flight) |
| Root-cut radius Rg | 0.6 m | |
| Disk-Duct clearance | 0.01 R | |
| Duct airfoil | NACA0018 | |
| Rotor-Duct relative position | 0.3 | |
| Duct length | 3 m | |
| Duct taper angle | 0° | |
Table 5.
Orthogonal parameters field of the rotor disk.
| Root Angle | Twist | Length | Num | Level | |
|---|---|---|---|---|---|
| Hover Flight | Forward Flight | ||||
| 26° | 56° | 7° | 0.75 m | 4 | 1 |
| 36° | 66° | 12° | 0.5 m | 6 | 2 |
| 46° | 76° | 17° | 0.375 m | 8 | 3 |
| 56° | 86° | 22° | 0.3 m | - | 4 |
| - | - | 27° | - | - | 5 |
Table 6.
Validation of rotor’s optimal sample combinations.
| Aerodynamic Characteristics | Combination | Result | Optimal or Not |
|---|---|---|---|
| a | A2B2C1D1 | 0.94 | Y |
| b | A2B4C4D1 | 1.3 | Y |
| c | A2B4C4D1 | 0.92 | N |
| d | A4B3C4D1 | 1.01 | Y |
Table 7.
Structural parameters of the rotor disk.
| Structure | Parameters |
|---|---|
| Twist | 22° |
| Chord length | 0.3 m |
| Blades’ number | 4 |
Table 8.
Orthogonal parameters field of the duct.
| Airfoil | Relative Position | Length | Taper Angle | Level |
|---|---|---|---|---|
| NACA0018 | 0.15 | 1.5 m | −8° | 1 |
| NACA4318 | 0.3 | 2 m | −4° | 2 |
| NACA4309 | 0.65 | 2.5 m | 0° | 3 |
| - | - | 3 m | 4° | 4 |
| - | - | 3.5 m | 8° | 5 |
Table 9.
Validation of duct’s optimal sample combinations.
| Aerodynamic Characteristics | Combination | Result | Optimal or Not |
|---|---|---|---|
| a | E1F1G4H2 | 0.75 | Y |
| b | E1F1G4H2 | 1.44 | Y |
| c | E1F3G1H2 | 0.66 | N |
| d | E1F3G1H2 | 1.09 | Y |
Table 10.
Structural parameters of the duct.
| Structure | Parameters |
|---|---|
| Airfoil | NACA0018 |
| Relative position | 0.15 |
| Length | 1.5 m |
| Taper angle | −4° |
Publisher’s Note: MDPI stays neutral with regard to jurisdictional claims in published maps and institutional affiliations. |
© 2022 by the authors. Licensee MDPI, Basel, Switzerland. This article is an open access article distributed under the terms and conditions of the Creative Commons Attribution (CC BY) license (https://creativecommons.org/licenses/by/4.0/).
Share and Cite
MDPI and ACS Style
Gao, Y.; Xu, Y. The Overall Design of Variable Diameter Ducted Fan in the Aircraft. Aerospace 2022, 9, 387. https://doi.org/10.3390/aerospace9070387
AMA Style
Gao Y, Xu Y. The Overall Design of Variable Diameter Ducted Fan in the Aircraft. Aerospace. 2022; 9(7):387. https://doi.org/10.3390/aerospace9070387
Chicago/Turabian StyleGao, Yadong, and Yang Xu. 2022. "The Overall Design of Variable Diameter Ducted Fan in the Aircraft" Aerospace 9, no. 7: 387. https://doi.org/10.3390/aerospace9070387
Note that from the first issue of 2016, this journal uses article numbers instead of page numbers. See further details here.