
Aerial Footage Analysis Using Computer Vision for Efficient Detection of Points of Interest Near Railway Tracks


Abstract
:1. Introduction
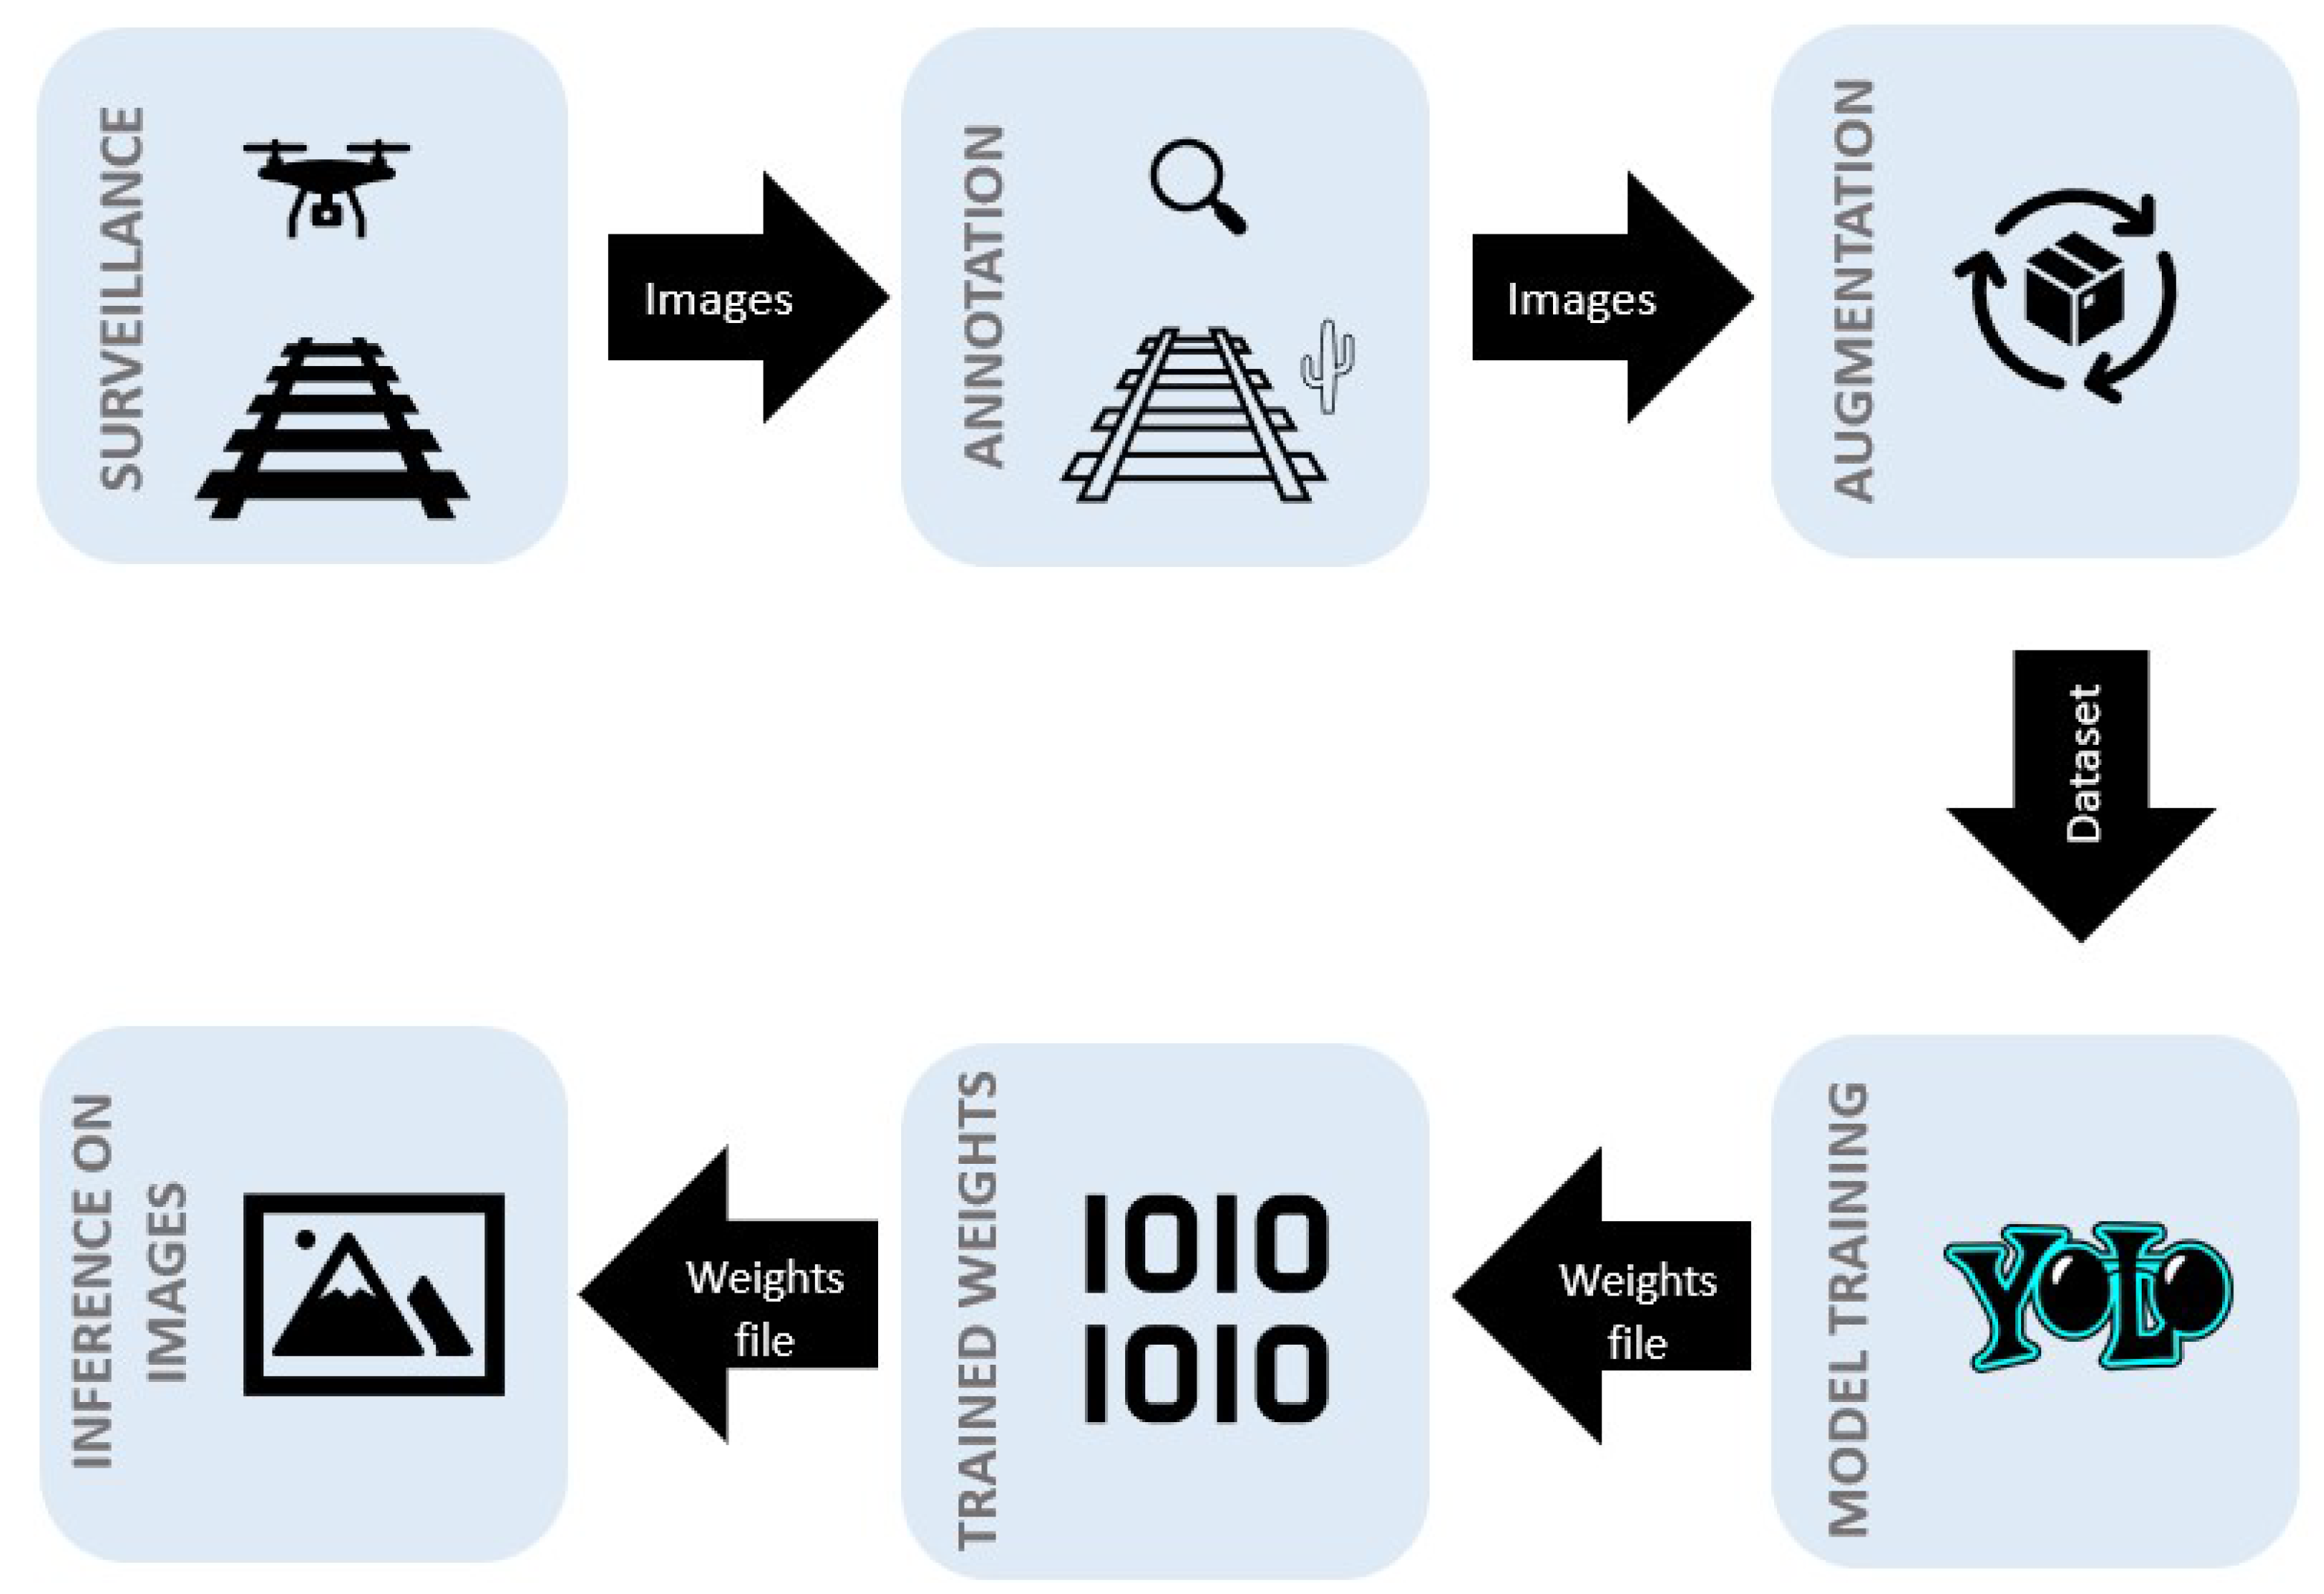
- Approach: We study and apply the YOLOv5 object detection algorithm to detect various POI, that is, broken ties, missing ties, vegetation, and water pooling around railway tracks.
- Experimentation: We collected aerial image footage in 4K resolution and the top-down angle for training and testing purposes by using DJI Inspire 2 with a Zenmuse X7 camera in the Ottawa, ON, Canada region. Our research team performed annotations with the help of an expert from Transport Canada.
- Evaluation: We evaluate the algorithm’s accuracy by measuring how accurately it determines a particular POI. We consider precision, recall, and mean average precision to determine overall efficiency. In general, we achieved a precision of 74% and a mean average precision @ 0.5 (mAP @ 0.5) of 70.7%.
2. Related Work
3. Algorithm Overview
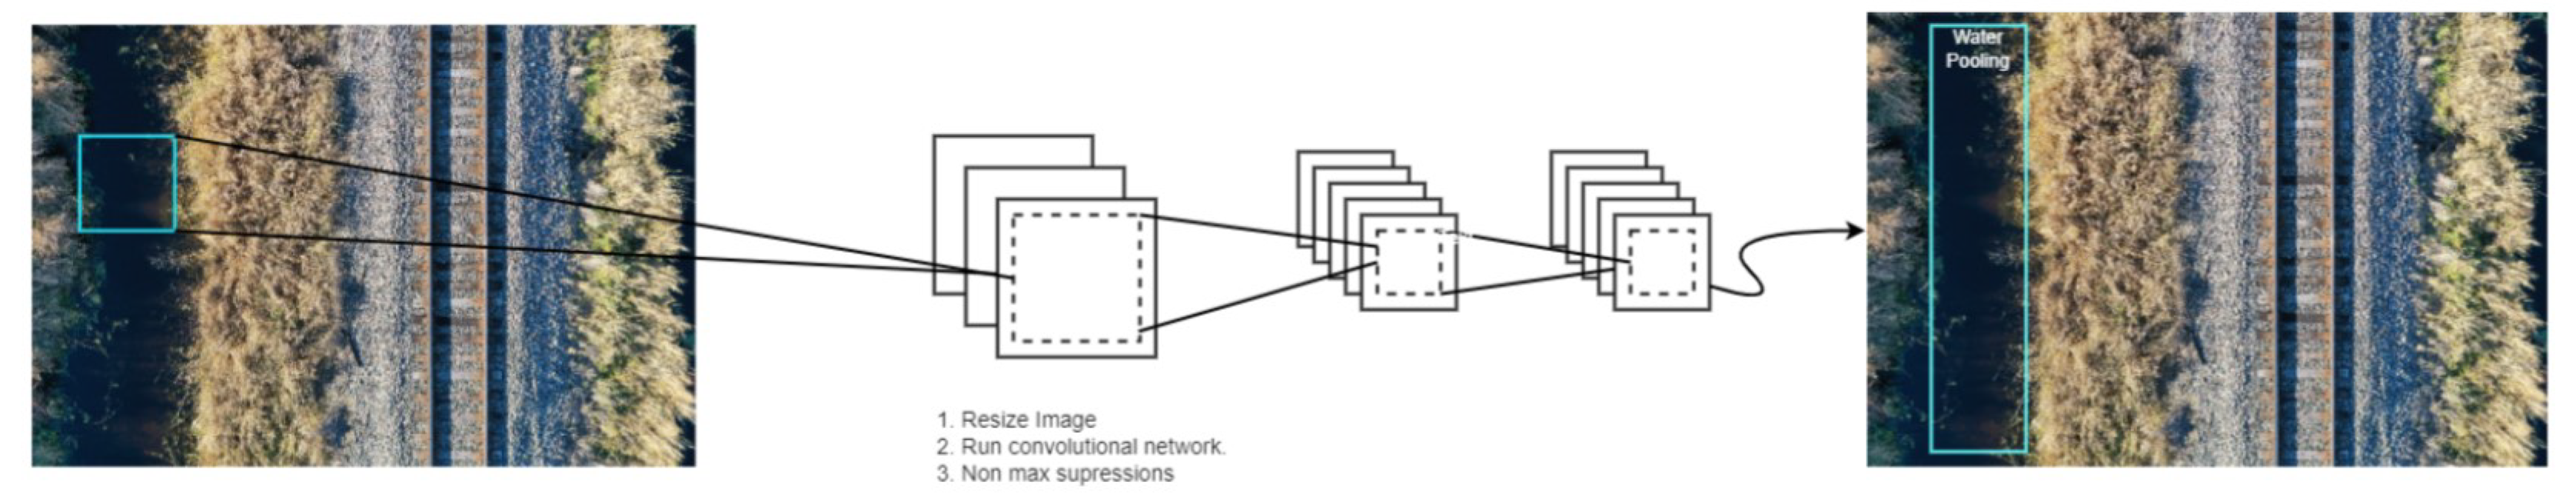
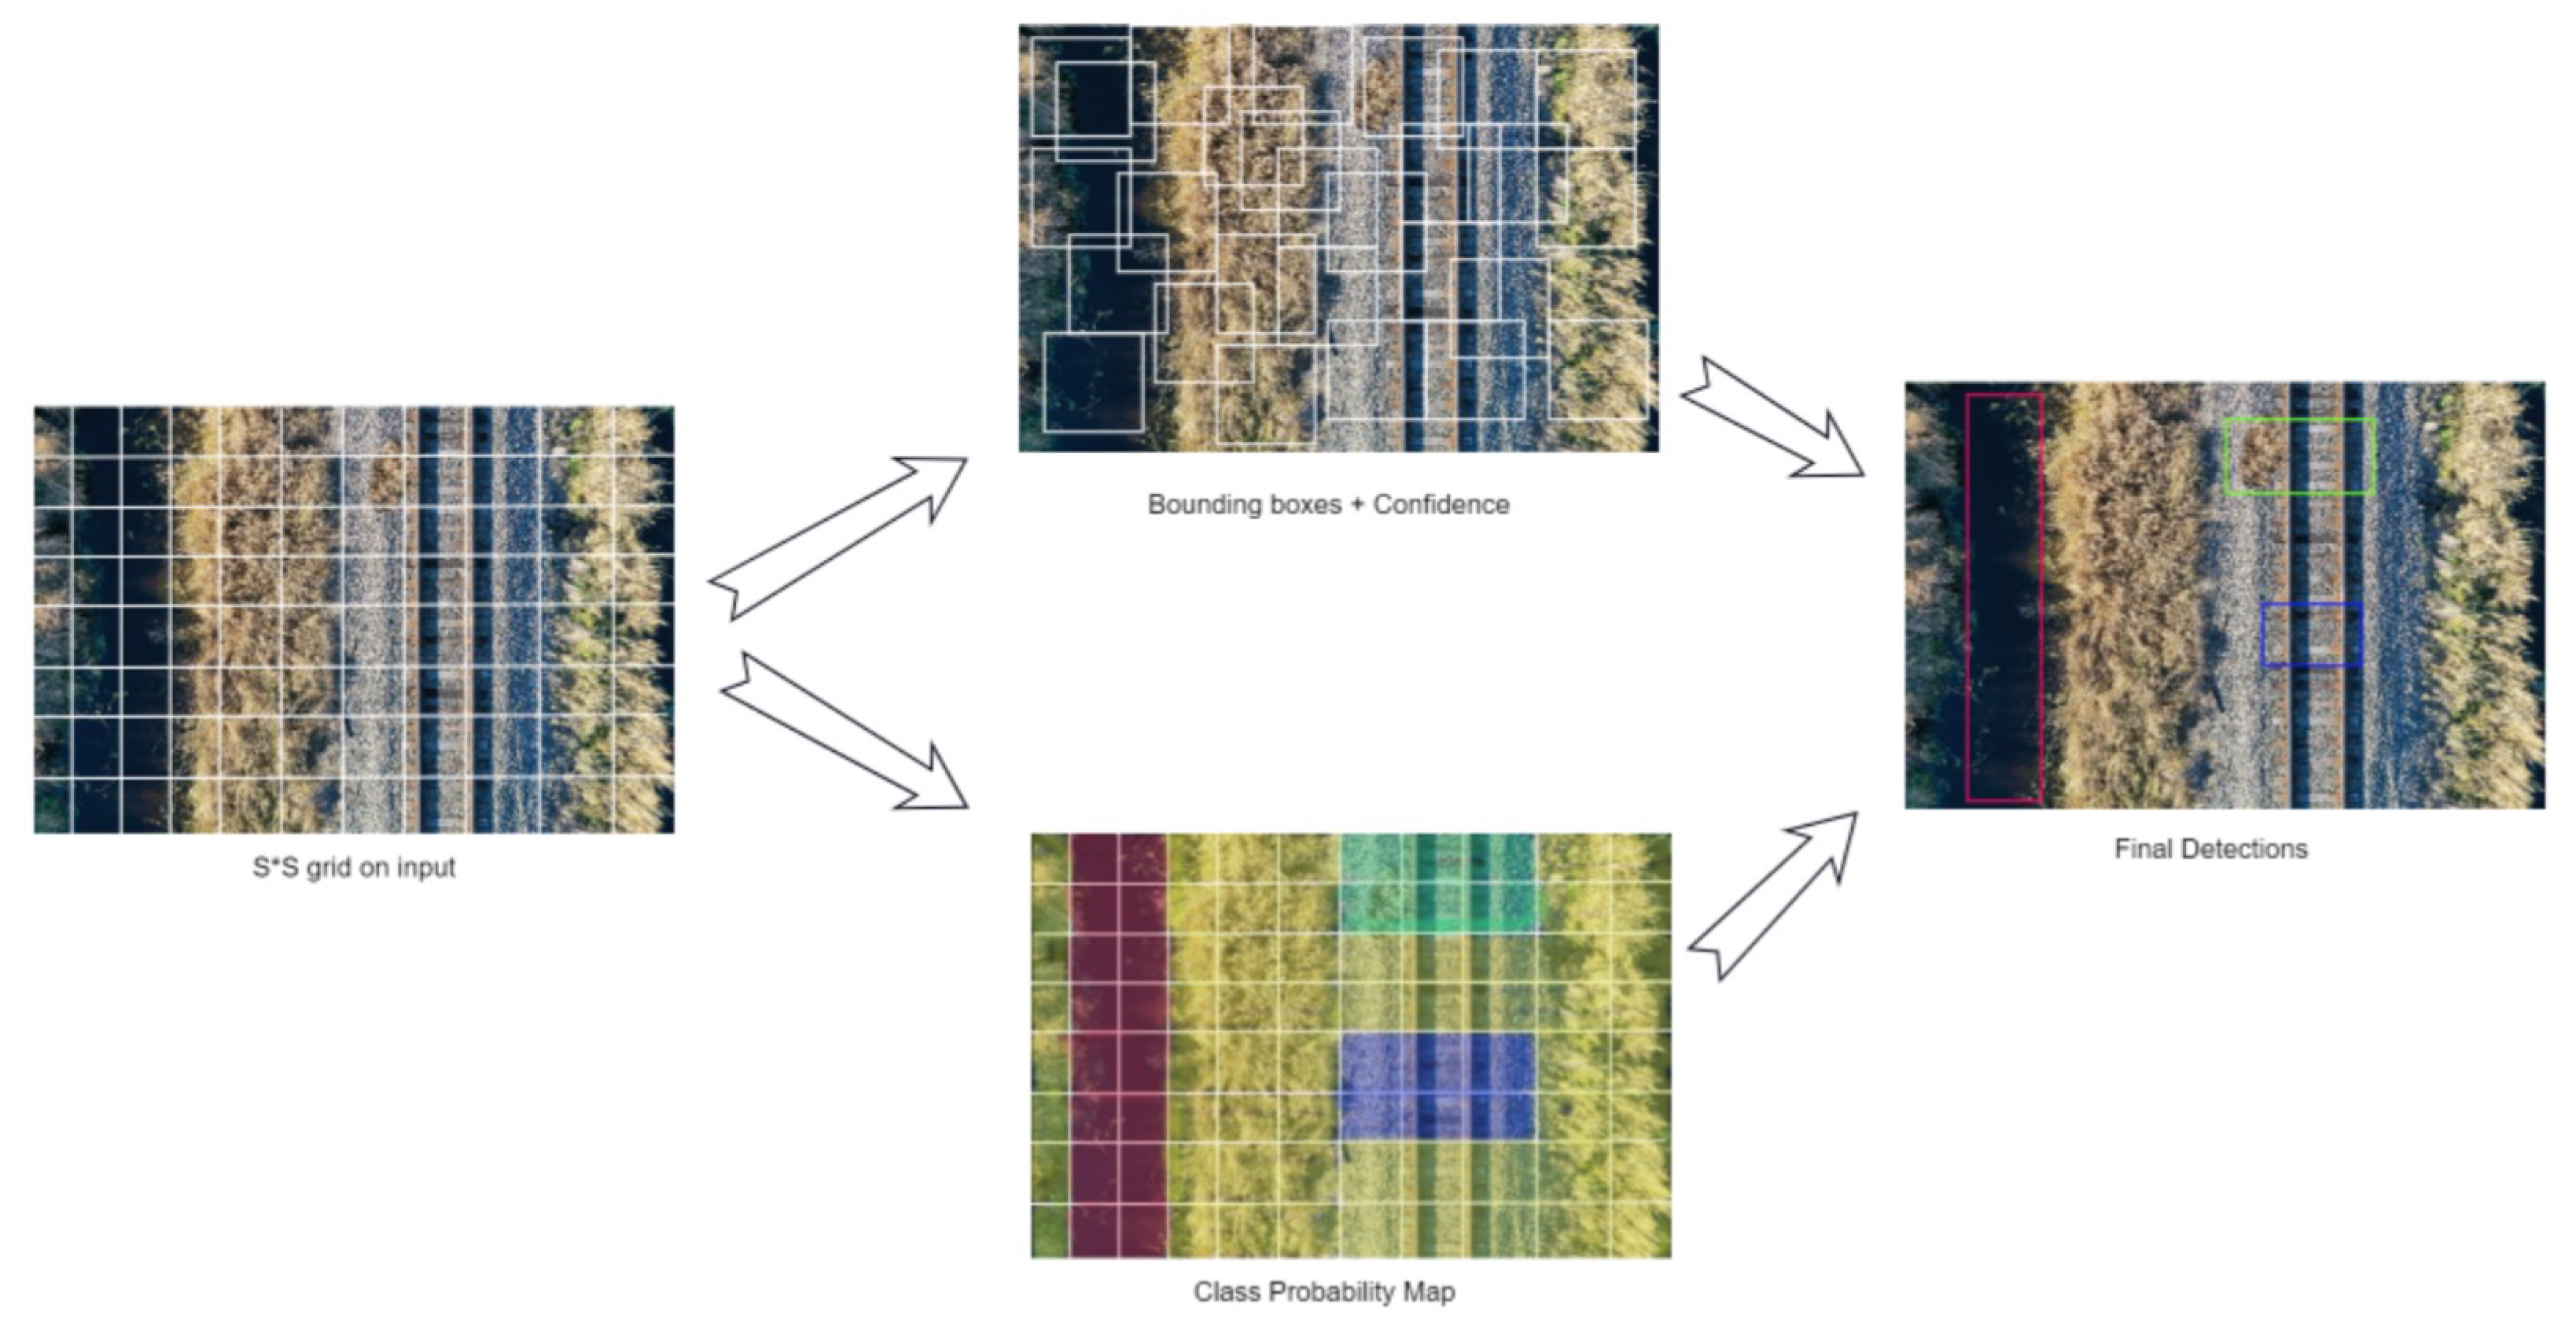
3.1. Detection
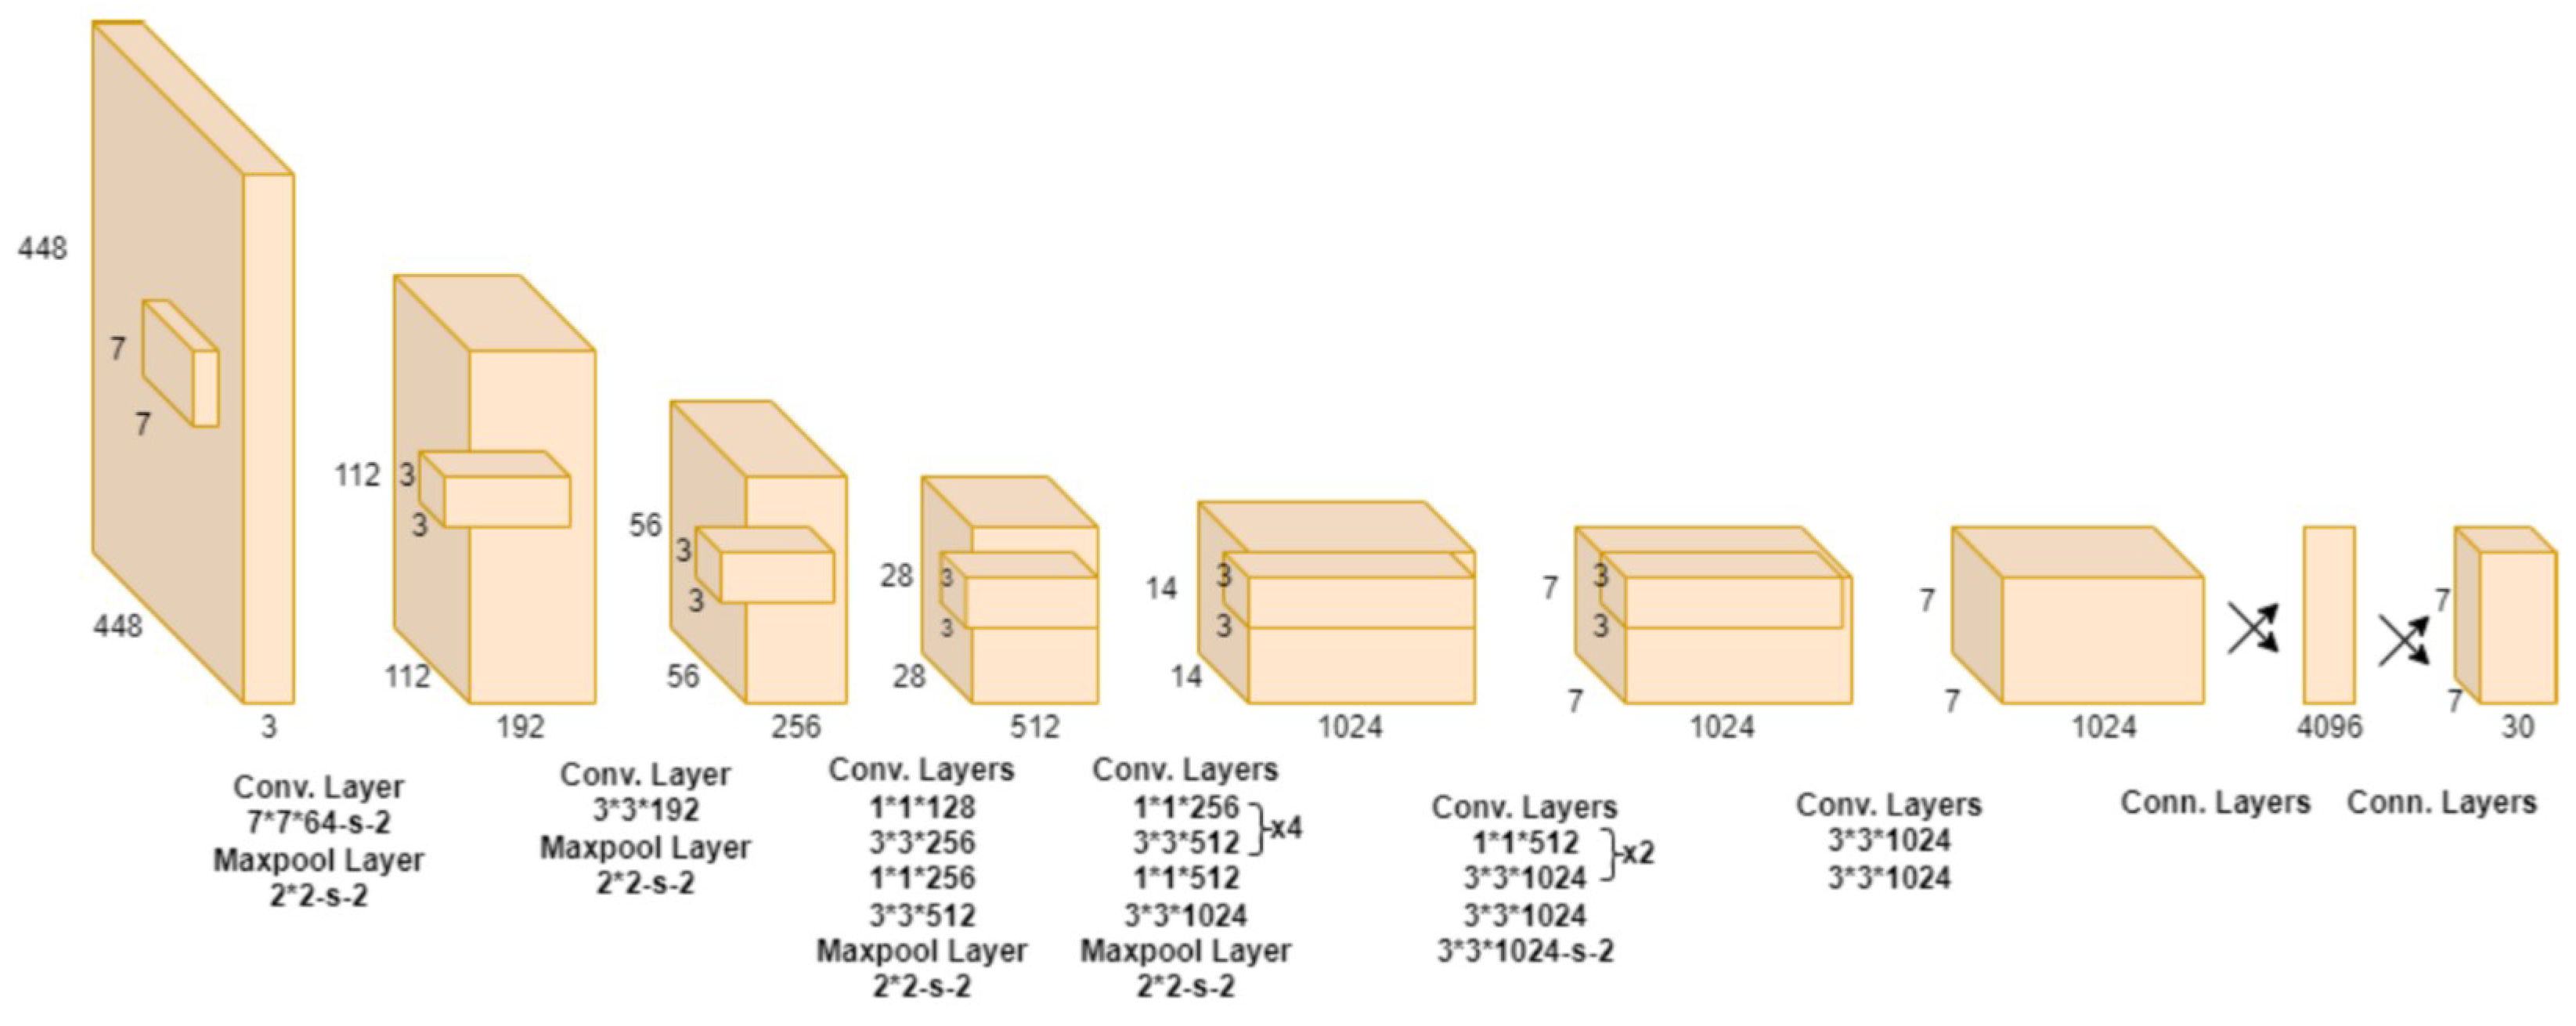
3.2. Architecture
3.3. Activation and Loss Function
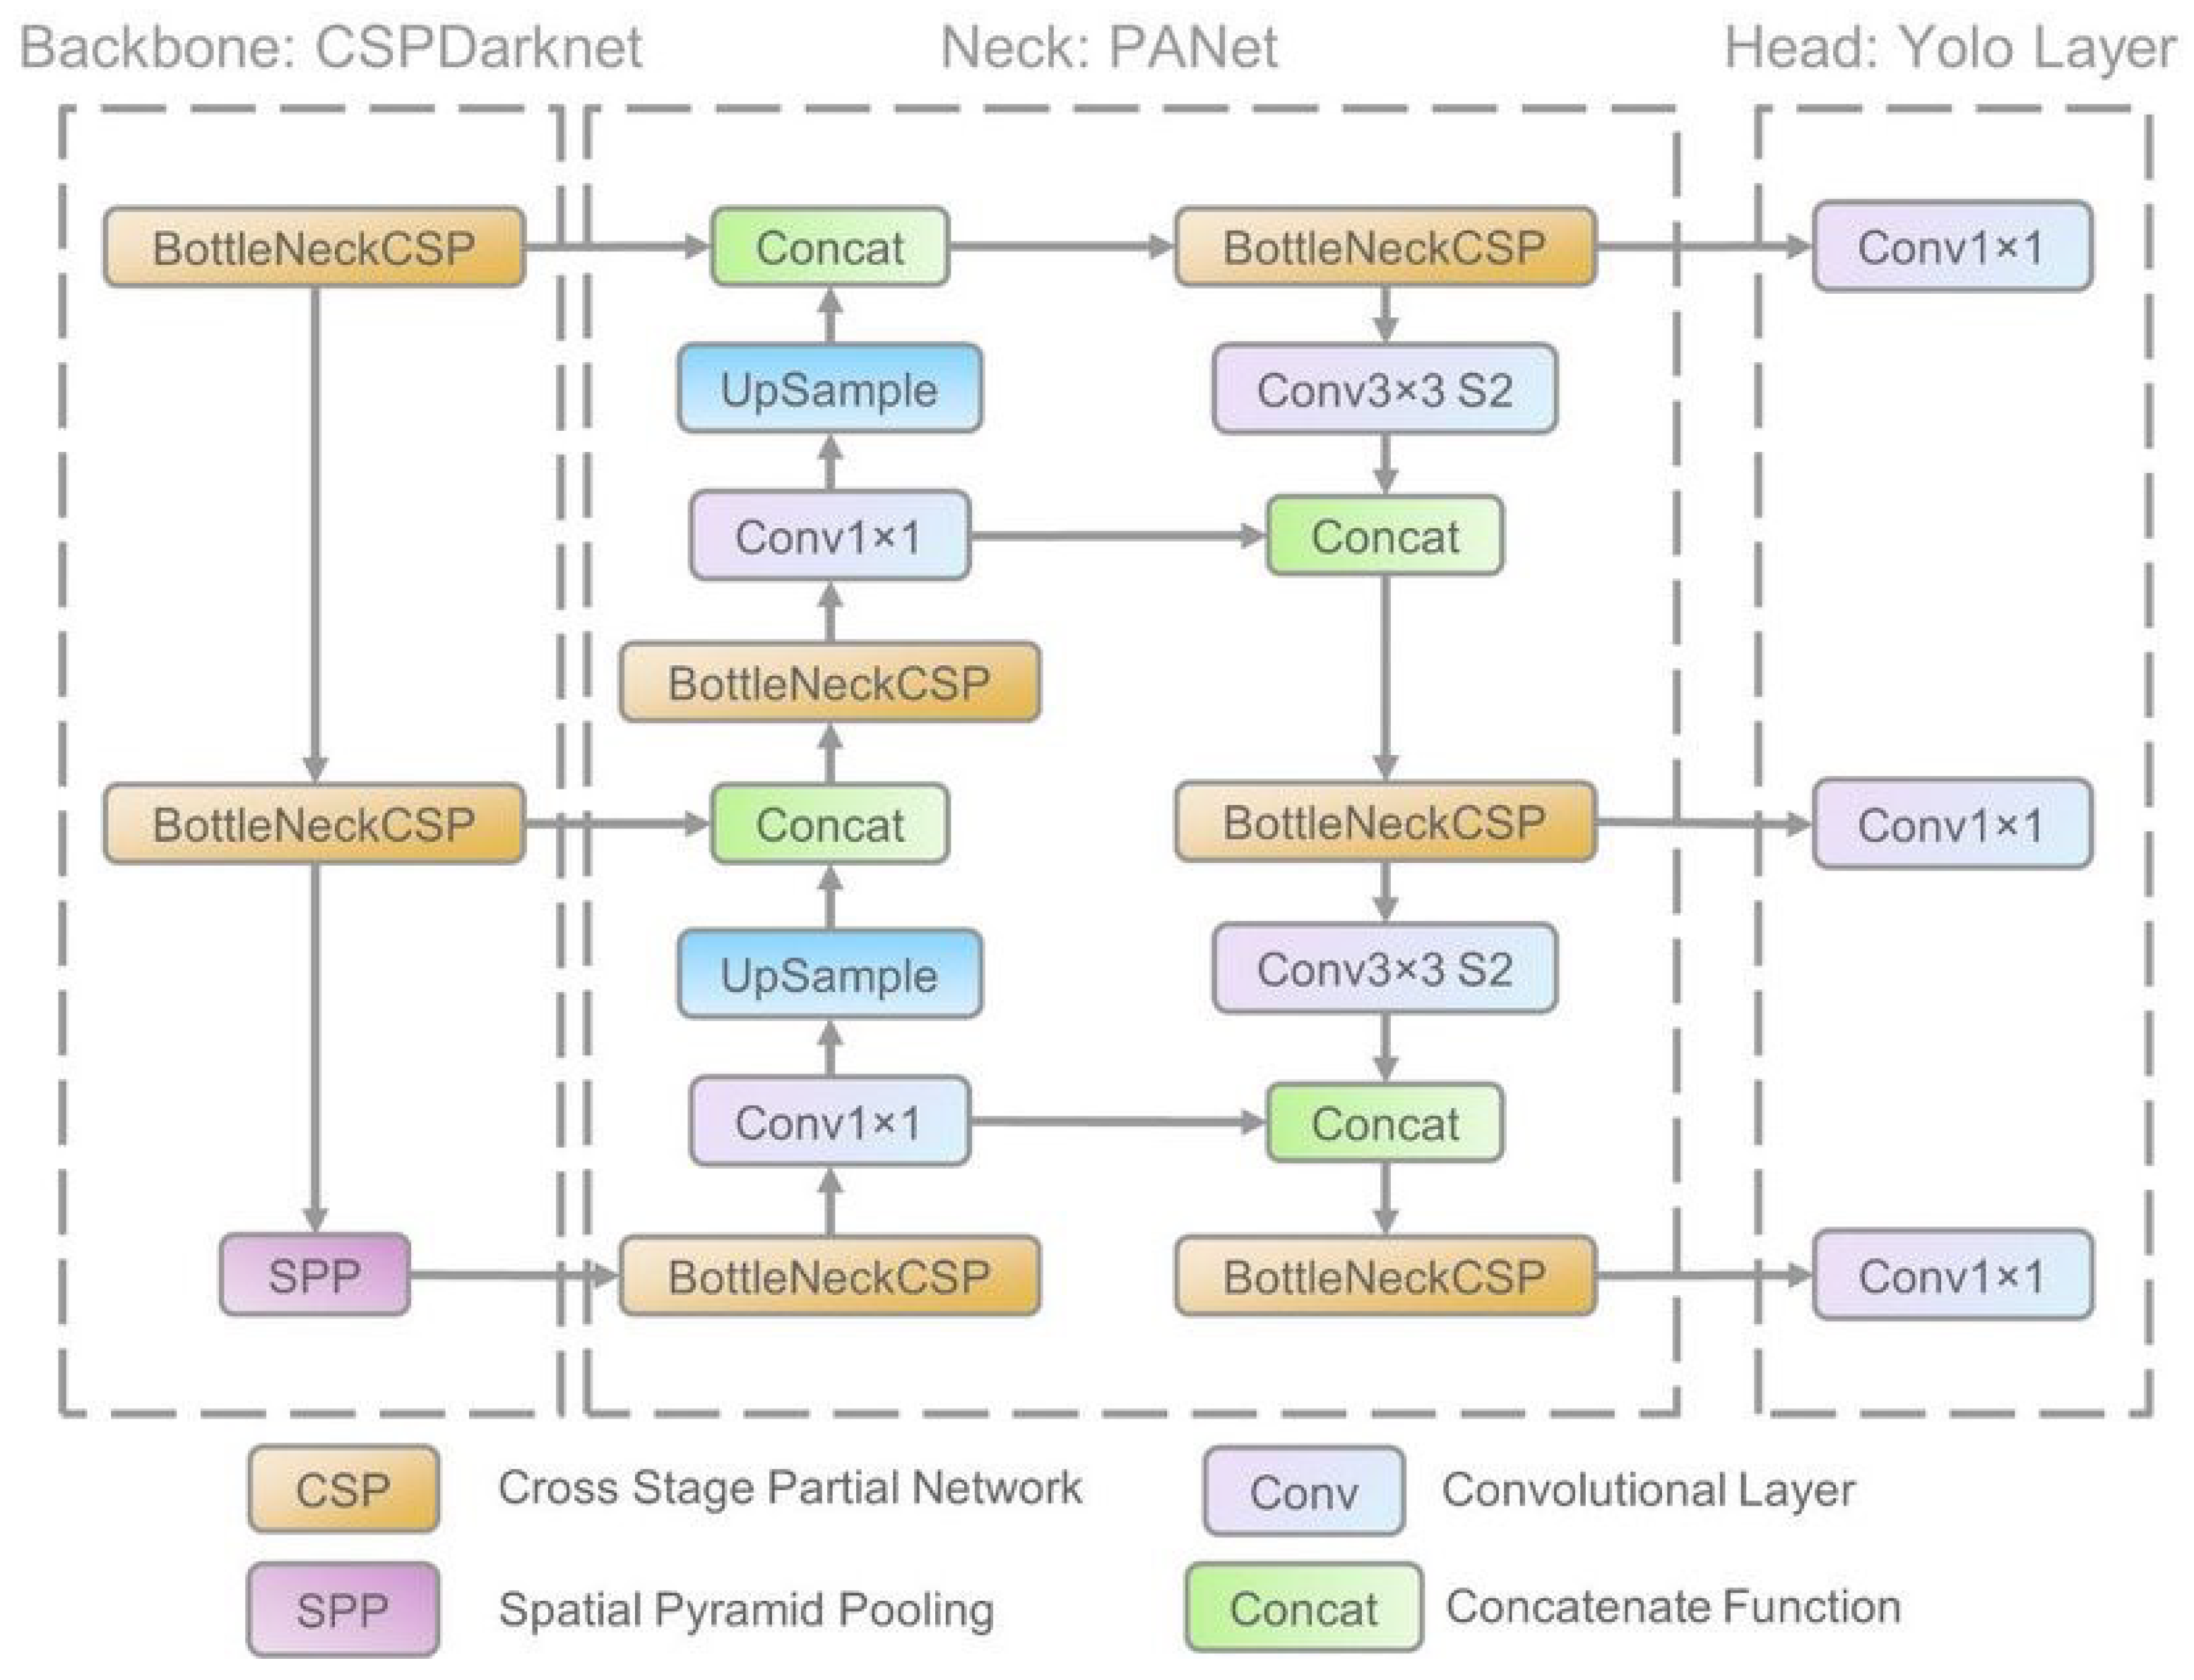
3.4. YOLOv5
4. Methodology
4.1. Dataset Pre-Processing
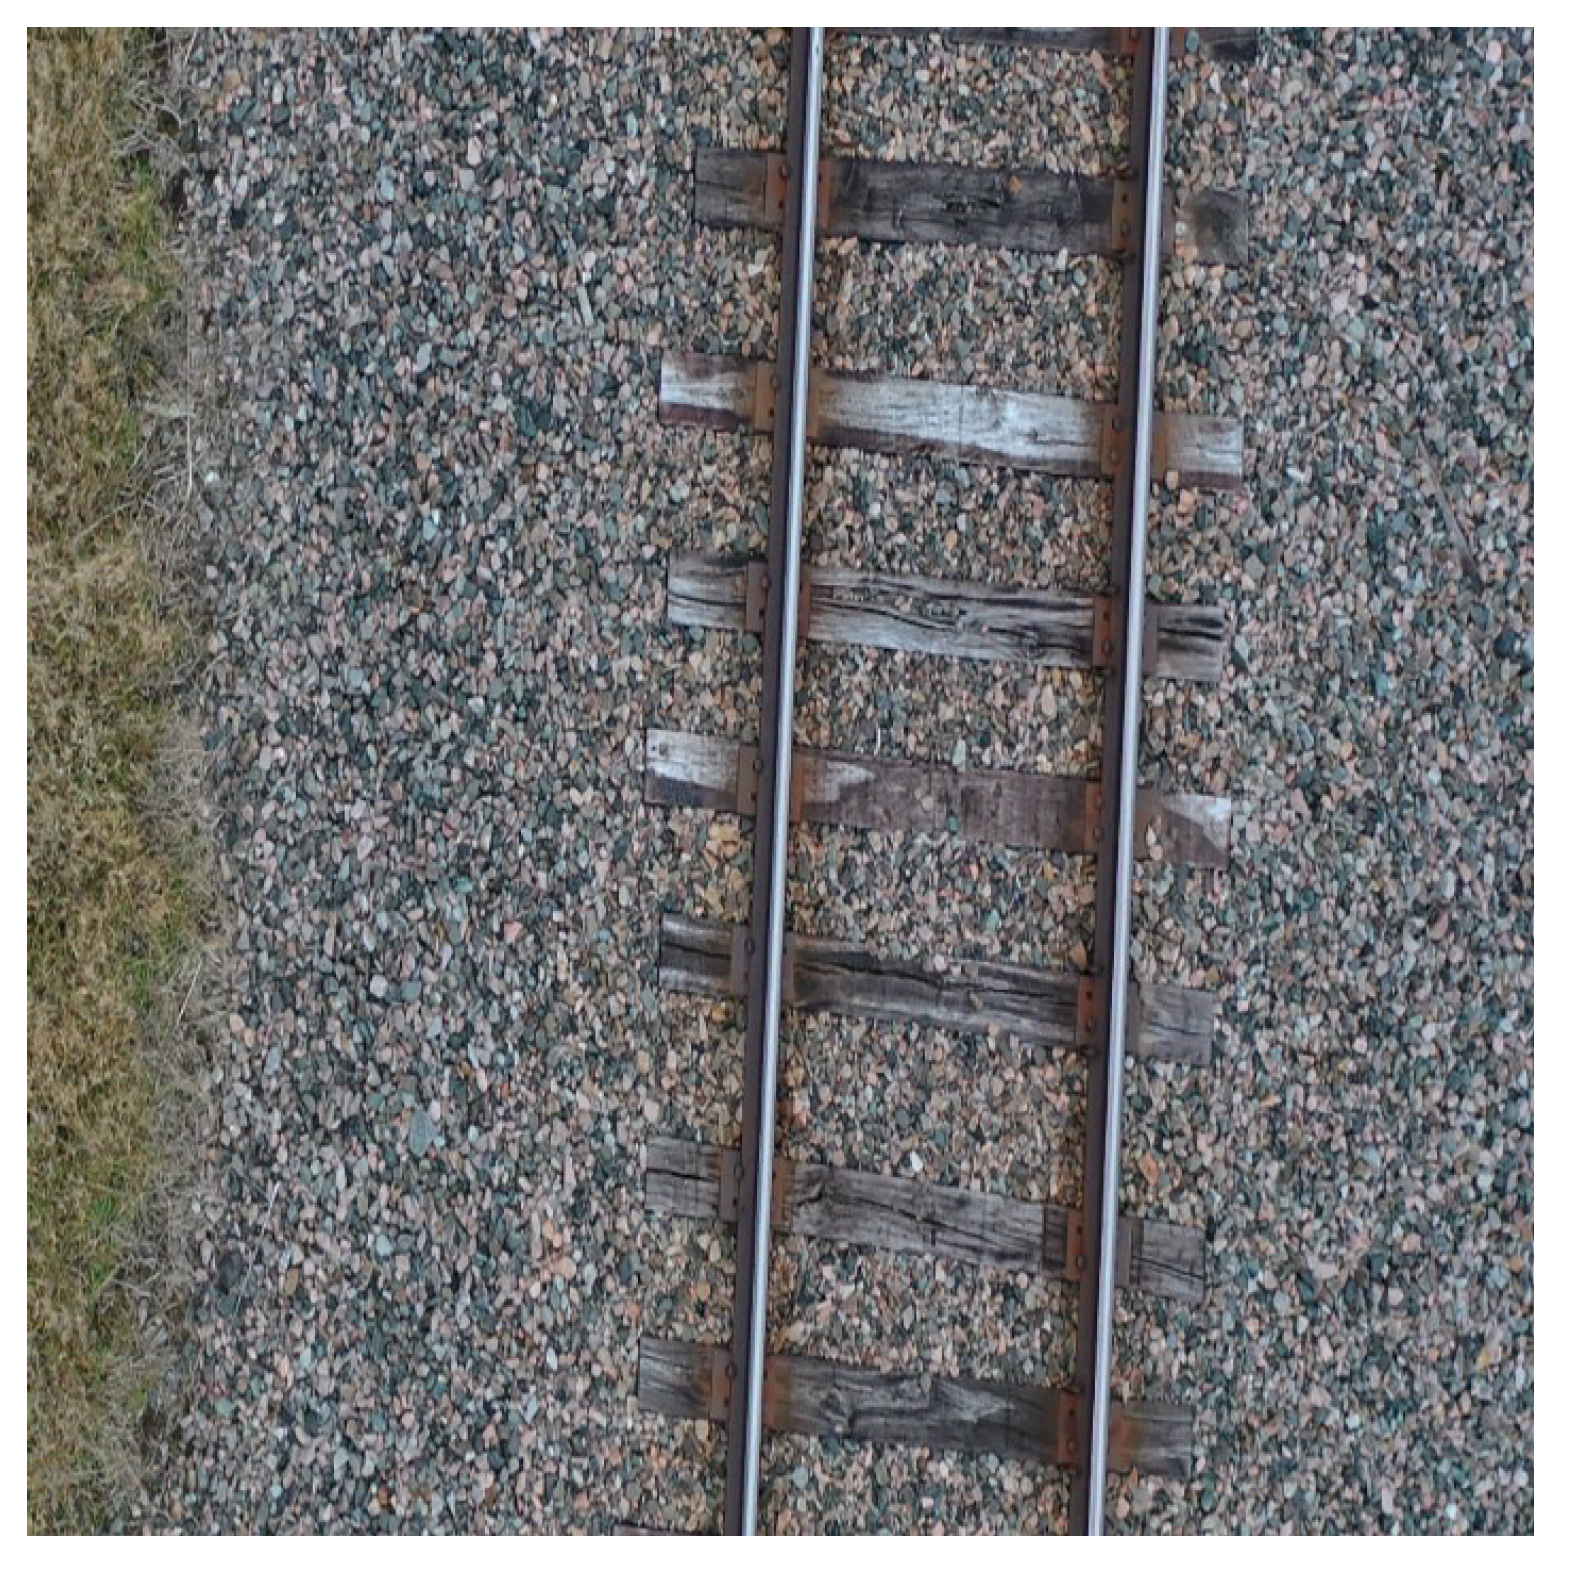
- Image Orientation Correction. To make the annotation process more manageable and efficient, the orientation of the images was corrected so that the tracks were in a vertical or horizontal direction. Moreover, all images were taken by using the top-down approach to prevent the situation where different angles of the image affect the detection quality.
- Artificial Vegetation. As the rail tracks are well maintained, there were very few images in which vegetation was visible. To achieve higher accuracy, we needed to train the model by using a well-balanced set of images with points of interest; thus, artificial vegetation was added on and beside the tracks.
4.2. Annotation
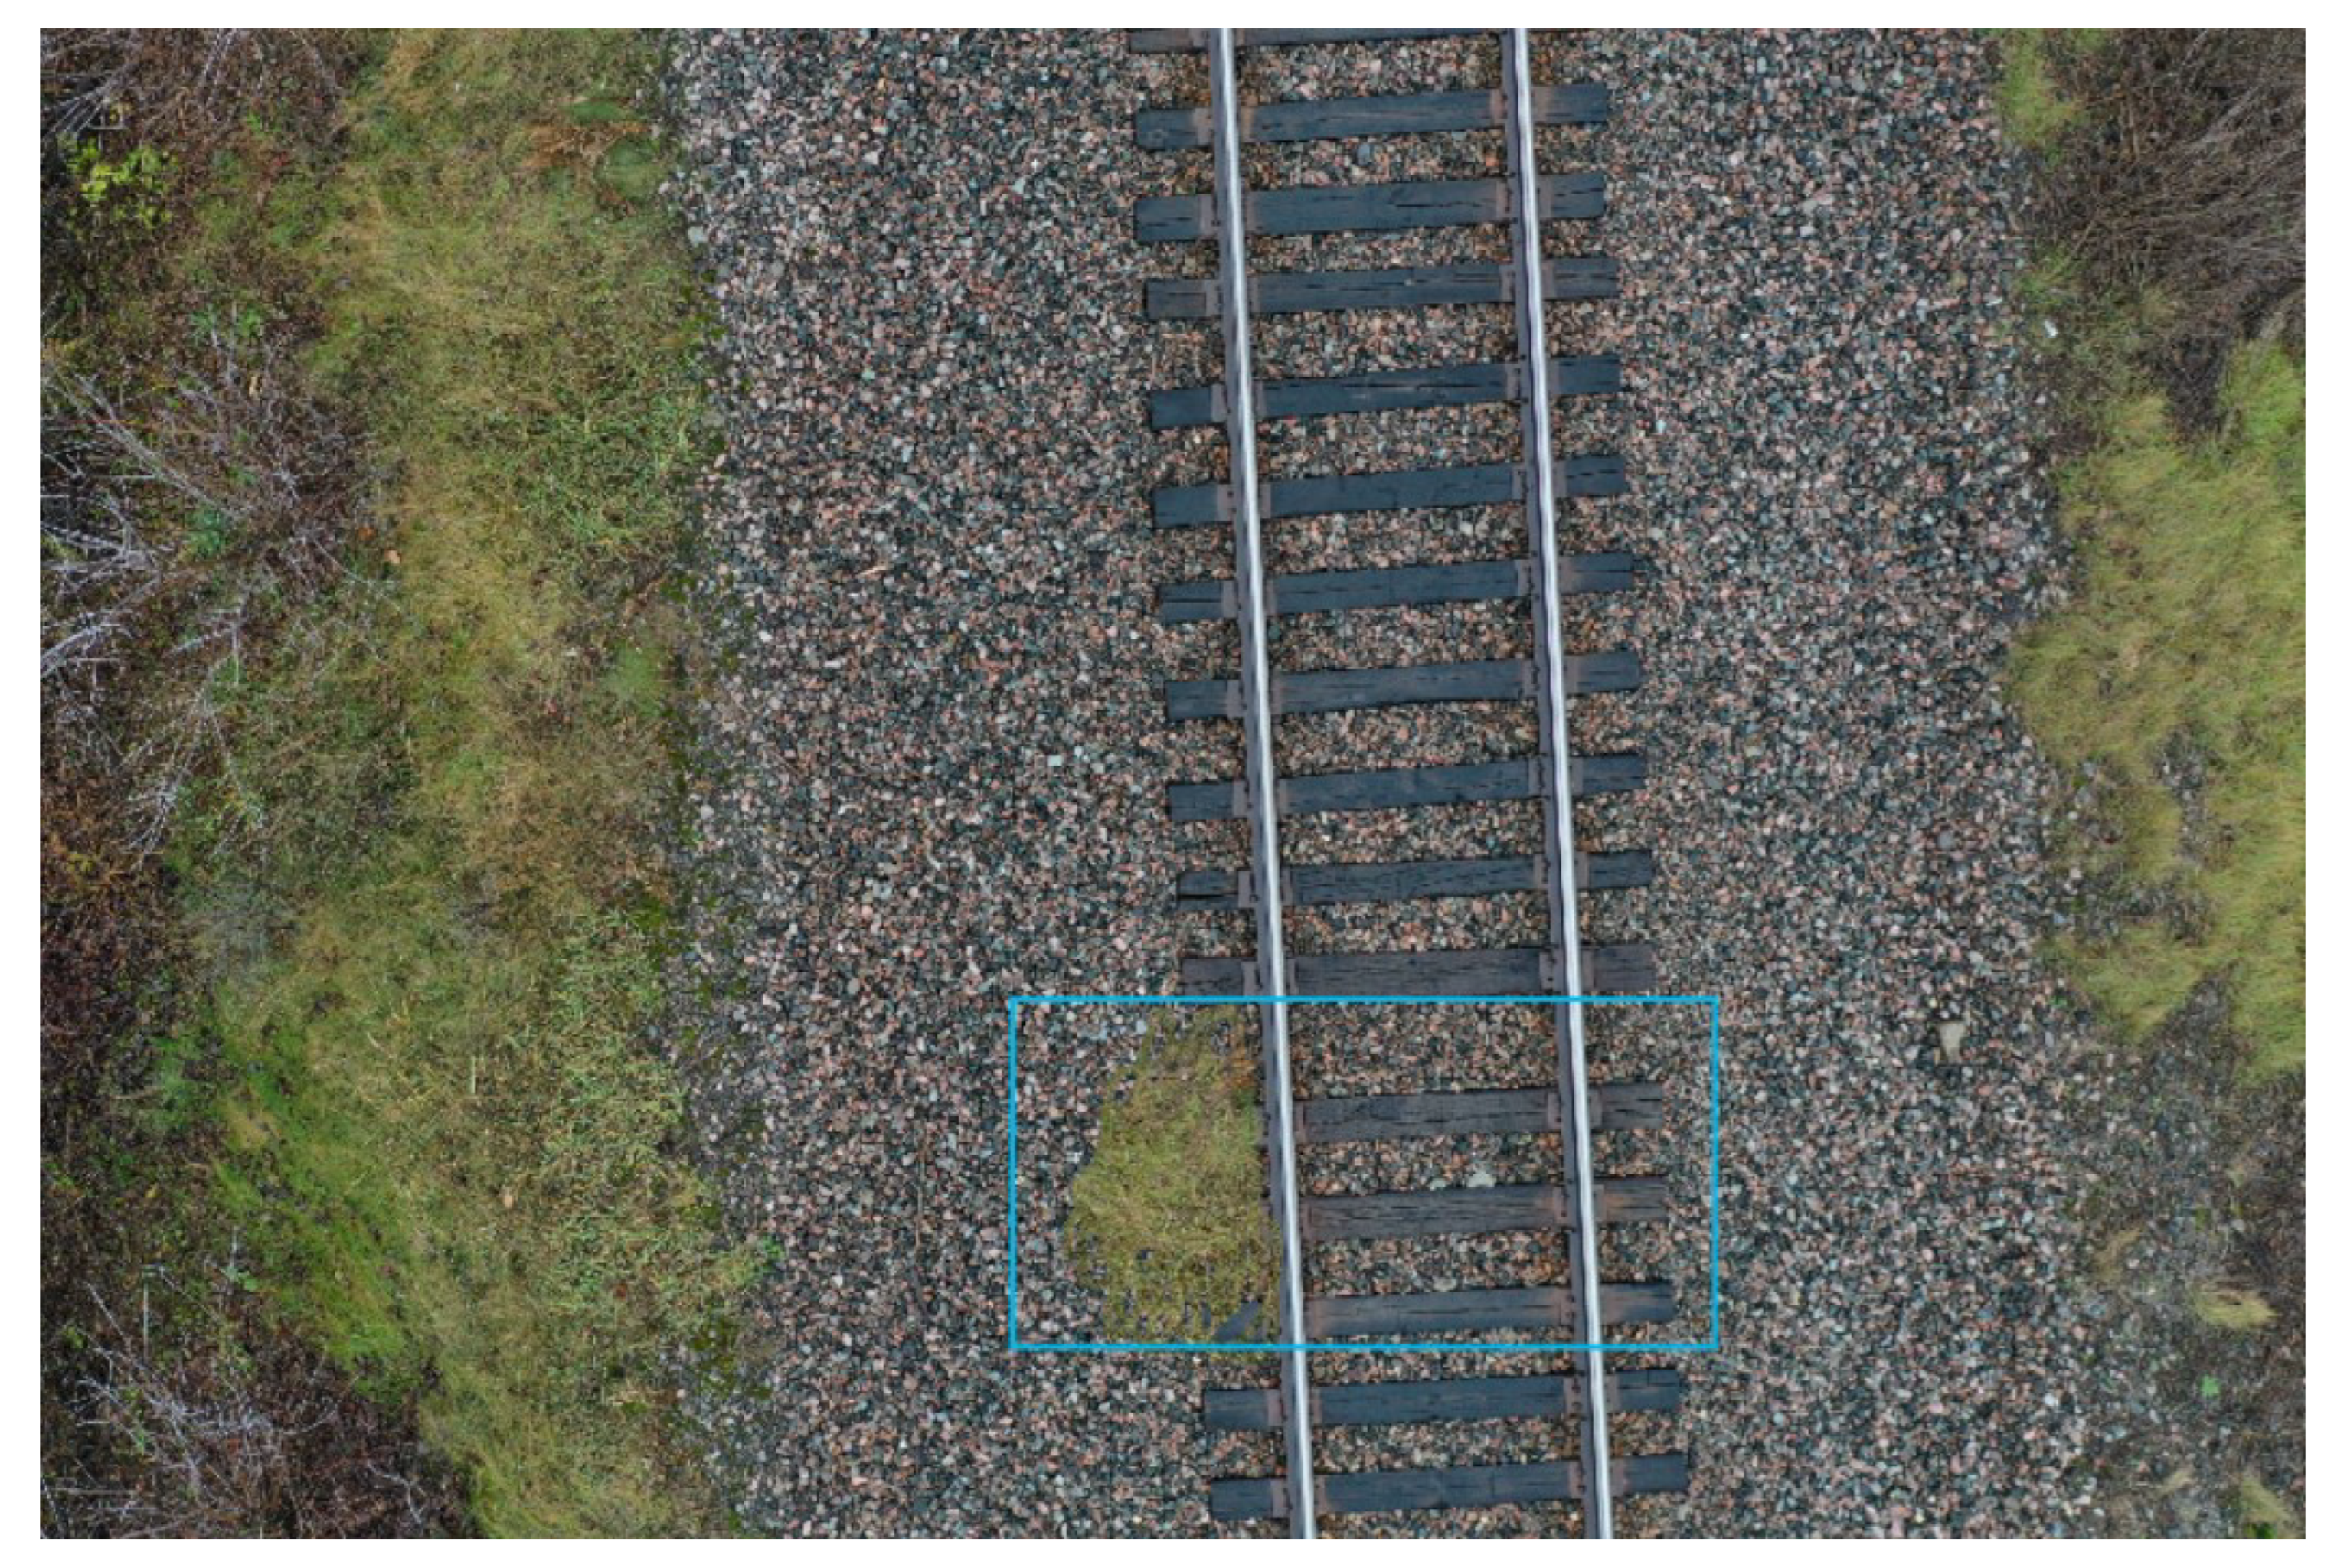
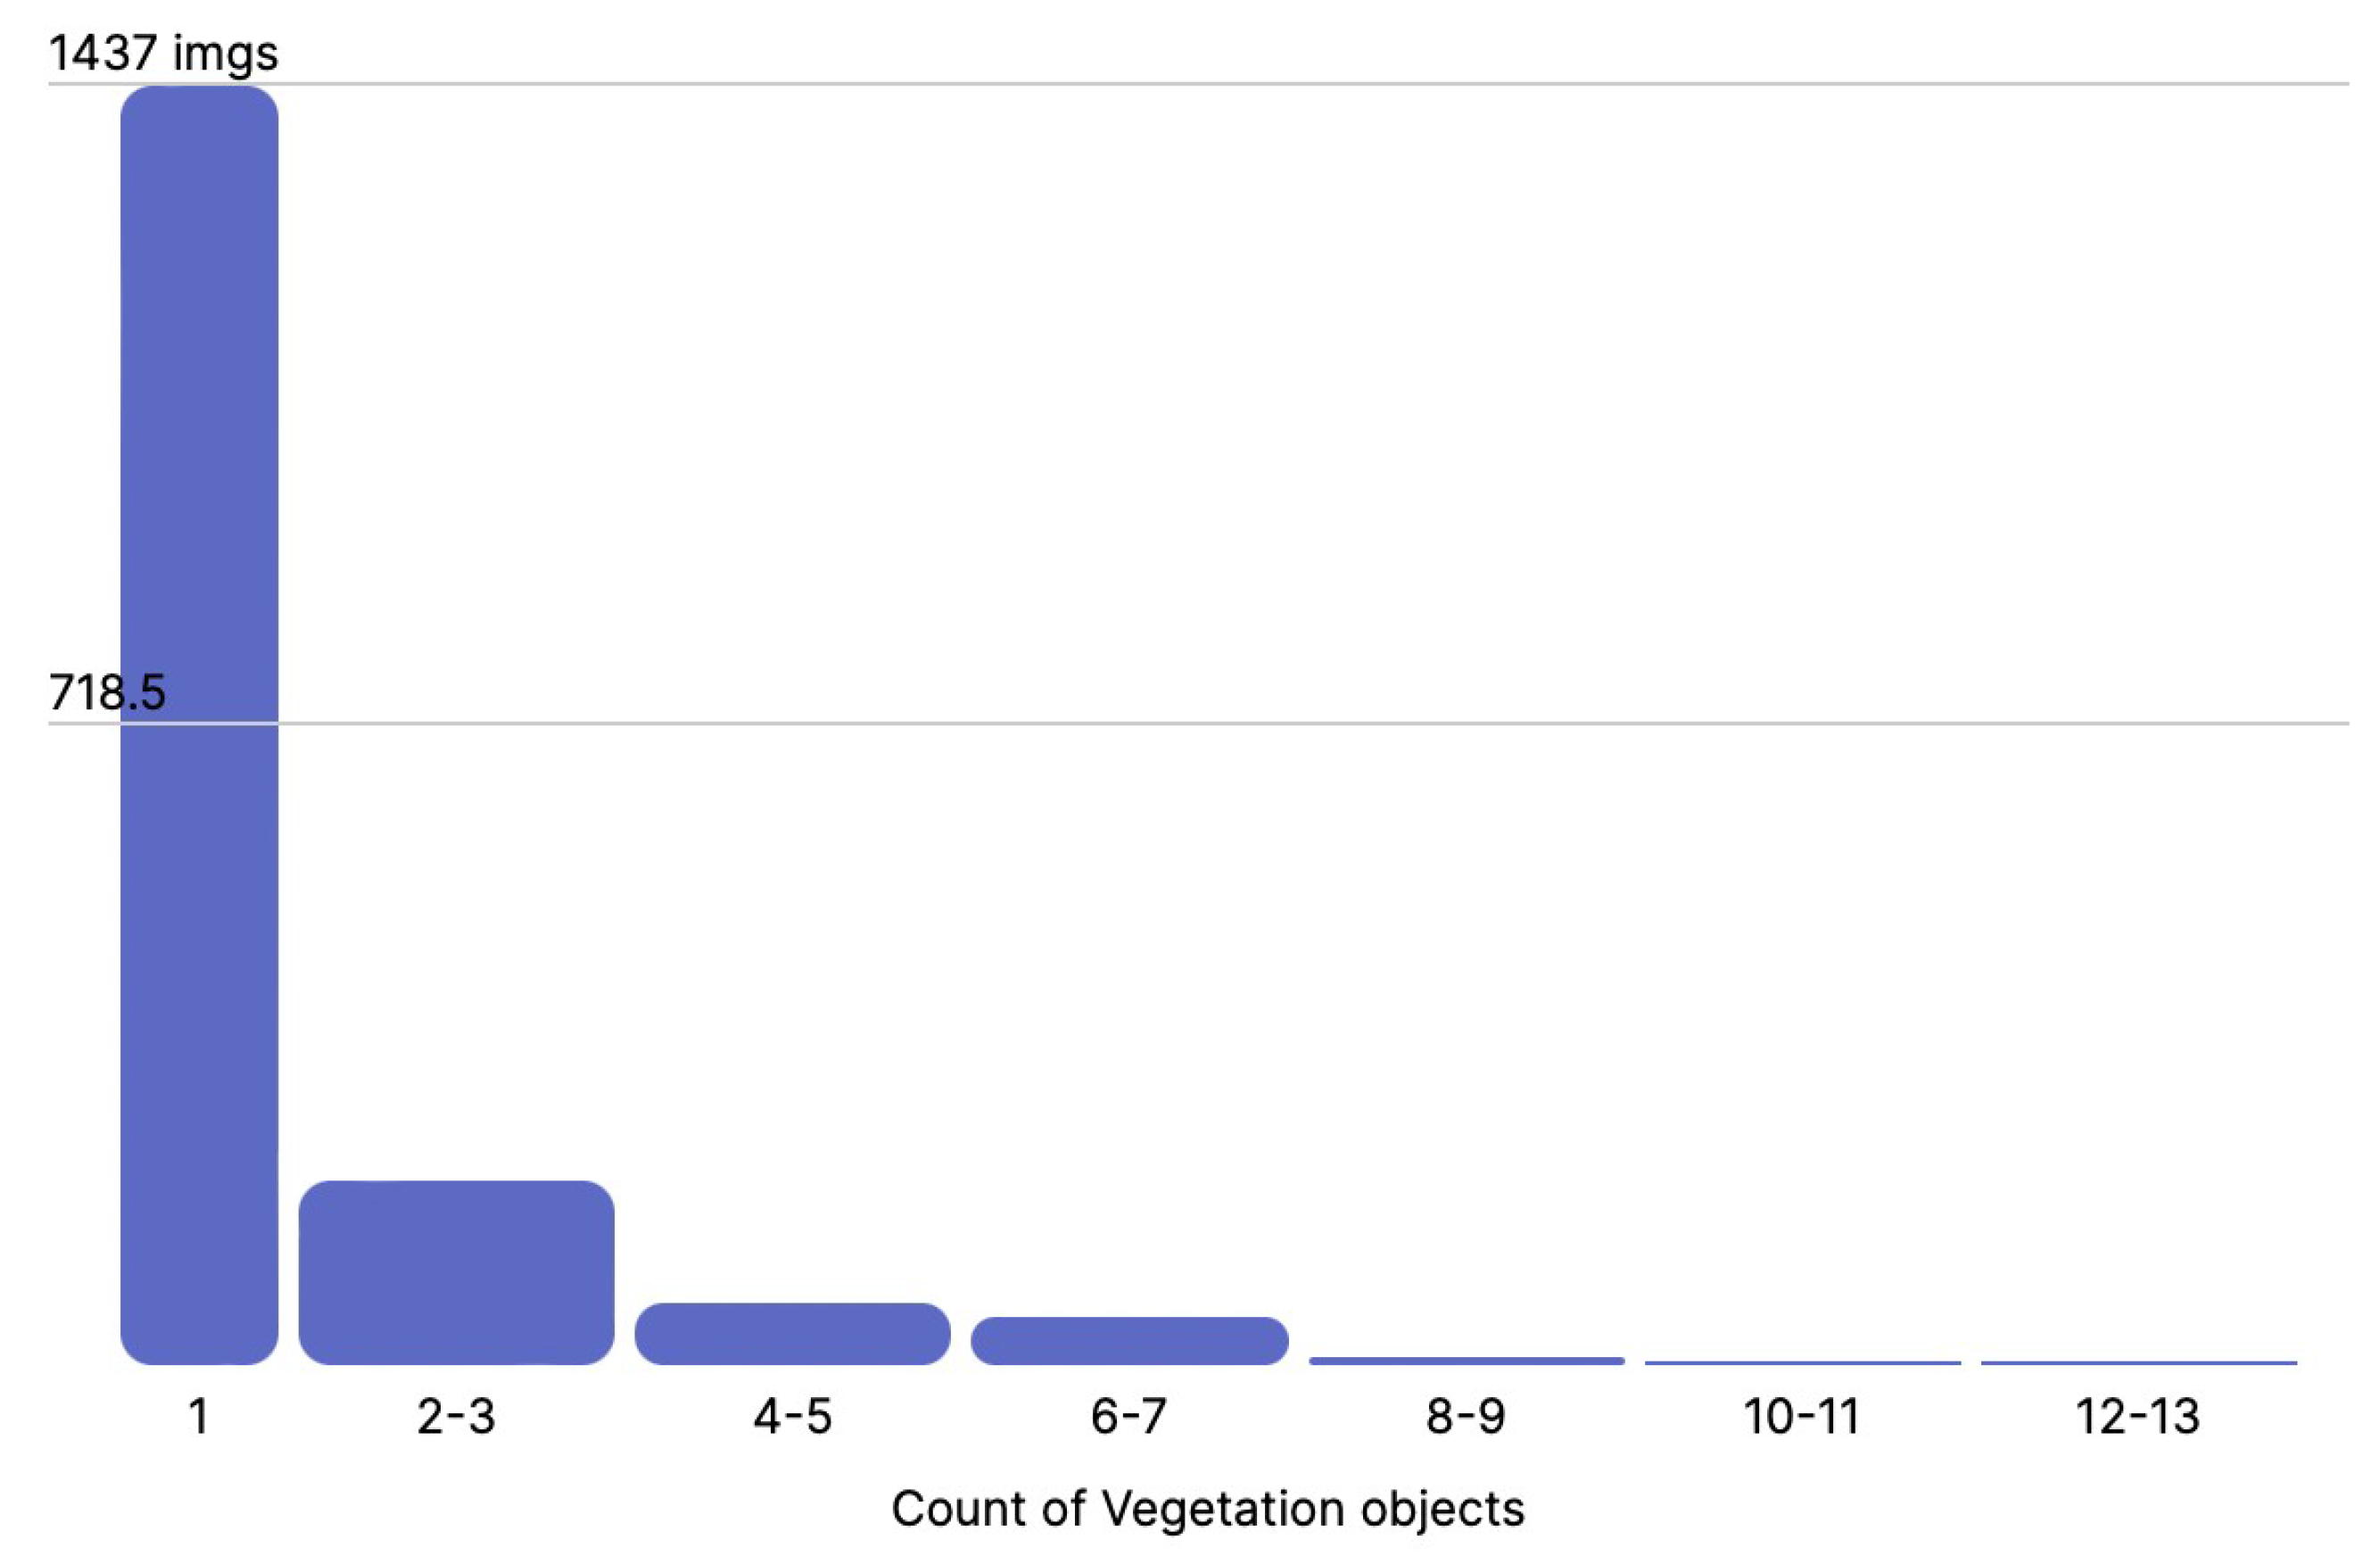
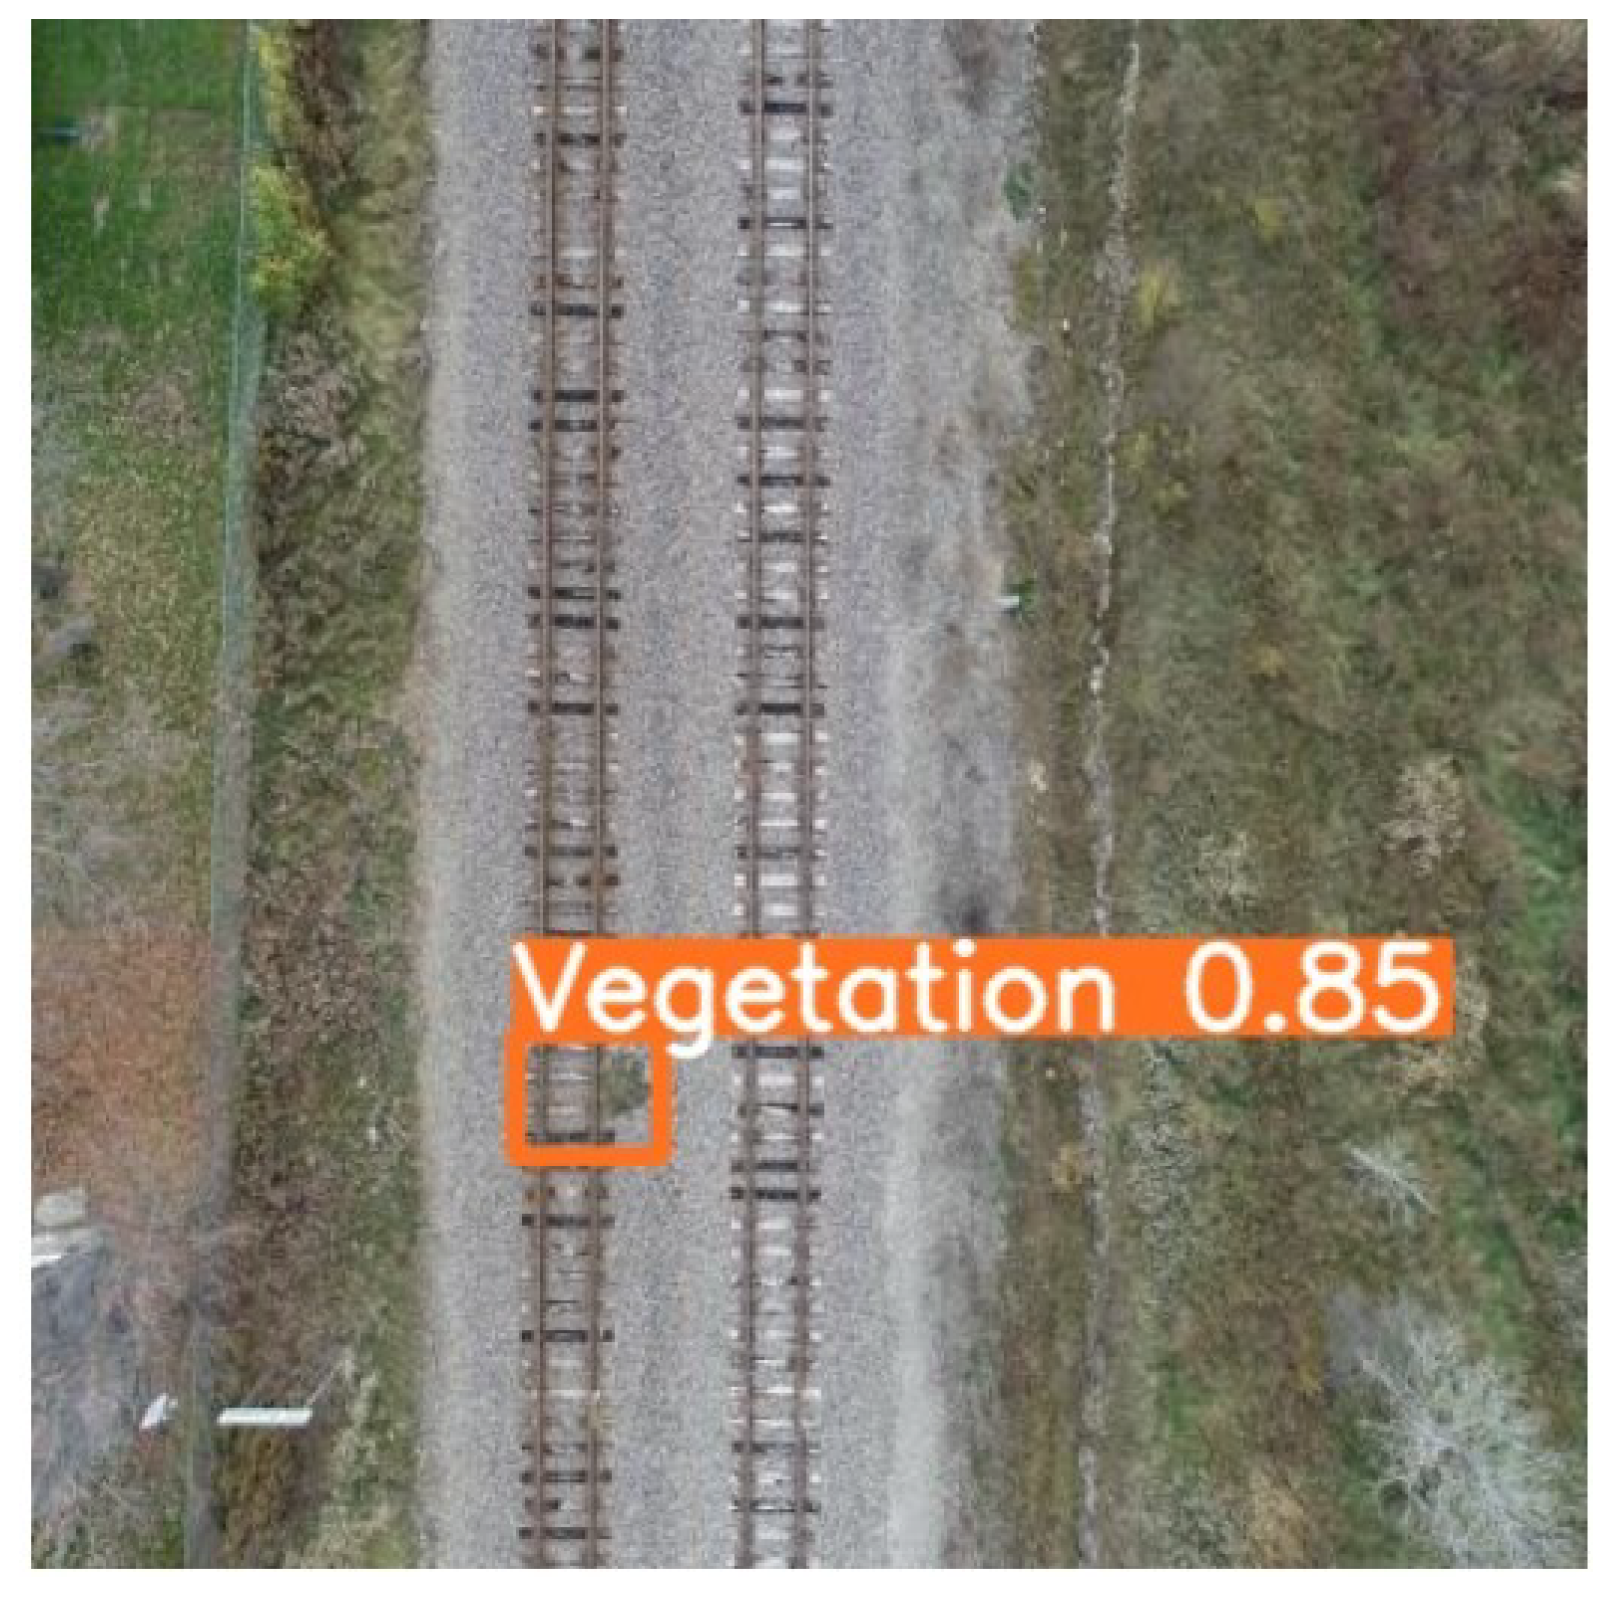
- Vegetation: Each image was closely reviewed to check for vegetation near the track. If it was present at a distance from the track (<3 m), it was annotated accordingly. An example is shown in Figure 6.
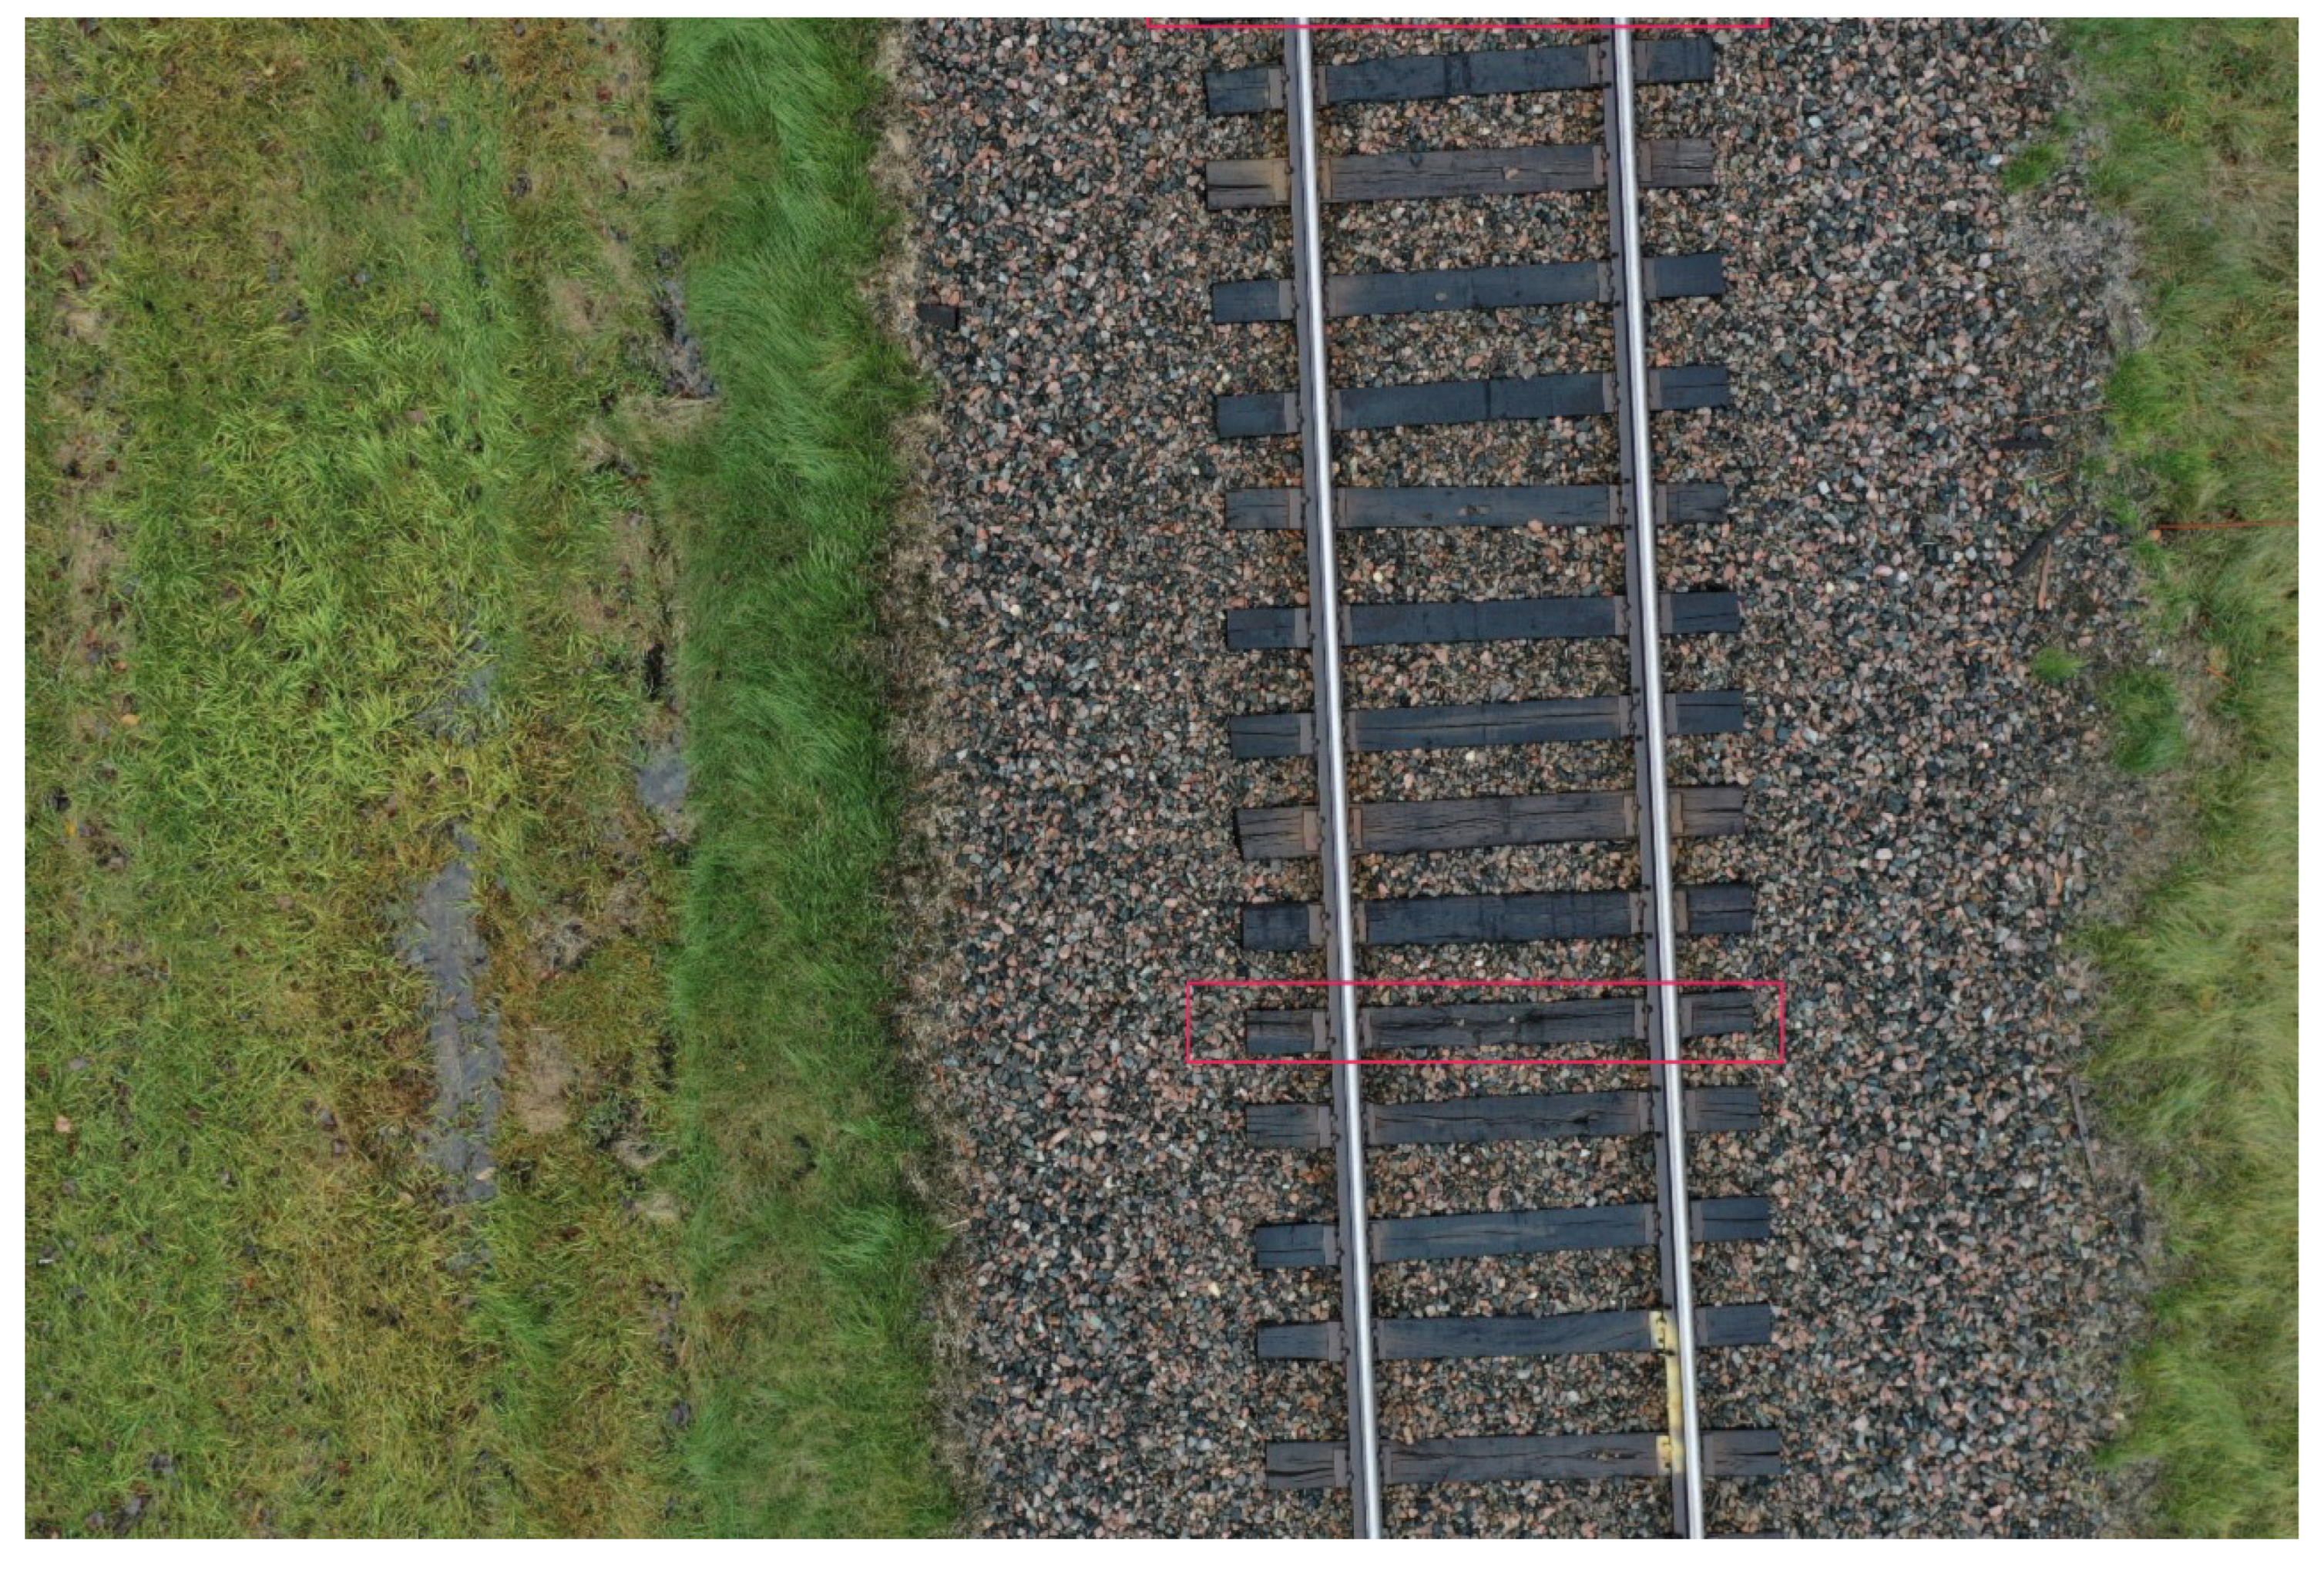
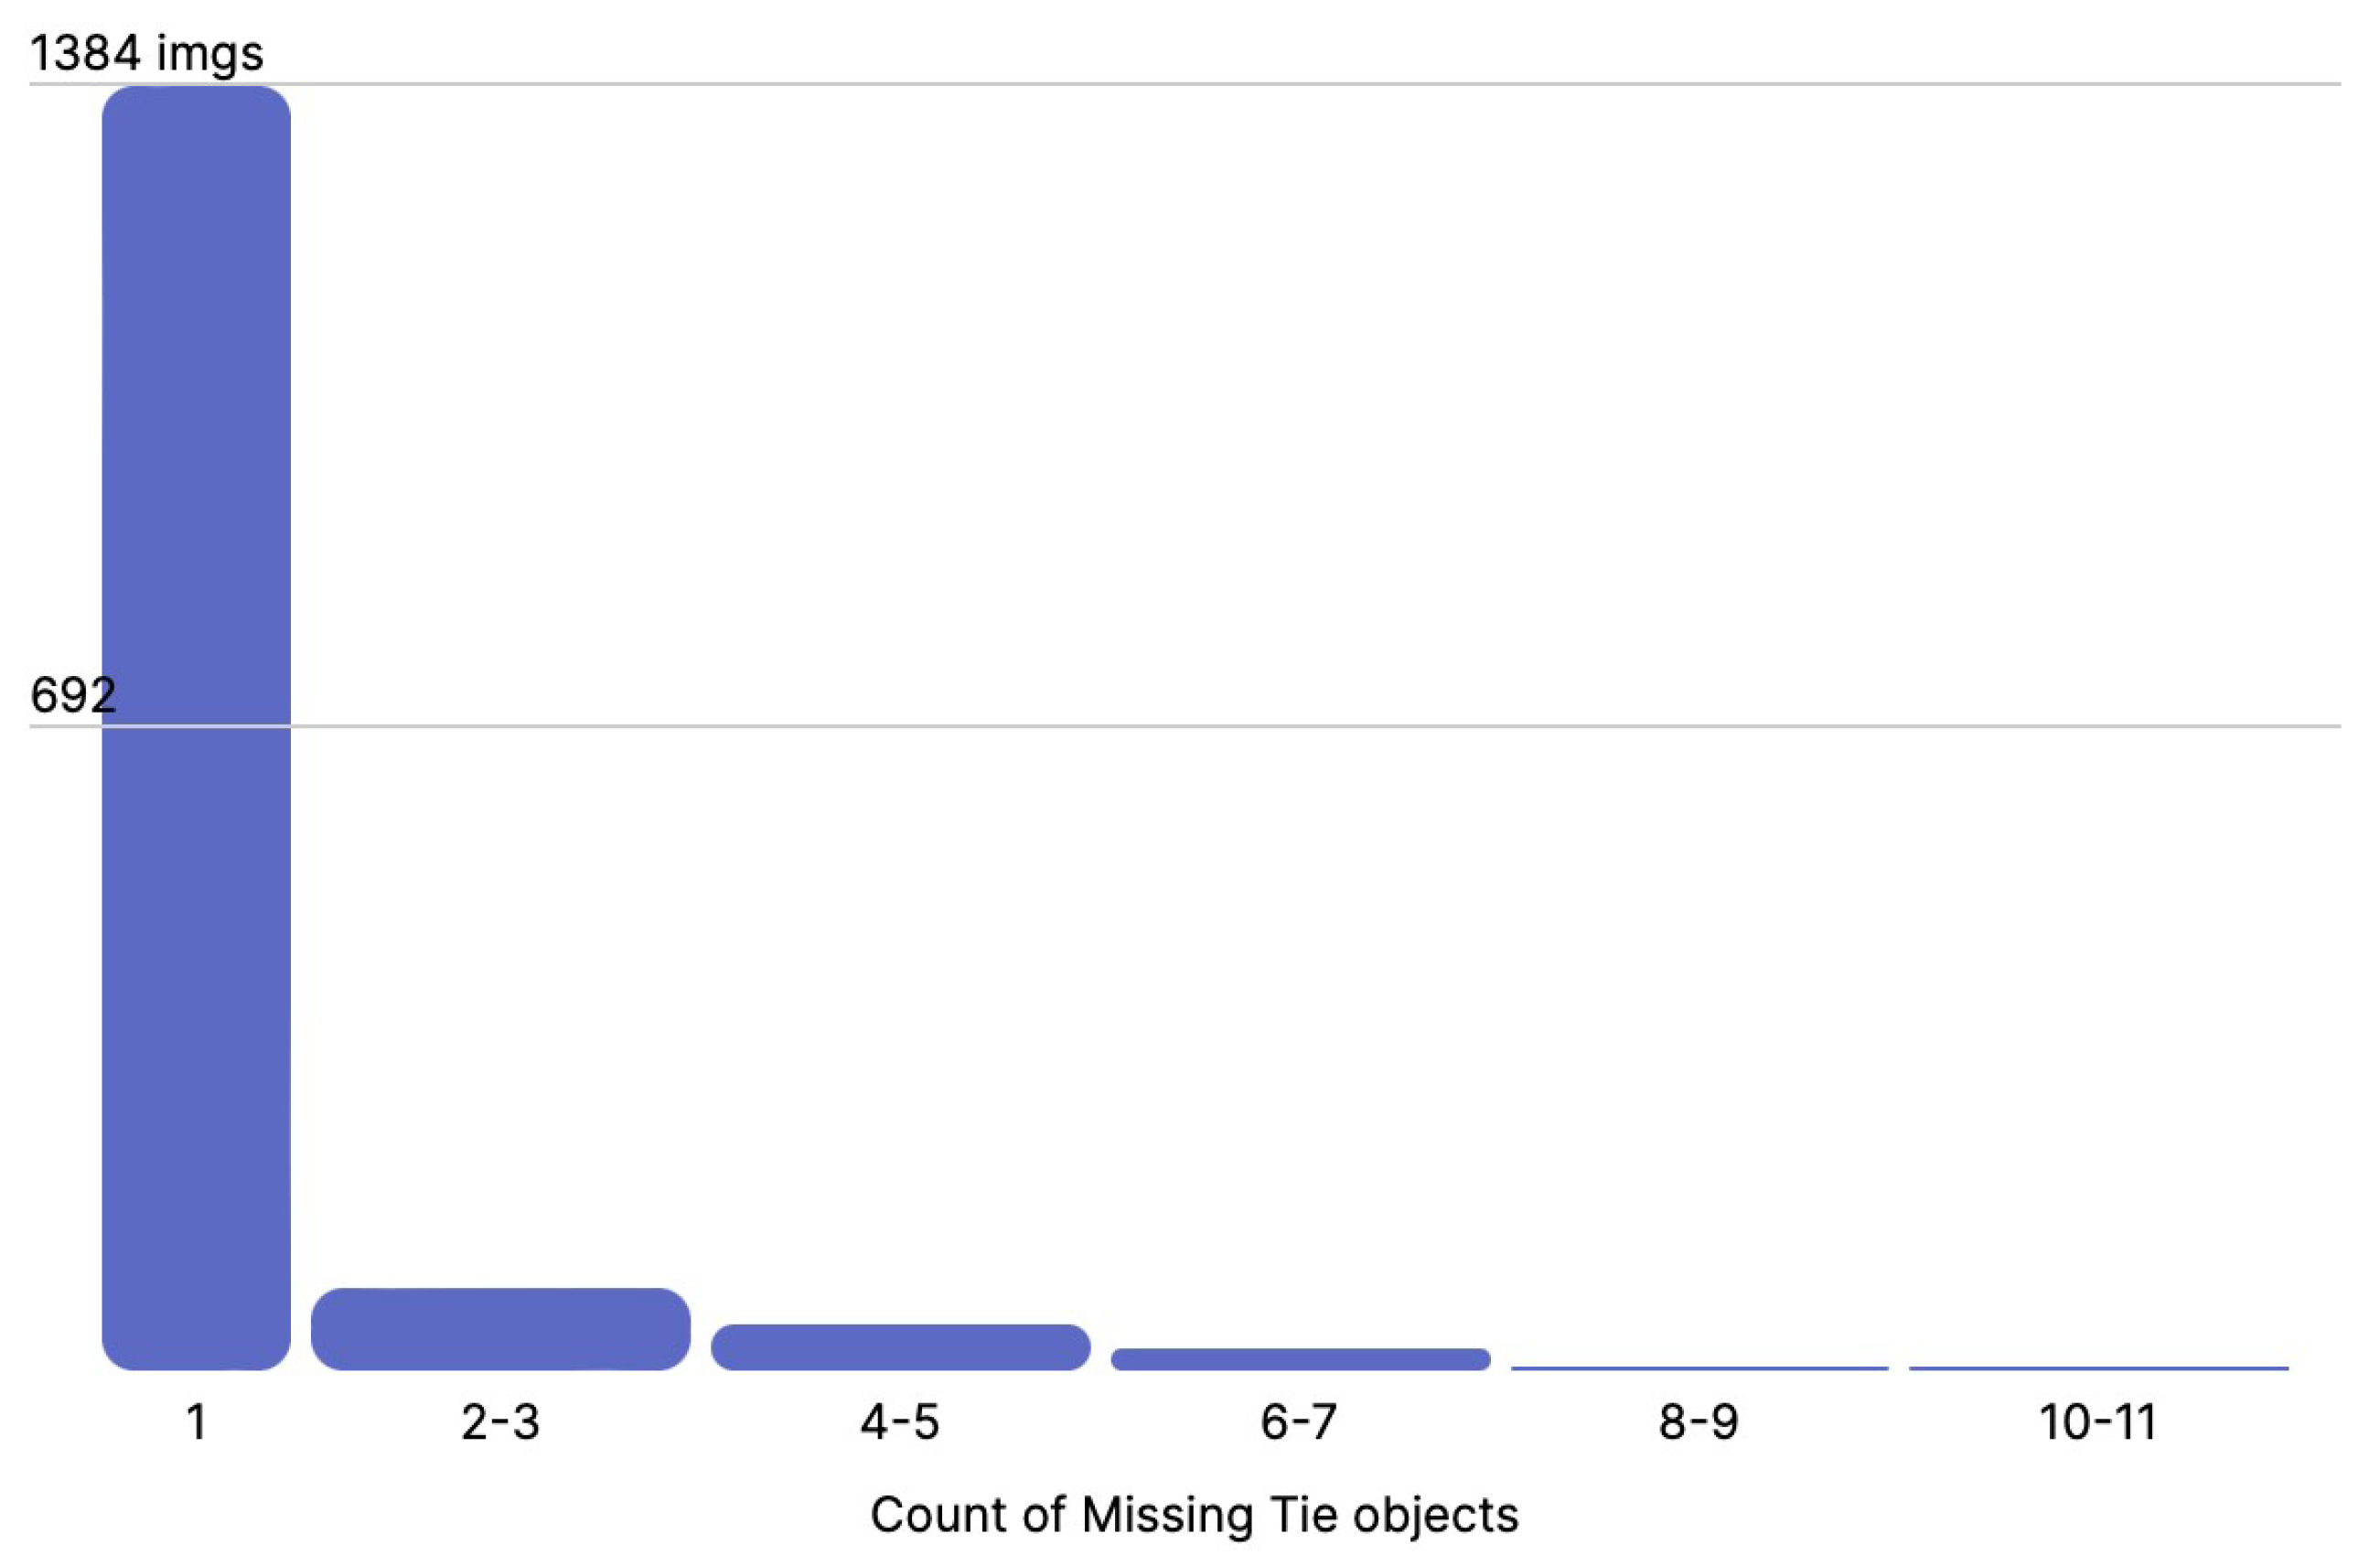
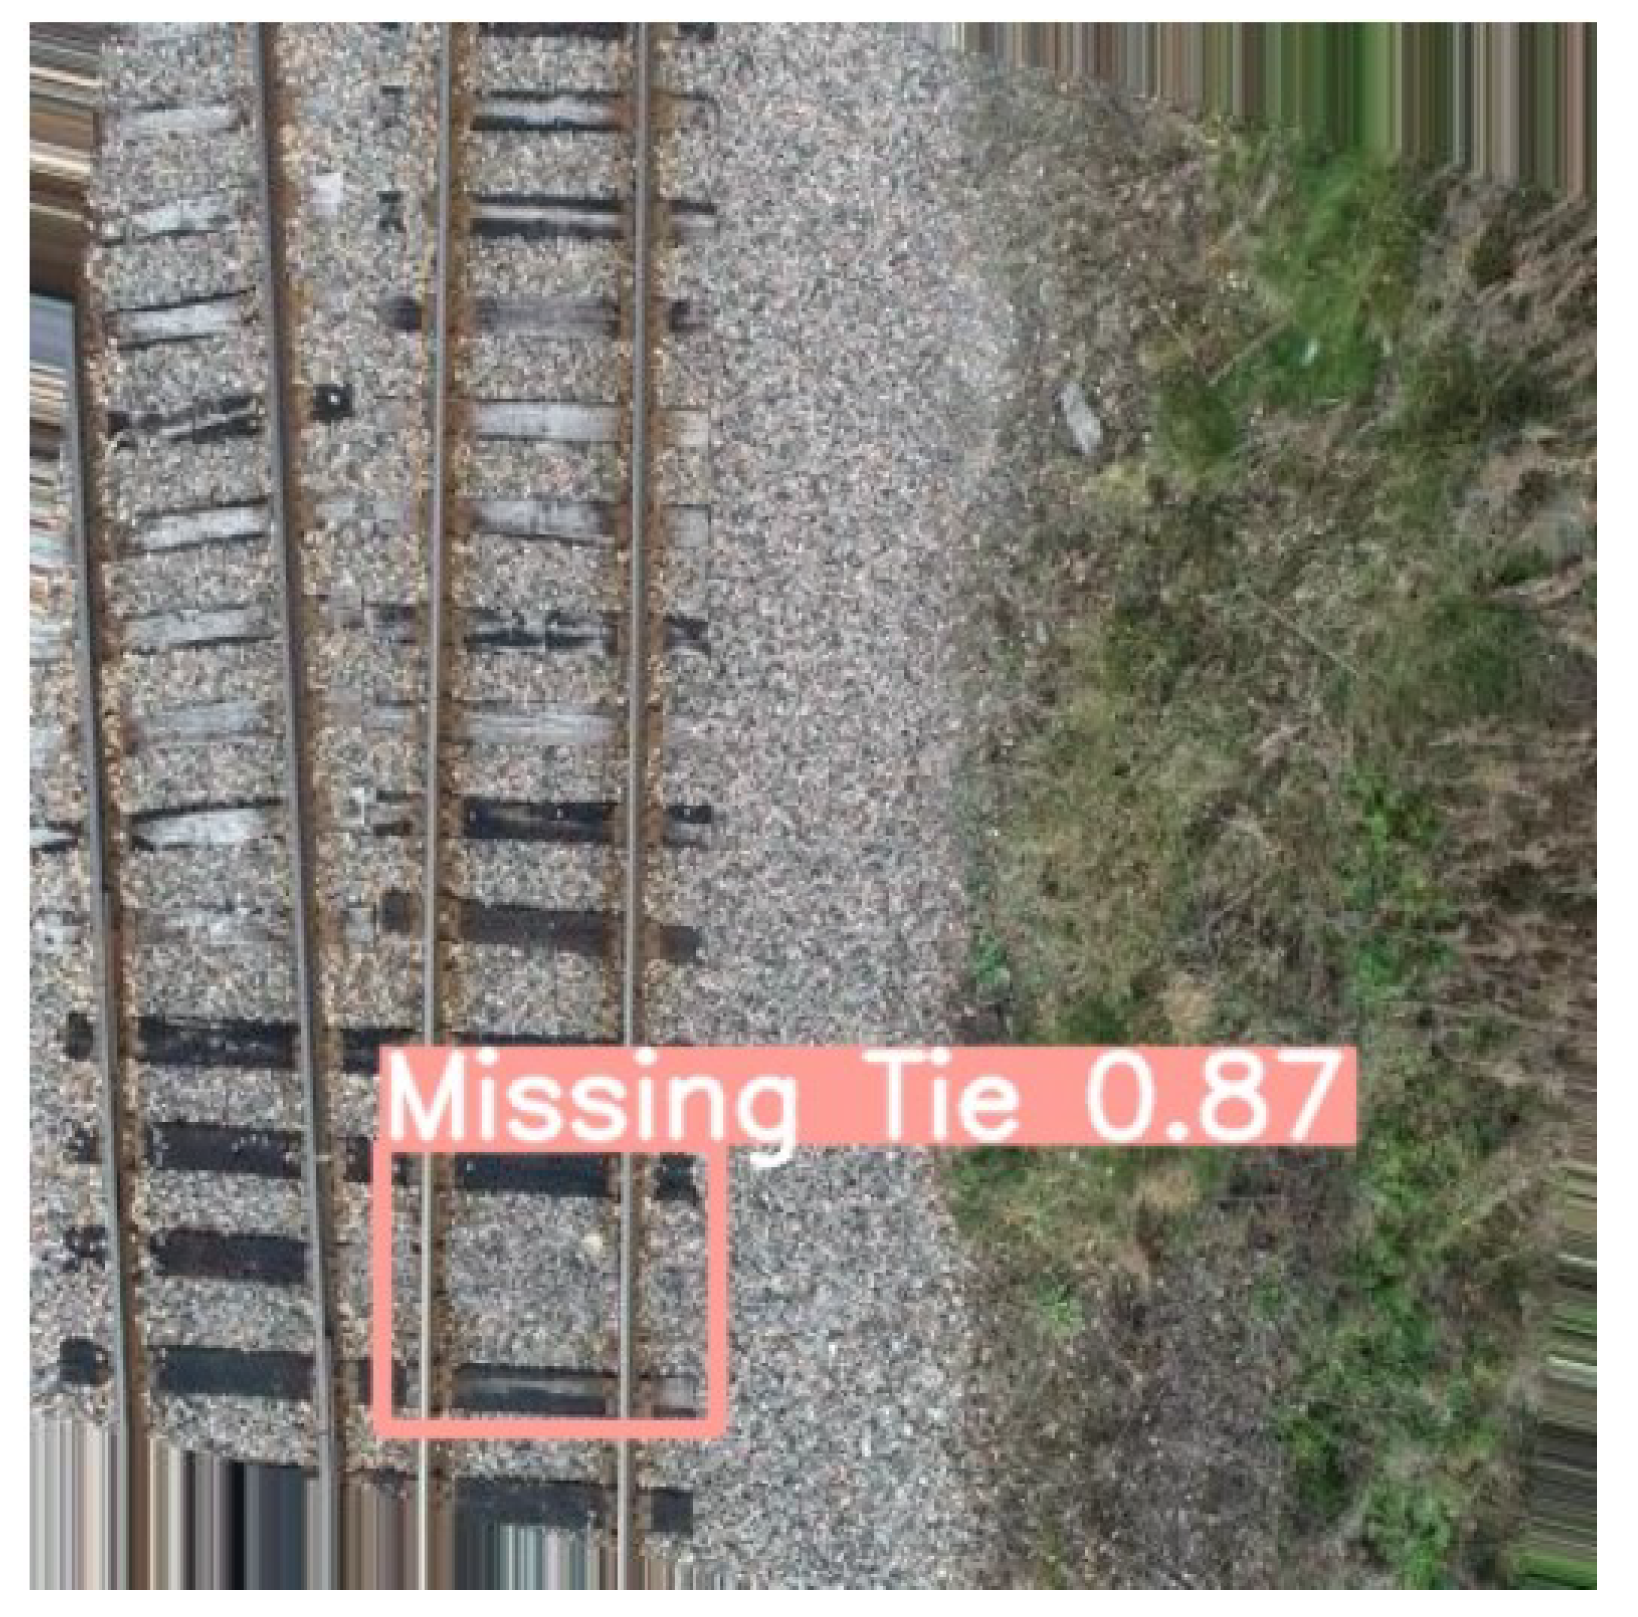
- Missing Tie: The track portion was annotated when there was a missing tie. An example is shown in Figure 7.
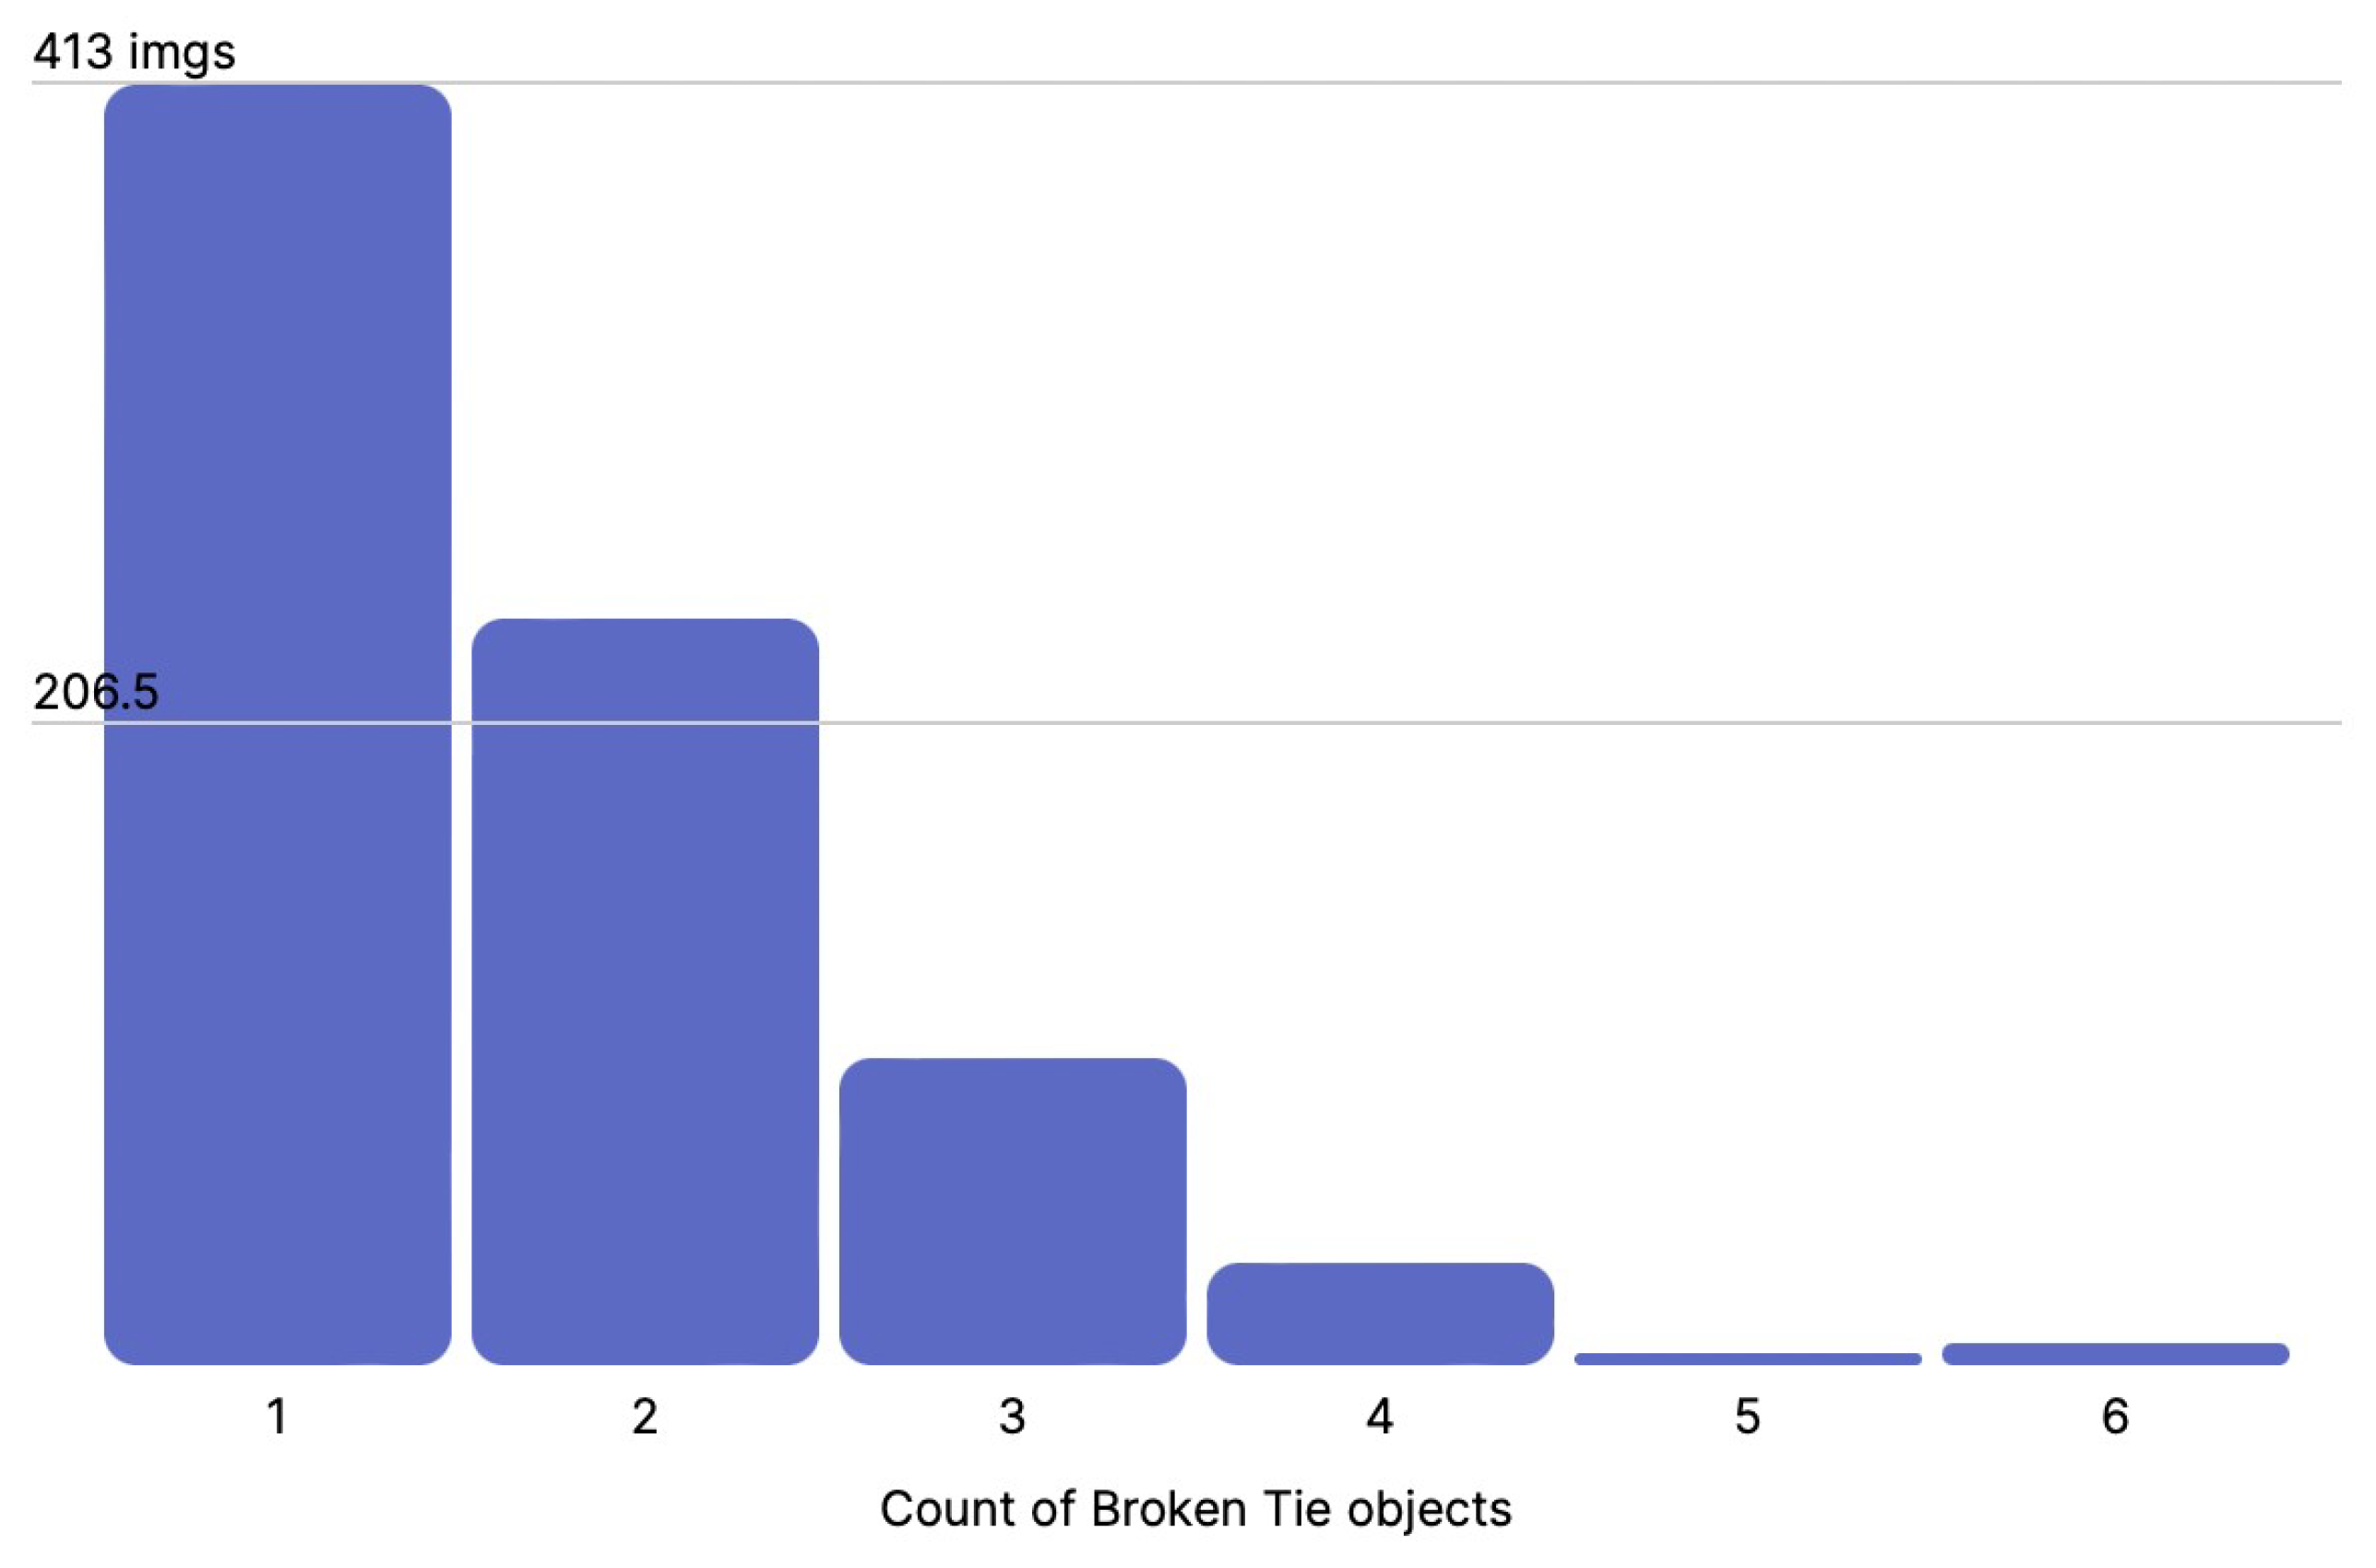
- Broken Tie: If there was a crack at least 50% of the length of the tie (calculated horizontally), the tie was annotated as a broken one. An example is shown in Figure 8.
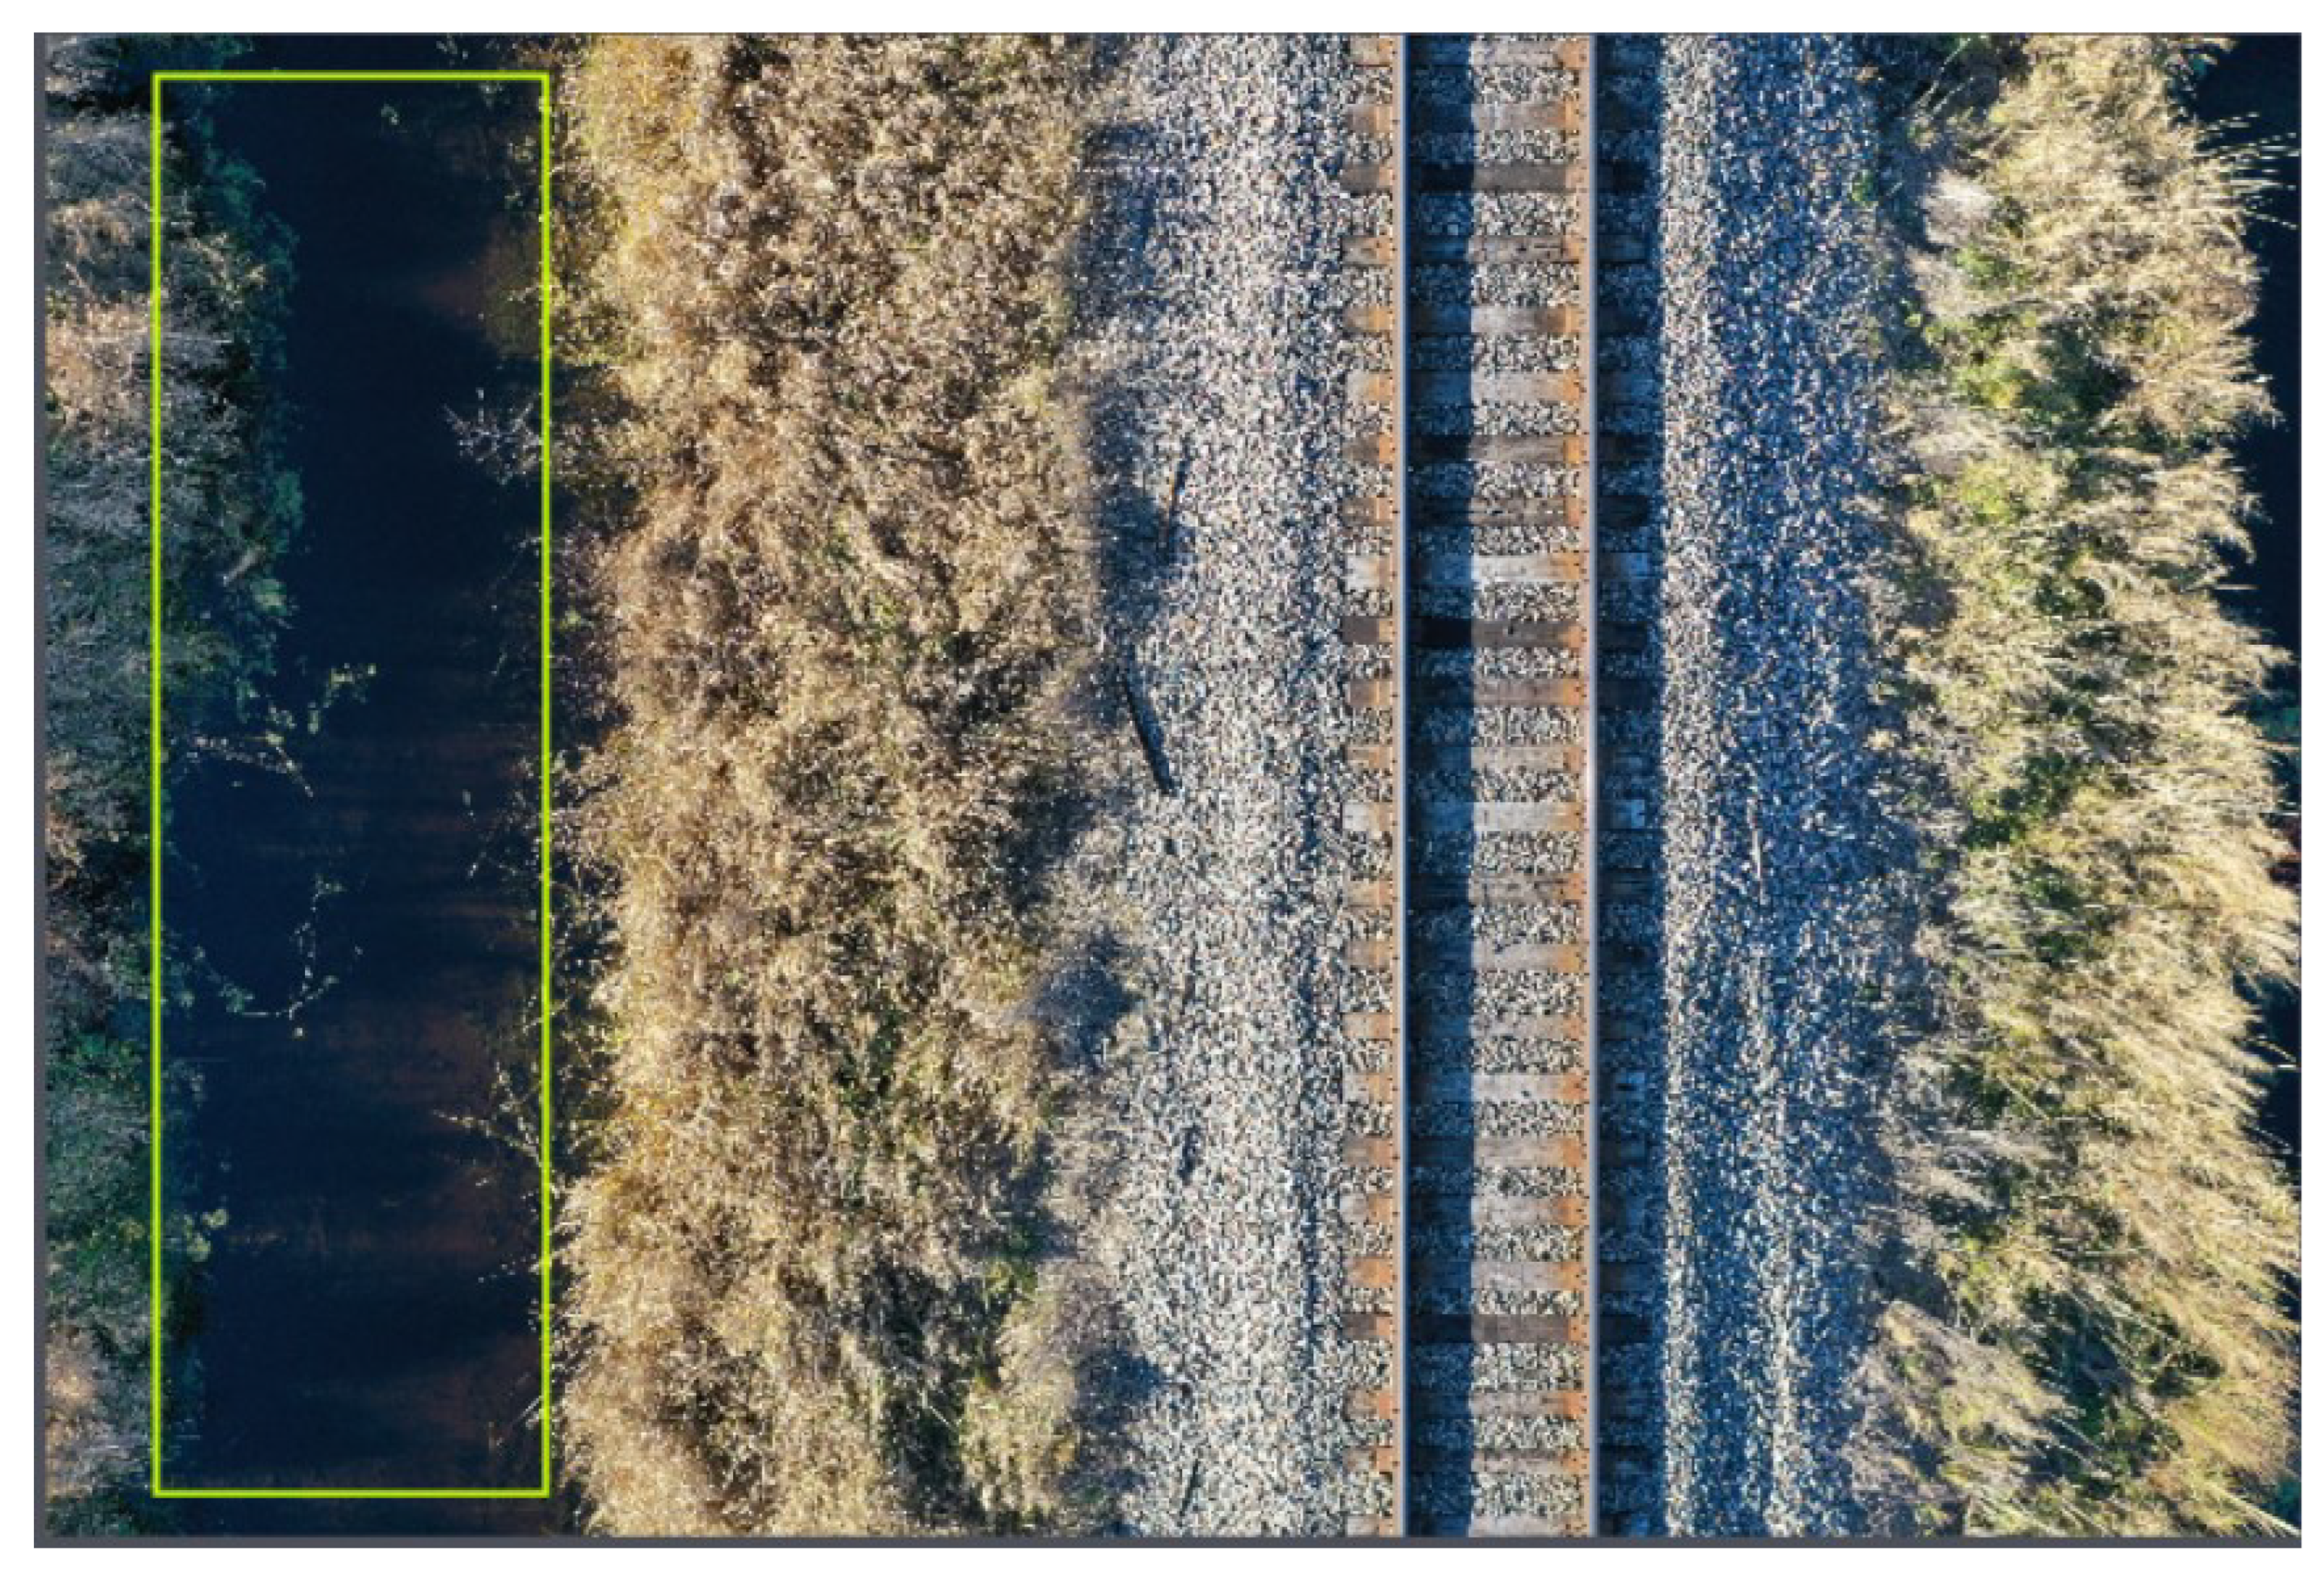
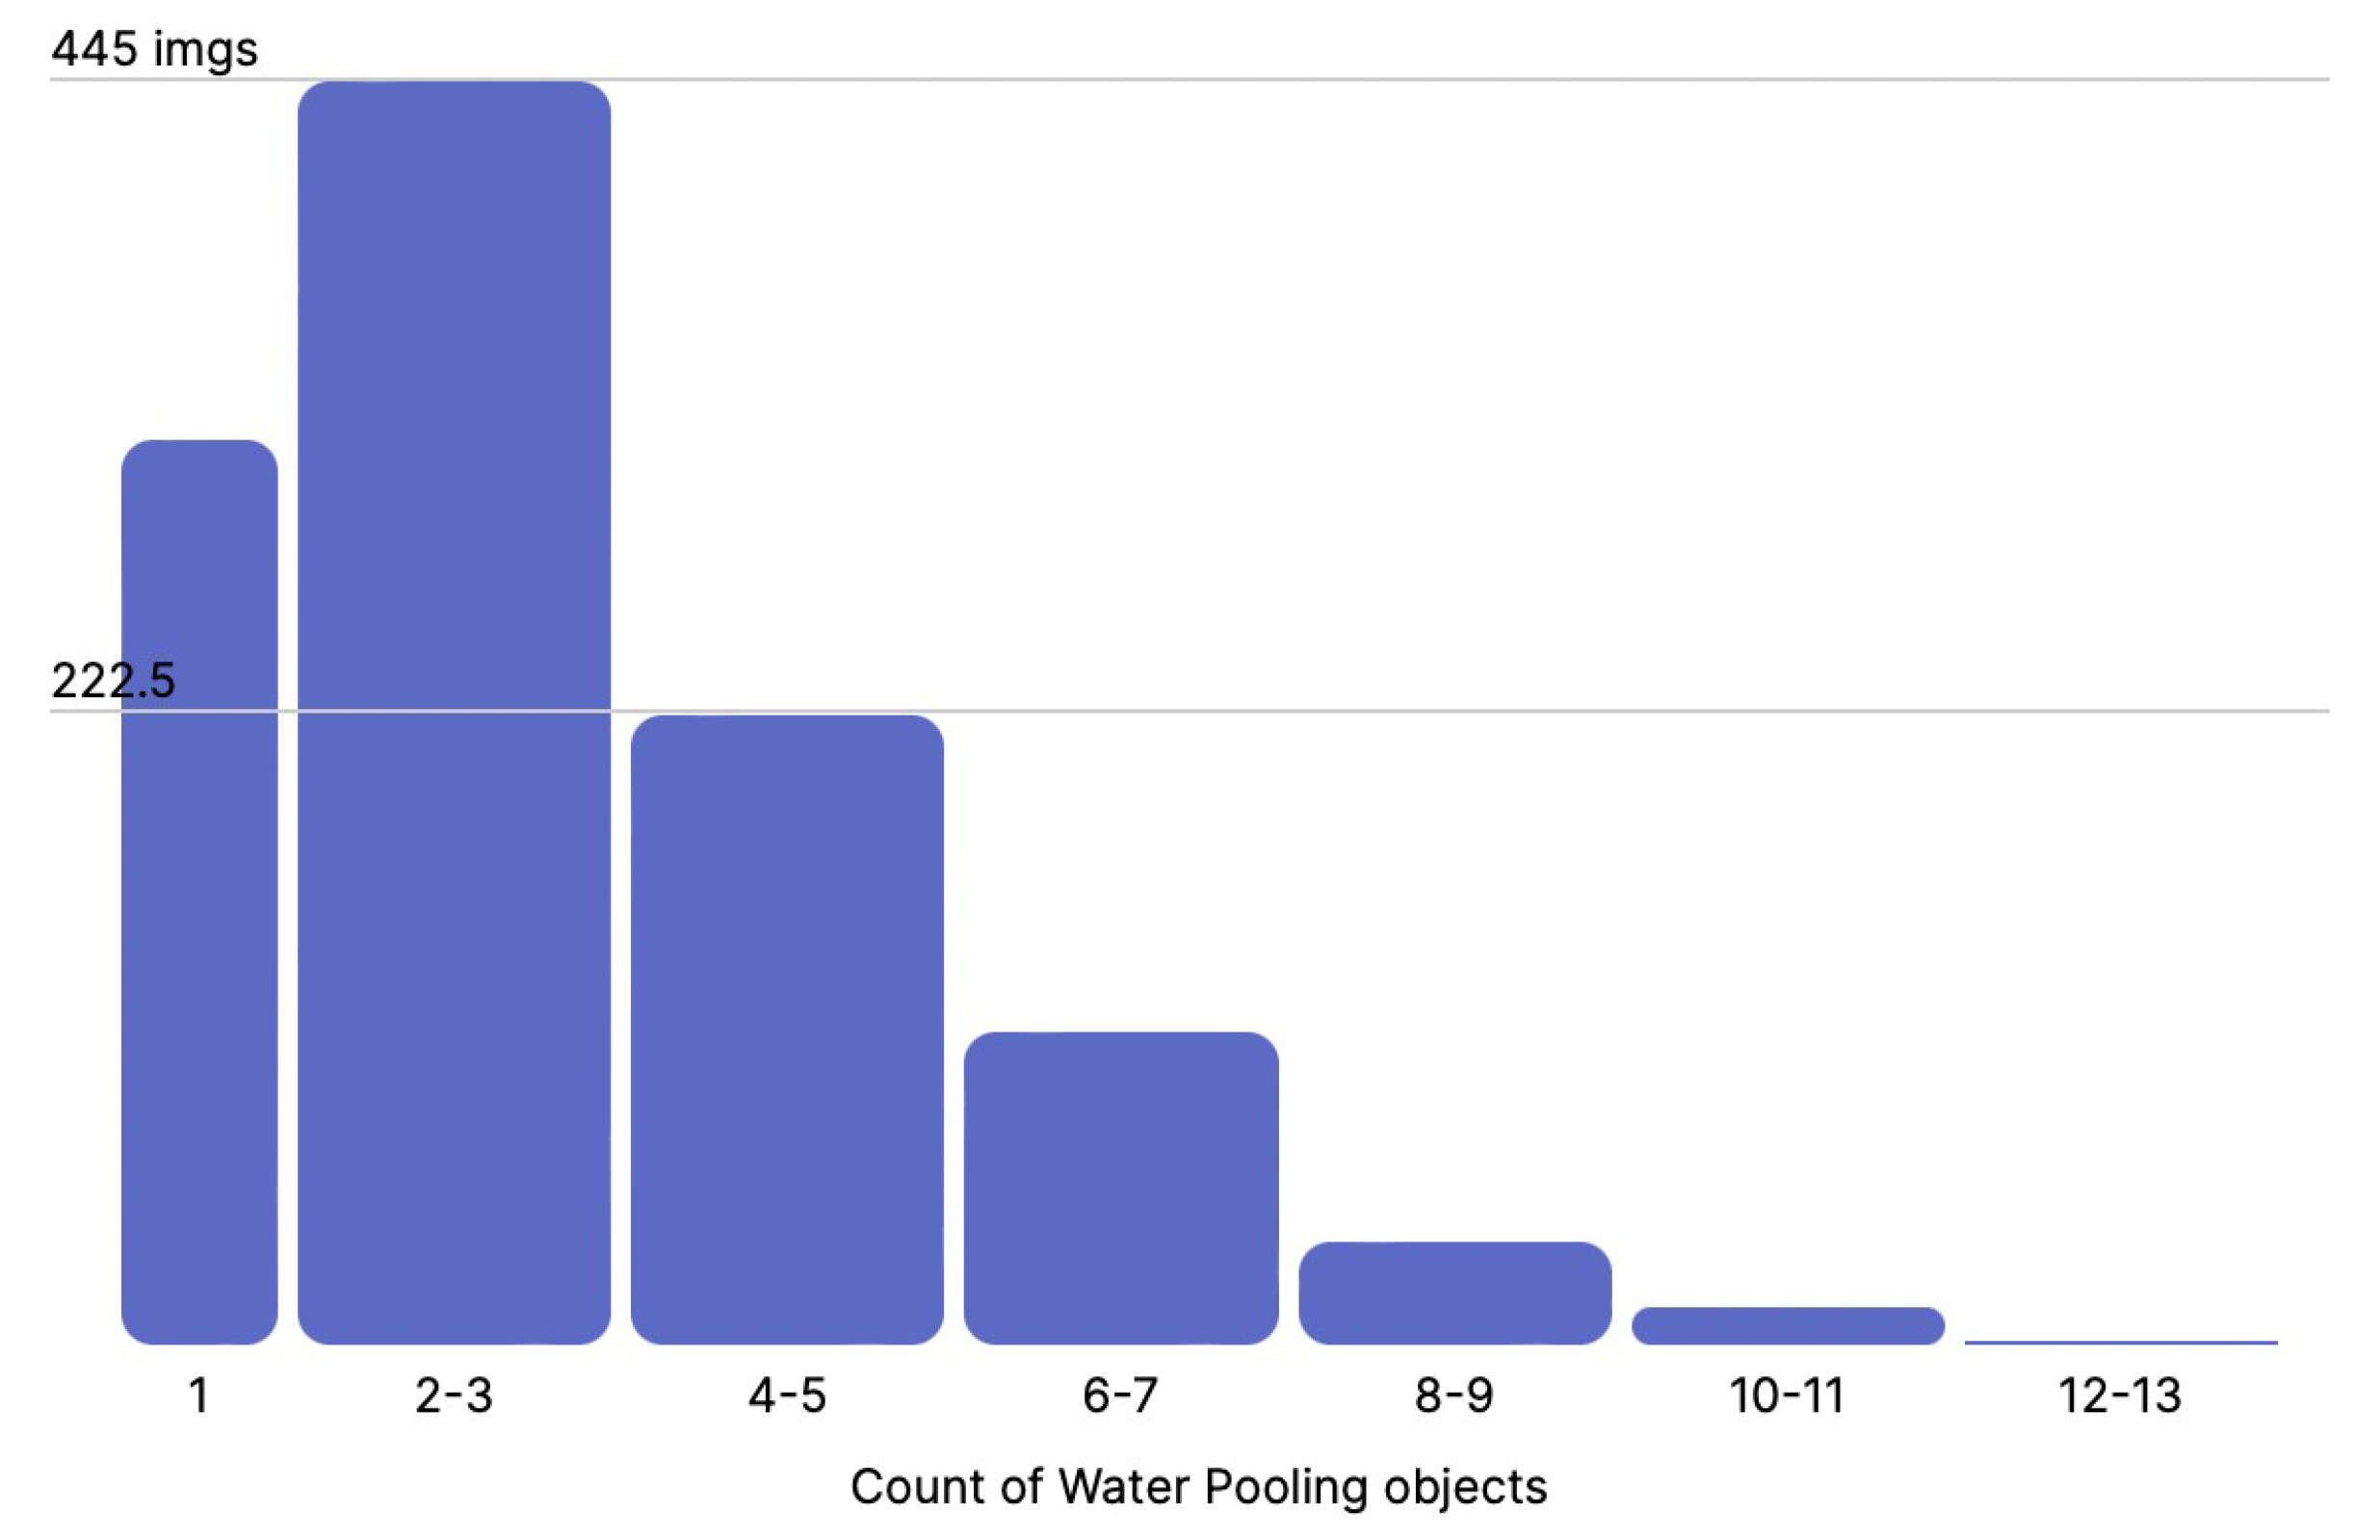
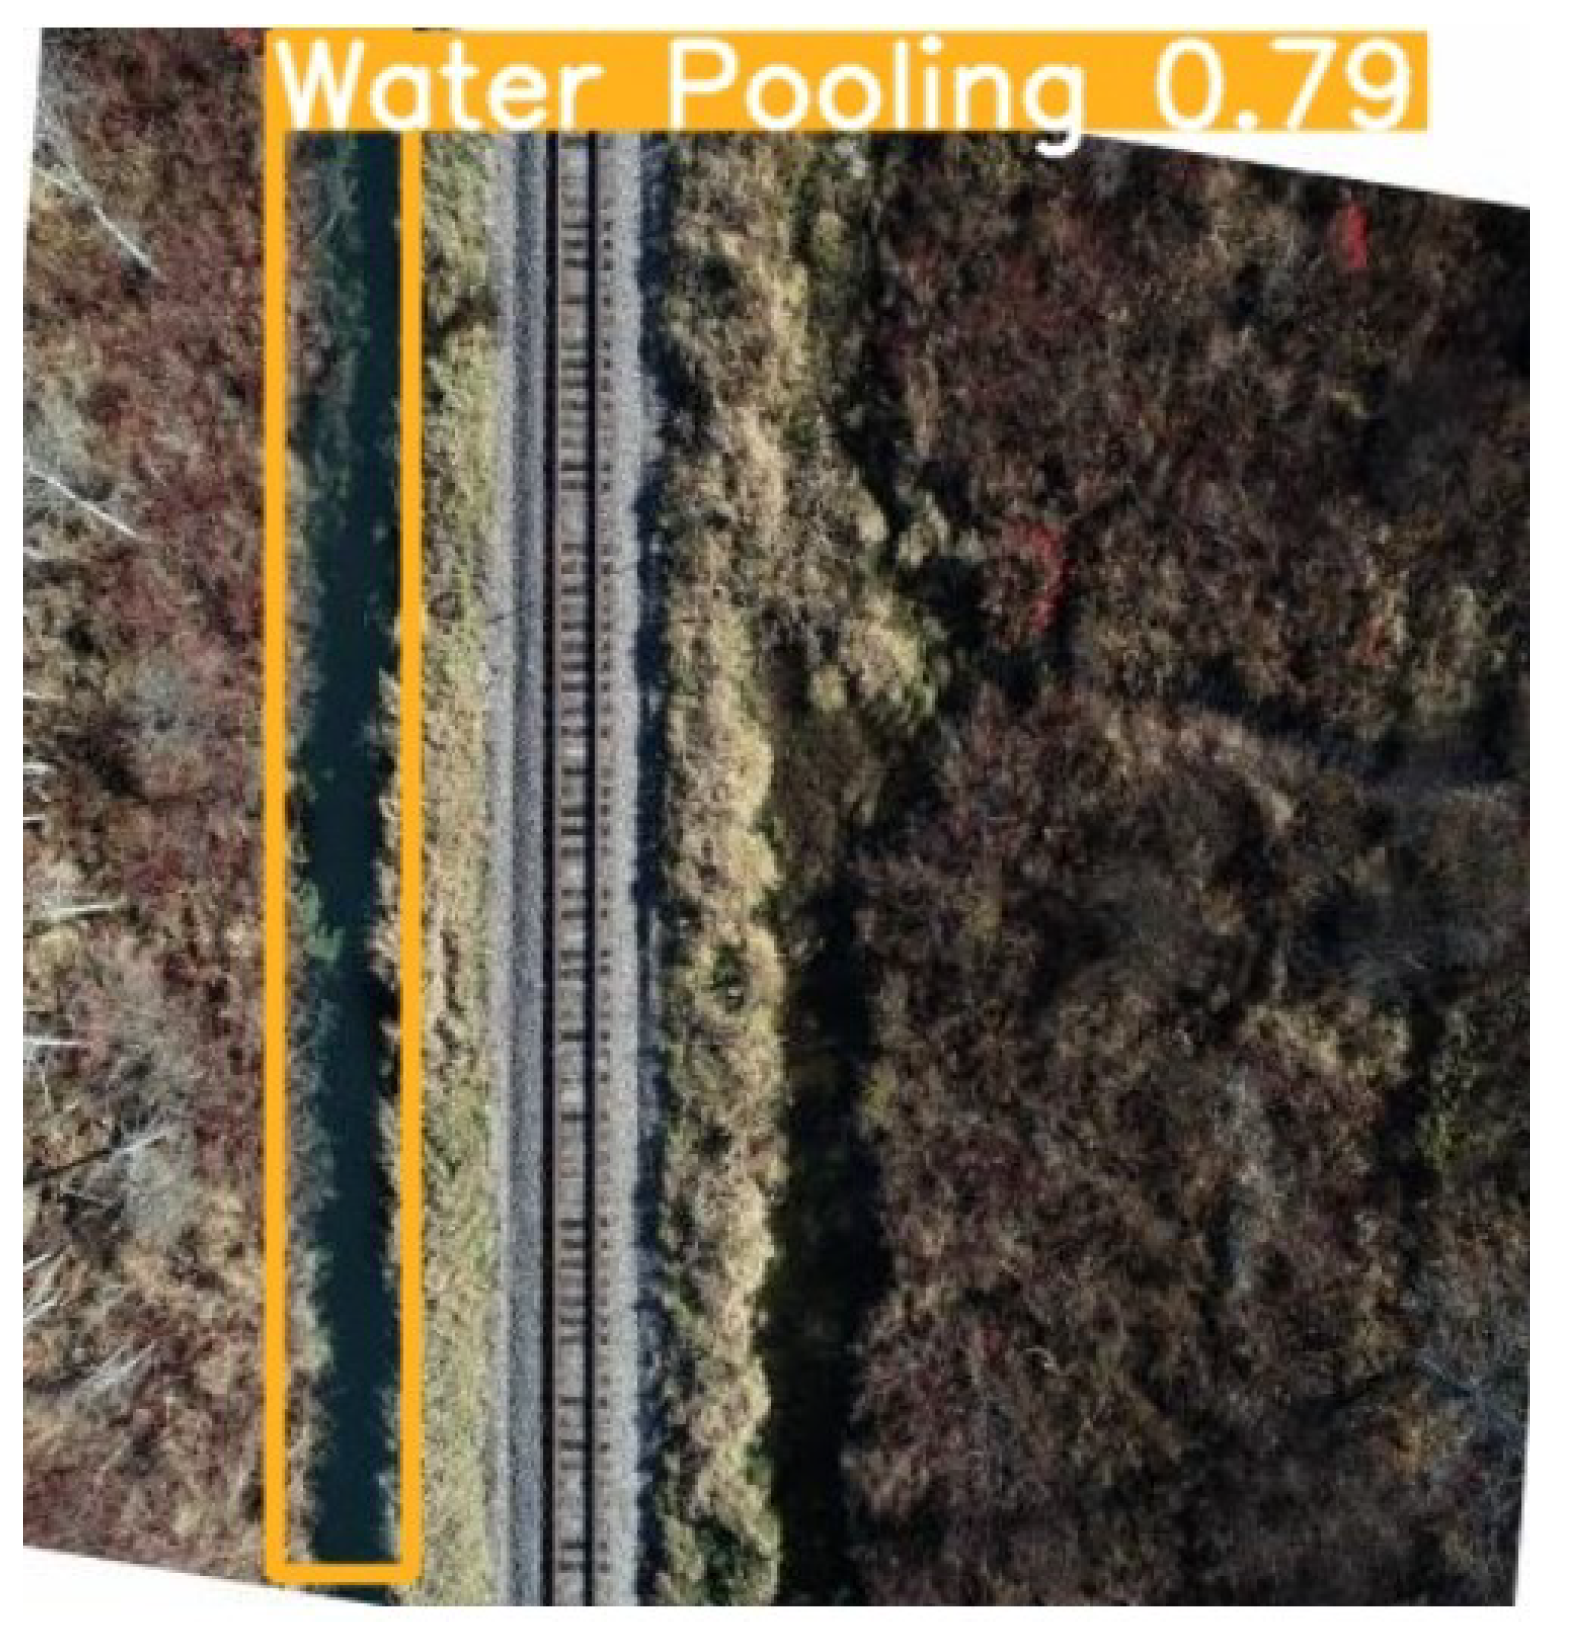
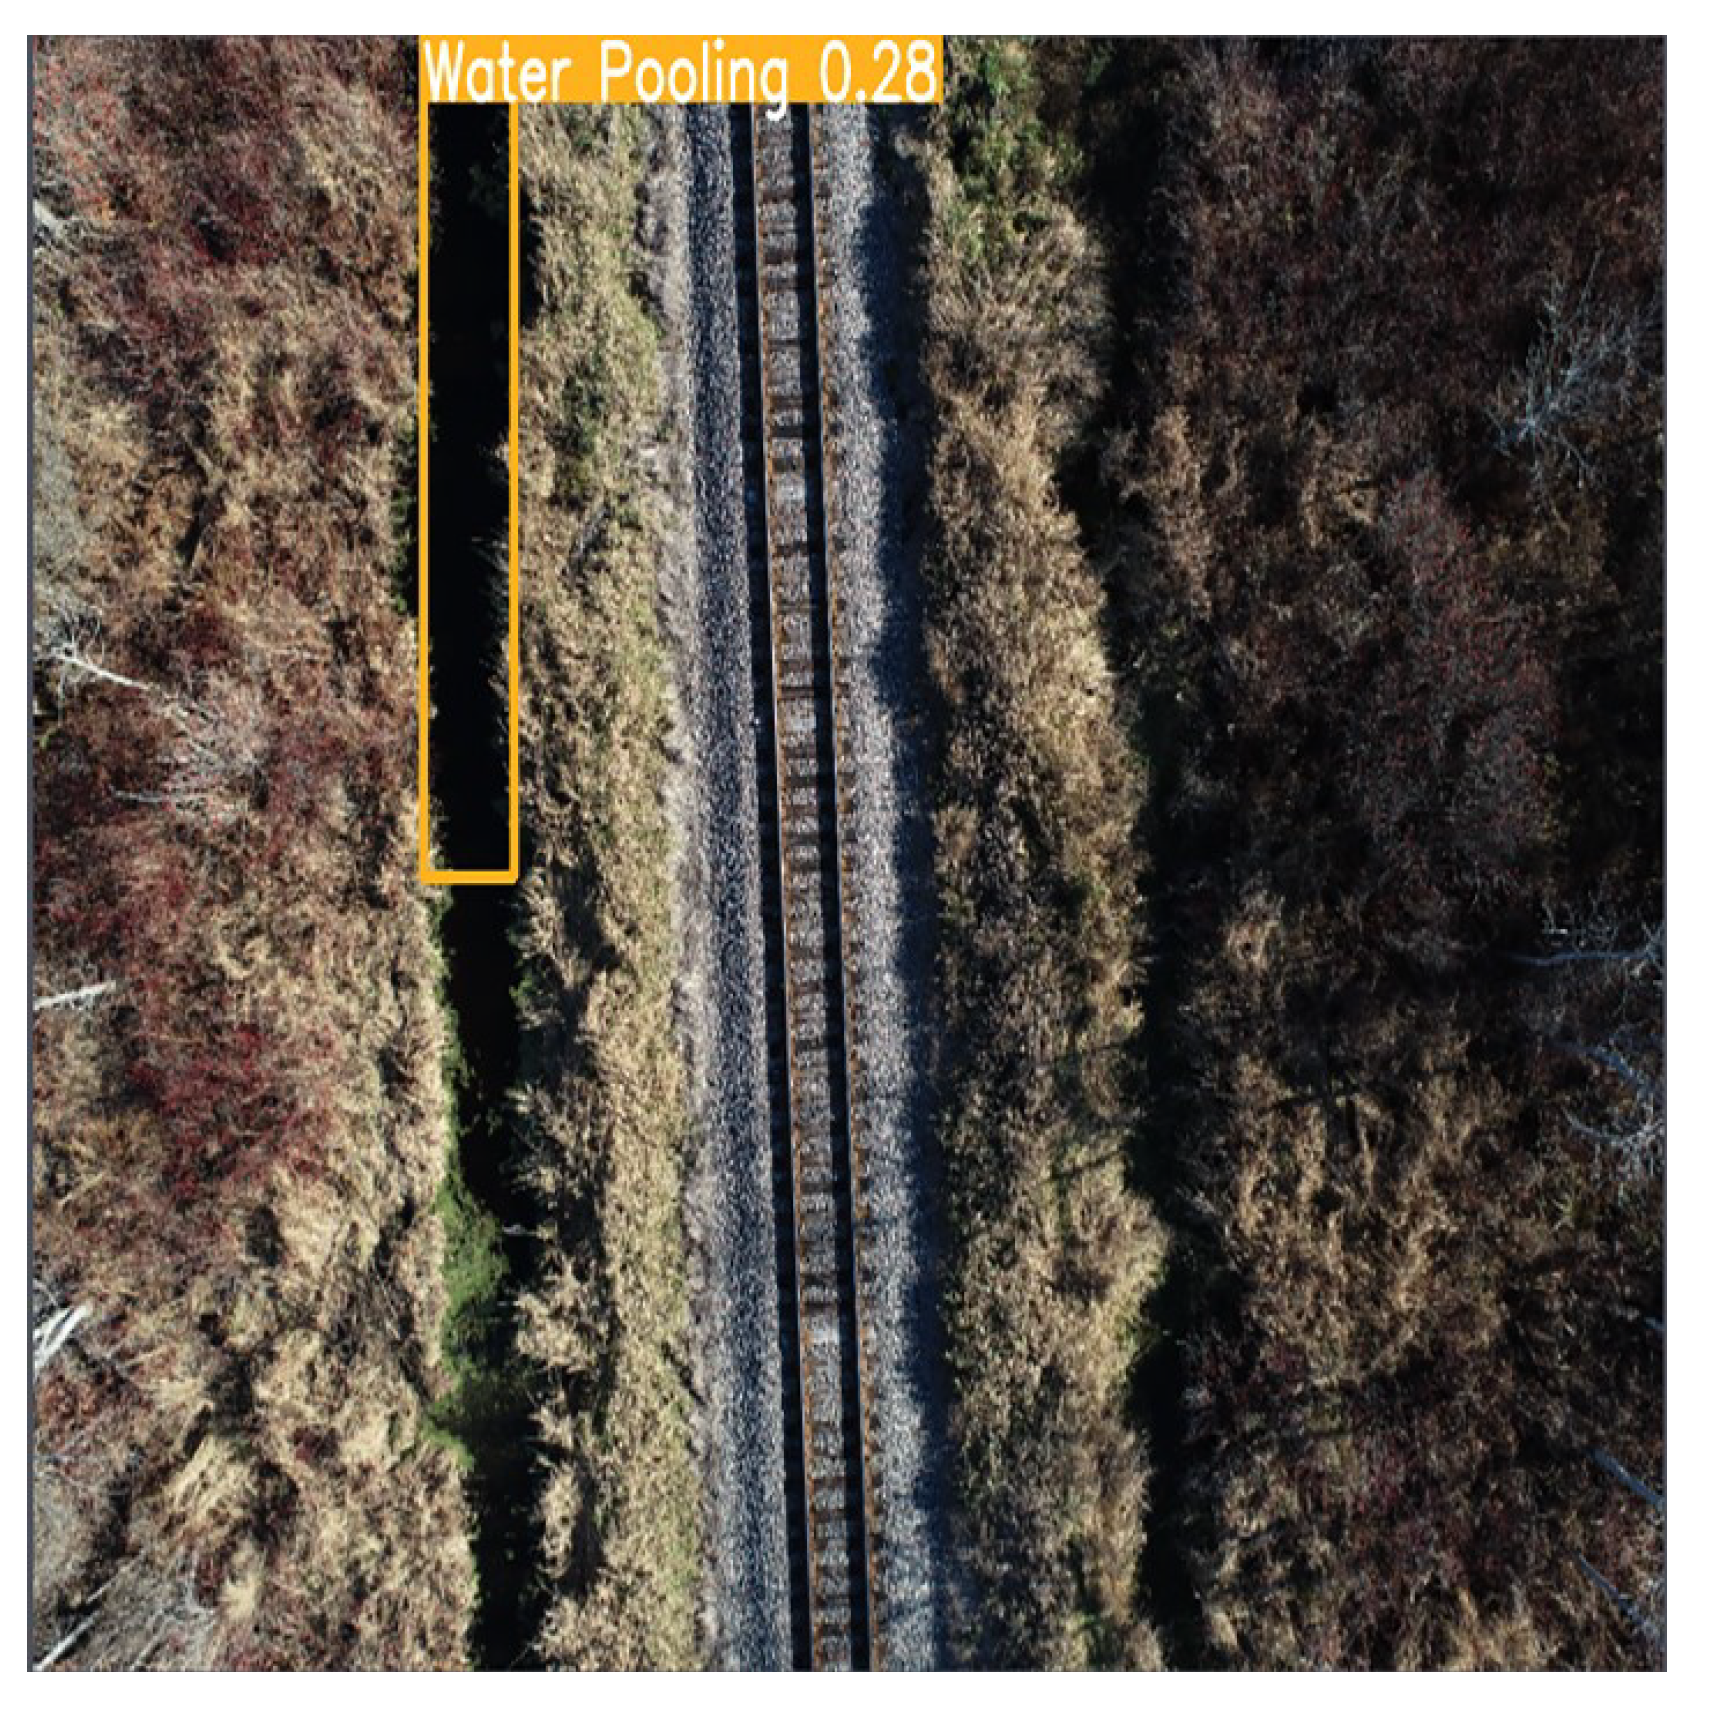
- Water Pooling: Any water body captured in the images was annotated as water pooling to identify the sites affected by water pooling near the tracks. An example is shown in Figure 9.
4.3. Simulation Setup
5. Results
Example Results of Detection
6. Conclusions
6.1. Major Achievements
- The model achieved more than 80% accuracy in categories such as vegetation, missing ties, and water pooling.
- YOLOv5 offers a faster inference time than YOLOv4, allowing for deployment on embedded devices.
- The deployment of the model by the railway maintenance department could significantly reduce the time and resources required for detecting major POI.
6.2. Limitations
- The model does not perform well for the broken tie class due to the lack of distinct, standardized visual features and false identification resulting from ballasts on ties.
- The model lacks terrain diversity in the training dataset, which could result in lower accuracy for different geographic locations.
7. Future Work
Author Contributions
Funding
Institutional Review Board Statement
Informed Consent Statement
Acknowledgments
Conflicts of Interest
References
- Chenariyan Nakhaee, M.; Hiemstra, D.; Stoelinga, M.; van Noort, M. The Recent Applications of Machine Learning in Rail Track Maintenance: A Survey. In Reliability, Safety, and Security of Railway Systems. Modelling, Analysis, Verification, and Certification; Collart-Dutilleul, S., Lecomte, T., Romanovsky, A., Eds.; Springer International Publishing: Cham, Switzerland, 2019; pp. 91–105. [Google Scholar]
- Rail, V. Annual Report 2021. Available online: https://media.viarail.ca/sites/default/files/publications/Annual_Report_2021.pdf (accessed on 1 May 2022).
- Rahman, M.; Mammeri, A. Vegetation Detection in UAV Imagery for Railway Monitoring. In Proceedings of the VEHITS Conference, Online, 28–30 April 2021. [Google Scholar]
- Kellermann, P.; Schönberger, C.; Thieken, A.H. Large-scale application of the flood damage model RAilway Infrastructure Loss (RAIL). Nat. Hazards Earth Syst. Sci. 2016, 16, 2357–2371. [Google Scholar] [CrossRef] [Green Version]
- Aibin, M.; Aldiab, M.; Bhavsar, R.; Lodhra, J.; Reyes, M.; Rezaeian, F.; Saczuk, E.; Taer, M.; Taer, M. Survey of RPAS Autonomous Control Systems Using Artificial Intelligence. IEEE Access 2021, 9, 167580–167591. [Google Scholar] [CrossRef]
- Bengio, Y. Learning Deep Architectures for AI. Found. Trends® Mach. Learn. 2009, 2, 1–127. [Google Scholar] [CrossRef]
- Hu, Y.; Xu, X.; Ou, Z.; Song, M. A Crowdsourcing Repeated Annotations System for Visual Object Detection. In Proceedings of the 3rd International Conference on Vision, Image and Signal Processing, Vancouver, BC, Canada, 26–28 August 2019. [Google Scholar] [CrossRef]
- Wu, J.; Shi, H.; Wang, Q. Contrabands Detection in X-ray Screening Images Using YOLO Model. In ACM International Conference Proceeding Series; ACM Press: New York, NY, USA, 2020. [Google Scholar] [CrossRef]
- Xu, R.; Lin, H.; Lu, K.; Cao, L.; Liu, Y. A Forest Fire Detection System Based on Ensemble Learning. Forests 2021, 12, 217. [Google Scholar] [CrossRef]
- Karimibiuki, M.; Aibin, M.; Lai, Y.; Khan, R.; Norfield, R.; Hunter, A. Drones’ Face off: Authentication by Machine Learning in Autonomous IoT Systems. In Proceedings of the IEEE 10th Annual Ubiquitous Computing, Electronics and Mobile Communication Conference, (UEMCON 2019), New York, NY, USA, 1–4 December 2019; pp. 329–333. [Google Scholar] [CrossRef]
- Vinchoff, C.; Chung, N.; Gordon, T.; Lyford, L.; Aibin, M. Traffic Prediction in Optical Networks Using Graph Convolutional Generative Adversarial Networks. In Proceedings of the International Conference on Transparent Optical Networks, Bari, Italy, 19–23 July 2020; pp. 3–6. [Google Scholar]
- Yuan, X.C.; Wu, L.S.; Peng, Q. An improved Otsu method using the weighted object variance for defect detection. Appl. Surf. Sci. 2015, 349, 472–484. [Google Scholar] [CrossRef] [Green Version]
- Min, Y.; Xiao, B.; Dang, J.; Yue, B.; Cheng, T. Real time detection system for rail surface defects based on machine vision. Eurasip J. Image Video Process. 2018, 2018, 1–11. [Google Scholar] [CrossRef] [Green Version]
- Adham, M.; Mohamed, G.; El-Shazly, A. Railway Tracks Detection of Railways Based on Computer Vision Technique and GNSS Data; MDPI: Basel, Switzerland, 2020. [Google Scholar] [CrossRef]
- Petrović, A.D.; Banić, M.; Simonović, M.; Stamenković, D.; Miltenović, A.; Adamović, G.; Rangelov, D. Integration of Computer Vision and Convolutional Neural Networks in the System for Detection of Rail Track and Signals on the Railway. Appl. Sci. 2022, 12, 45. [Google Scholar] [CrossRef]
- Zheng, D.; Li, L.; Zheng, S.; Chai, X.; Zhao, S.; Tong, Q.; Wang, J.; Guo, L. A Defect Detection Method for Rail Surface and Fasteners Based on Deep Convolutional Neural Network. Comput. Intell. Neurosci. 2021, 2021, 5500. [Google Scholar] [CrossRef] [PubMed]
- Kou, L. A Review of Research on Detection and Evaluation of Rail Surface Defects. EasyChair 2021, 7244, 20. [Google Scholar] [CrossRef]
- Hashmi, M.S.A.; Ibrahim, M.; Bajwa, I.S.; Siddiqui, H.U.R.; Rustam, F.; Lee, E.; Ashraf, I. Railway Track Inspection Using Deep Learning Based on Audio to Spectrogram Conversion: An on-the-Fly Approach. Sensors 2022, 22, 1983. [Google Scholar] [CrossRef] [PubMed]
- Mittal, S.; Rao, D. Vision Based Railway Track Monitoring using Deep Learning. ICT Express 2017, 5, 20. [Google Scholar]
- Ye, J.; Stewart, E.; Chen, Q.; Chen, L.; Roberts, C. A vision-based method for line-side switch rail condition monitoring and inspection. Proc. Inst. Mech. Eng. Part F J. Rail Rapid Trans. 2022, 5, 09544097211059303. [Google Scholar] [CrossRef]
- Cai, N.; Chen, H.; Li, Y.; Peng, Y. Intrusion Detection and Tracking at Railway Crossing; Association for Computing Machinery: New York, NY, USA, 2019. [Google Scholar] [CrossRef]
- Wang, T.; Yang, F.; Tsui, K.L. Real-Time Detection of Railway Track Component via One-Stage Deep Learning Networks. Sensors 2020, 20, 4325. [Google Scholar] [CrossRef] [PubMed]
- Yuan, H.; Chen, H.; Liu, S.; Lin, J.; Luo, X. A deep convolutional neural network for detection of rail surface defect. In Proceedings of the 2019 IEEE Vehicle Power and Propulsion Conference, VPPC 2019-Proceedings, Hanoi, Vietnam, 14–17 October 2019. [Google Scholar] [CrossRef]
- Li, W.; Shen, Z.; Li, P. Crack Detection of Track Plate Based on YOLO. In Proceedings of the 12th International Symposium on Computational Intelligence and Design, (ISCID 2019), Hangzhou, China, 14–15 December 2019; pp. 15–18. [Google Scholar] [CrossRef]
- Redmon, J.; Divvala, S.; Girshick, R.; Farhadi, A. You Only Look Once: Unified, Real-Time Object Detection. In Proceedings of the IEEE Computer Society Conference on Computer Vision and Pattern Recognition, Boston, MA, USA, 7–12 December 2015; pp. 779–788. [Google Scholar] [CrossRef]
- Liu, W.; Anguelov, D.; Erhan, D.; Szegedy, C.; Reed, S.; Fu, C.Y.; Berg, A.C. SSD: Single shot multibox detector. In Lecture Notes in Computer Science (Including Subseries Lecture Notes in Artificial Intelligence and Lecture Notes in Bioinformatics); Springer: Cham, Switzerland, 2016; Volume 9905, pp. 21–37. [Google Scholar] [CrossRef] [Green Version]
- Thuan, D. Evolution of Yolo Algorithm and yolov5: The State-of-the-Art Object Detection Algorithm. Ph.D. Thesis, Hanoi University of Technology, Hanoi, Vietnam, 2021. [Google Scholar]


| Hyperparameter | Target Value | Warmup Value |
|---|---|---|
| Learning Rate | 0.1 | 0.1 |
| Detection Threshold | 0.7 | 0.7 |
| Momentum | 0.937 | 0.8 |
| Weight Decay | 0.0005 | N/A |
| Class | Labels | Precision | Recall | mAP@.5 |
|---|---|---|---|---|
| All | 1936 | 0.741 | 0.61 | 0.707 |
| Broken Tie | 327 | 0.503 | 0.595 | 0.455 |
| Missing Tie | 377 | 0.89 | 0.814 | 0.882 |
| Vegetation | 558 | 0.84 | 0.667 | 0.807 |
| Water Pooling | 674 | 0.809 | 0.765 | 0.742 |
Publisher’s Note: MDPI stays neutral with regard to jurisdictional claims in published maps and institutional affiliations. |
© 2022 by the authors. Licensee MDPI, Basel, Switzerland. This article is an open access article distributed under the terms and conditions of the Creative Commons Attribution (CC BY) license (https://creativecommons.org/licenses/by/4.0/).
Share and Cite
Sharma, R.; Patel, K.; Shah, S.; Aibin, M. Aerial Footage Analysis Using Computer Vision for Efficient Detection of Points of Interest Near Railway Tracks. Aerospace 2022, 9, 370. https://doi.org/10.3390/aerospace9070370
Sharma R, Patel K, Shah S, Aibin M. Aerial Footage Analysis Using Computer Vision for Efficient Detection of Points of Interest Near Railway Tracks. Aerospace. 2022; 9(7):370. https://doi.org/10.3390/aerospace9070370
Chicago/Turabian StyleSharma, Rohan, Kishan Patel, Sanyami Shah, and Michal Aibin. 2022. "Aerial Footage Analysis Using Computer Vision for Efficient Detection of Points of Interest Near Railway Tracks" Aerospace 9, no. 7: 370. https://doi.org/10.3390/aerospace9070370