Article

Numerical Investigation on the Heat Transfer of n-Decane in a Horizontal Channel with Axially Nonuniform Heat Flux under Supercritical Pressure

Shaanxi Key Laboratory of Thermal Sciences in Aero-Engine System, School of Power and Energy, Northwestern Polytechnical University, Xi’an 710072, China
*
Author to whom correspondence should be addressed.
Aerospace 2022, 9(6), 326; https://doi.org/10.3390/aerospace9060326
Submission received: 22 April 2022 / Revised: 1 June 2022 / Accepted: 13 June 2022 / Published: 17 June 2022
(This article belongs to the Special Issue Cooling/Heat transfer (Volume II))

Abstract

:
Regenerative cooling is considered promising in the thermal protection of hypersonic propulsion devices such as SCRamjet. However, the heat transfer deterioration (HTD) of hydrocarbon fuel is a severe threat to the thermal structure safety, especially under axially nonuniform heat flux caused by the thermal load difference in different components. In this work, the heat transfer of trans-critical n-decane in a mini-horizontal channel is numerically investigated. The influences of the axially nonuniform heat flux on the heat transfer is focused on. Two types of HTD are recognized and analyzed. The first type of HTD is induced by the near-wall flow acceleration and the local thickening of the viscous sublayer. The second type of HTD is closely related to the expansion of the low thermal conductivity λ and specific heat cp region, which is seriously worsened under axially nonuniform heat flux, especially when the heat flux peak locates where TwTpc. The minimum HTC deteriorates by 40.80% and the Tw_max increases from 857 K to 1071 K by 27.5%. The maximum fluctuation in pressure drop is 6.8% in the variation in heat flux distribution with Φ = 2. This work is expected to offer a reference to the proper match of fuel temperature distribution and the engine heat flux boundary in SCRamjet cooling system design.

1. Introduction

Air-breathing hypersonic flight vehicles offer brand new options for rapid air strike and transportation, which draw continuous research focus. SCRamjet is the key hypersonic propulsion device [1,2]. However, the aerodynamic and combustion heating during hypersonic flights becomes so serious that the engine faces risks of structure over-temperature and failure. Multiple thermal protection technologies are needed, in which regenerative cooling is considered promising and feasible [3,4]. Before being injected and burnt, the endothermic hydrocarbon fuel flows through the cooling channels inside the hot engine walls as coolant which effectively improves both the cooling effect and engine performance [5,6].
To avoid the phase change and offer essential injection pressure, the operating pressure in the regenerative cooling channel is usually supercritical. During the cooling process, the hydrocarbon fuel experiences the trans-critical process [7]. Thermo-physical properties vary dramatically (Figure 1). Heat transfer deterioration (HTD) easily occurs in this zone [8,9], which most likely causes structure failure [10,11,12,13]. To better design the regenerative cooling system, the heat transfer characteristics of the trans-critical/supercritical hydrocarbon fuel should be carefully studied.
The HTD of supercritical carbon dioxide draws numerous research interests in the effects of buoyancy lift [14,15,16], micro-scale channels [17,18,19], thermal properties [20], and the working conditions [21,22]. Regarding the supercritical hydrocarbon fuel, two types of HTD of the supercritical hydrocarbon fuel in mini-tubes are observed, where the wall and bulk fluid temperature exceeds the pseudo-critical temperature [23,24,25]. The HTD mechanism is investigated both experimentally and numerically.
First, the effects of buoyancy and thermal acceleration on the HTD are found to be distinct in certain regions [26,27,28]. The buoyancy effects are more obvious in vertical tubes because of the gravity. Kim et al. [29] presented a criterion of thermal acceleration factor Kv4q+/Reb, where q+ = βbqw/ρubcp,b (βb is the bulk thermal expansion coefficient, qw is the local wall heat flux, ρ is the density, ub is the bulk velocity, cp,b is the bulk specific heat). Zhang et al. [30] concluded that HTD occurs when the thermal acceleration parameter Kv < 1.5 × 10⁻⁸ or the buoyancy factor Bo* =   G r * R e 3.425 P r 0.8   < 1.6 × 10⁻¹⁰ in 1.8 mm downward tubes. Fu et al. [31] found that Bo* =   G r * R e 3.425 P r 0.8   = 1.0 × 10⁻⁸ is the critical criterion to evaluate the buoyancy effect in vertical tubes with inner diameters of 0.538 mm, 1.09 mm, and 1.82 mm. The work of Liu et al. [32] showed that for lower inlet Reynolds numbers (e.g., 2700–4000), buoyancy may significantly deteriorate the heat transfer of upward flow and enhance the heat transfer of downward flow. A threshold for Bo* is obtained as 2 × 10⁻⁷, above which buoyancy influences the heat transfer obviously in the 2.0 mm inner-diameter vertical tubes. As for the thermal acceleration, it links the heating process and the turbulence variation. Dang et al. [33] claimed that the turbulent kinetic energy and the turbulence production term in the vicinity of a wall presented the minimum values where HTD occurred. In rectangular channels [34,35,36], the strong thermal stratification phenomenon may occur. The HTD is attributed to the decline in turbulent kinetic energy driven by thermal acceleration [34], as well as the formation of large thermal resistance in both the viscous sublayer and the core turbulent field [35]. Kurganov et al. [37] discovered that the velocity profile of supercritical fuel tends to be M-shaped under heating, which decreases the turbulent kinetic energy and causes HTD [38,39,40]. Wang et al. [24] and Sun et al. [25] also discovered that the abnormal distributions of near-wall turbulent kinetic energy and the radial velocity or laminar-like flow are the reasons of the HTD.
Thermo-physical properties also affect the heat transfer obviously. Koshizuka et al. [13] found that the variations in viscosity and Pr number in the near-wall region affect the heat transfer significantly. Zhang et al. [41] pointed out that variations in thermal conductivity and specific heat capacity affect the heat transfer deterioration with large mass flow rate remarkably. Yang et al. [42] found that the dramatic increase in isobaric specific heat capacity enhances the heat transfer in the laminar flow regime and the pseudo-critical region. As the fuel temperature exceeds a threshold value, around 800 K for most hydrocarbon fuels, an endothermic pyrolytic chemical reaction occurs, which leads to a great variation in the fuel components and thermal properties. From the experimental results of Yang et al. [42], the heat transfer is improved by the thermo-physical property variation, thermoacoustic oscillation, and endothermic reactions of the hydrocarbons. The gas resistance and coke deposition in the boundary fluid deteriorate the heat transfer. Significant research efforts are expended to the heat transfer process under pyrolysis and coke formation [43,44,45].
The operational conditions influence the hydrocarbon fuel heat transfer as well. Jackson et al. [26] pointed out that q/G (where G is mass flux) can be used to evaluate the thermal diffusion features in the near-wall region of the supercritical fluid heat transfer. Urbano et al. [46,47] focused on the initial condition for the HTD phenomenon of three light hydrocarbons (methane, ethane, and propane) in the forced convection regime in a 4 mm circular tube. The occurrence of HTD is strongly affected by the critical ratio of the wall heat flux to the mass flow rate. Wang et al. [48] and Hua et al. [49] studied the effects of key operational parameters on the heat transfer of methane and n-heptane inside a 2 mm horizontal miniature tube, which includes the operating pressure, the wall heat flux, the inlet velocity, and the inlet temperature. The HTD occurs once the wall temperature reaches the pseudo-critical temperature. Fu et al. [31] analyzed the heat transfer characteristics of aviation kerosene RP-3 with various tube diameters. The tube diameter effect becomes significant when Tb/Tpc > 0.8. Liu et al. [32] experimentally investigated the effect of the heat flux on the heat transfer of n-decane under 3 MPa and 5 MPa. The HTD regions are determined for different inlet Reynold numbers. In addition, considering the practical demand of hypersonic flight missions, the heat transfer of hydrocarbon fuel under accelerating states was also studied [50,51,52]. The results show that the HTD is significantly affected by acceleration and the overall average surface heat transfer coefficient increases by 27.5% under the maximum acceleration of 6 g. The HTD suppression method is also a hot topic [53,54]. Huang et al. [23] found that HTD can be effectively eliminated by increasing the mass flow rate and pressure and decreasing the heat flux and inlet temperature.
It can be seen that various experimental and numerical studies have been carried out to study the flow and heat transfer characteristics of hydrocarbon fuel at supercritical pressure. However, the wall heat flux in the SCRamjet is usually nonuniform [55], which exhibits a distinct effect on heat transfer. For example, the heat flux of the combustor wall is usually highest because of the combustion heat release. The heat flux of the inlet wall is usually lowest because no combustion occurs in this section. Even in the same axial position, the circumferential heat flux can be nonuniform, which has received much attention [56,57,58]. Yet, the effects of the axially nonuniform heat flux boundary on the heat transfer deserve more focus to better understand the regenerative cooling of SCRamjet.
In this work, the heat transfer features of the trans-critical n-decane in a mini-horizontal circular tube is numerically studied. The mechanisms of the HTD are focused on, especially the influence of axially nonuniform heat flux on the HTD. The results of this work are expected to offer possible references for the design of the SCRamjet cooling system.

2. Model Description

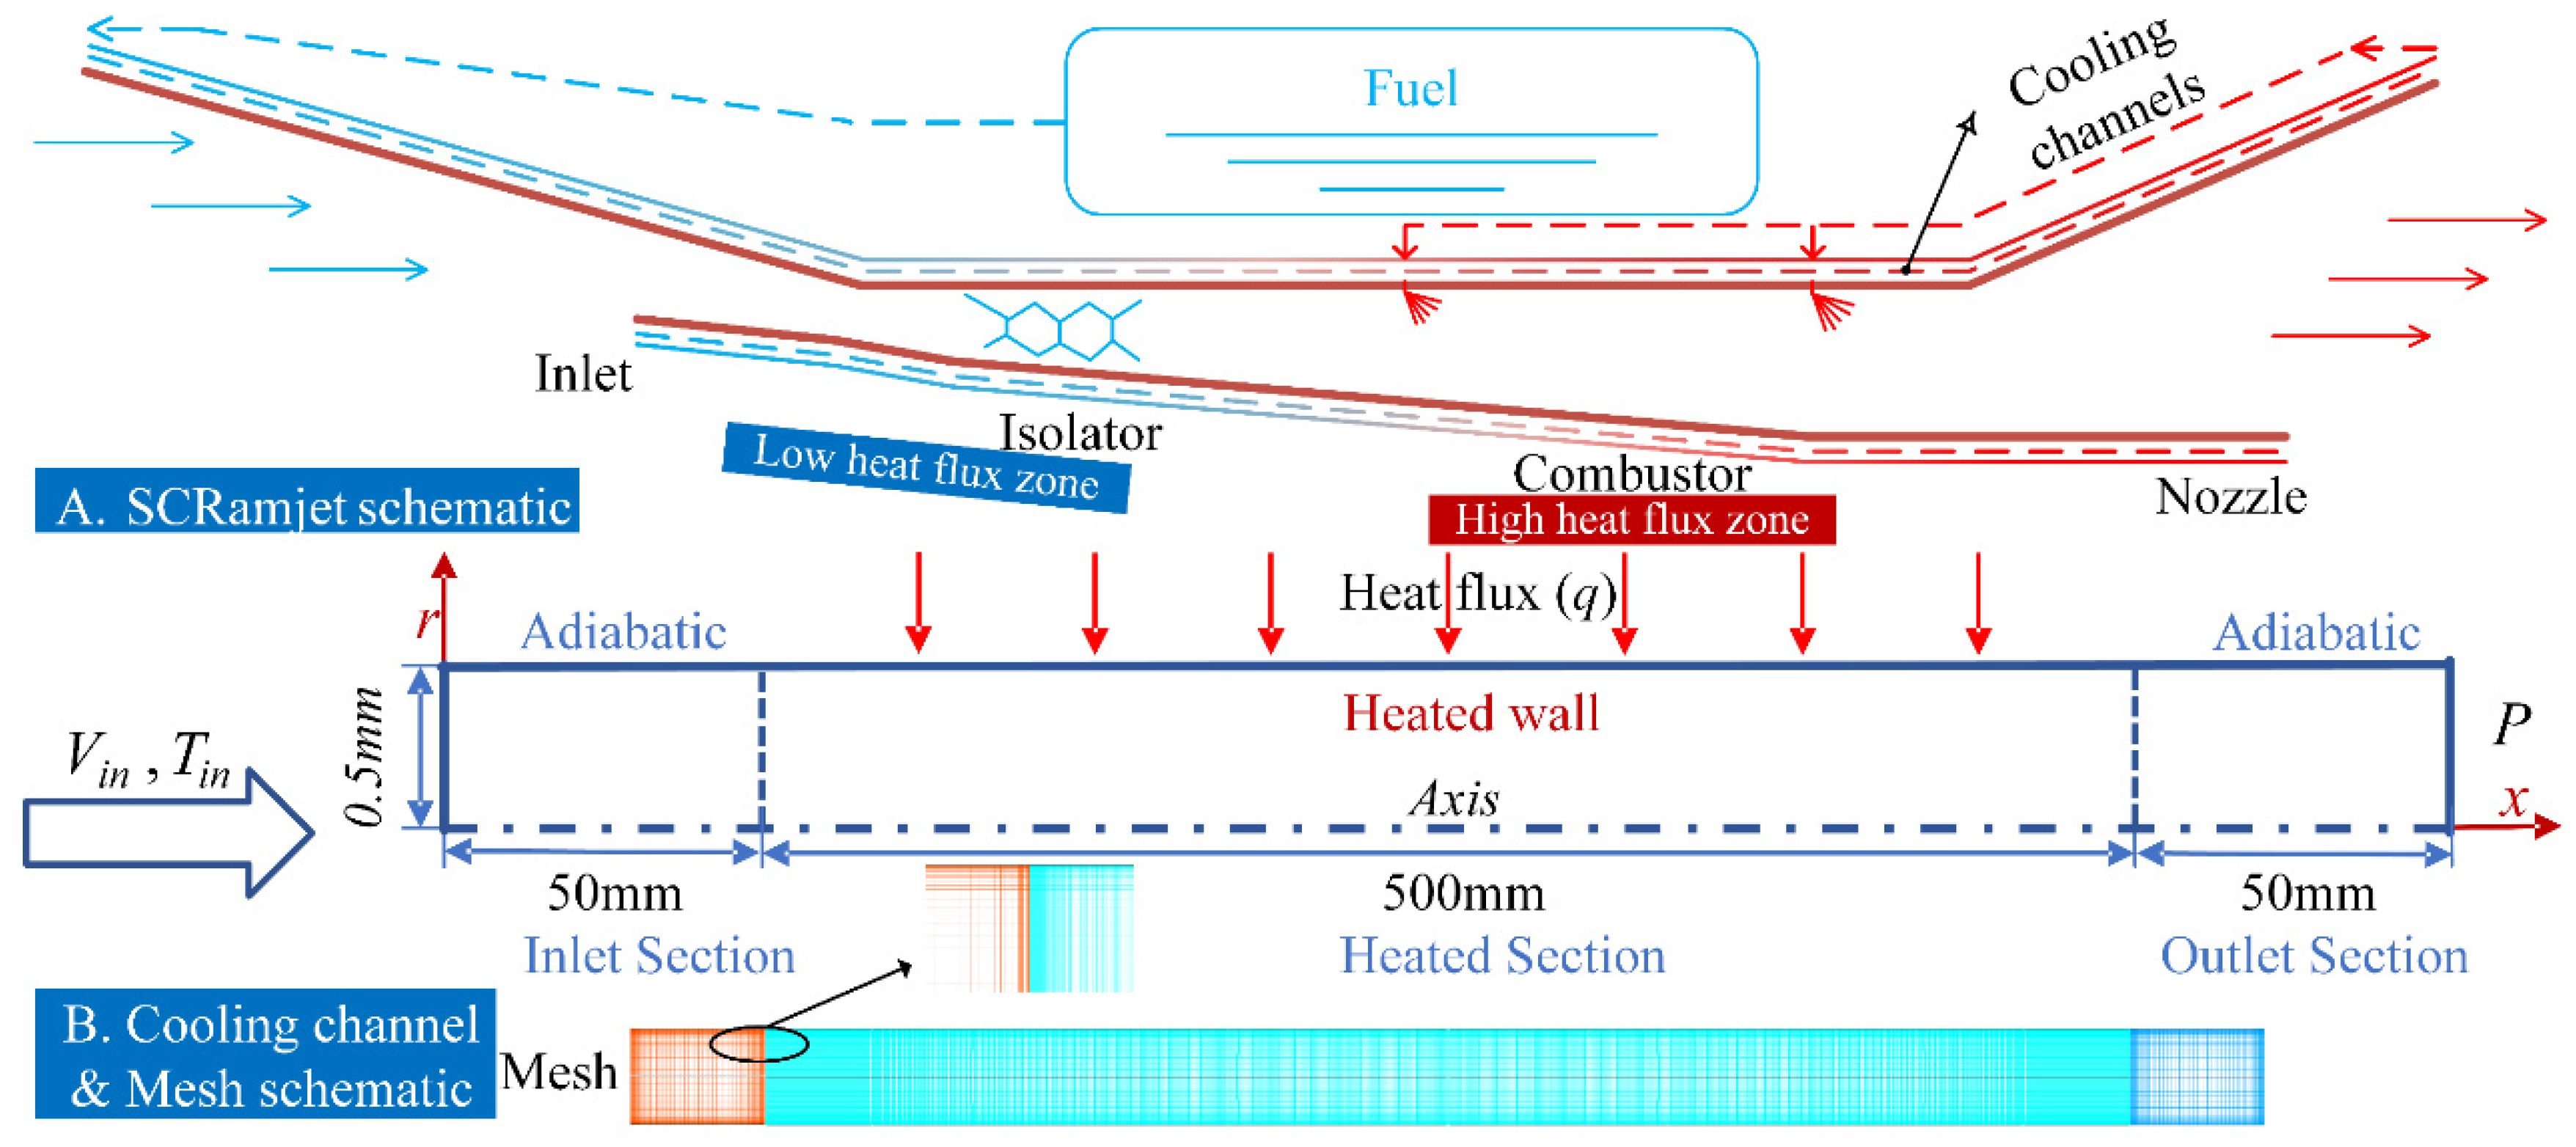
2.1. Geometry Description and Boundary Conditions

As shown in Figure 2, dozens of cooling channels are arranged in the SCRamjet combustor wall, which are exposed to the large combustion heat release. Considering that the circumferential nonuniform heat flux is not the focus of this work, each cooling channel is assumed to be heated equally. Thus, a single channel is studied as a representative of the cooling channels, as shown in Figure 2B. Uniform and nonuniform heat flux boundaries are imposed on the heated section to simulate the axial thermal boundary in SCRamjet. The inner diameter d of circular tube is set to be 1 mm. Two 50 mm (50 d) long-adiabatic-domains are set as the inlet and outlet sections. The mesh is also presented.

2.2. Solution Methods and Boundary Conditions

Commercial software Fluent 19.0 is adopted to conduct the simulation. The governing equations include mass, momentum, and energy conservation equations, which can be found in the ANSYS Fluent theory guide release 19.0 [59]. Considering the circular tube geometry, a 2D axisymmetric setup is adopted to balance the computational time and accuracy. The finite-volume method and double-precision pressure-based solver are used. The convection terms are discretized with the second-order upwind scheme. The second-order central scheme is used to discretize diffusion terms. The Semi-Implicit Method for Pressure Linked Equations-Consistent (SIMPLEC) algorithm is applied to couple the pressure and velocity. The present simulations are considered as converged when the normalized residual of each equation is less than 10−6. It takes 10,000–20,000 iterations to converge. The inlet fuel temperature (Tin) is 300 K. The inlet velocity (Vin) is 2.25 m/s. The average heat flux on the heated wall is 1.2 MW/m2. To effectively capture the HTD behaviors and avoid fuel pyrolysis, the length of the heated section is set as 500 mm to ensure the average outlet fuel temperature is below 750 K [60]. The back pressure (P) is set as 3 MPa. The property data of n-decane is from NIST REFPROP [61]. The effect of gravity is neglected considering the small horizontal channel and sufficiently high velocity [62].

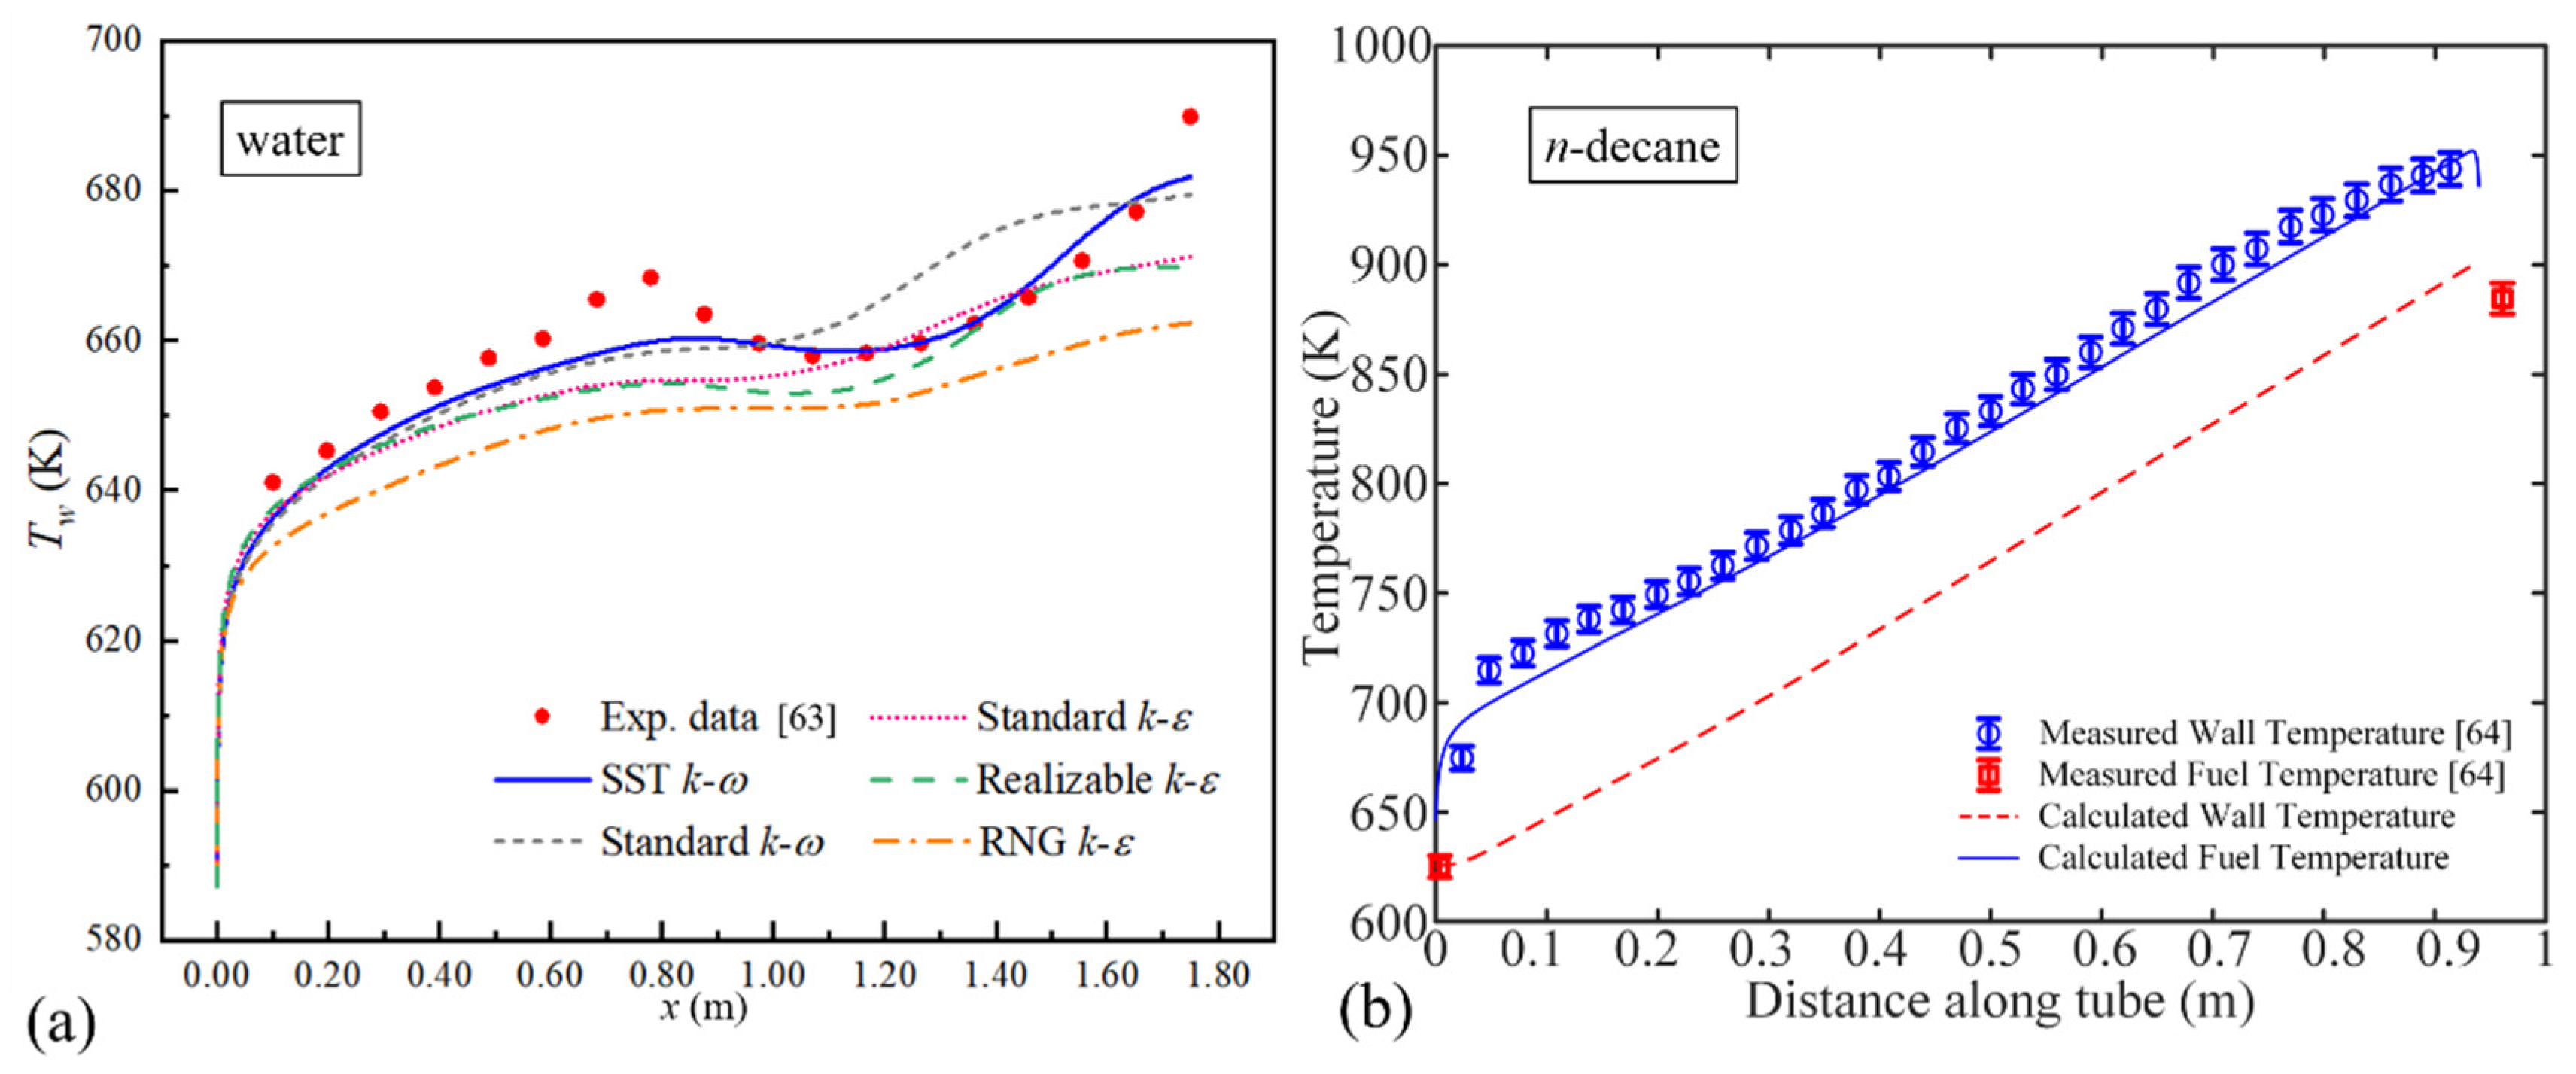
2.3. Turbulence Model and Validation

Considering the similarity in flow behaviors of supercritical fluids, different turbulence models are compared with the published experimental results of supercritical water and n-decane to validate the model’s prediction capability about supercritical fluid flow and heat transfer. Both experiments are operated in a circular tube under a wide temperature range, including a trans-critical process [63,64]. In Zhu et al. [64], the errors of the fuel and wall temperature measurement were dependent upon the K-type thermocouples (accuracy of 0.4%). The computational fluid domain setups are similar to Figure 2B. The solid domain of the tube wall is also considered to compare with the experimental results. The geometry and boundary parameters are listed in Table 1. The streamwise distribution of wall temperature is considered as a significant physical parameter to validate the turbulence model.
As illustrated in Figure 3a, for supercritical water, the SST k-ω turbulent model predicts the wall temperature best among five turbulence models (maximum error: 1.29%). The following is the n-decane comparison with Zhu’s experiment, which has been presented in our previous published work [58]. The wall temperature (Tw) distribution calculated by the SST k-ω model compares well with the experimental data (maximum error: 2.40%), as shown in Figure 3b. Overall, the predicting accuracy of the current numerical model in the flow and heat transfer of supercritical fluid is considered acceptable and adopted for the following research.

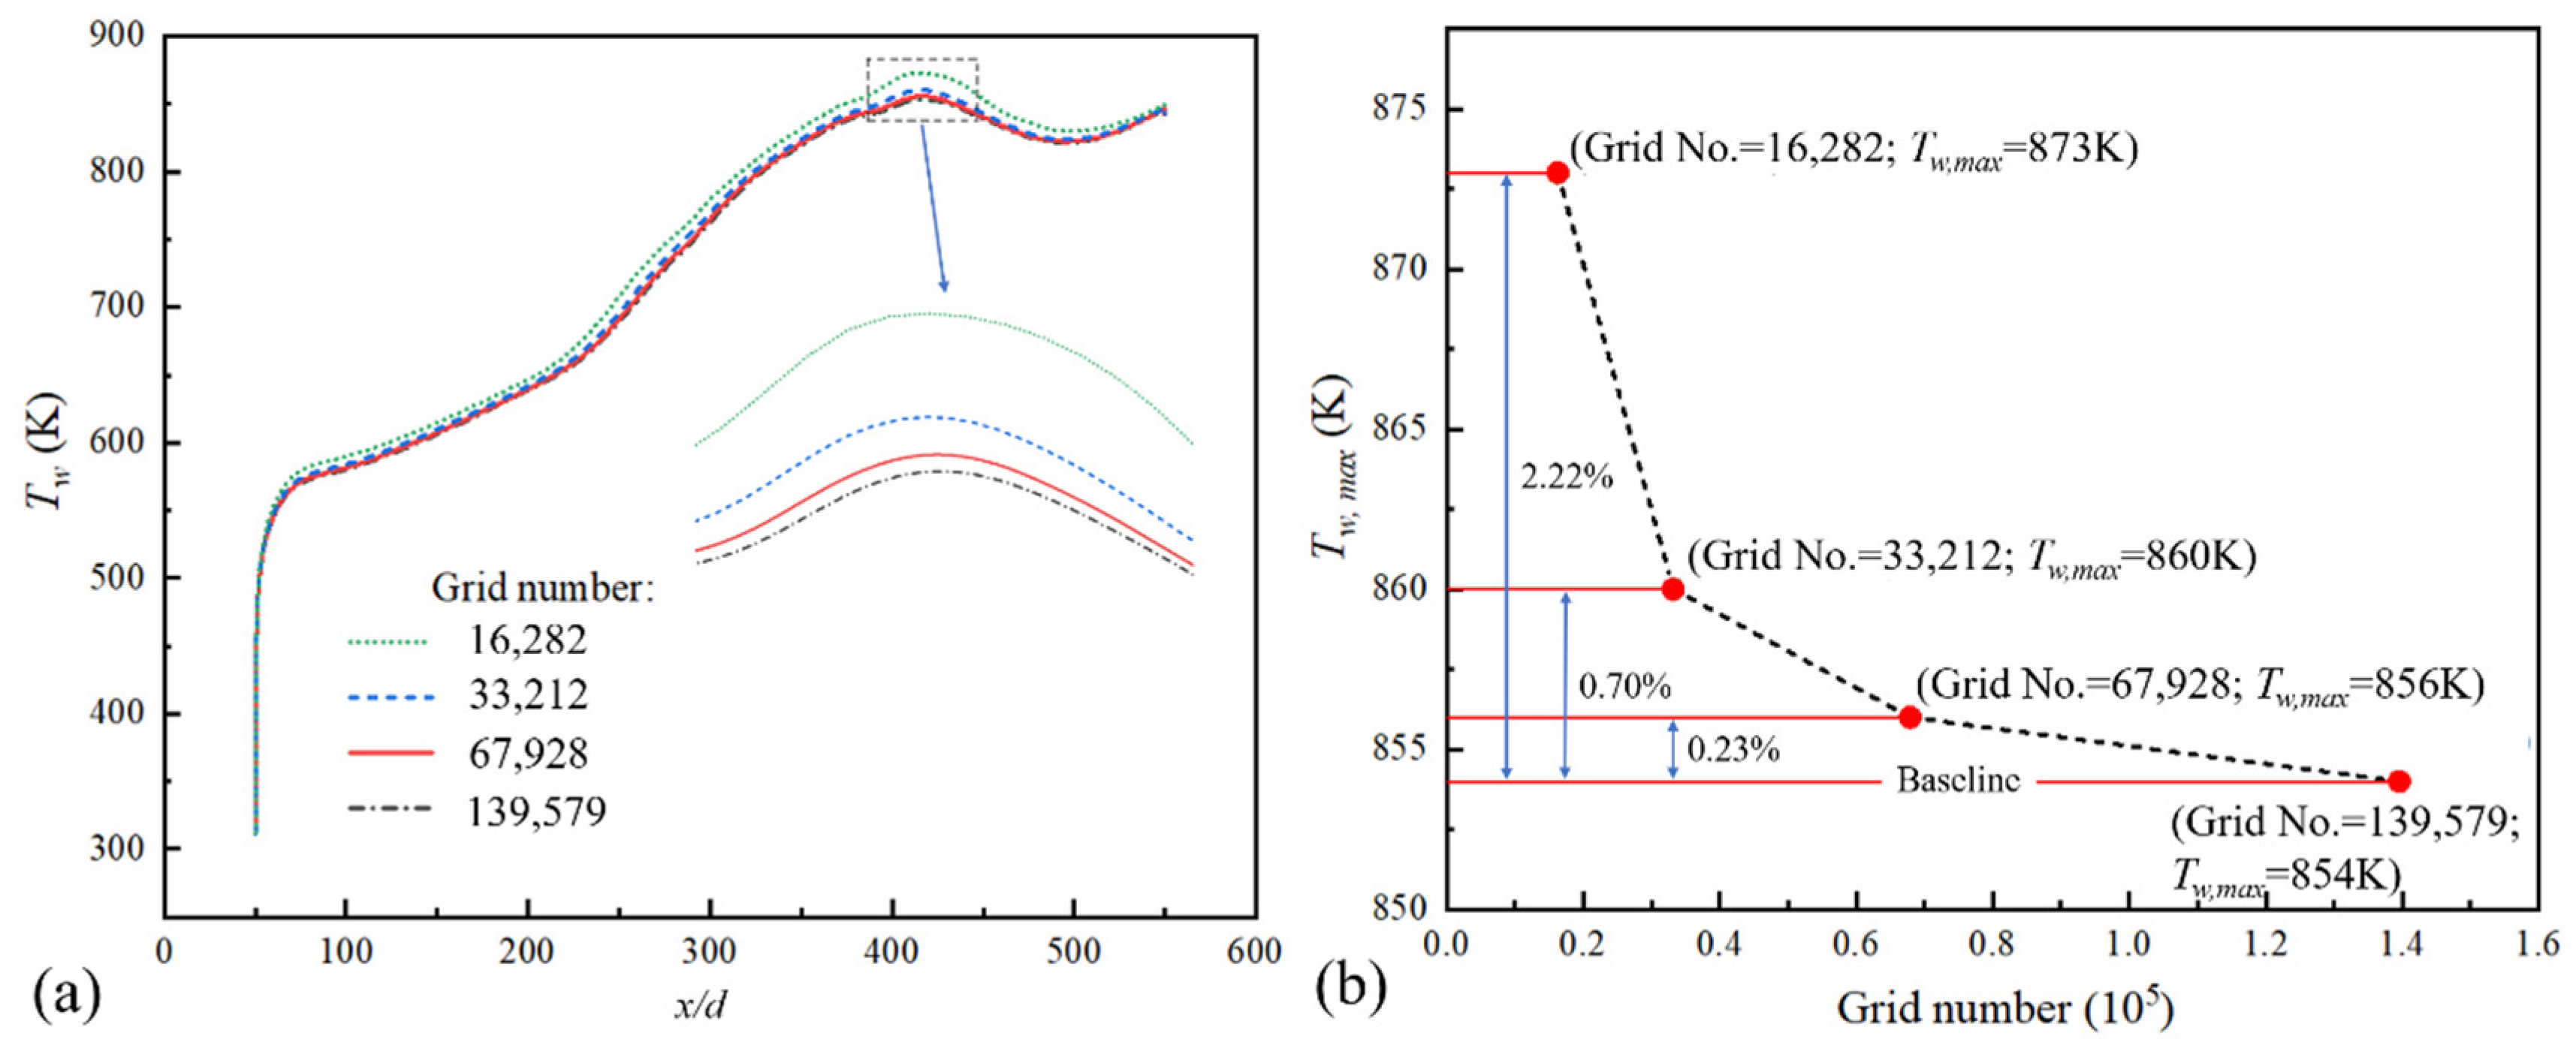
2.4. Mesh Independence Analysis

As shown in Table 2, four different mesh sizes are set for the fluid domain and solid domain. The cell distance adjacent to the boundary wall is set as 10−6 mm ( y + < 1 ) with a growth factor of 1.05 to improve the accuracy of calculation, especially in the near-wall region. The mesh is refined by increasing the nodes number to 1.44 times in each coordinate direction.
The wall temperature distributions of Case B\C\D are quite close (Figure 4a). Taking the maximum wall temperature (Tw, max) for further analysis (Figure 4b), it can be seen that Tw, max converges to the result of finest mesh case D as the grid number increases, which is an asymptotic distribution. The deviation in Case C and Case D is only 0.23%. Thus, the mesh size of Case C is adopted in this work as a balance of calculation time and accuracy.

3. Results and Discussion

For the convenience of analysis, the heat transfer coefficient (HTC) is defined as:
h = q T w T b
where Tb is the bulk fluid temperature and is calculated as:
T b = A ρ u C P T d A A ρ u C p d A
where A is the flow cross-sectional area; ρ , u , C P , and T are the local density, velocity, specific heat, and temperature of n-decane in the same cross profile, respectively.
To present the mechanism of heat transfer deterioration (HTD) clearly, the uniform heat flux boundary is first studied before the nonuniform heat flux boundary, as shown in Figure 5. HTC first begins to decrease from x/d = 225 to 350, which recovers slightly from x/d = 350 to 390. The whole zone is defined as the 1st HTD (x/d = 225 to 390, marked with red stars). From x/d = 390, HTC decreases again and reaches a local nadir, which begins to recover afterward. It is defined as the second HTD (x/d = 390 to 418, marked with blue stars). HTC reaches a local minimum at x/d = 400. Although the second HTD is not that significant under uniform heat flux, it is different under the nonuniform heat flux boundary and is worth studying.

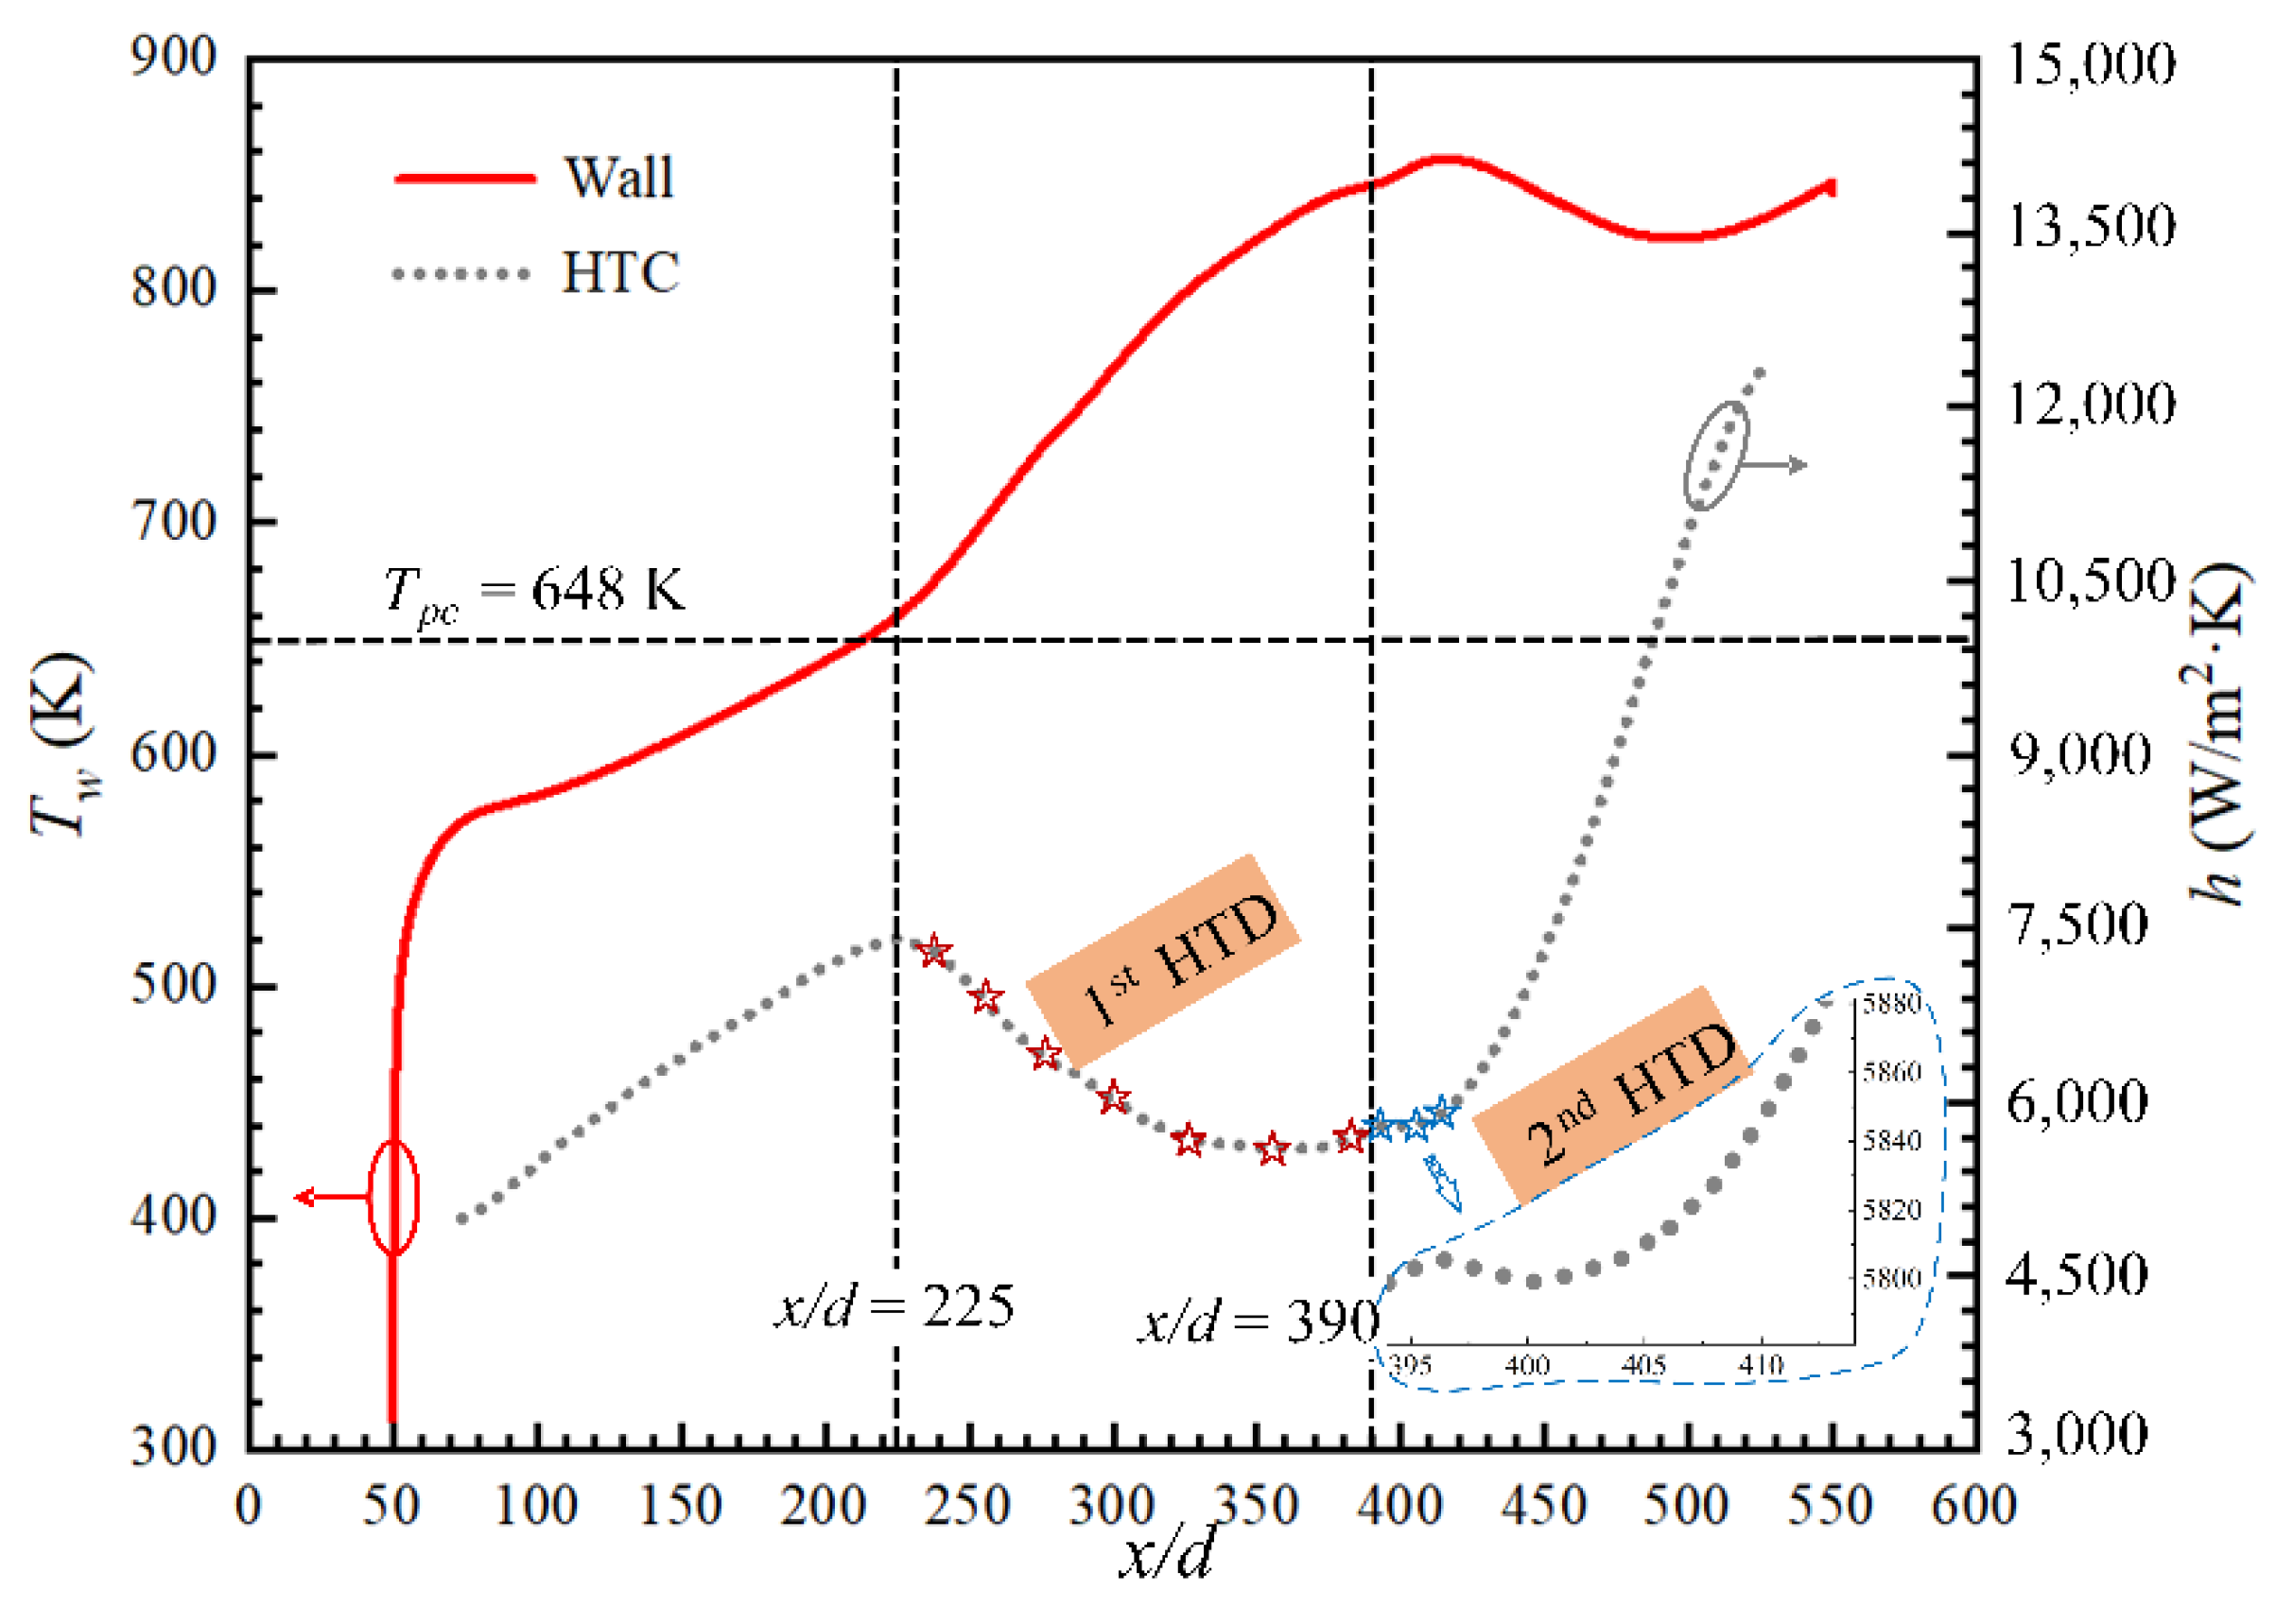
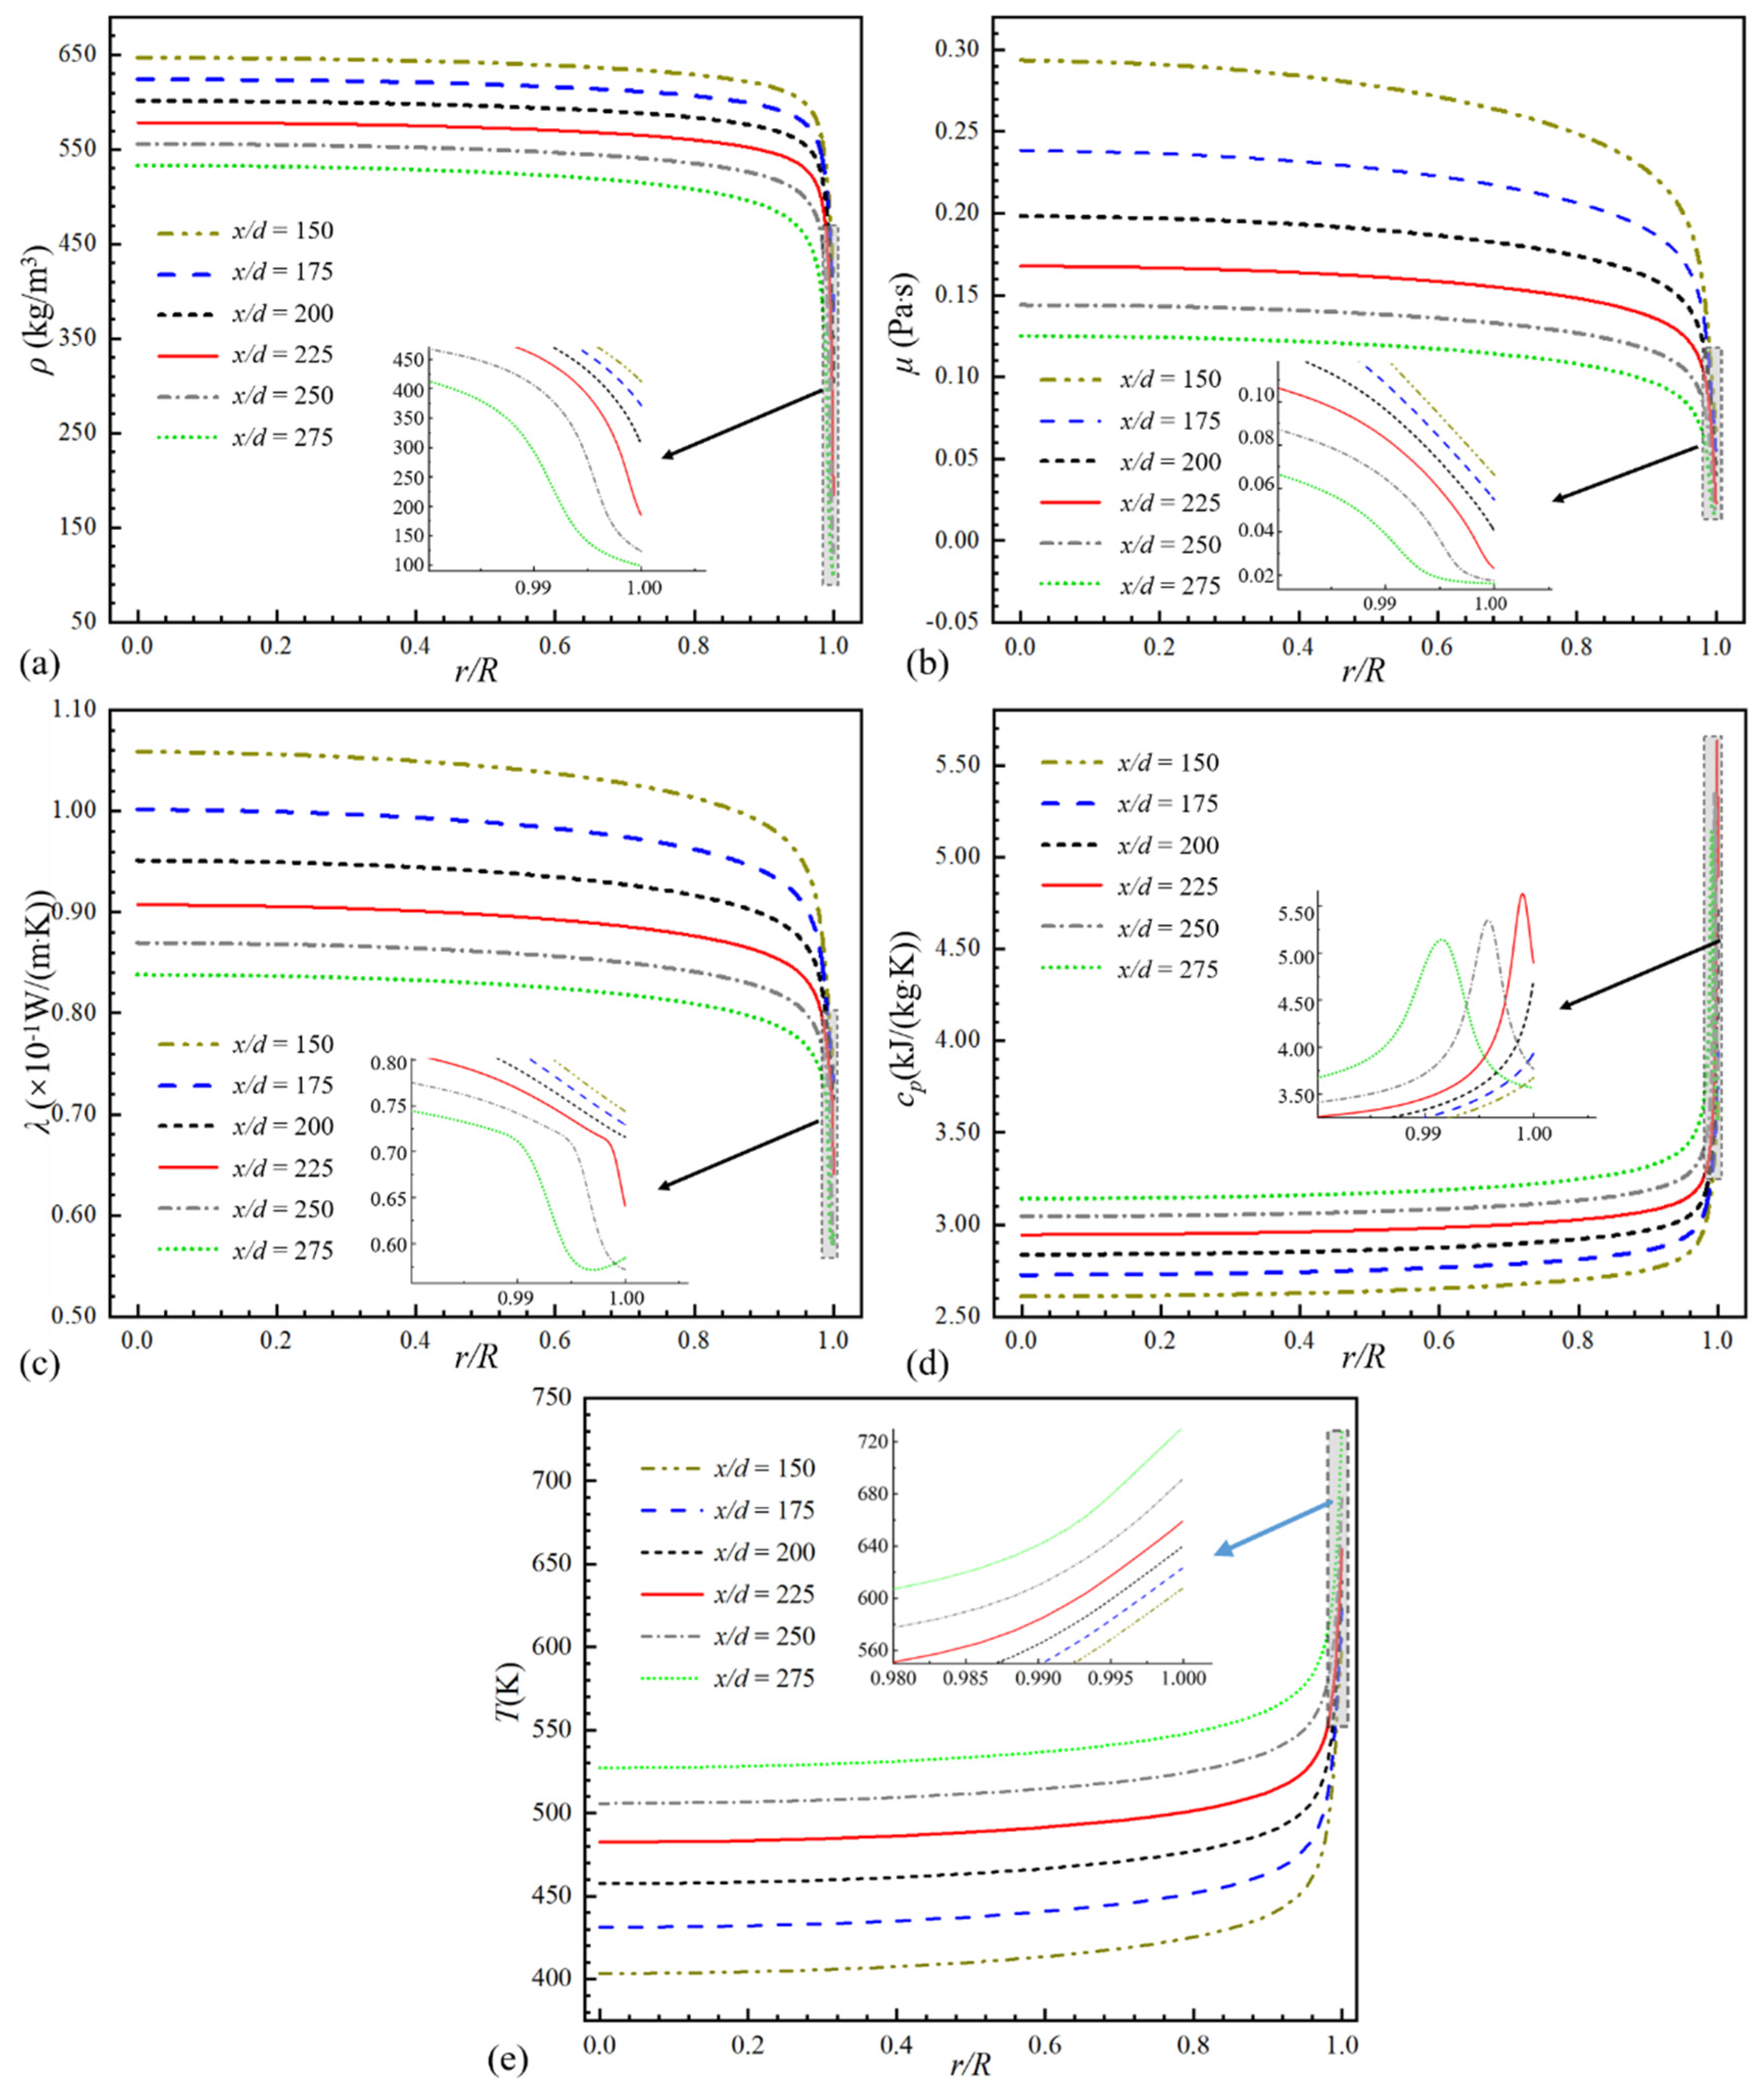
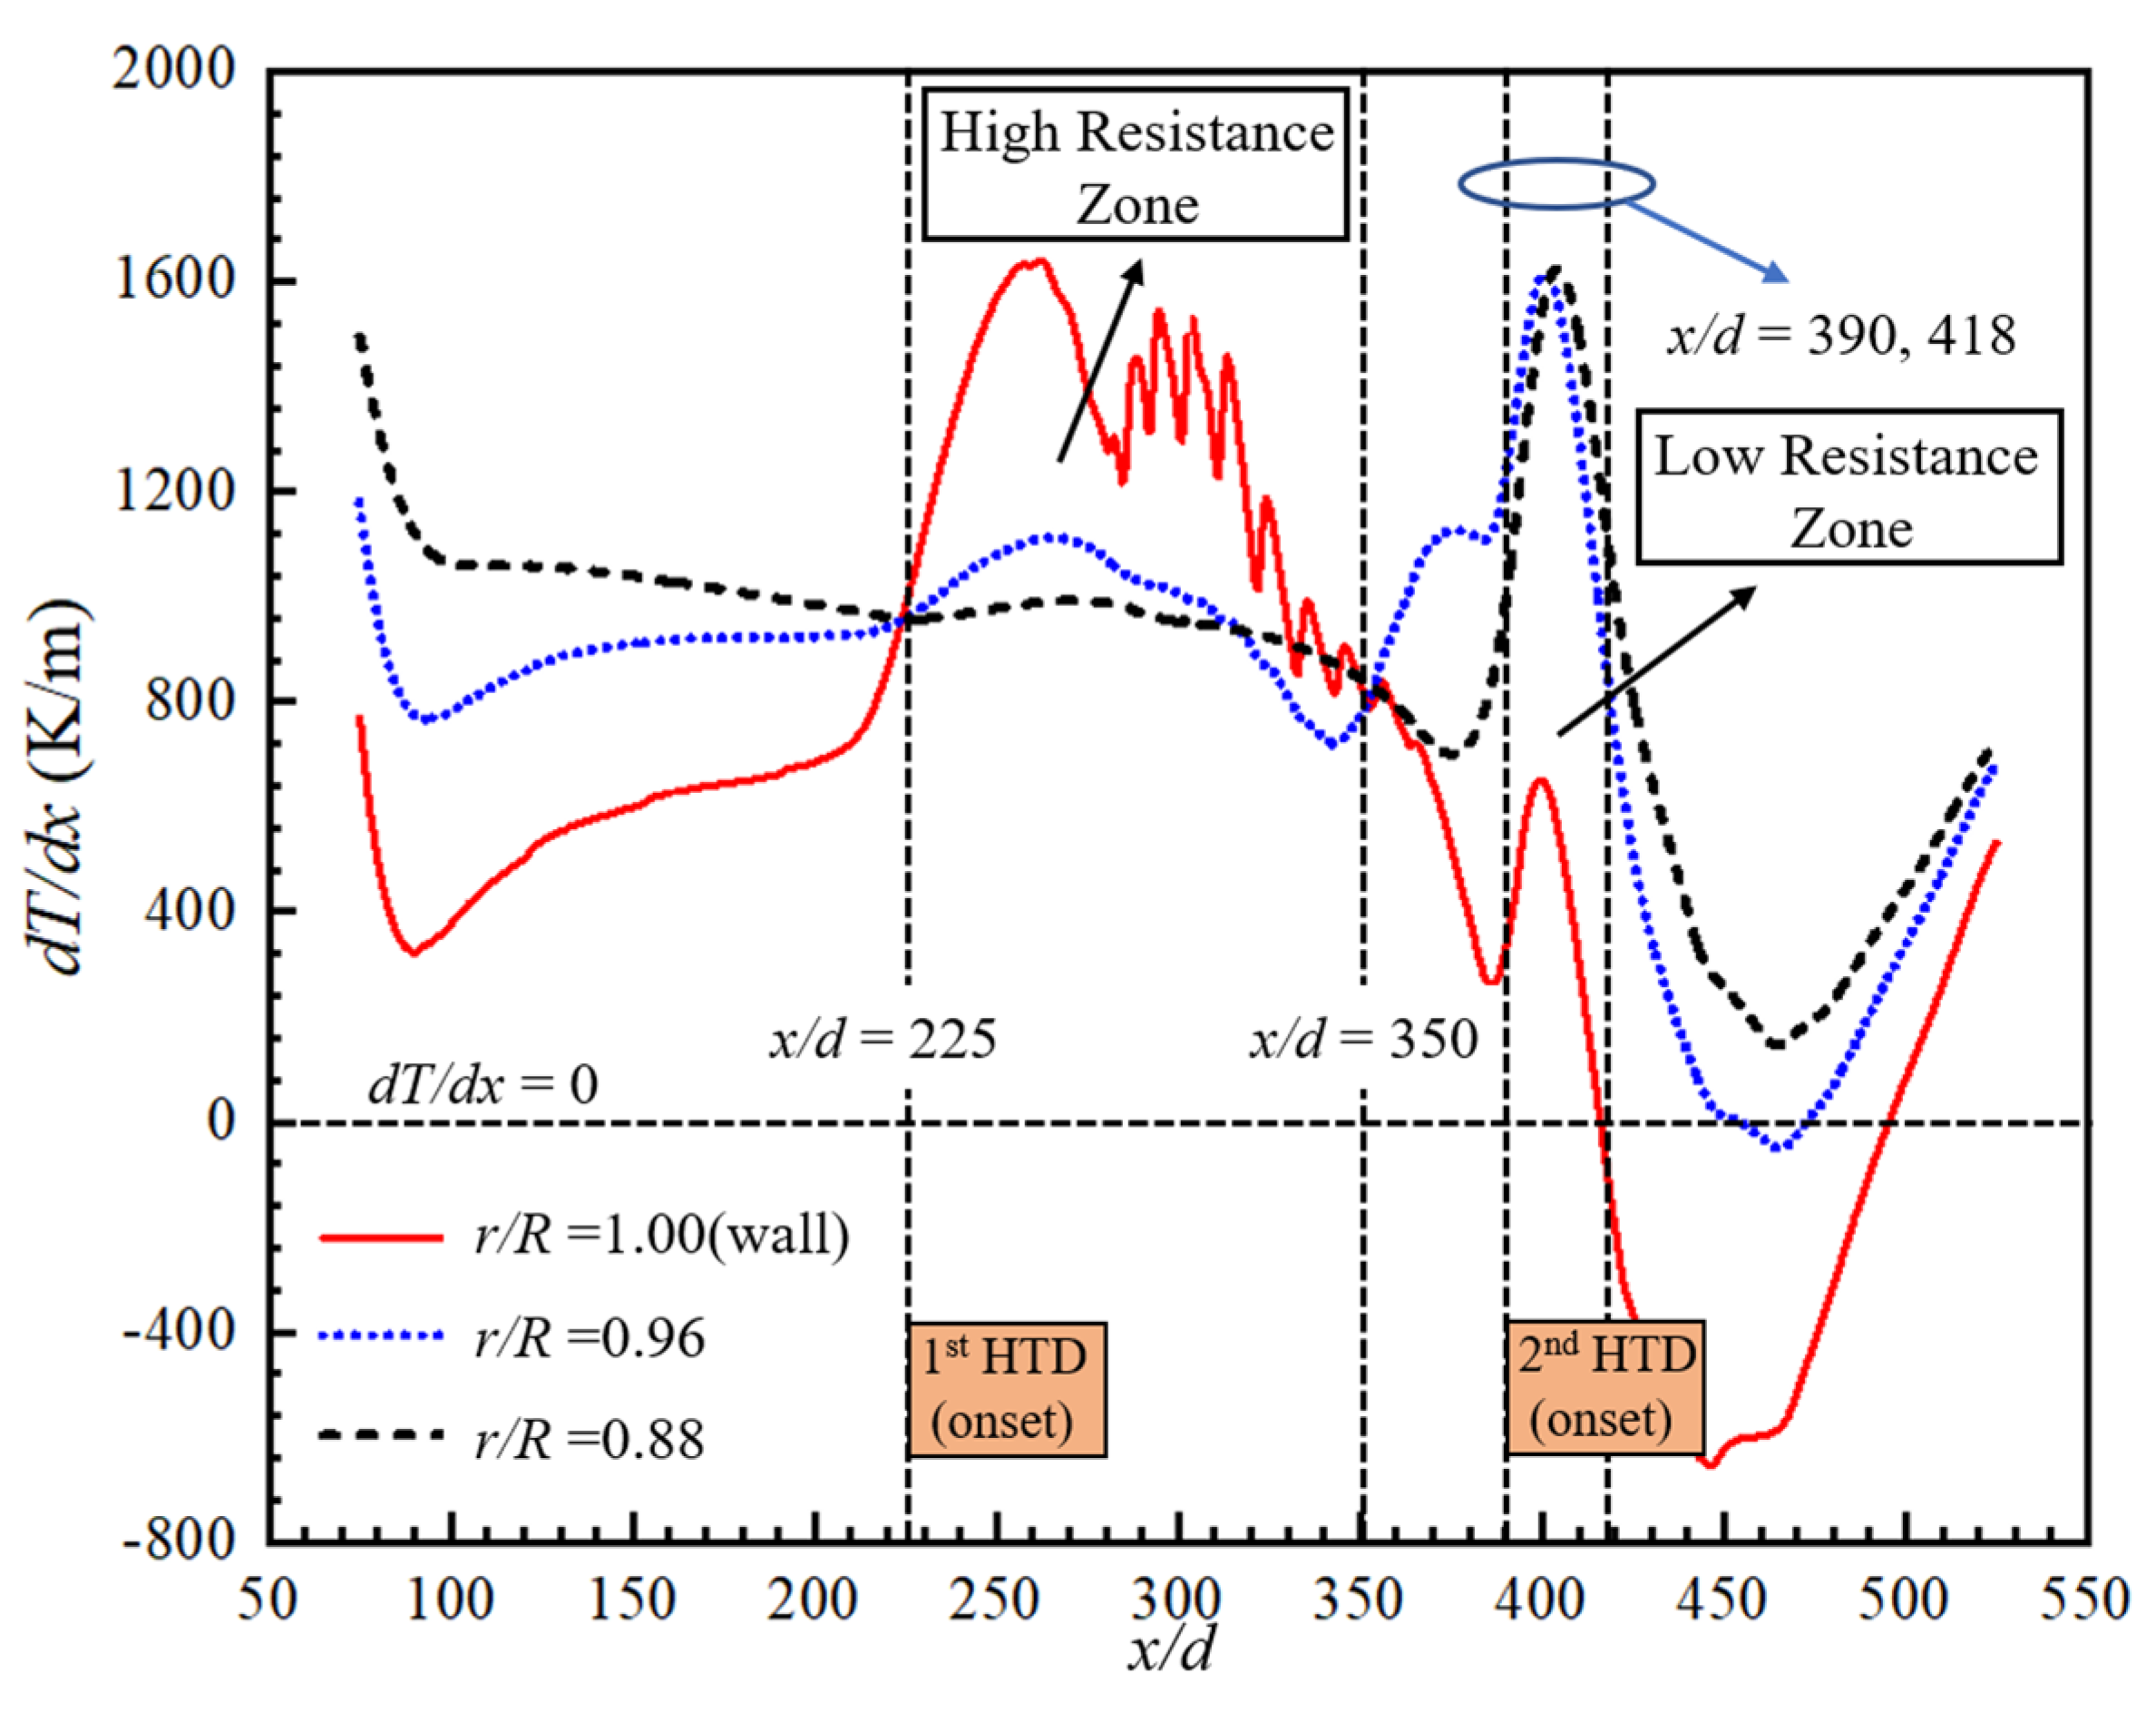
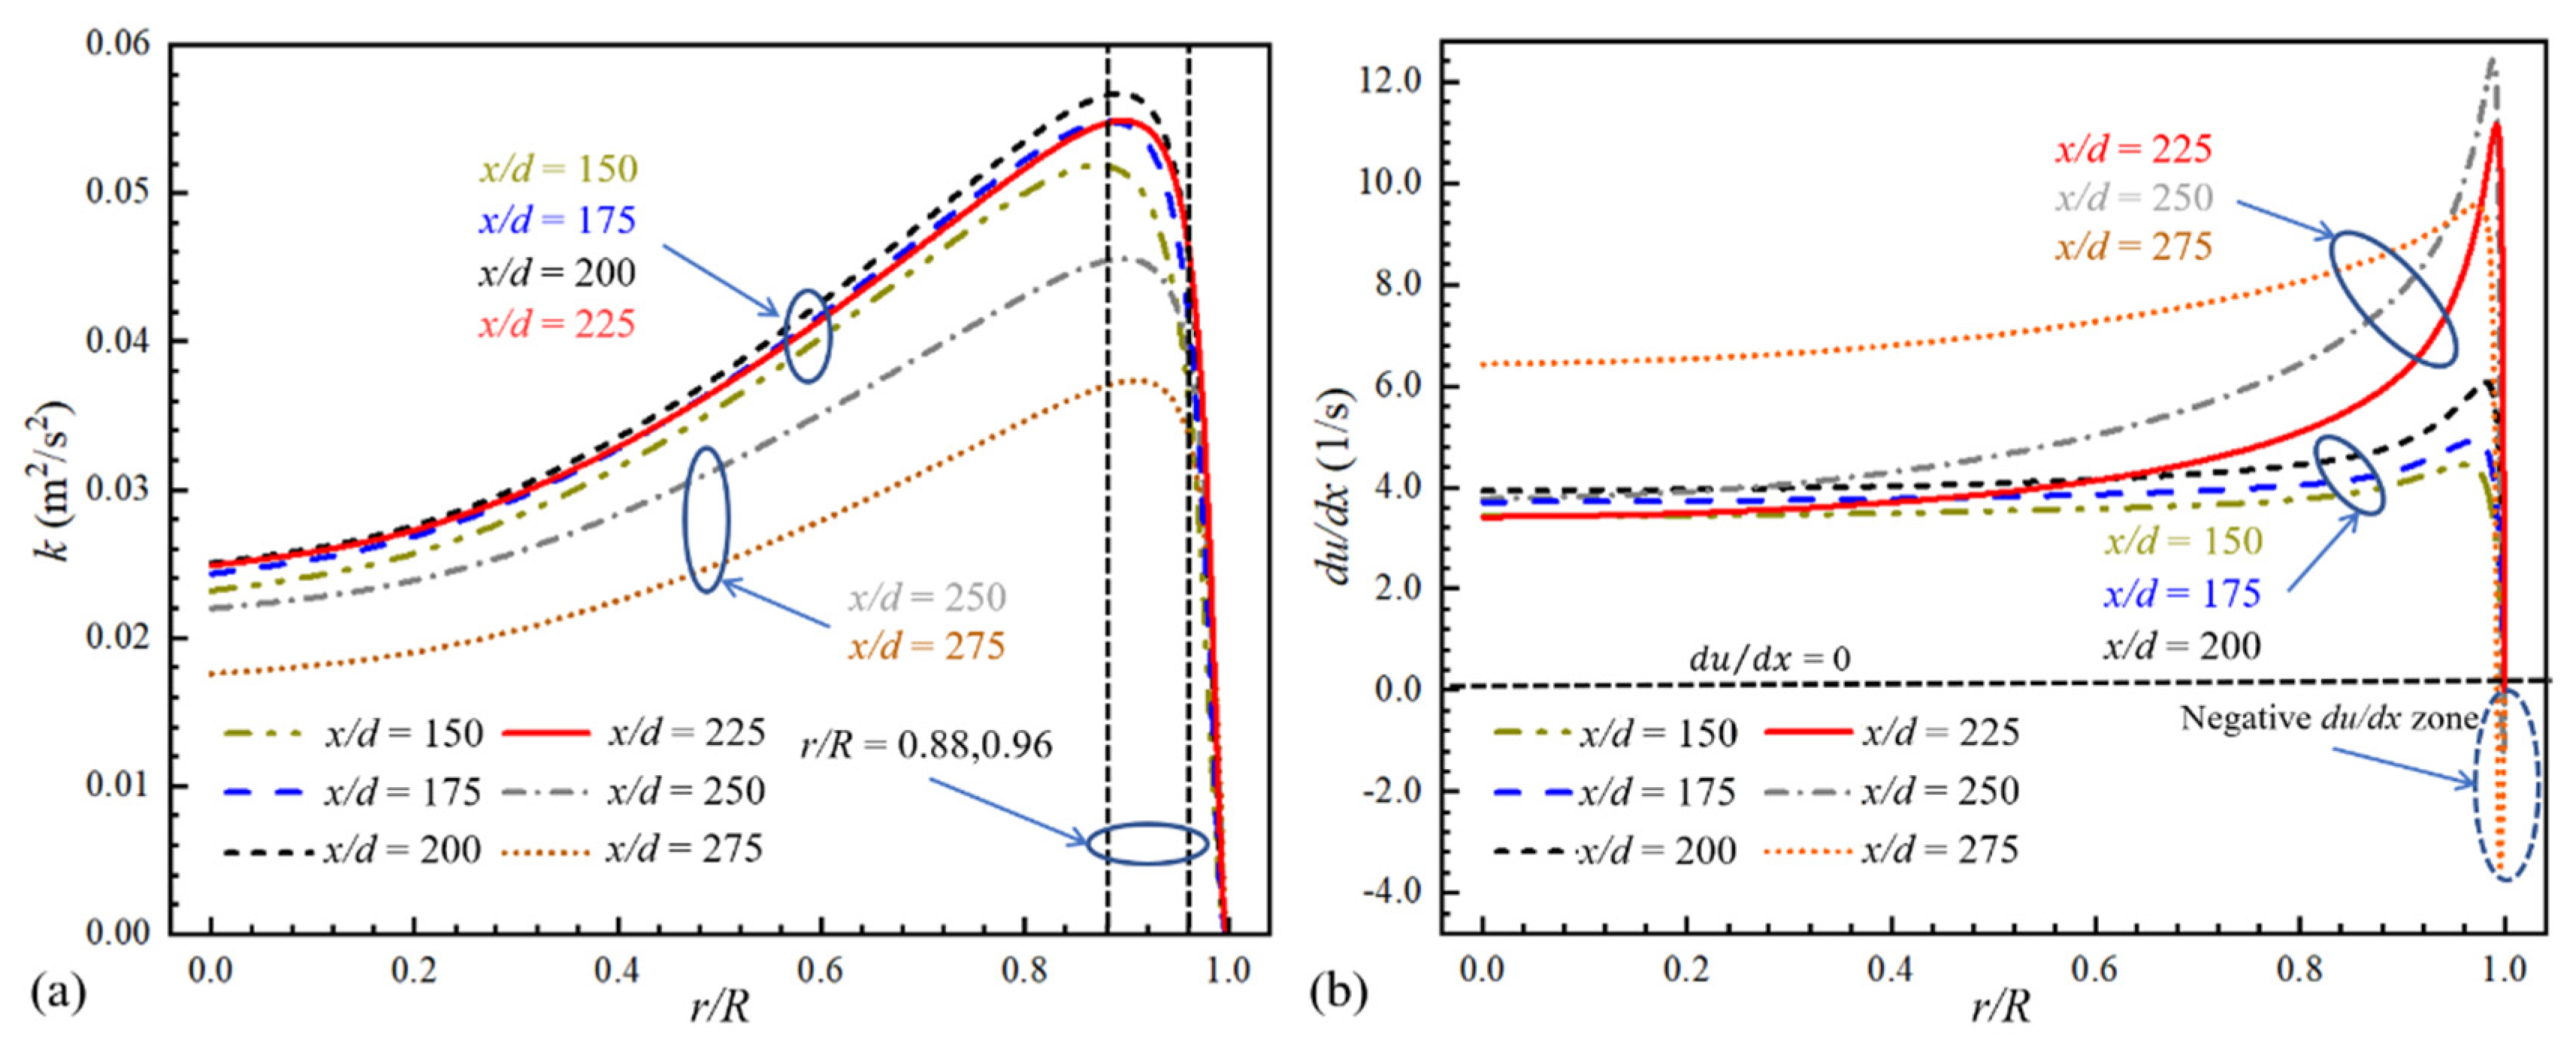
3.1. Mechanism of the First HTD under Uniform Heat Flux

The first HTD starts from the point x/d = 225, where Tw exceeds the fuel pseudo-critical temperature (Tpc = 648 K). The wall temperature increasing rate shows a dramatic increase accordingly, as shown in Figure 5. The radial distributions of thermo-physical properties in the HTC decreasing zone of the first HTD are demonstrated in Figure 6. It is noted that all four properties vary gently along the flow direction in the core region, where the fluid temperature is much lower than Tpc. Meanwhile, in the near-wall region, the fuel temperature (Tf) is much higher to trigger the trans-critical process. The variations in thermophysical properties become sharp. The density and viscosity fall sharply with x, which causes the “thermal acceleration effect” [27] in the near-wall region. The thermal conductivity falls and the specific heat capacity increases. The influences on the heat transfer are opposite and largely neutralized. The results of density and viscosity variations are further considered.
As shown in Figure 7, axial temperature gradients (dT/dx) are presented to denote the heat transfer resistance. In the deteriorated section x/d = 225–350, dT/dx of r/R = 1.00 is much larger than r/R = 0.96 and 0.88, which indicates that the heat transfer resistance in this section mainly locates in the near-wall region r/R = 0.96–1.00. It is consistent with the sharp variation zone of density and viscosity.
As shown in Figure 8a, the turbulent kinetic energy (k) increases slowly along the flow direction when x/d ≤ 200, which is due to the drop of fluid viscosity versus x/d (Figure 6b). When x/d exceeds 200, the turbulent kinetic energy begins to decrease versus x/d. Meanwhile, in the near-wall region, du/dx (axial velocity gradient) is much higher when x/d ≥ 225 (Figure 8b), which is the result of the dramatic density decreasing rate when Tf approaches Tpc. The axial flow acceleration ability is notably enhanced in the near-wall region, which decreases the velocity difference between the near-wall and the core region visibly. Consequently, the turbulence weakens and the heat transfer is deteriorated, which is similar to the results of Huang et al. [23] and Jackson et al. [26]. That also explains the higher heat transfer resistance in the near-wall region r/R = 0.96–1.00. In addition, the decrease in thermal conductivity in the near-wall region also helps cause the first HTD (Figure 6c).
It is also worth noting that a negative axial velocity gradient occurs in the near-wall supercritical fluid when x/d exceeds 225 (Figure 8b) and the low-velocity zone in the near-wall region (Figure 9a). Only the part of interest is presented, i.e., r/R = 0.98–1.00. The decrease in density represents the “thermal acceleration” ability. Beginning from x/d = 225, the fluid density decreases sharply along the x direction as the fuel temperature approaches the pseudo-critical point (Figure 9b). This high-density-decreasing-rate zone radially moves toward the core region and gradually expands. In addition, as x/d increases, the wall temperature exceeds Tpc. Therefore, the decreasing rate of fluid density in the near-wall region falls obviously. The flow acceleration ability degenerates. In some regions, velocity even decreases. As shown in Figure 9c, the near-wall low velocity zone is accompanied by the thickening of the viscous sublayer (y+ < 5), which increases the fluid residence time in the viscous sublayer and increases the local radius heat transfer resistance. It also helps to cause the first HTD. It is noticed that the near-wall low-velocity zone disappears from the position x/d = 380 and the viscous layer becomes much thinner. Because more and more fuel reaches the pseudo-critical temperature and the velocity is high enough in the near-wall region, the HTC begins to recover.

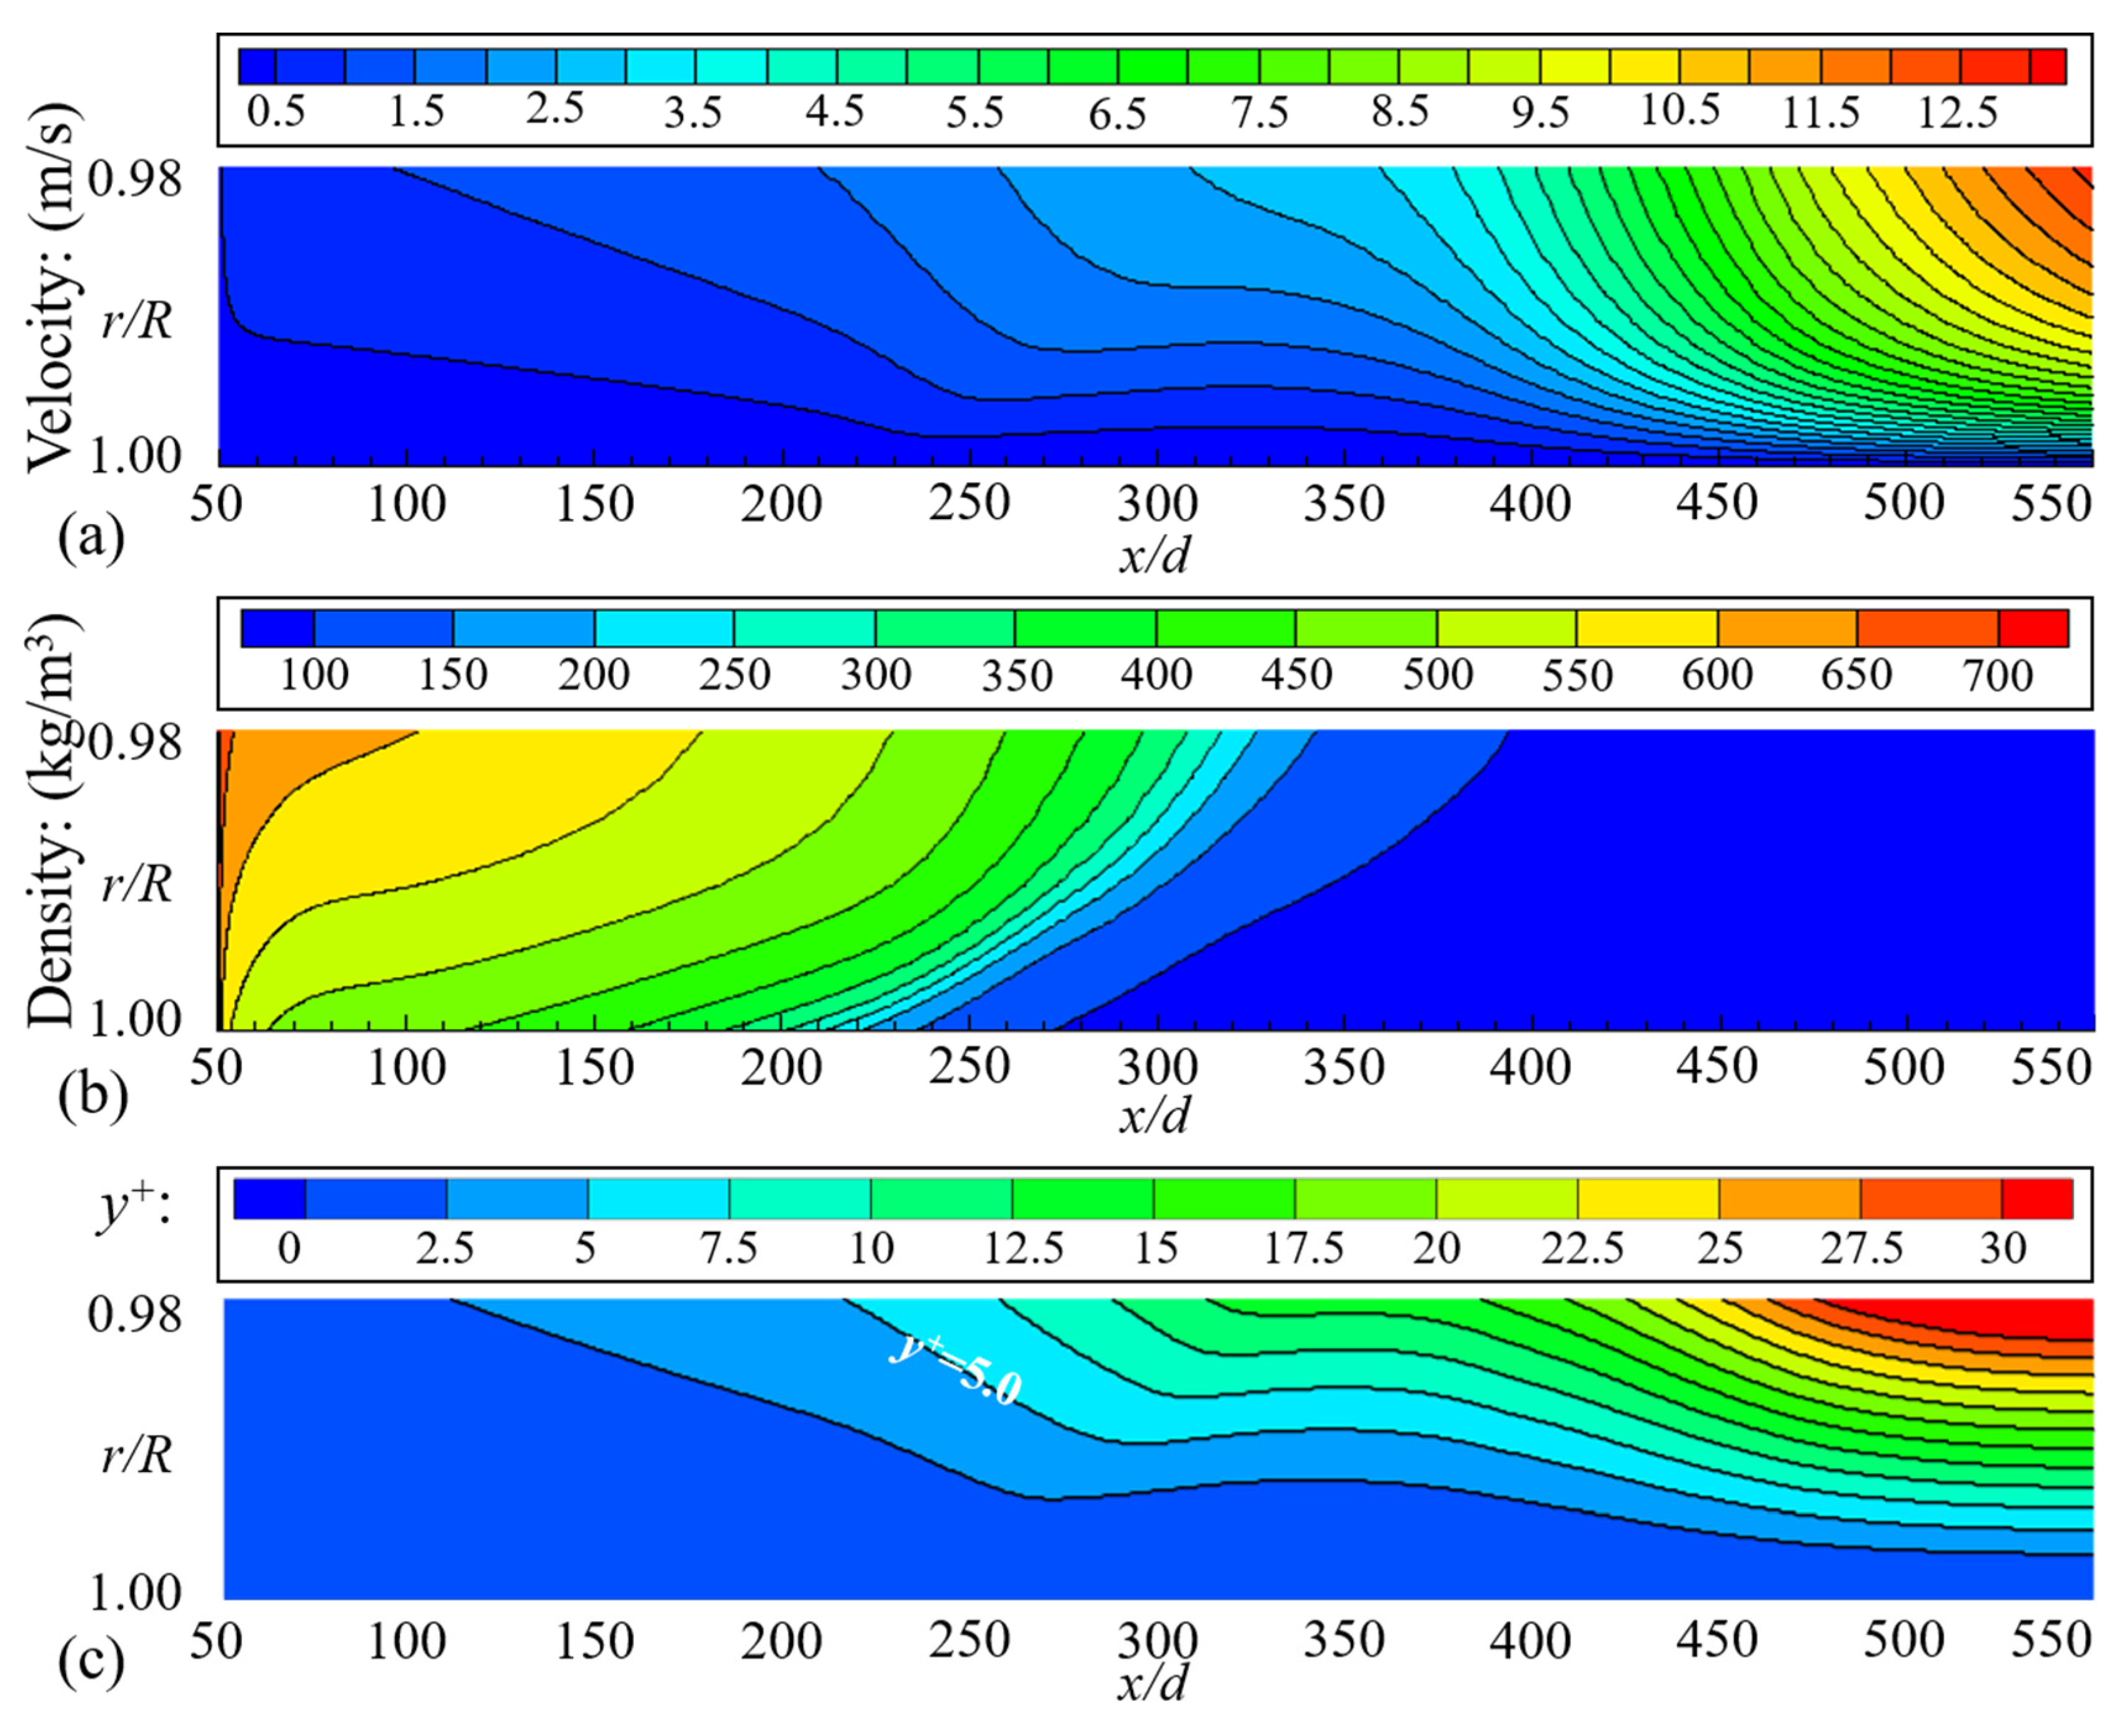
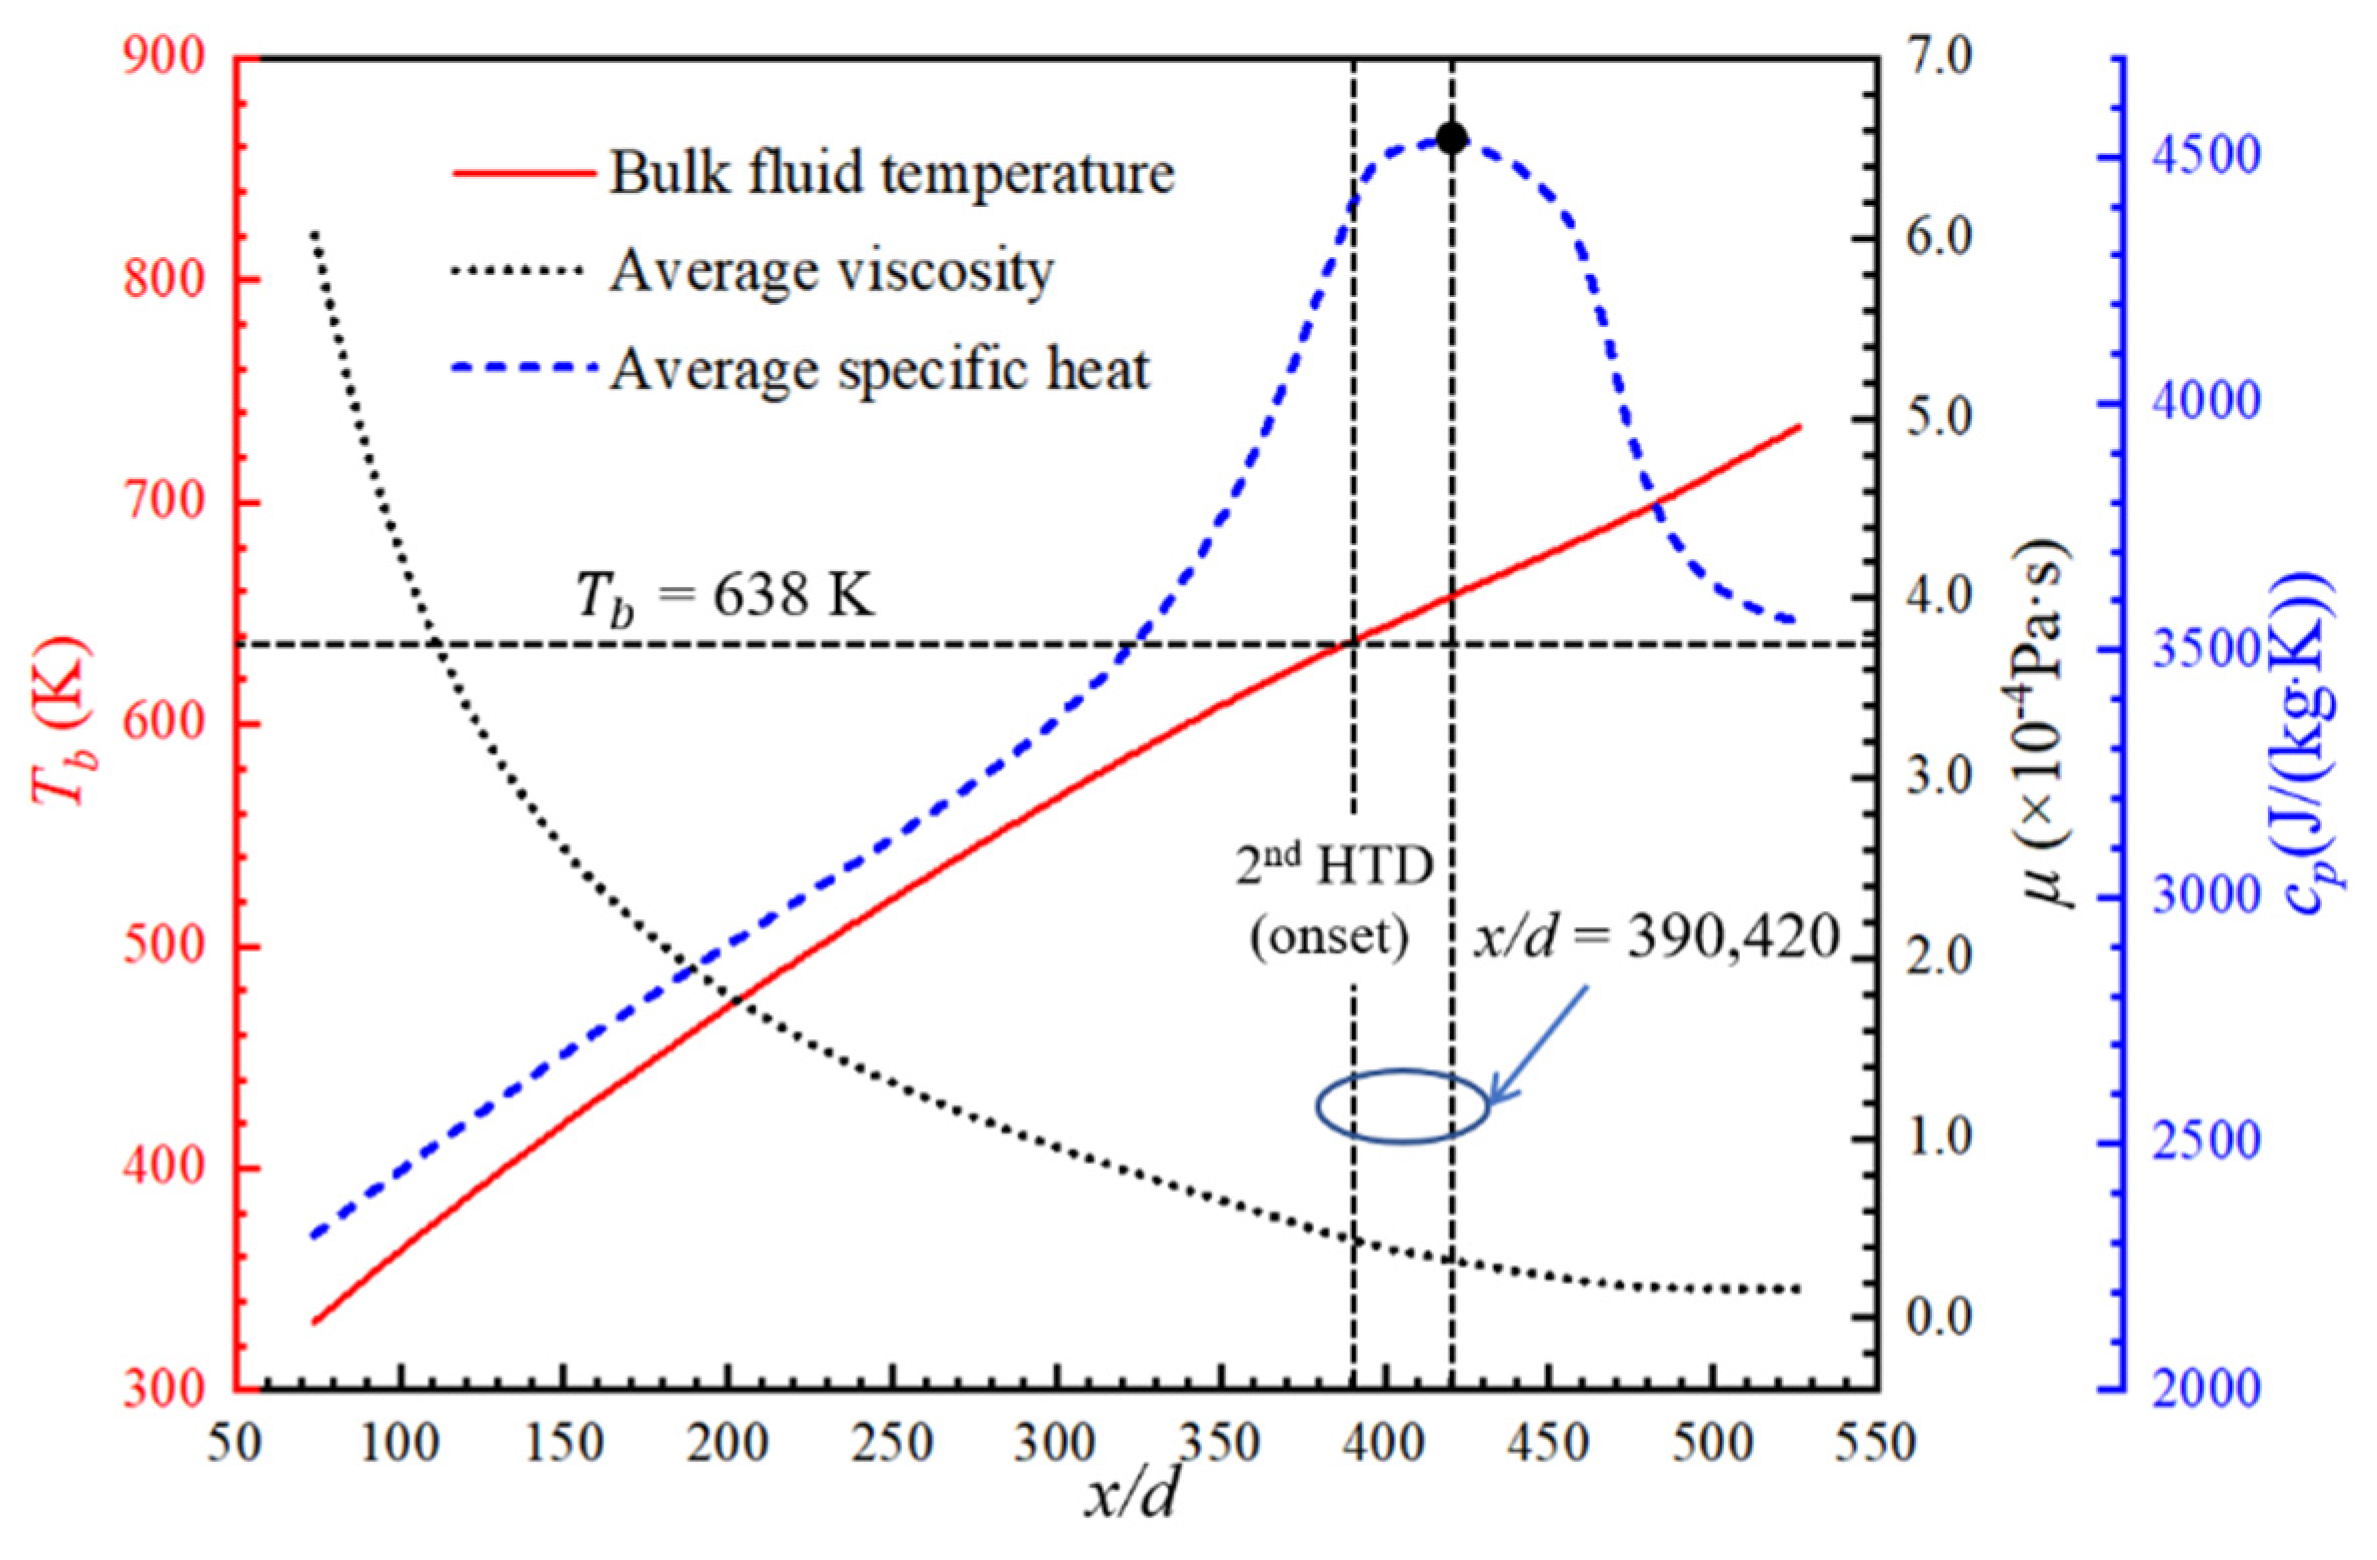
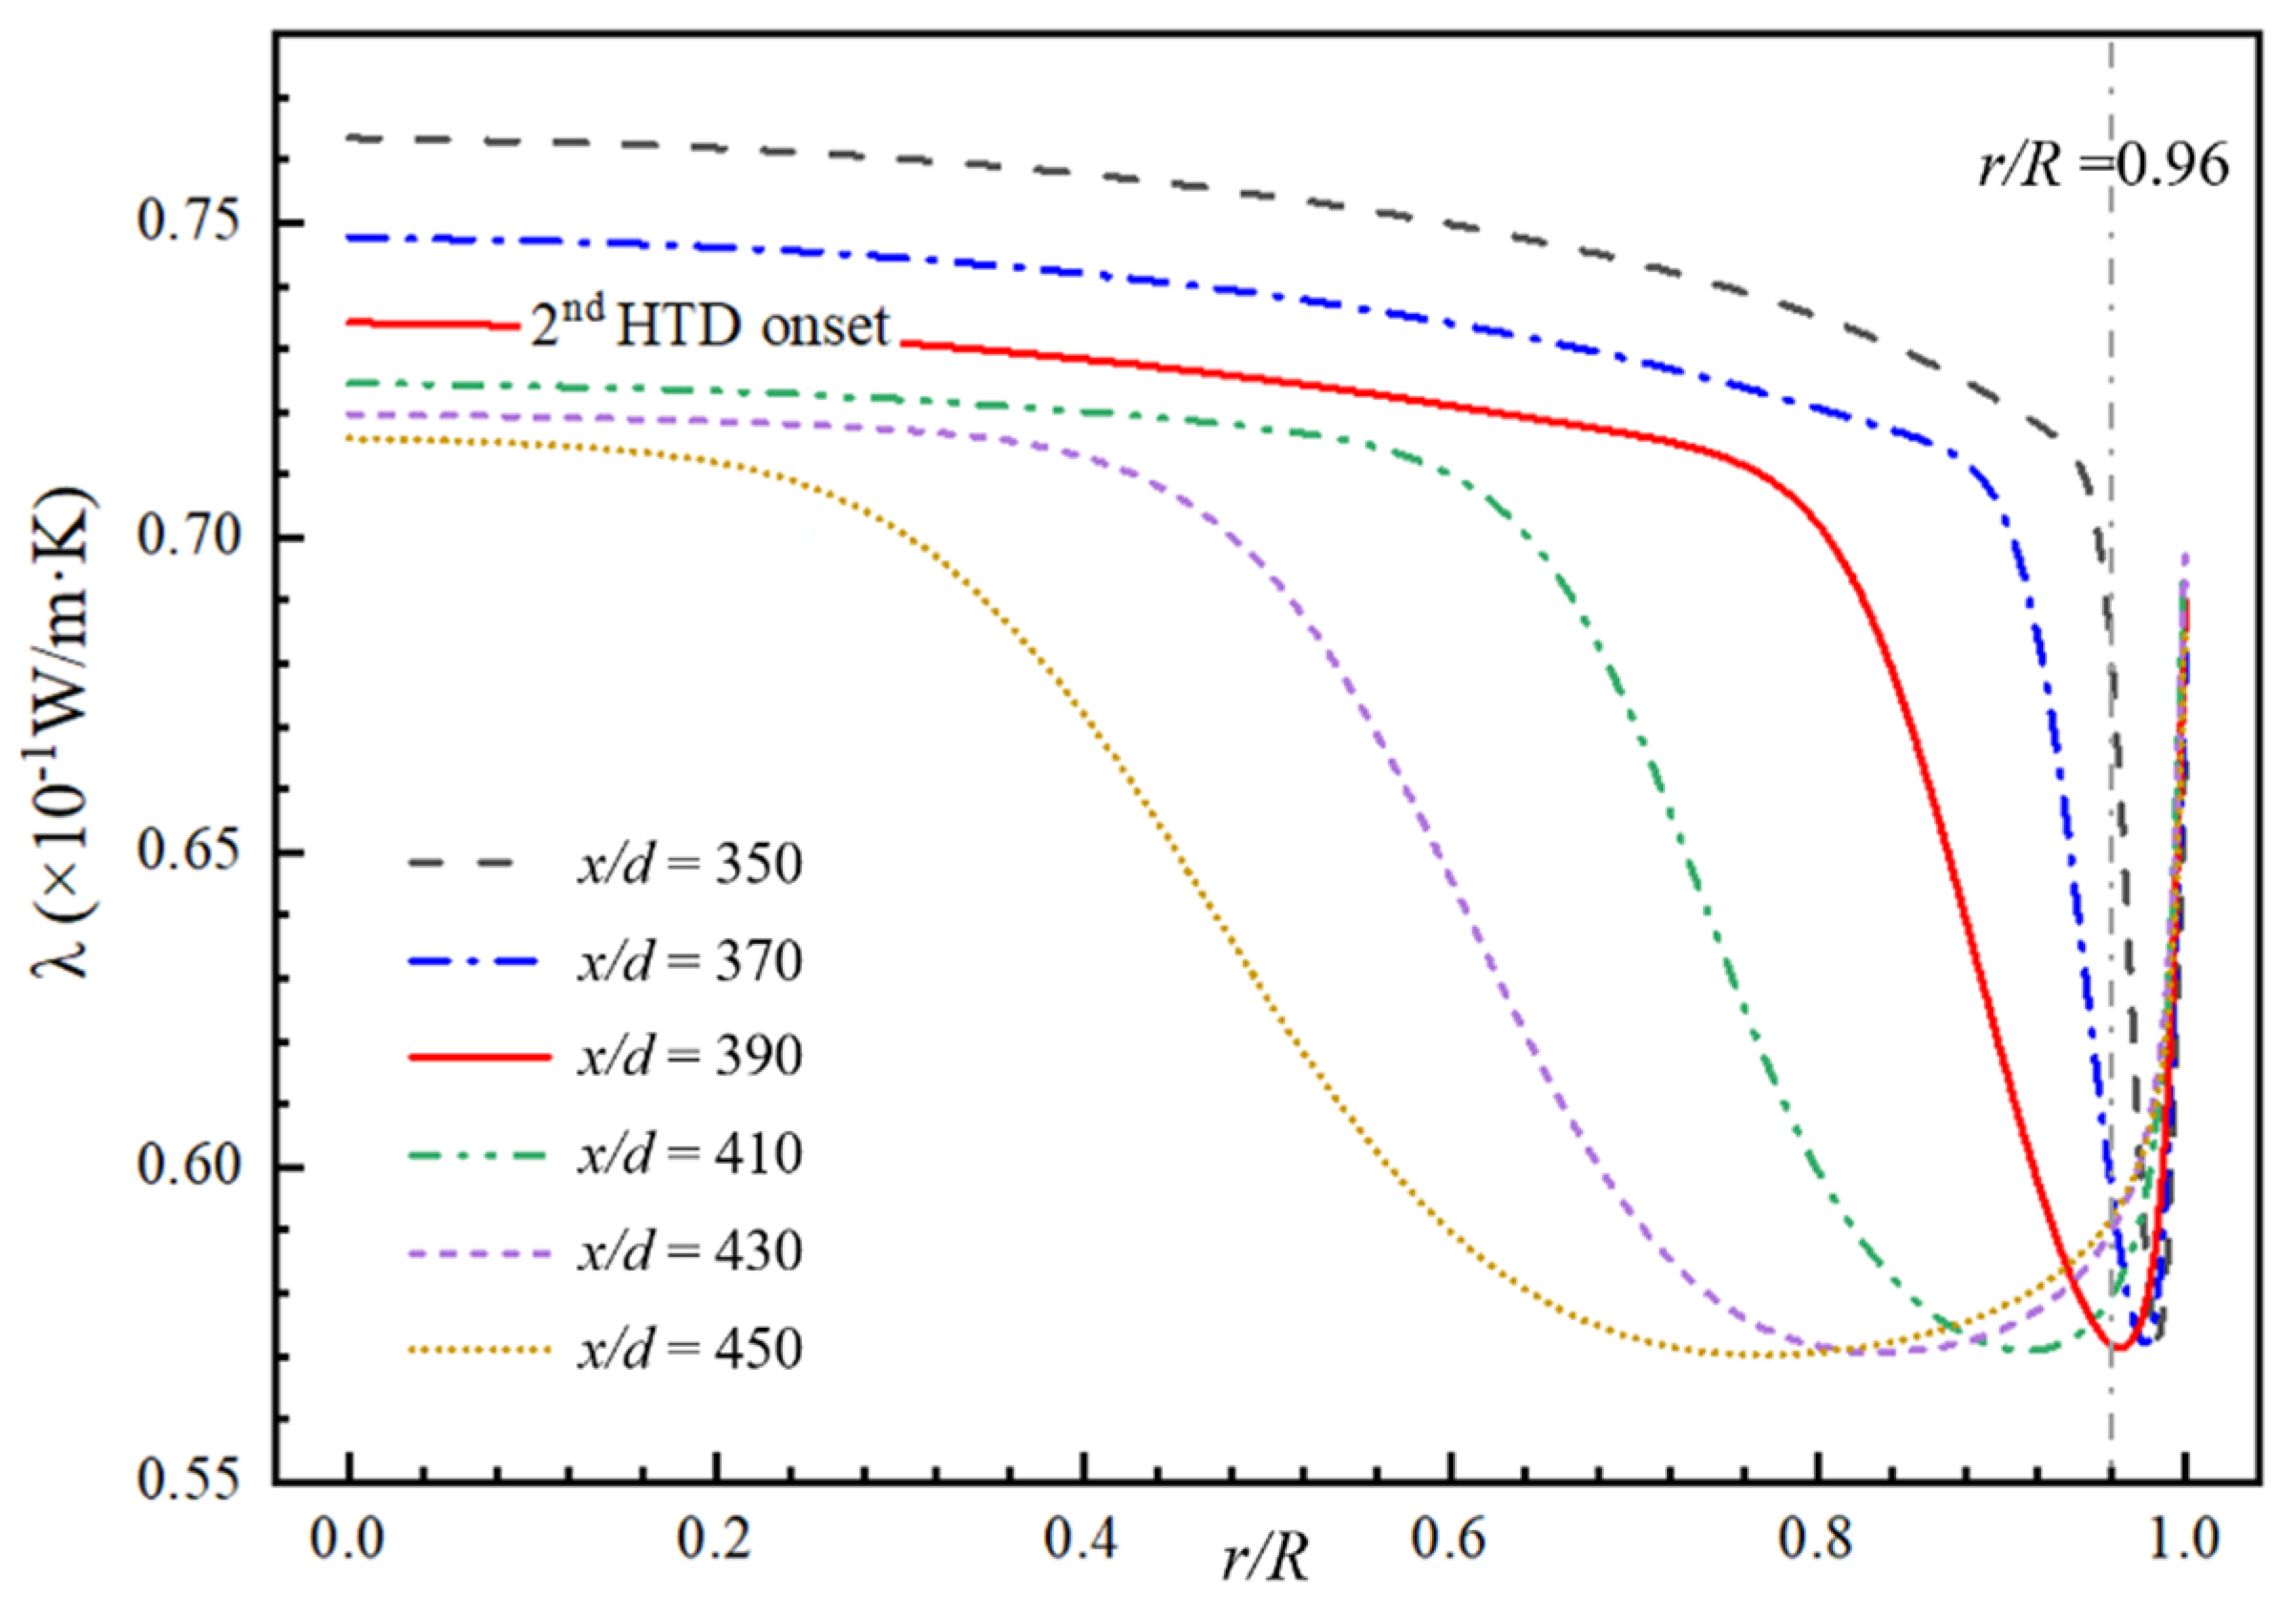
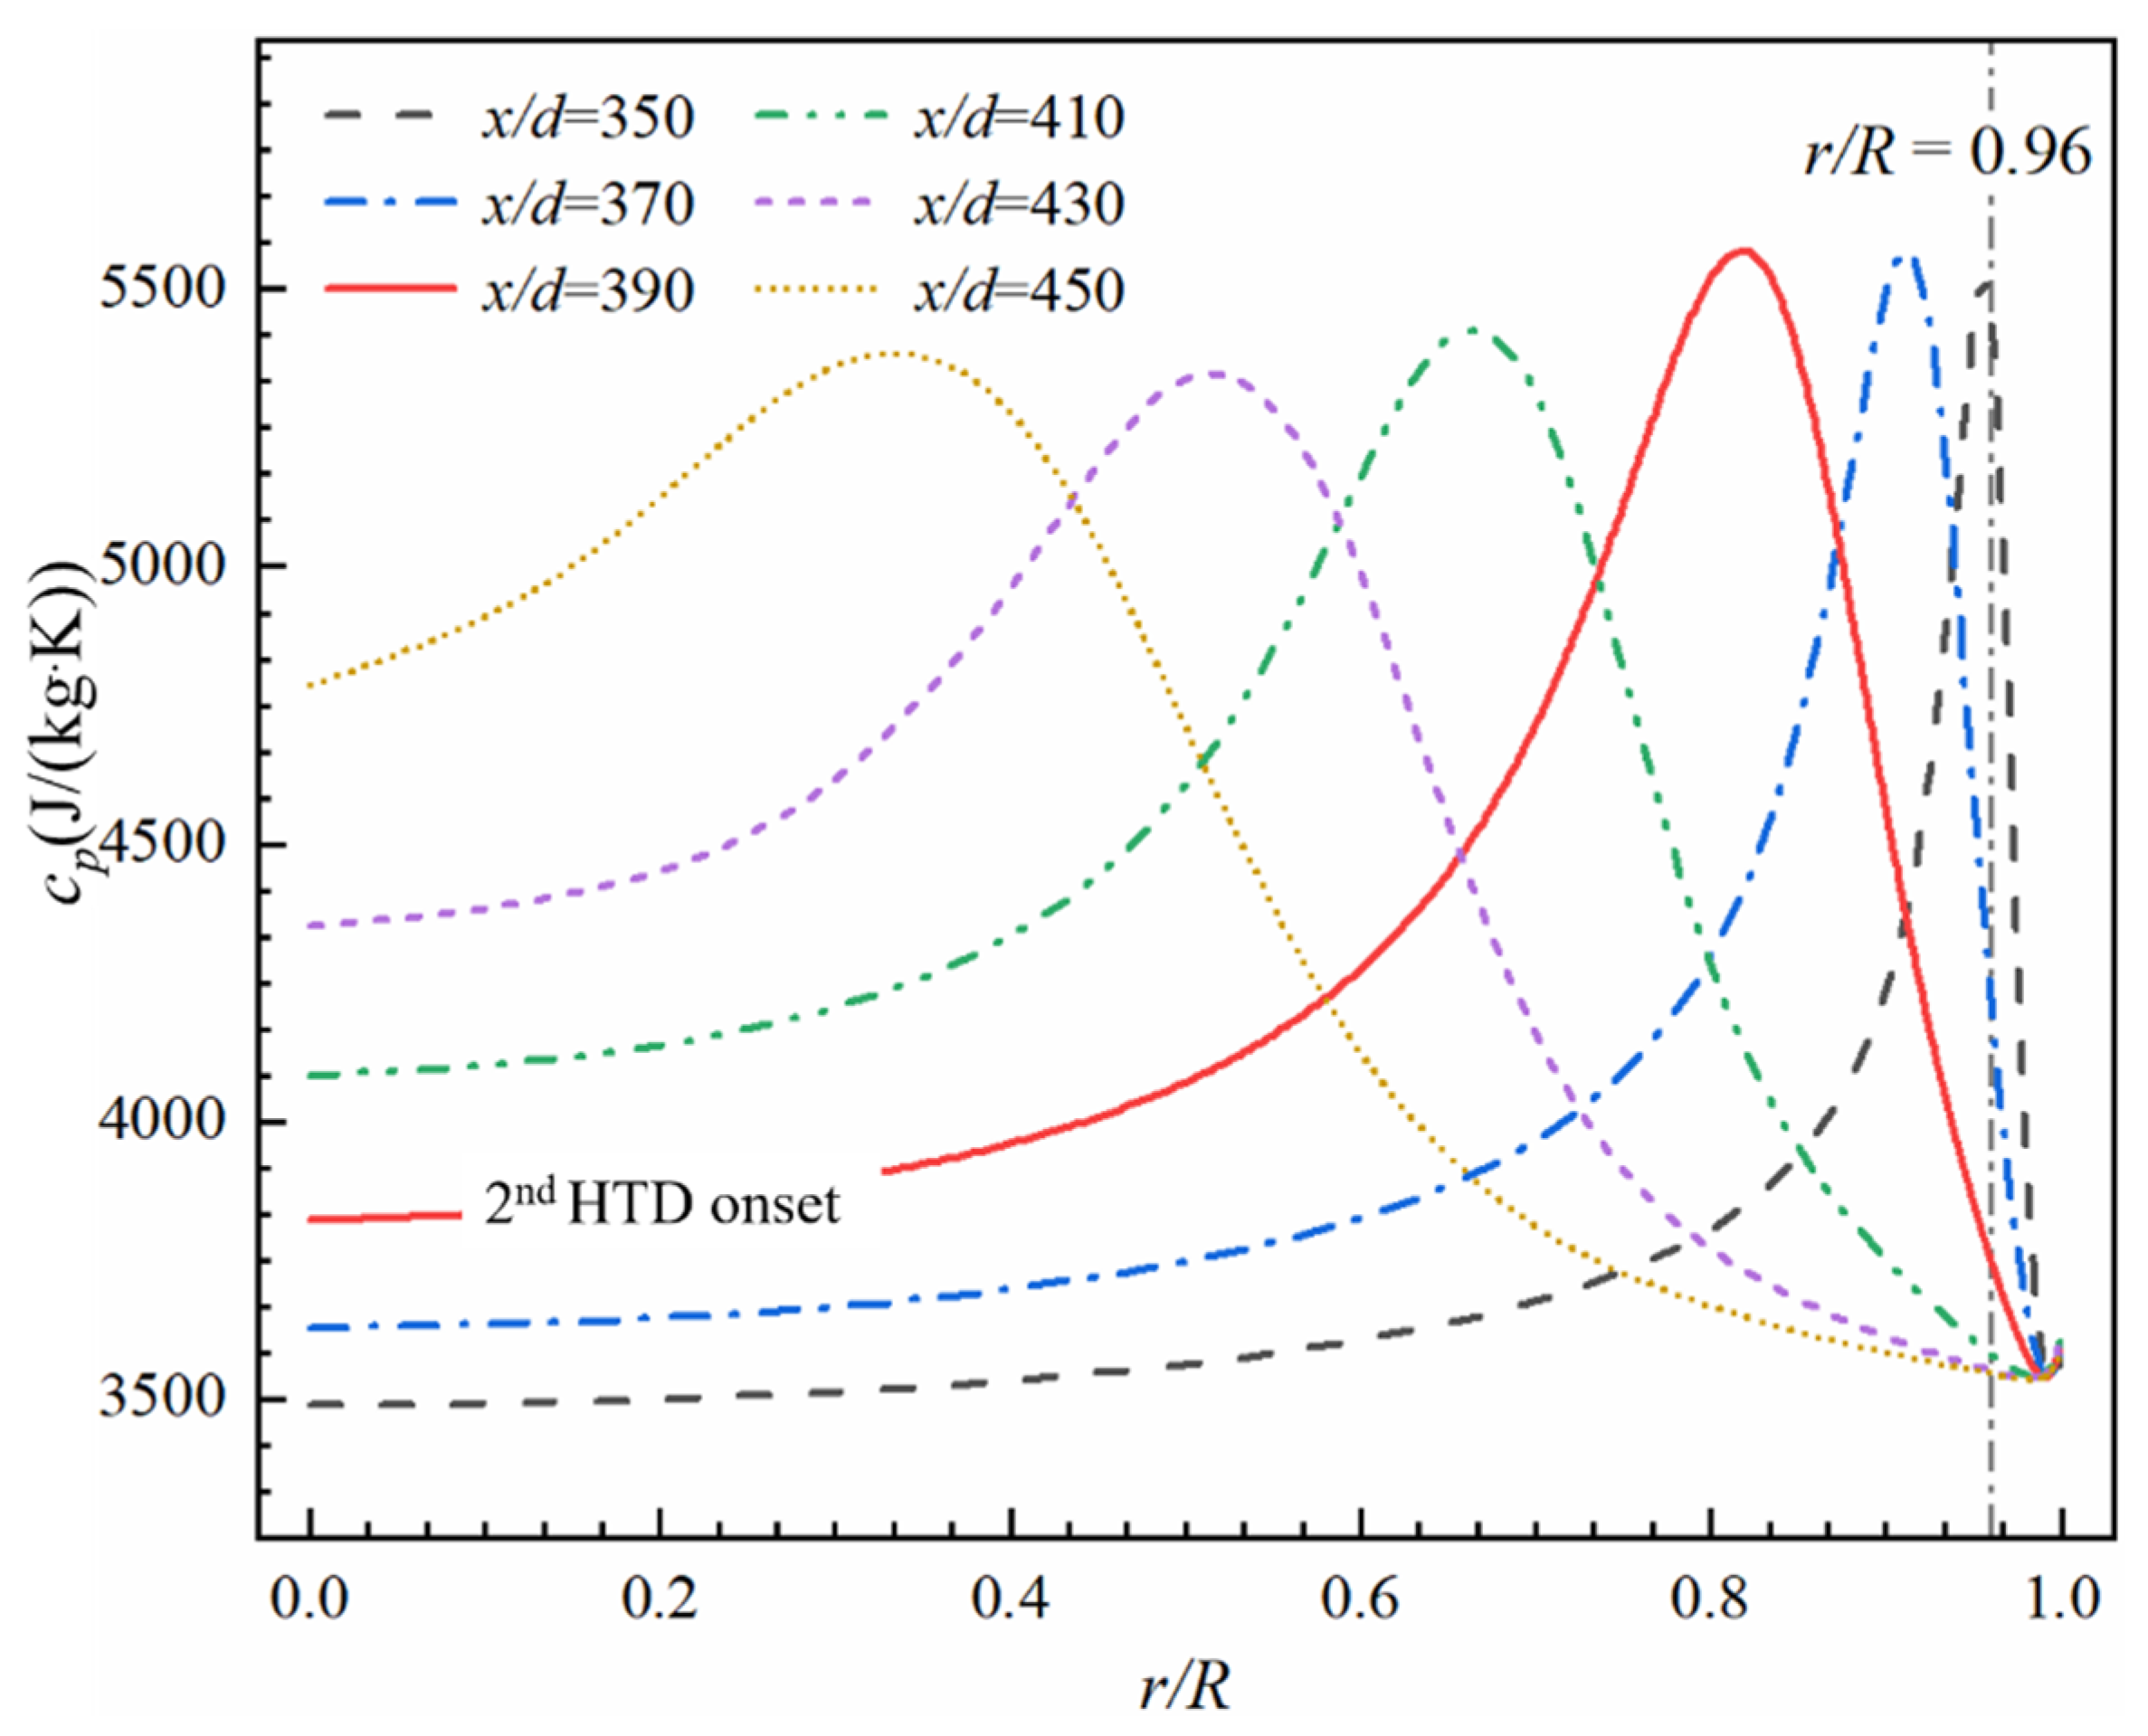
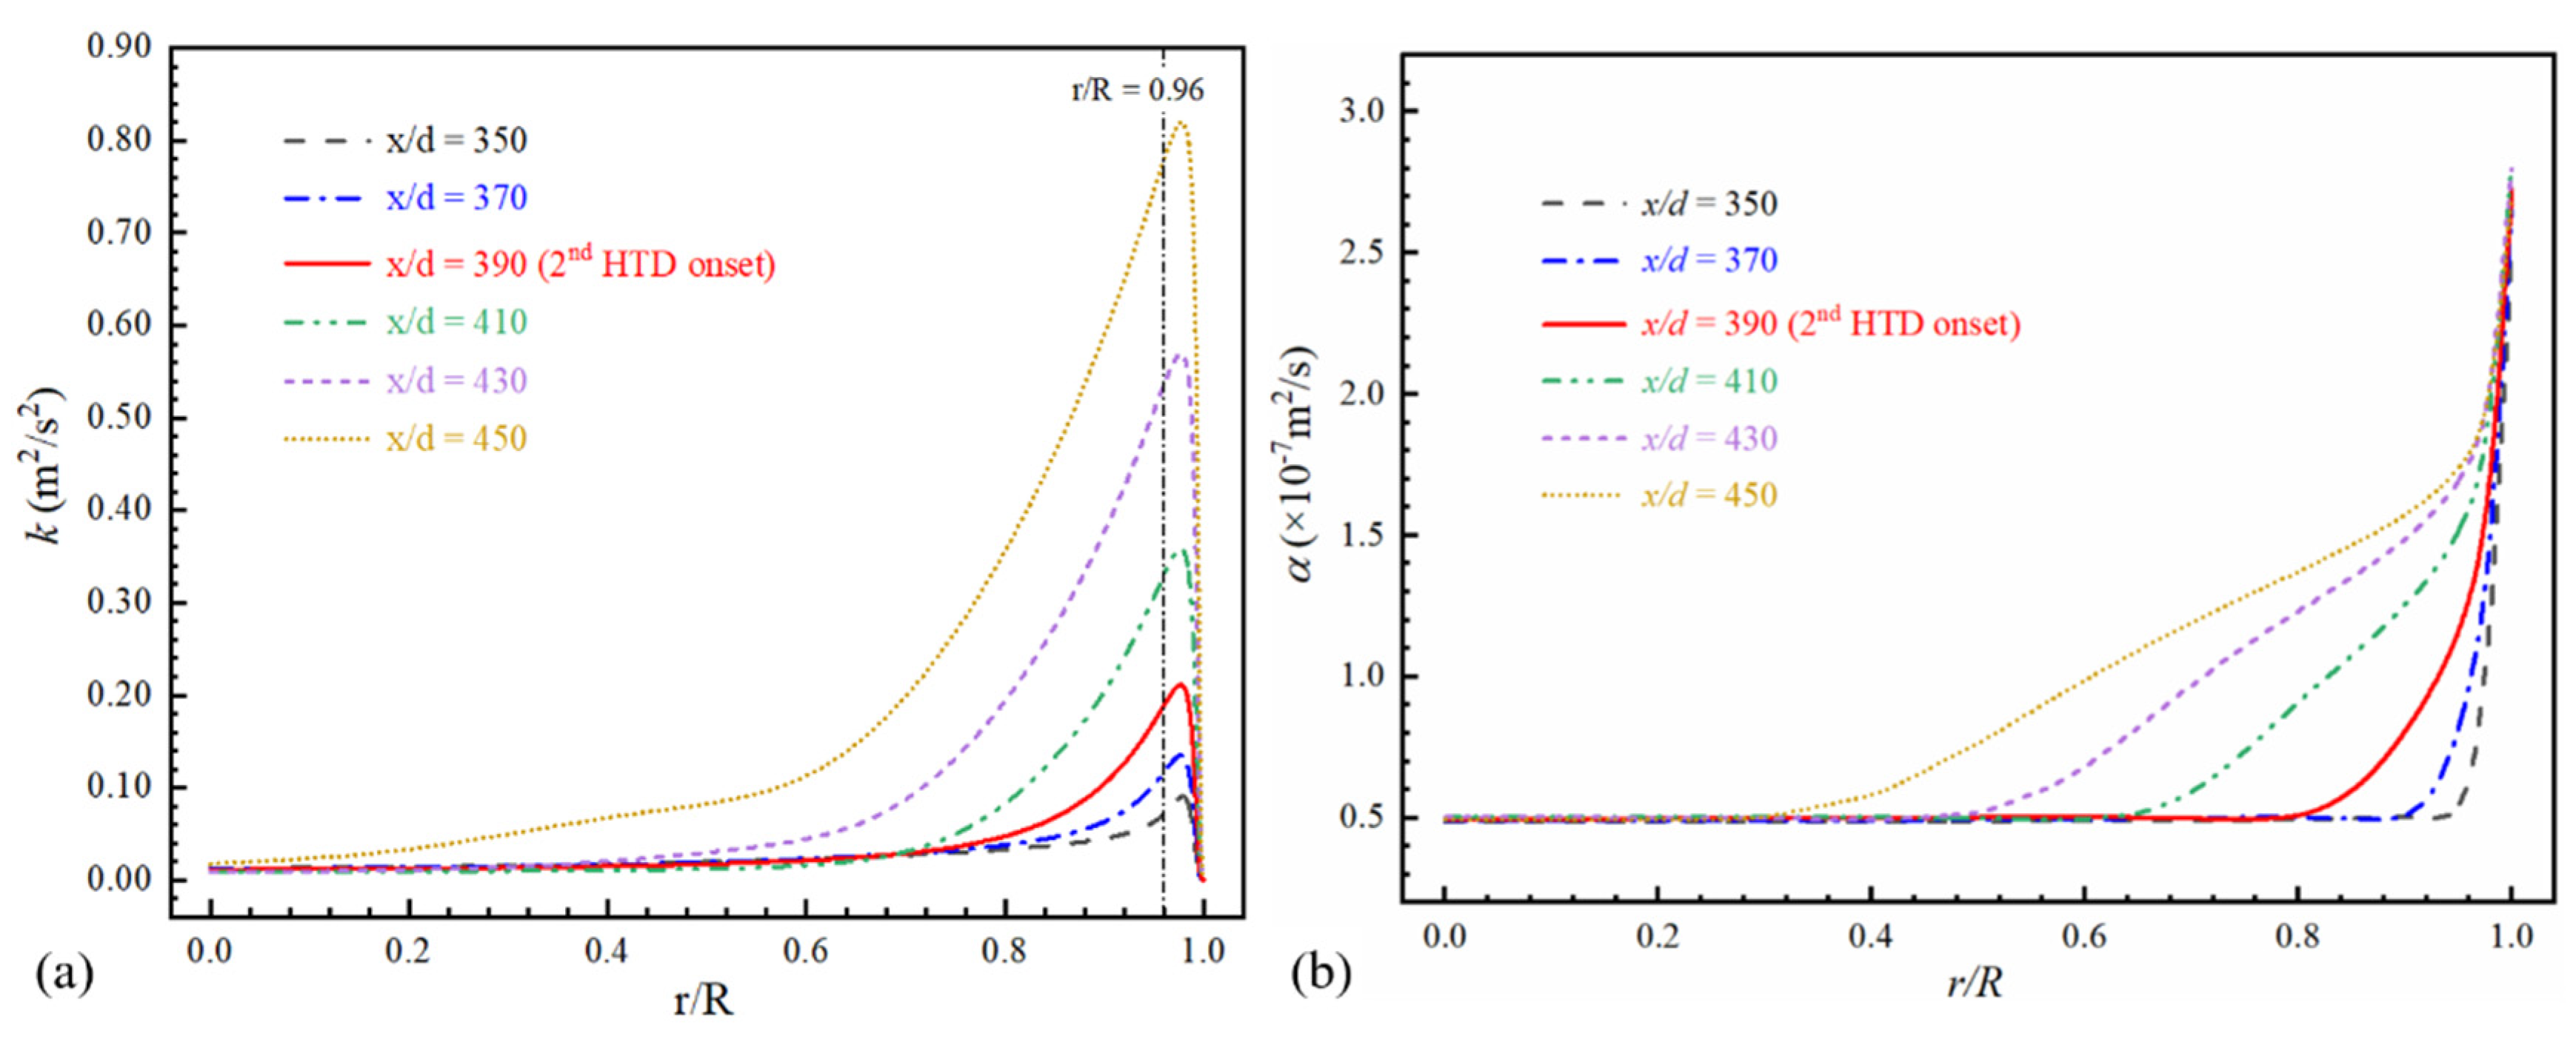
3.2. Mechanism of the Second HTD under Uniform Heat Flux

According to Figure 5, a new sharper rise in wall temperature appears from x/d = 390, which is more evident judging from the wall temperature rising rate in Figure 7. dT/dx (r/R = 1.00) rises dramatically from x/d = 390. The HTC first decreases slightly and then recovers. Thus, the zone of x/d = 390 to 418 is considered as the influence region of the second HTD. The second HTD is observed where TbTpc and Tw     Tpc (Figure 5 and Figure 10). Therefore, the variations in fluid physical-properties in the near-wall region become mild again and hardly affect the second HTD. Moreover, the viscous layer becomes much thinner when x/d > 380. The mechanism of the second HTD is completely different from the first HTD and deserves further analysis. Although the second HTD is not that obvious under the uniform heat flux boundary, it will be notable under the nonuniform heat flux boundary and deserves further study.
As shown in Figure 7, the distributions of dT/dx at three radial positions in the second HTD zone (x/d = 390–418) are totally opposite to those of the first HTD zone (x/d = 225–350). The dT/dx distributions at r/R = 0.88 and 0.96 are close and much higher than that of the r/R = 1, indicating that the main heat transfer resistance of the second HTD moves to the region r/R < 0.96, the thermal properties of which are focused. A “U”-type radial distribution of λ is noticed (Figure 11). The nadir point moves gradually to the core region as x/d increases, which causes a region with low λ (r/R = 0.6–0.96). Meanwhile, the “mountain”-type radial distribution of cp offers a similar influence (Figure 12). The peak of cp moves to the core region as x/d increases, which causes a low-cp region (r/R = 0.6–0.96). The decrease in both λ and cp in this region results in the high heat transfer resistance and causes the second HTD.
Finally, the second HTD disappears. As the x/d continues increasing, the turbulent diffusion between the near-wall region and the core region intensifies accordingly. The near-wall high fluid temperature zone expands to the core region. The turbulent kinetic energy (k) and thermal diffusion coefficient (α) are analyzed in Figure 13. In the region r/R < 0.96, the turbulent kinetic energy increases versus x/d. α also increases versus x/d. The variations in k and α both enhance the heat transfer, the effect of which begins to outweigh the effect of the low-λ and -cp region. Finally, the domination of thermal properties ends in the area x/d > 418 and the heat transfer is enhanced again.

3.3. Heat Transfer under Axially Nonuniform Heat Flux

The combustion heat release and aerodynamic heating of the SCRamjet differ in different engine components, which leads to the nonuniform wall heat flux in the flow direction [55]. As shown in Figure 14a, nine axially nonuniform heat flux distributions with the same average value (1.2 MW/m2) and degree of nonuniformity (Φ = qfmax/qfmin = 2) are deployed to simulate the nonuniform heat flux boundary in the SCRamjet. The distances between the heat flux peak and the tube inlet in nine cases are defined as Lq_C1 to Lq_C9. The outlet fuel temperature is the same in different cases because of the same heating power. The distance between the adjacent heat flux peaks is 50 mm. The maximum wall temperature (Tw, max) is selected to be a cooling effect indicator, which directly determines the structure safety. As shown in Figure 14b, there is a peak in the Tw, max distribution from Case No.1 to Case No.9, which occurs at the middle part of the tube (x/d = 350, Case No.6). According to the variation in Tw, max, Case No.1, No.6, and No.9 are selected as representatives for the detailed analysis of the axially nonuniform heat flux effects.
As shown in Figure 15, the wall temperature distribution is closely related to the heat flux peak position. The onset points of HTD are defined as Lhtd1_Cn and Lhtd2_Cn for the first and second HTD, respectively, in which n is Case No. In Case No.1, the second HTD is not serious. Both the first and second HTD are successfully captured in Case No.6 and No.9.

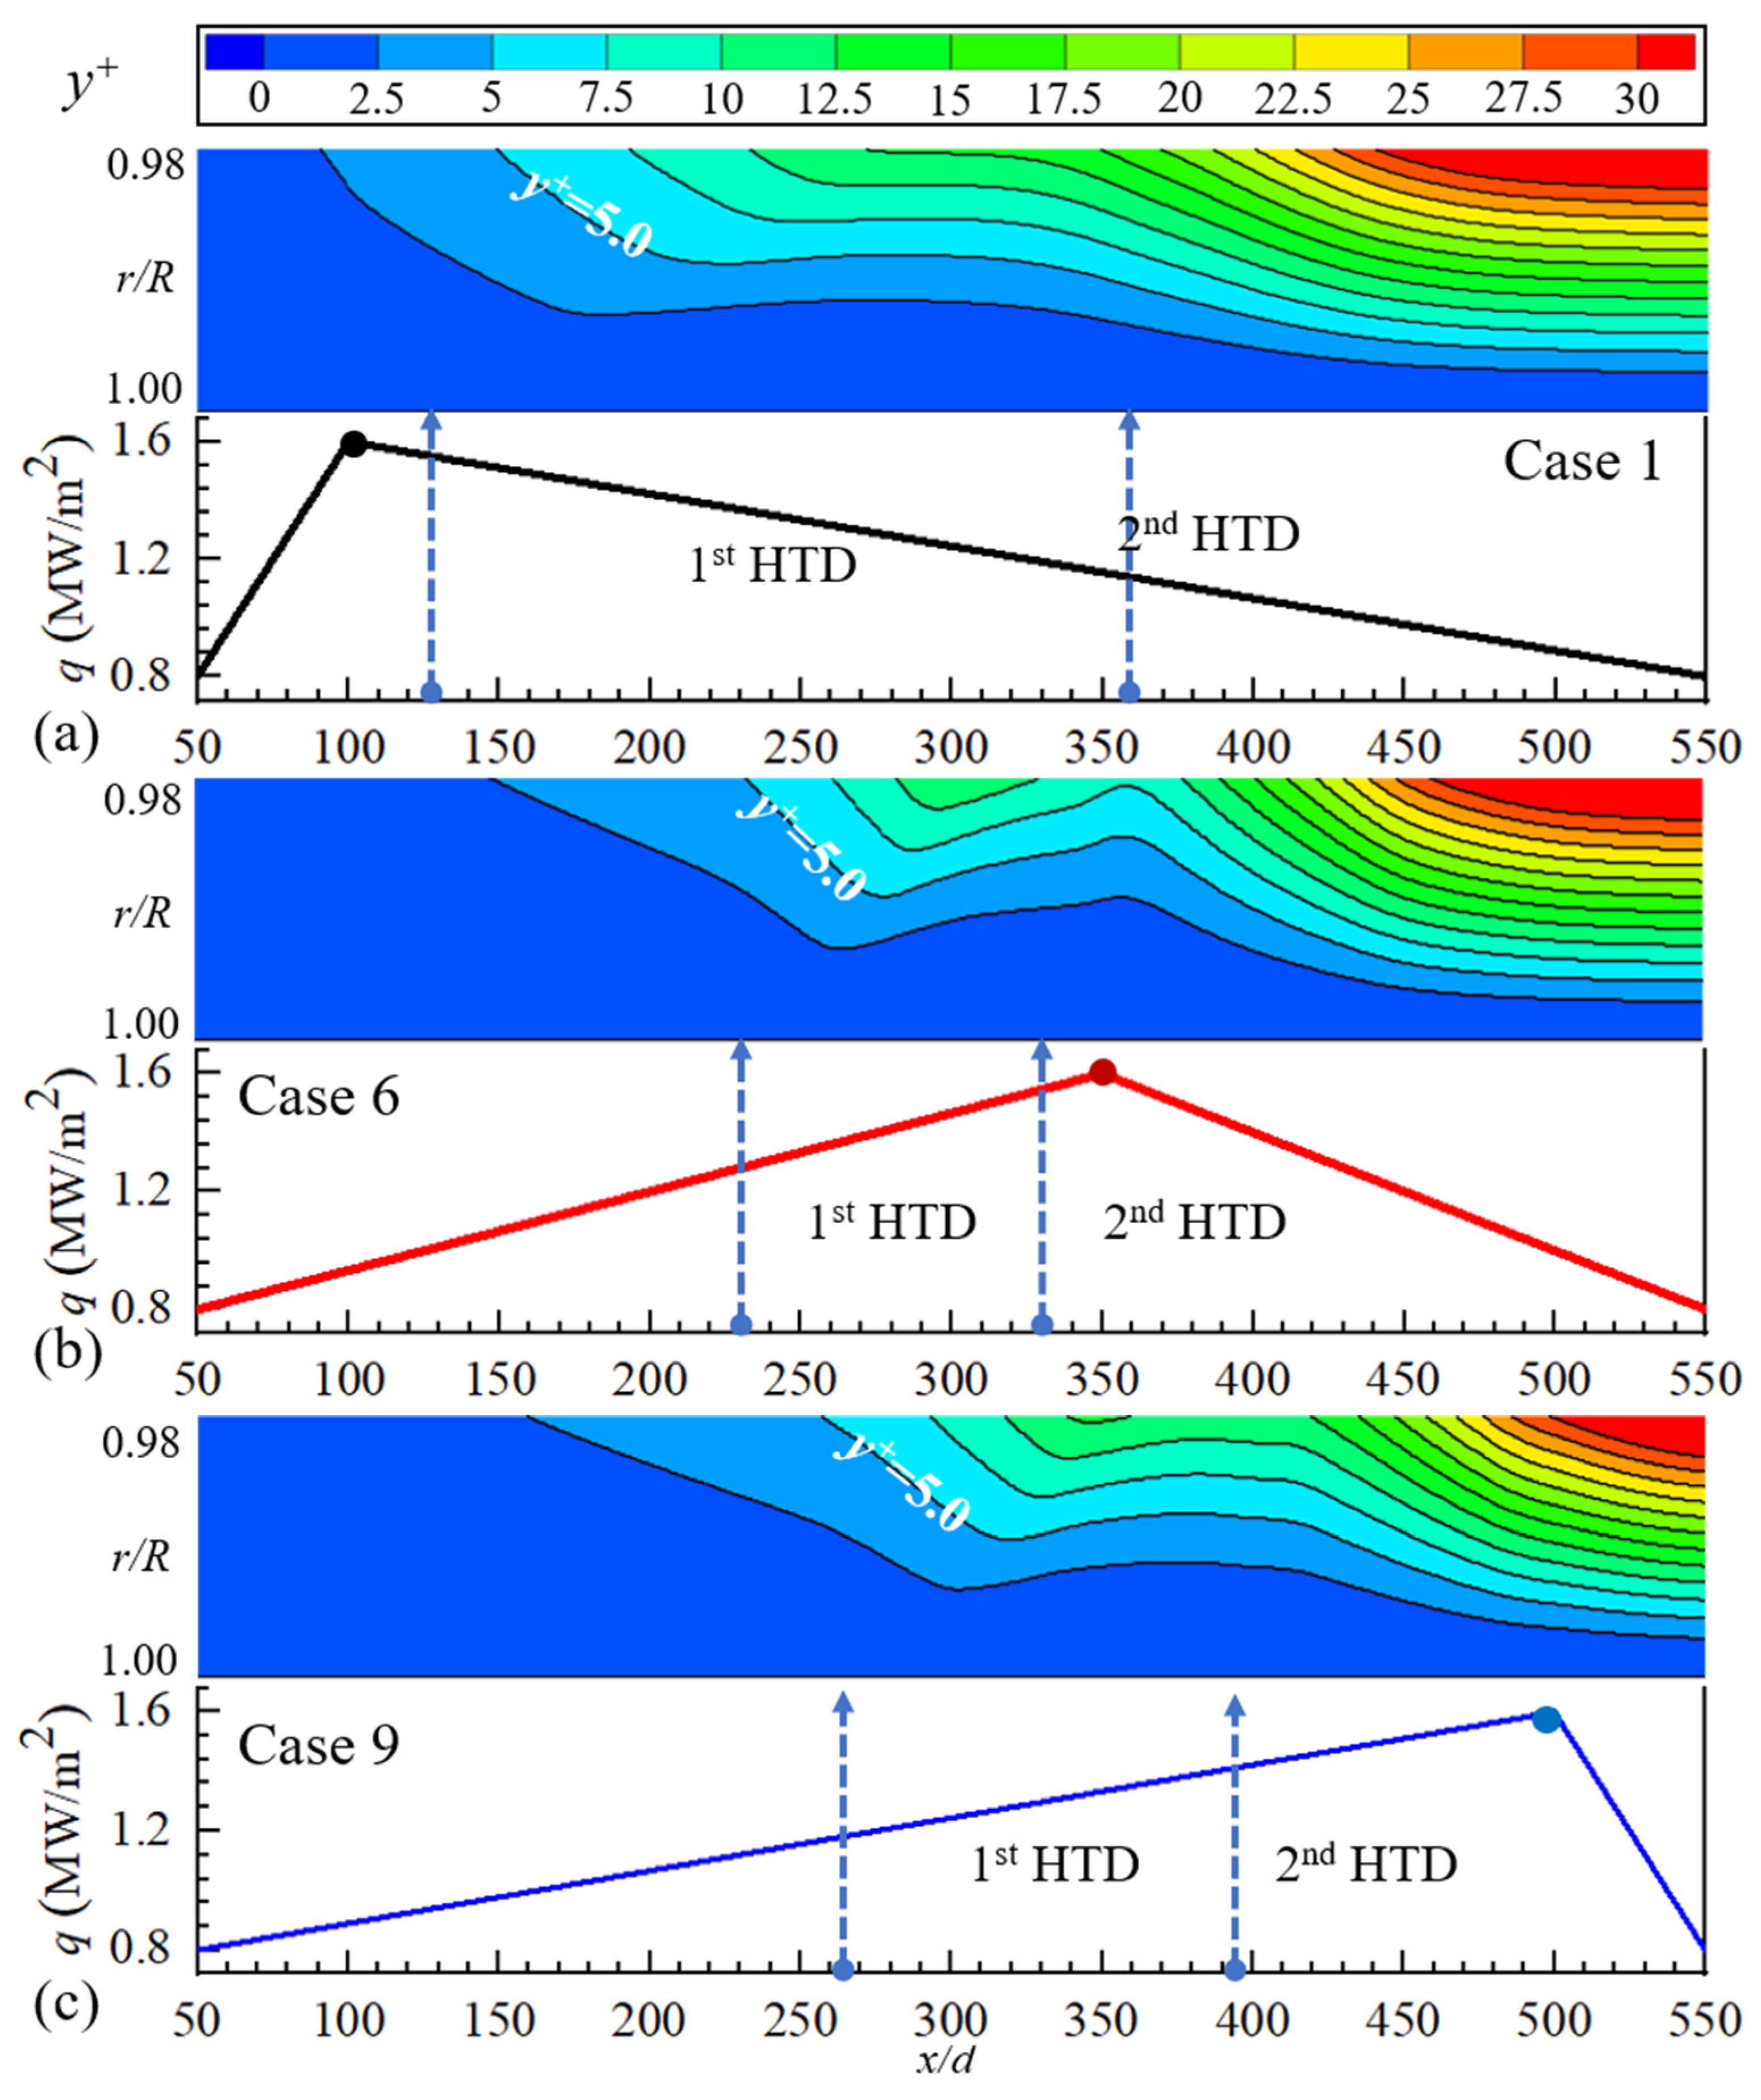
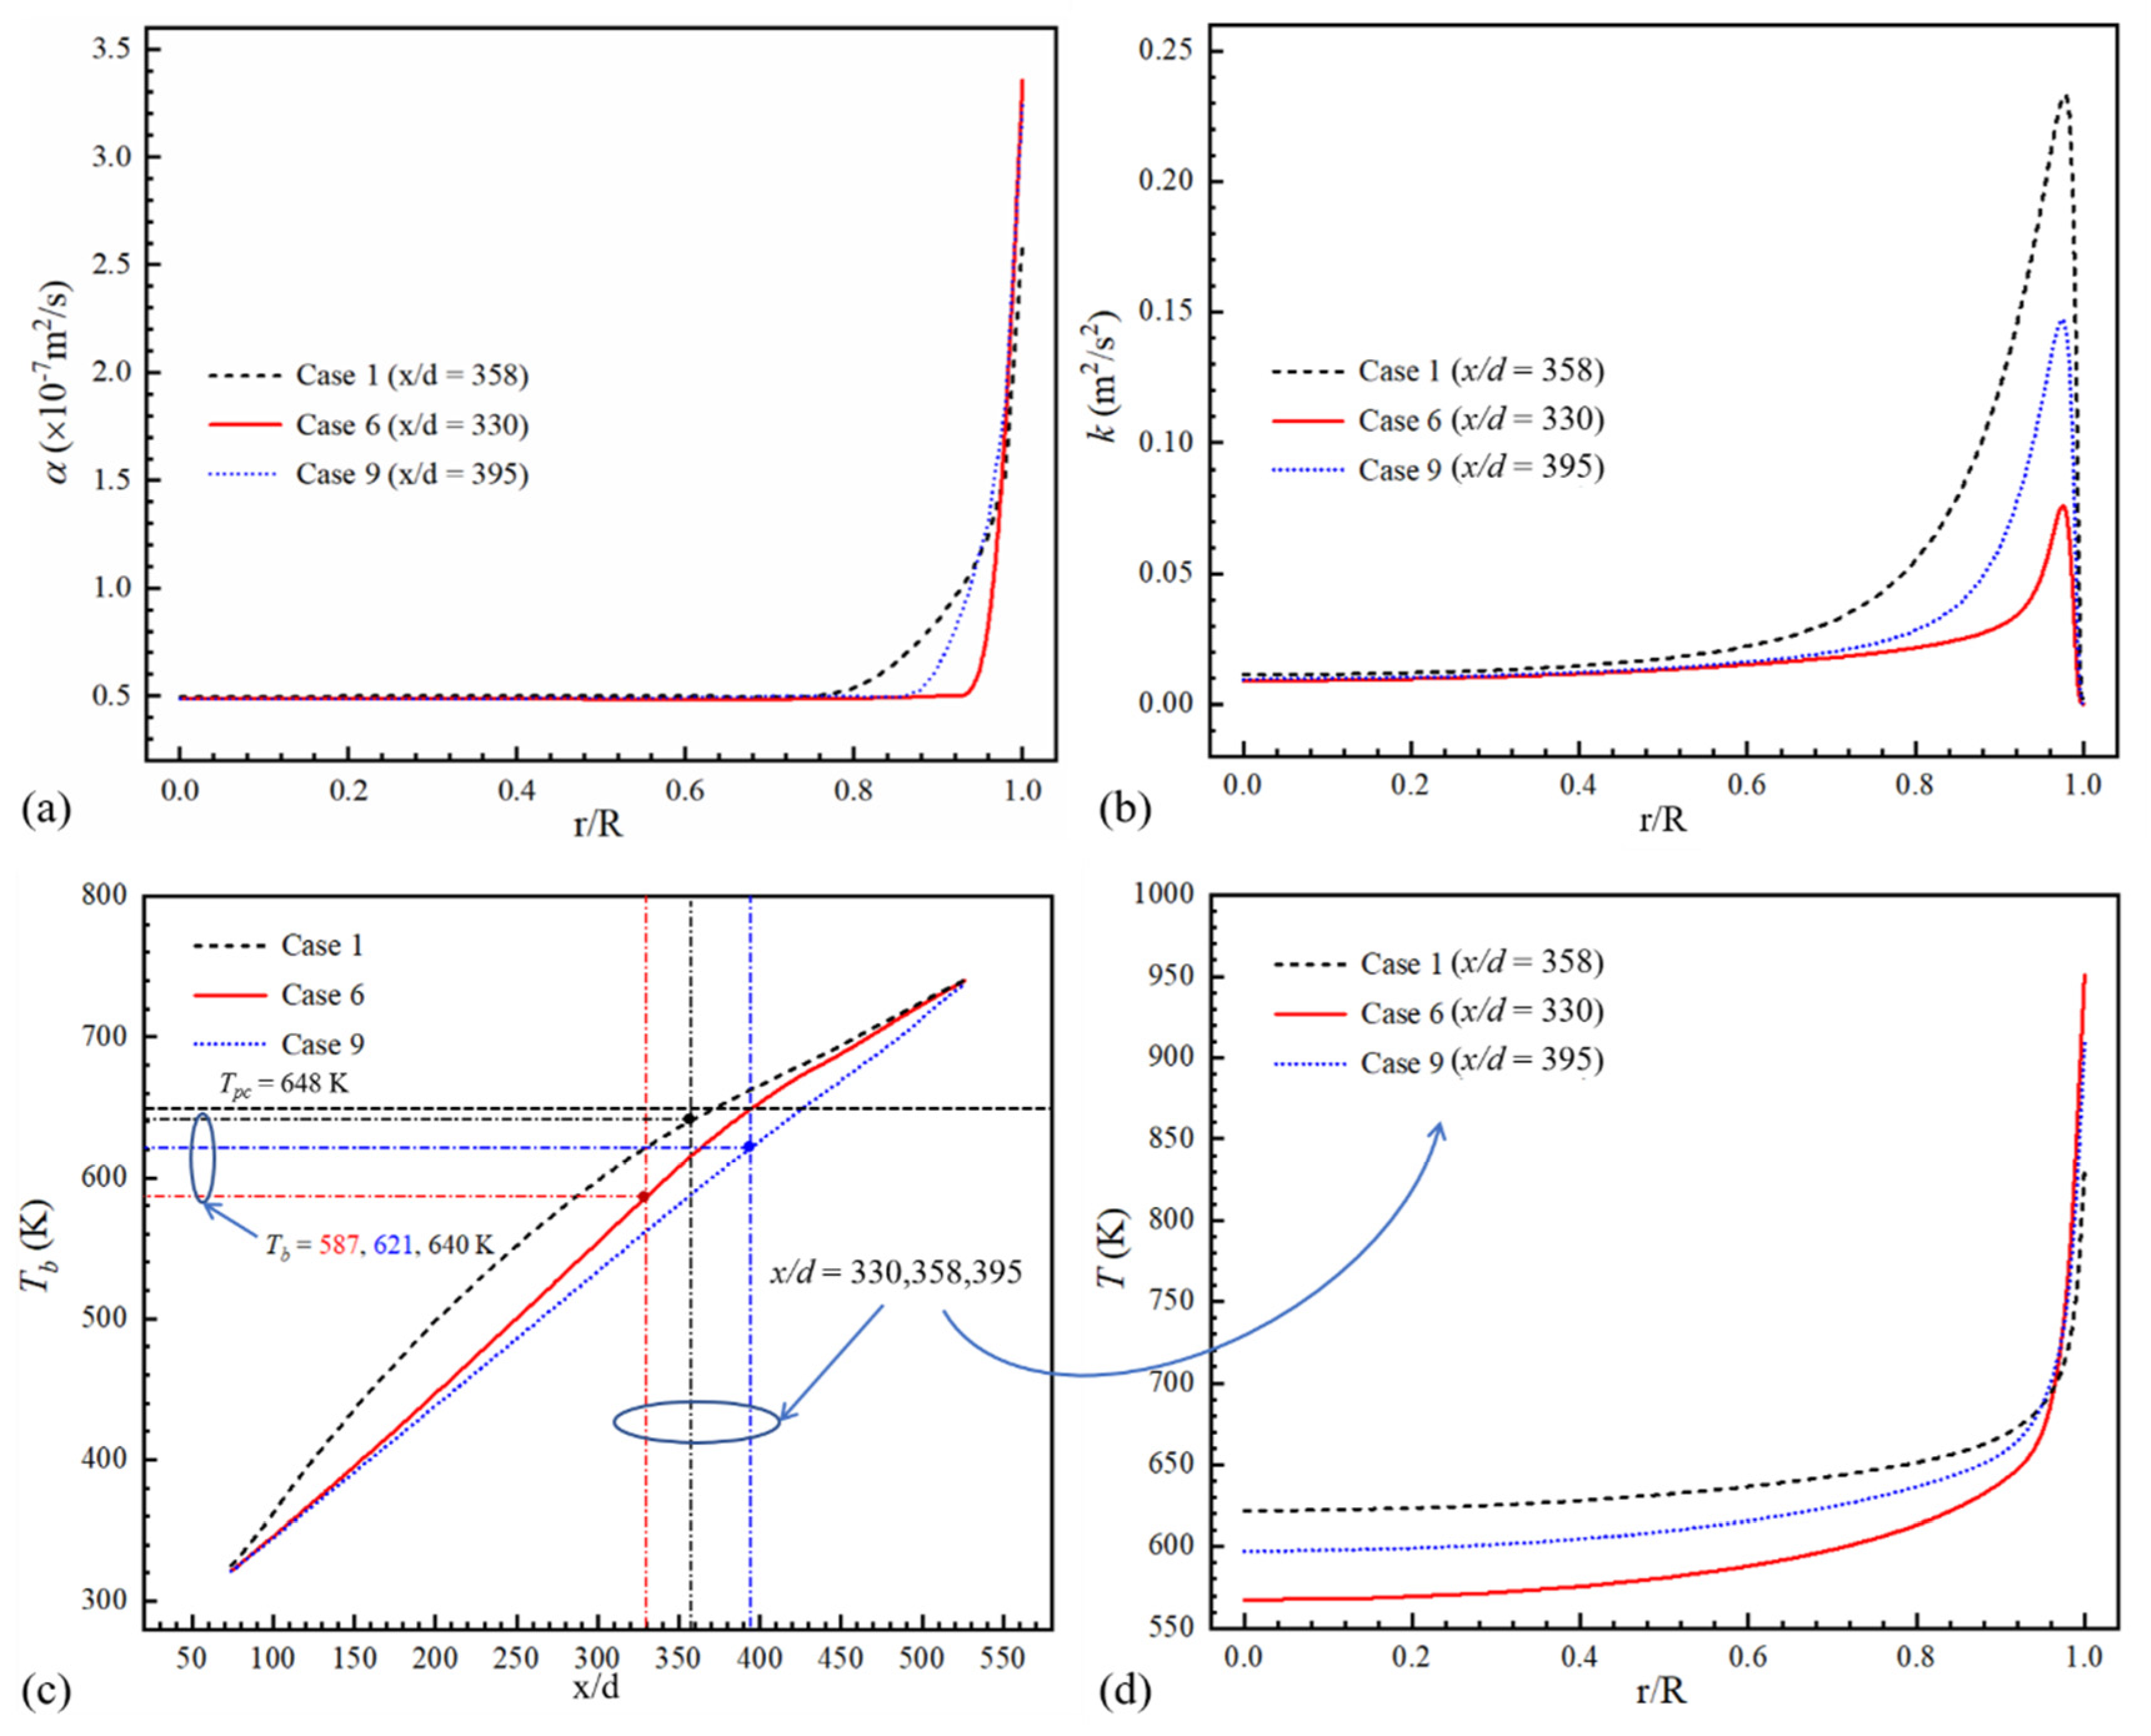
3.3.1. Evolution of First HTD under Axially Nonuniform Heat Flux

The first HTD begins from x/d = 125 because the location of the heat flux peak is in the upstream. The HTC of Case No.1 stops increasing with fuel temperature and remains at a lower level compared with the same x/d zone in Case No.6 and No.9. As shown in Figure 16, the integral levels of du/dx and k are lowest in Case No.1, which explains why the HTC of Case No.1 is lowest when the first HTD occurs. When the heat flux peak moves downstream, the near-wall local peak of du/dx in Case No.6 is similar to that of Case No.9, which are both more obvious than that of Case No.1. The flow acceleration is thus more serious and k decreases more rapidly versus x/d, which cause a more serious first HTD in Case No.6 and No.9 than in Case No.1. The HTC curves in the first HTD of Case No.6 and Case No.9 are highly similar, the difference of which is mainly in the starting point.
The thickness of the viscous sublayer is affected by the heat flux distribution and heat flux (Figure 17). When the first HTD occurs, the viscous sublayer begins to thicken. The thickening phenomenon is most obvious in Case No.6. in different cases. The corresponding heat transfer resistance is largest. It helps explain the first HTD difference with different heat flux distributions.

3.3.2. Evolution of Second HTD under Axially Nonuniform Heat Flux

The second HTD is seriously amplified by the nonuniform heat flux, which results in the wall temperature peak (Figure 15) and becomes a severe risk to the thermal structure. As we know, a higher heat flux tends to induce heat transfer deterioration. The heat flux peak of Case No.1 locates in the front section of the tube and Lq_C1 is shortest. However, the onset point of the second HTD in Case No.1 is faraway downstream and very mild. The Lhtd2_C1 is even larger than Lhtd2_C6. As concluded in Section 3.2, the second HTD is affected jointly by the turbulence and the thermal properties degeneration (region with low λ and cp). As shown in Figure 18a, α is lowest in Case No.6 and highest in Case No.1. Different nonuniform heat flux distributions change the balance of these two aspects obviously. Tb of Case No.1 increases most rapidly along the flow direction because of the nonuniform heat flux (Figure 18c), which results in the most rapid increase in velocity. As shown in Figure 18b, k is highest in Case No.1. Before the second HTD occurs, Tb of Case No.1 is in the lead and the turbulence becomes more violent, which is more dominant and greatly limits the influences of the low-λ and -cp zone. As a result, the second HTD in Case No.1 is alleviated to a weak level and moves to the downstream.
Regarding the second HTD in Case No.6 and No.9, the effects of turbulence and thermal properties both degenerate, which lead to obvious heat transfer deterioration together with the local heat flux peak. As analyzed in Section 3.2, the second HTD occurs where the TbTpc. The heat flux peak of Case No.6 locates right at the position (Lq_C6 = 350 mm) where TbTpc (Figure 18c). As shown in Figure 18d, in the second HTD onset point of Case No.6, the near-wall fluid is greatly overheated and the fluid temperature in the core region is lowest in three cases, which indicates the largest heat transfer resistance in the radius direction and intensifies the second HTD greatly. As a result, the second HTD is most serious in Case No.6.
From the analysis above, it can be known that the heat flux peak position has a remarkable effect on the heat transfer deterioration. When the heat flux peak is at the trans-critical zone TbTpc, as with Case No.6, the balance of the k and λ is changed and the second HTD is intensified, which leads to high wall temperature and possible structure failure. When the heat flux peak is far from the trans-critical zone, the second HTD alleviates. Especially in Case No.1, the first HTD and second HTD both miss the heat flux peak, both of which are mild. It is concluded that in the cooling design, the fuel flow direction and bulk temperature should be carefully designed based on the thermal boundary to avoid HTD.
When compared with the uniform heat flux case (Figure 5), the minimum HTC deteriorates by 40.80% with a nonuniform heat flux boundary (Φ = 2, Case No.6). It presents a remarkable influence of nonuniform heat flux distribution on the heat transfer.

3.3.3. Cooling Effect under Axially Nonuniform Heat Flux

The maximum wall temperature is a direct indicator of the engine thermal structure cooling effect, which shows a close link with the heat transfer deterioration and should be analyzed emphatically. Case No.1, Case No.6, and two new cases Case No.10 (Φ = 4, Lq = 100 d) and Case No.11 (Φ = 4, Lq = 350 d) are introduced and compared. In Case No.1, the heat flux peak locates at the subcritical temperature zone (x/d = 100) with the degree of nonuniformity Φ = 2. Both types of HTD alleviate and Tw_max is only 840 K. When it comes to Case No.6, the heat flux peak is near to the pseudo-critical point, inducing a severely aggravated deterioration behavior. Tw_max increases by 27.5%, which comes to 1071 K (Figure 19). More seriously, in case (Φ = 4, Lq = 350 d), both types of HTD worsen significantly and Tw_max increases to 1344 K. Particularly, from the aspect of the cooling effect, when comparing Case No.6 (Φ = 2, Lq = 350 d, Tw_max=1071 K) with Case No.10 (Φ = 4, Lq = 100 d, Tw_max = 944 K), Tw_max falls by 127 K as Φ increases, which further indicates the positive influence of the heat flux peak location design. Therefore, the axially nonuniform heat flux with a peak near to the trans-critical zone is high-risk, especially with a higher degree of nonuniformity. The cooling effect is better with the heat flux peak locating at the lower-fuel-temperature zone where Tw < Tpc.
The pressure drop is also a commonly seen parameter in heat transfer analysis (Table 3). The variation in heat flux distribution (Case No.1–Case No.9) does not present a remarkable effect on the pressure drop. The maximum fluctuation in pressure drop is 6.8% with Φ = 2. Because the degree of nonuniformity Φ is the same, the overall level of the fuel velocities is similar. In Case No.10 (Φ = 4, Lq = 100 d), the heat flux peak value is higher than cases with Φ = 2. Fuel is rapidly heated from the inlet of the heated section. The overall level of the fuel velocity is higher and the pressure drop is higher than cases with Φ = 2. As in Case No.11 (Φ = 4, Lq = 350 d), the fuel does not experience the significant heat flux peak until near to the outlet of the heated section. The pressure drop is lower than Case No.10 (Φ = 4, Lq = 100 d). Thus, it is known that the heat flux distributions do not have a significant effect on the pressure drop. A higher degree of heat flux distribution nonuniformity increases the pressure drop.

4. Conclusions

To support the regenerative cooling design of the SCRamjet, the trans-critical flow and heat transfer process of n-decane in the mini-horizontal circular tube is numerically investigated in this work. The SST k-ω turbulence model is adopted. The new understandings of two typical HTD behaviors under axially nonuniform heat flux are presented from the perspectives of thermal properties and flow heat transfer resistance. The main conclusions are listed below:
(1)
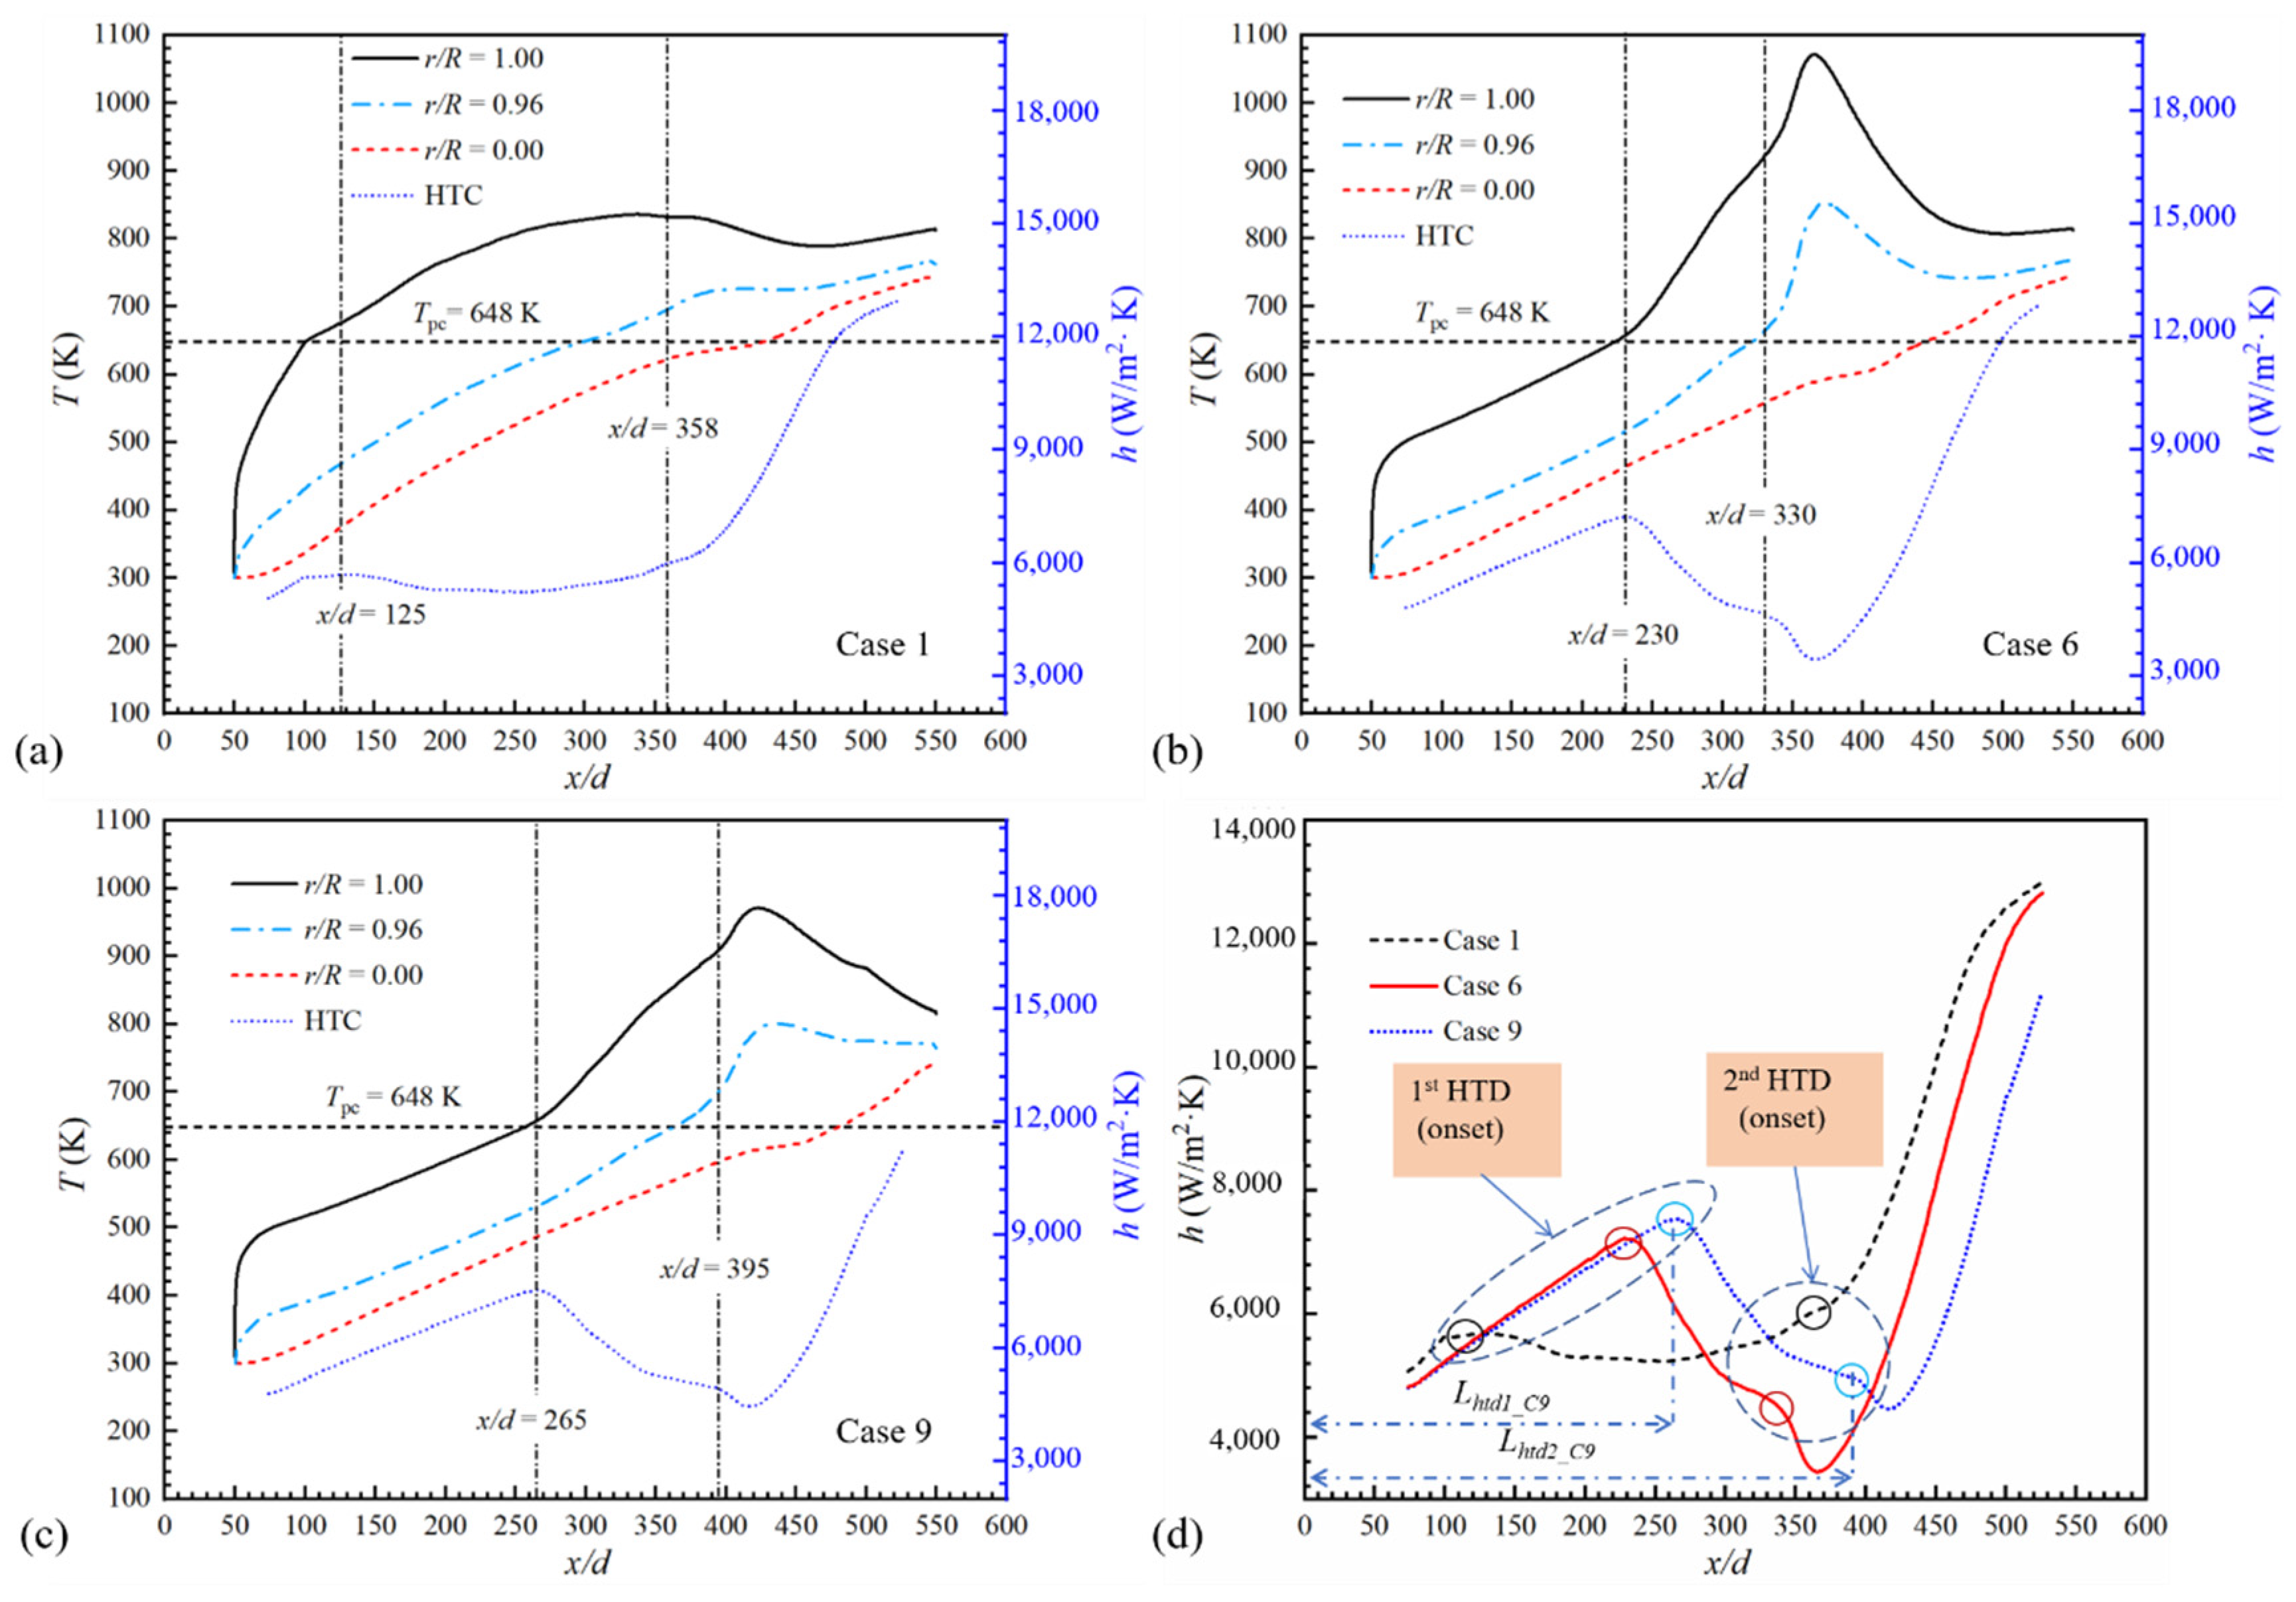
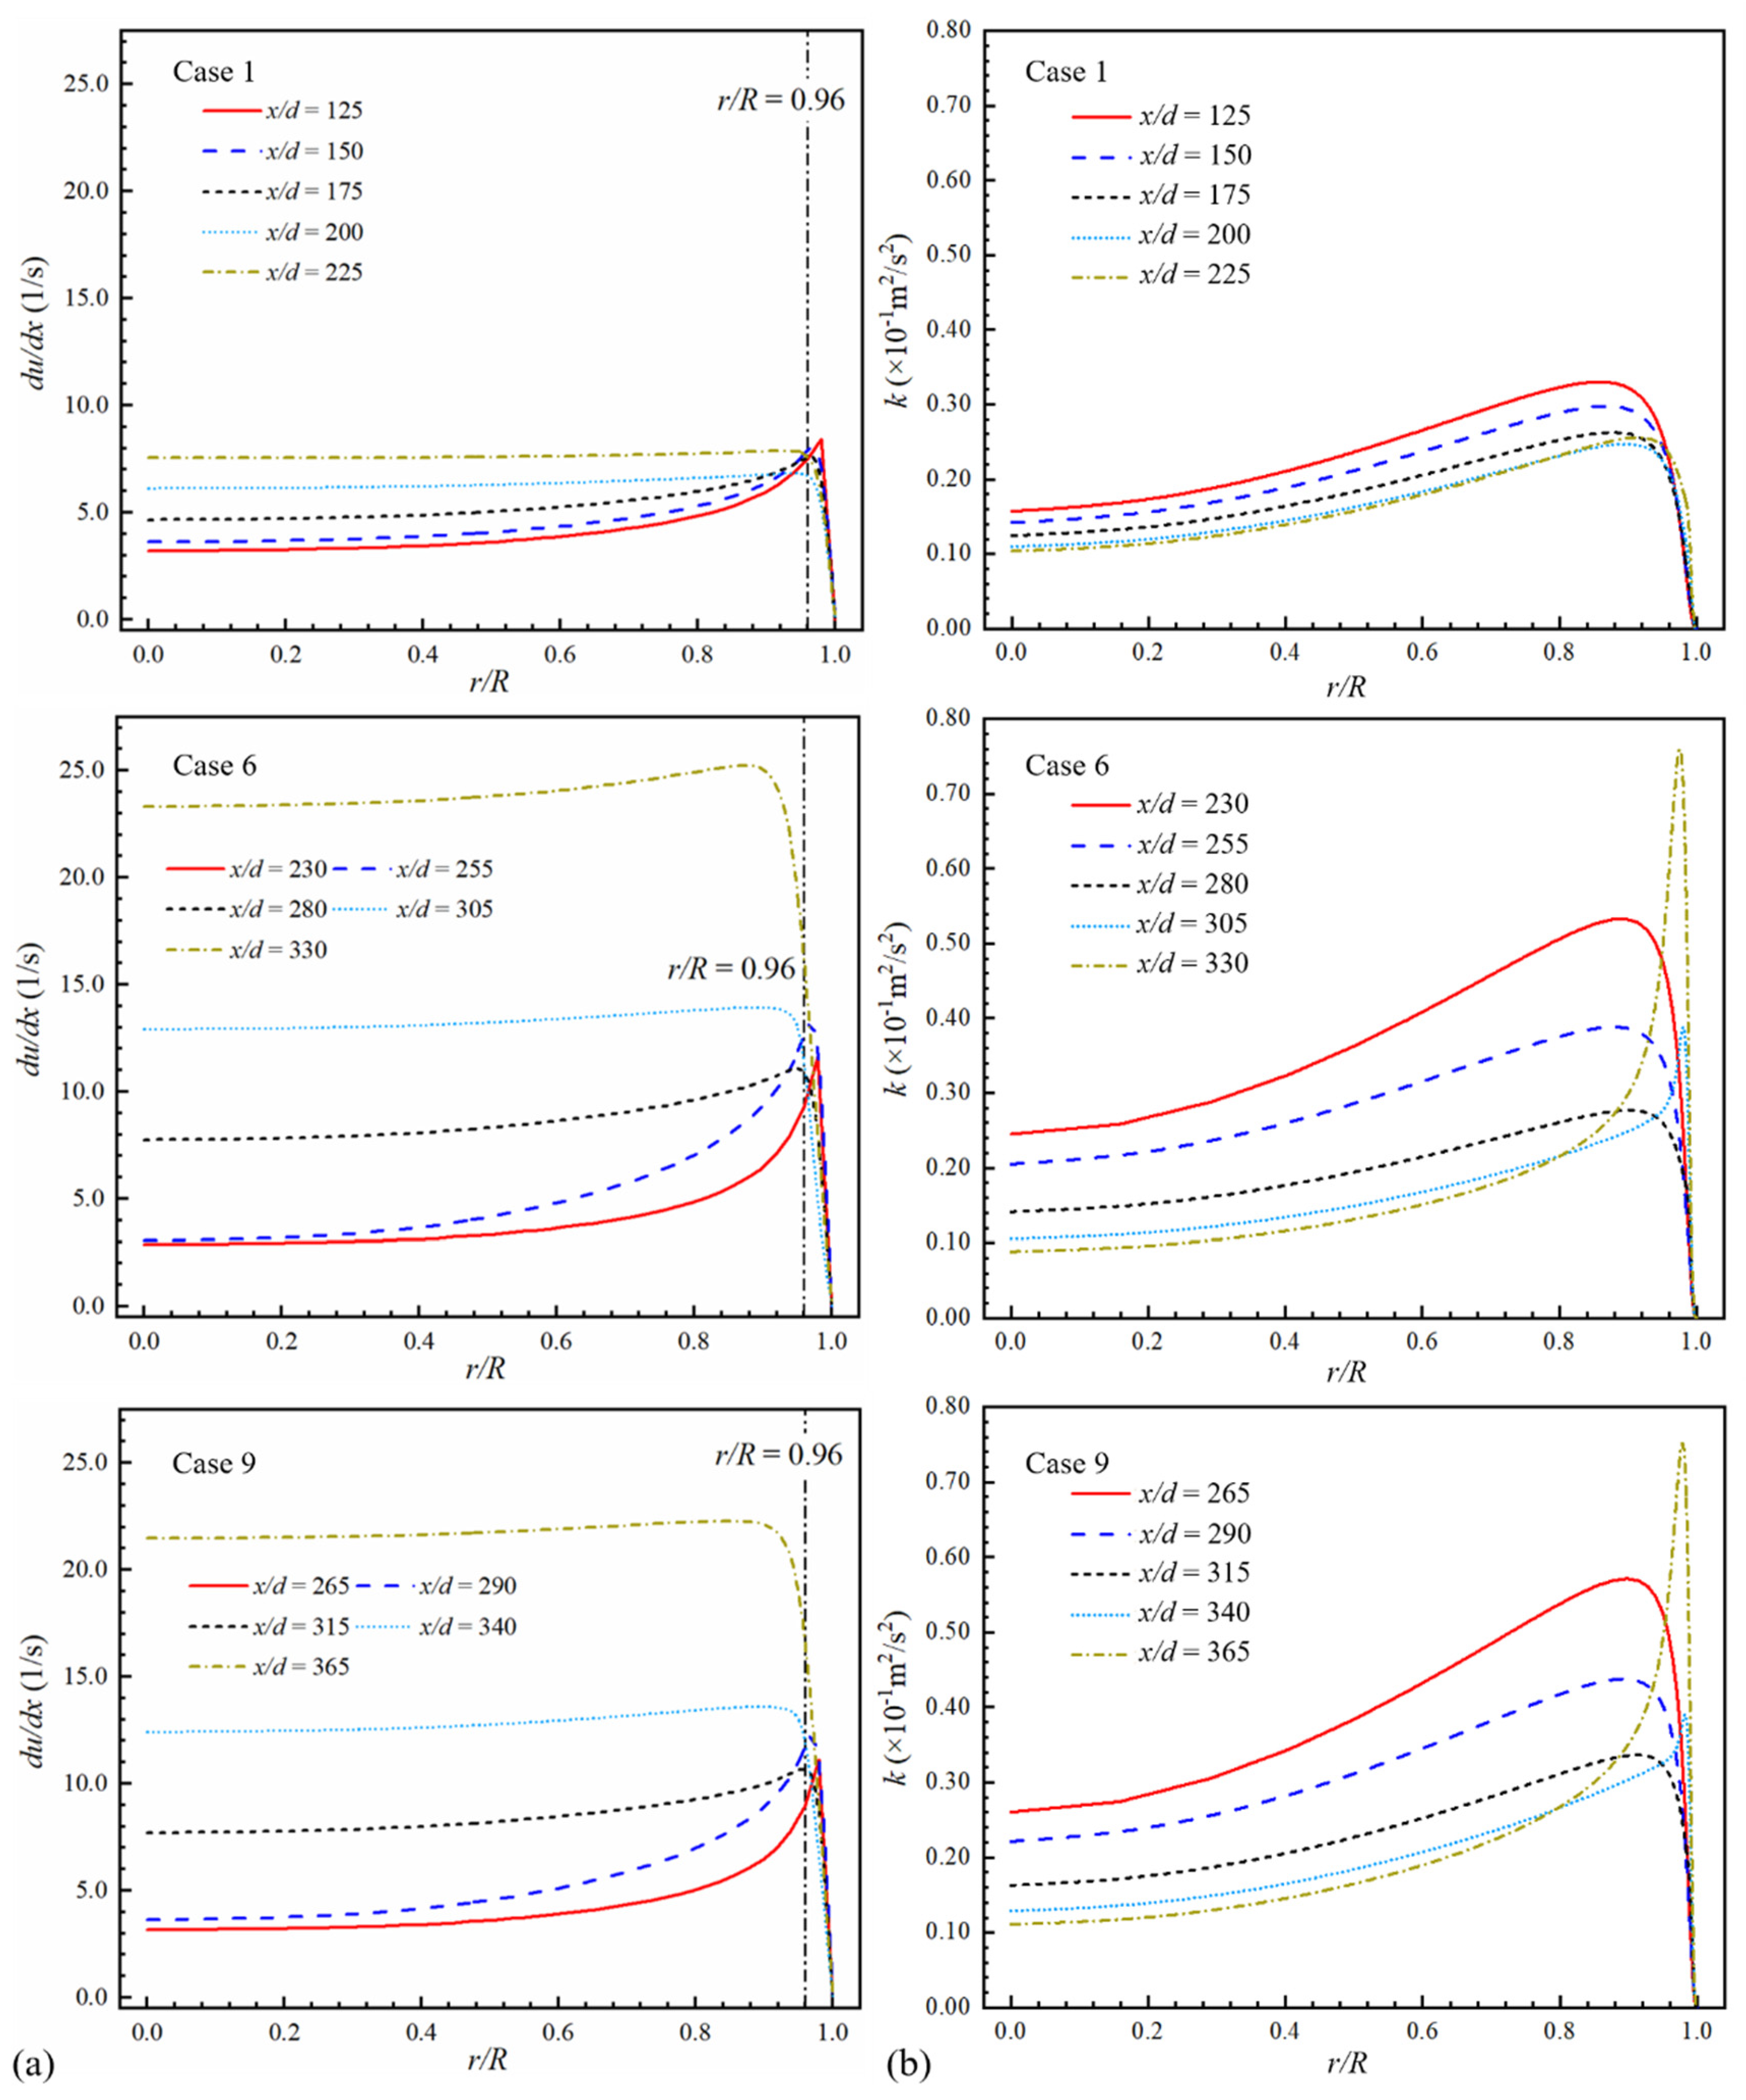
The first HTD, which tends to occur where Tw approaches Tpc, is mainly due to the flow acceleration in the near-wall region and local thickening of the viscous sublayer. When Tw > Tpc, the density variation rate of the near-wall thin layer fluid decreases rapidly, which weakens the axial acceleration capability and thickens the viscous sublayer. The fluid residence time in the boundary layer increases and the heat transfer from the heated wall to the core region is weakened.
(2)
The expansion of the low λ and cp region is the elementary inducement to the second HTD. The range of low-λ and -cp regions and turbulence intensity jointly determine the degree of the second HTD.
(3)
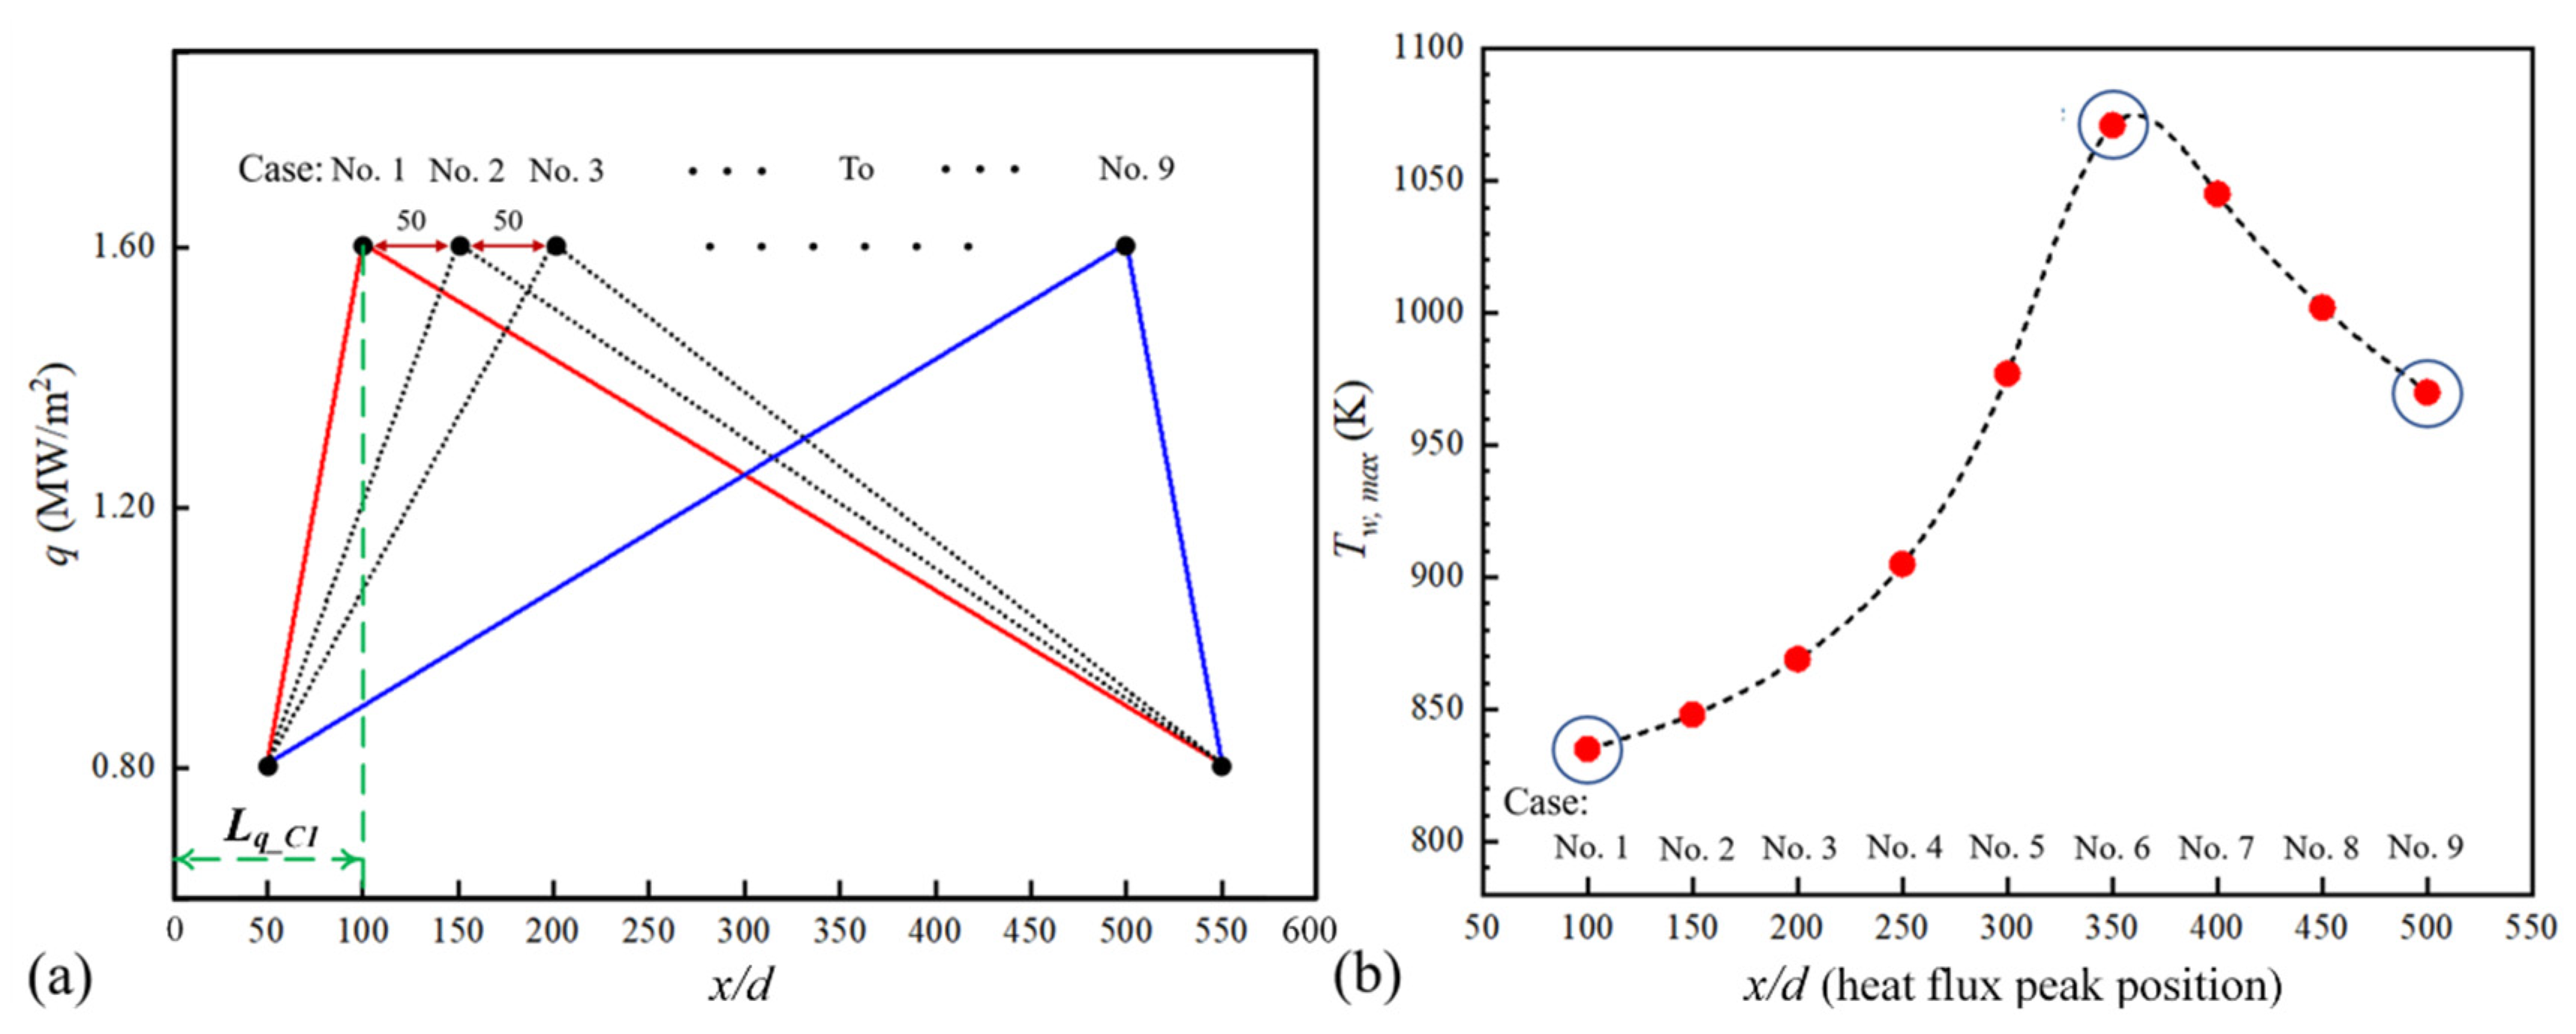
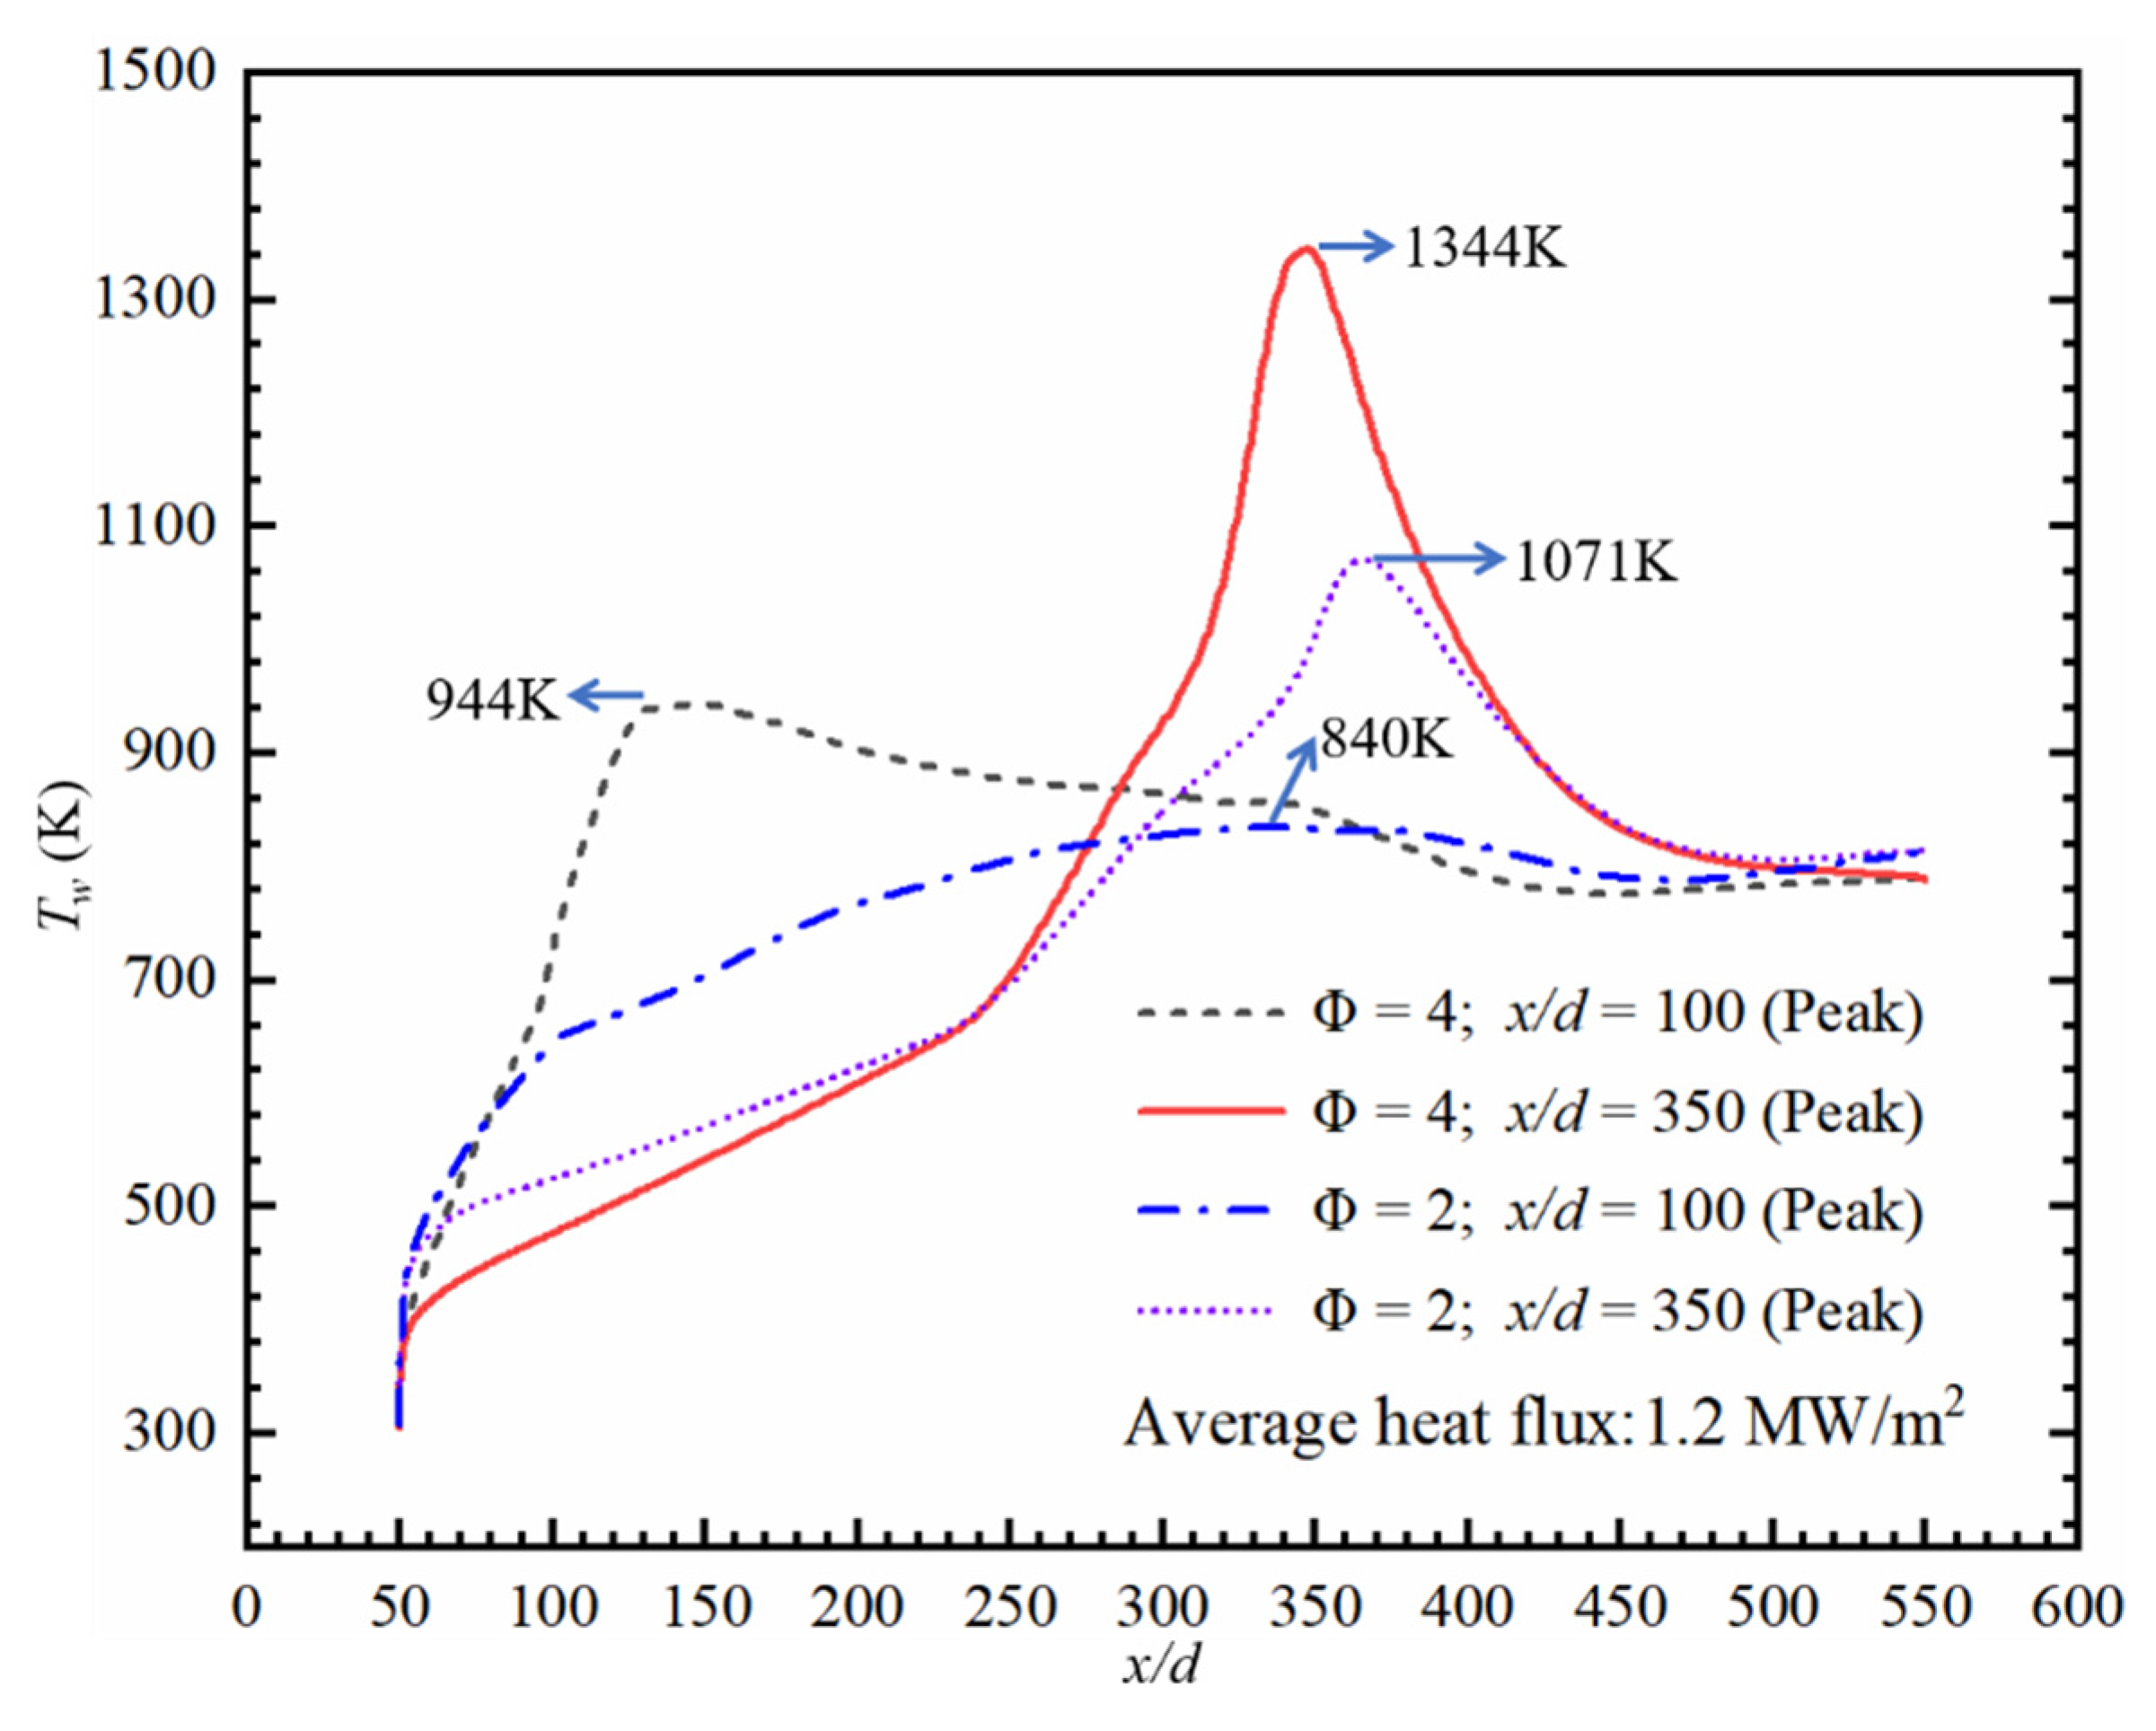
Axially nonuniform heat flux with a peak at the high-temperature zone worsens the HTD obviously. Especially the second HTD, the minimum HTC deteriorates by 40.80% and the Tw_max increases from 857 K to 1071 K by 27.5%. Both types of HTD alleviate when the heat flux peak locates at the lower-fuel-temperature zone Tw < Tpc. From the aspect of the cooling effect, when comparing Case No.6 (Φ = 2, Lq = 350 d) with Case No.10 (Φ = 4, Lq = 100 d), although Φ increases, Tw_max falls with the improvement in head flux peak location. The cooling effect can be improved through careful matching of the thermal boundary and fuel temperature distribution. The heat flux distributions do not have a significant effect on the pressure drop, the maximum increase of which is 12.52% compared to Case No.1.

Author Contributions

Conceptualization, Y.J.; methodology, Y.J.; software, J.Z.; validation, J.Z., Q.Z. and X.Z.; formal analysis, J.Z.; investigation, J.Z., Q.Z. and X.Z.; resources, Q.Z.; data curation, X.Z.; writing—original draft preparation, J.Z.; writing—review and editing, Y.J.; visualization, Q.Z.; supervision, W.F.; project administration, Y.J.; funding acquisition, Y.J. All authors have read and agreed to the published version of the manuscript.

Funding

This work is sponsored by the National Natural Science Foundation of China (No. 51906207), the Young Elite Scientists Sponsorship Program by CAST (2021QNRC001), the National Science and Technology Major Project (2017-III-0005-0030), and the Fundamental Research Funds for the Central Universities (No. 31020190QD703).

Institutional Review Board Statement

Not applicable.

Informed Consent Statement

Not applicable.

Data Availability Statement

Not applicable.

Conflicts of Interest

The authors declare that there is no conflict of interest.

Nomenclature

Bo*buoyancy parameter
Cpconstant-pressure heat capacity, J/(kg·K)
ddiameter of a cooling tube, mm
ettotal energy, J/kg
Gmass flow flux, kg/(s·m2)
ggravitational acceleration, 9.8 m/s2
Kvthermal acceleration number
hheat transfer coefficient, W/(m2·K)
kturbulent kinetic energy, m2/s2
Llength, mm
P(p)pressure, Pa
PrPrandtl number
qheat flux, W/m2
rradial coordinate, mm
Rradius of a cooling tube, mm
ReReynolds number
Ttemperature, K
Tbbulk temperature, K
u velocity vector, m/s
Vvelocity, m/s
xaxial coordinate, mm
yradial coordinate, mm
y+dimensionless wall distance
Greek symbol
λthermal conductivity, W/(m·K)
ρdensity, kg/m3
μviscosity, Pa·s
τviscous stress tensor, N/m2
ωspecific dissipation rate, 1/s
Φdegree of heat flux nonuniformity
Subscripts
bbulk
ccritical
ffuel
ininlet parameter
pcpseudo-critical
wwall

References

  1. Segal, C. The Scramjet Engine: Processes and Characteristics; Cambridge University Press: Cambridge, UK, 2009. [Google Scholar]
  2. Wang, Y.; Cheng, K.; Tang, J.; Liu, X.; Bao, W. Analysis of the maximum flight Mach number of hydrocarbon-fueled scramjet engines under the flight cruising constraint and the combustor cooling requirement. Aerosp. Sci. Technol. 2020, 98, 105594. [Google Scholar] [CrossRef]
  3. Gou, J.-J.; Yan, Z.-W.; Hu, J.-X.; Gao, G.; Gong, C.-L. The heat dissipation, transport and reuse management for hypersonic vehicles based on regenerative cooling and thermoelectric conversion. Aerosp. Sci. Technol. 2021, 108, 106373. [Google Scholar] [CrossRef]
  4. Sun, X.; Meng, H.; Zheng, Y. Asymmetric heating and buoyancy effects on heat transfer of hydrocarbon fuel in a horizontal square channel at supercritical pressures. Aerosp. Sci. Technol. 2019, 93, 105358. [Google Scholar] [CrossRef]
  5. Qin, J.; Zhang, S.; Bao, W.; Zhou, W.; Yu, D. Thermal management method of fuel in advanced aeroengines. Energy 2013, 49, 459–468. [Google Scholar] [CrossRef]
  6. Jiang, Y.; Qin, J.; Xu, Y.; Zhang, S.; Chetehouna, K.; Gascoin, N.; Bao, W. The influences of the header geometry on hydrocarbon fuel flow distribution in compact parallel channels. Aerosp. Sci. Technol. 2018, 79, 318–327. [Google Scholar] [CrossRef]
  7. Liu, Z.; Bi, Q.; Guo, Y.; Yan, J.; Yang, Z. Convective heat transfer and pressure drop characteristics of near-critical-pressure hydrocarbon fuel in a minichannel. Appl. Therm. Eng. 2013, 51, 1047–1054. [Google Scholar] [CrossRef]
  8. Sobel, D.R.; Spadaccini, L.J. Hydrocarbon fuel cooling technologies for advanced propulsion. J. Eng. Gas Turbines Power-Trans. Asme 1997, 119, 344–351. [Google Scholar] [CrossRef]
  9. Qin, J.; Zhang, S.; Bao, W.; Jia, Z.; Yu, B.; Zhou, W. Experimental study on the performance of recooling cycle of hydrocarbon fueled scramjet engine. Fuel 2013, 108, 334–340. [Google Scholar] [CrossRef]
  10. Lei, X.; Li, H.; Zhang, W.; Dinh, N.T.; Guo, Y.; Yu, S. Experimental study on the difference of heat transfer characteristics between vertical and horizontal flows of supercritical pressure water. Appl. Therm. Eng. 2017, 113, 609–620. [Google Scholar] [CrossRef] [Green Version]
  11. Yamagata, K.; Nishikawa, K.; Hasegawa, S.; Fujii, T.; Yoshida, S. Forced convective heat transfer to supercritical water flowing in tubes. Int. J. Heat Mass Transf. 1972, 15, 2575–2593. [Google Scholar] [CrossRef]
  12. Schatte, G.A.; Kohlhepp, A.; Wieland, C.; Spliethoff, H. Development of a new empirical correlation for the prediction of the onset of the deterioration of heat transfer to supercritical water in vertical tubes. Int. J. Heat Mass Transf. 2016, 102, 133–141. [Google Scholar] [CrossRef]
  13. Koshizuka, S.; Takano, N.; Oka, Y. Numerical analysis of deterioration phenomena in heat transfer to supercritical water. Int. J. Heat Mass Transf. 1995, 38, 3077–3084. [Google Scholar] [CrossRef]
  14. Lei, X.; Zhang, J.; Gou, L.; Zhang, Q.; Li, H. Experimental study on convection heat transfer of supercritical CO2 in small upward channels. Energy 2019, 176, 119–130. [Google Scholar] [CrossRef]
  15. Bovard, S.; Abdi, M.; Khosravi-Nikou, M.; Daryasafar, A. Numerical investigation of heat transfer in supercritical CO2 and water turbulent flow in circular tubes. J. Supercrit. Fluids 2017, 119, 88–103. [Google Scholar] [CrossRef]
  16. Jiang, P.-X.; Zhang, Y.; Xu, Y.-J.; Shi, R.-F. Experimental and numerical investigation of convection heat transfer of CO2 at supercritical pressures in a vertical tube at low Reynolds numbers. Int. J. Therm. Sci. 2008, 47, 998–1011. [Google Scholar] [CrossRef]
  17. Jiang, P.-X.; Liu, B.; Zhao, C.-R.; Luo, F. Convection heat transfer of supercritical pressure carbon dioxide in a vertical micro tube from transition to turbulent flow regime. Int. J. Heat Mass Transf. 2013, 56, 741–749. [Google Scholar] [CrossRef]
  18. Jiang, P.-X.; Xu, Y.-J.; Lv, J.; Shi, R.-F.; He, S.; Jackson, J. Experimental investigation of convection heat transfer of CO2 at super-critical pressures in vertical mini-tubes and in porous media. Appl. Therm. Eng. 2004, 24, 1255–1270. [Google Scholar] [CrossRef]
  19. Jiang, P.-X.; Zhang, Y.; Zhao, C.-R.; Shi, R.-F. Convection heat transfer of CO2 at supercritical pressures in a vertical mini tube at relatively low reynolds numbers. Exp. Therm. Fluid Sci. 2008, 32, 1628–1637. [Google Scholar] [CrossRef]
  20. Hobold, G.M.; da Silva, A.K. Thermal behavior of supercritical fluids near the critical point. Numer. Heat Transf. Part A-Appl. 2016, 69, 545–557. [Google Scholar] [CrossRef]
  21. Kiran, E.; Brunner, G.; Smith, R.L.; Cocero, M.J.A.; Welch, A. Preface The 30th Year Special issue of the Journal of Supercritical Fluids- Perspectives and Opinions on Current State and Future Directions. J. Supercrit. Fluids 2018, 134, 21–27. [Google Scholar] [CrossRef]
  22. Li, Z.-H.; Jiang, P.-X.; Zhao, C.-R.; Zhang, Y. Experimental investigation of convection heat transfer of CO2 at supercritical pressures in a vertical circular tube. Exp. Therm. Fluid Sci. 2010, 34, 1162–1171. [Google Scholar] [CrossRef]
  23. Huang, D.; Li, W. Heat transfer deterioration of aviation kerosene flowing in mini tubes at supercritical pressures. Int. J. Heat Mass Transf. 2017, 111, 266–278. [Google Scholar] [CrossRef] [Green Version]
  24. Wang, Y.; Li, S.; Dong, M. Numerical Study on Heat Transfer Deterioration of Supercritical n-Decane in Horizontal Circular Tubes. Energies 2014, 7, 7535–7554. [Google Scholar] [CrossRef] [Green Version]
  25. Sun, F.; Li, Y.; Manca, O.; Xie, G. An evaluation on the laminar effect of buoyancy-driven supercritical hydrocarbon fuel flow and heat transfer characteristics. Int. J. Heat Mass Transf. 2019, 142, 118414. [Google Scholar] [CrossRef]
  26. Jackson, J.; Cotton, M.; Axcell, B. Studies of mixed convection in vertical tubes. Int. J. Heat Fluid Flow 1989, 10, 2–15. [Google Scholar] [CrossRef]
  27. Jackson, J. Fluid flow and convective heat transfer to fluids at supercritical pressure. Nucl. Eng. Des. 2013, 264, 24–40. [Google Scholar] [CrossRef]
  28. Huang, D.; Wu, Z.; Sunden, B.; Li, W. A brief review on convection heat transfer of fluids at supercritical pressures in tubes and the recent progress. Appl. Energy 2016, 162, 494–505. [Google Scholar] [CrossRef]
  29. Kim, D.E.; Kim, M.-H. Experimental investigation of heat transfer in vertical upward and downward supercritical CO2 flow in a circular tube. Int. J. Heat Fluid Flow 2011, 32, 176–191. [Google Scholar] [CrossRef]
  30. Zhang, C.; Xu, G.; Gao, L.; Tao, Z.; Deng, H.; Zhu, K. Experimental investigation on heat transfer of a specific fuel (RP-3) flows through downward tubes at supercritical pressure. J. Supercrit. Fluids 2012, 72, 90–99. [Google Scholar] [CrossRef]
  31. Fu, Y.; Huang, H.; Wen, J.; Xu, G.; Zhao, W. Experimental investigation on convective heat transfer of supercritical RP-3 in vertical miniature tubes with various diameters. Int. J. Heat Mass Transf. 2017, 112, 814–824. [Google Scholar] [CrossRef]
  32. Liu, B.; Zhu, Y.; Yan, J.-J.; Lei, Y.; Zhang, B.; Jiang, P.-X. Experimental investigation of convection heat transfer of n-decane at supercritical pressures in small vertical tubes. Int. J. Heat Mass Transf. 2015, 91, 734–746. [Google Scholar] [CrossRef]
  33. Dang, G.; Zhong, F.; Zhang, Y.; Zhang, X. Numerical study of heat transfer deterioration of turbulent supercritical kerosene flow in heated circular tube. Int. J. Heat Mass Transf. 2015, 85, 1003–1011. [Google Scholar] [CrossRef] [Green Version]
  34. Sun, F.; Li, Y.; Manca, O.; Xie, G. On assessment of heat transfer deterioration of a channel with supercritical n-decane for scramjet engines cooling. Int. J. Heat Mass Transf. 2019, 135, 782–795. [Google Scholar] [CrossRef]
  35. Sun, F.; Li, Y.; Sunden, B.; Xie, G. The Behavior of Turbulent Heat Transfer Deterioration in Supercritical Hydrocarbon Fuel Flow Considering Thermal Resistance Distribution. Int. J. Therm. Sci. 2019, 141, 19–32. [Google Scholar] [CrossRef]
  36. Pu, H.; Li, S.; Dong, M.; Jiao, S.; Wang, Y.; Shang, Y. Convective heat transfer and flow resistance characteristics of supercritical pressure hydrocarbon fuel in a horizontal rectangular mini-channel. Exp. Therm. Fluid Sci. 2019, 108, 39–53. [Google Scholar] [CrossRef]
  37. Kurganov, V.; Kaptil’Ny, A. Velocity and enthalpy fields and eddy diffusivities in a heated supercritical fluid flow. Exp. Therm. Fluid Sci. 1992, 5, 465–478. [Google Scholar] [CrossRef]
  38. Duffey, R.B.; Pioro, I.L. Experimental heat transfer of supercritical carbon dioxide flowing inside channels (survey). Nucl. Eng. Des. 2005, 235, 913–924. [Google Scholar] [CrossRef]
  39. Polyakov, A. Heat transfer under supercritical pressures. Adv. Heat Transf. 1991, 21, 1–53. [Google Scholar]
  40. Lee, S.H.; Howell, J.R. Turbulent developing convective heat transfer in a tube for fluids near the critical point. Int. J. Heat Mass Transf. 1998, 41, 1205–1218. [Google Scholar] [CrossRef]
  41. Zhang, G.; Zhang, H.; Gu, H.; Yang, Y.; Cheng, X. Experimental and numerical investigation of turbulent convective heat transfer deterioration of supercritical water in vertical tube. Nucl. Eng. Des. 2012, 248, 226–237. [Google Scholar] [CrossRef]
  42. Yang, Z.; Bi, Q.; Liu, Z.; Guo, Y.; Yan, J. Heat transfer to supercritical pressure hydrocarbons flowing in a horizontal short tube. Exp. Therm. Fluid Sci. 2015, 61, 144–152. [Google Scholar] [CrossRef]
  43. Xu, K.; Sun, X.; Meng, H. Conjugate heat transfer, endothermic fuel pyrolysis and surface coking of aviation kerosene in ribbed tube at supercritical pressure. Int. J. Therm. Sci. 2018, 132, 209–218. [Google Scholar] [CrossRef]
  44. Feng, Y.; Qin, J.; Zhang, S.; Bao, W.; Cao, Y.; Huang, H. Modeling and analysis of heat and mass transfers of supercritical hydrocarbon fuel with pyrolysis in mini-channel. Int. J. Heat Mass Transf. 2015, 91, 520–531. [Google Scholar] [CrossRef]
  45. Ruan, B.; Meng, H.; Yang, V. Simplification of pyrolytic reaction mechanism and turbulent heat transfer of n-Decane at supercritical pressures. Int. J. Heat Mass Transf. 2014, 69, 455–463. [Google Scholar] [CrossRef]
  46. Urbano, A.; Nasuti, F. Conditions for the occurrence of heat transfer deterioration in light hydrocarbons flows. Int. J. Heat Mass Transf. 2013, 65, 599–609. [Google Scholar] [CrossRef]
  47. Urbano, A.; Nasuti, F. Onset of Heat Transfer Deterioration in Supercritical Methane Flow Channels. J. Thermophys. Heat Transf. 2013, 27, 298–308. [Google Scholar] [CrossRef]
  48. Wang, Y.-Z.; Hua, Y.-X.; Meng, H. Numerical Studies of Supercritical Turbulent Convective Heat Transfer of Cryogenic-Propellant Methane. J. Thermophys. Heat Transf. 2010, 24, 490–500. [Google Scholar] [CrossRef]
  49. Hua, Y.-X.; Wang, Y.-Z.; Meng, H. A numerical study of supercritical forced convective heat transfer of n-heptane inside a horizontal miniature tube. J. Supercrit. Fluids 2010, 52, 36–46. [Google Scholar] [CrossRef]
  50. Liang, J.; Liu, Z.; Pan, Y. Flight Acceleration Effect on Heat Transfer Deterioration of Actively Cooled Scramjet Engines. J. Thermophys. Heat Transf. 2016, 30, 279–287. [Google Scholar] [CrossRef]
  51. Lv, L.; Wen, J.; Fu, Y.; Quan, Y.; Zhu, J.; Xu, G. Numerical investigation on convective heat transfer of supercritical aviation kerosene in a horizontal tube under hyper gravity conditions. Aerosp. Sci. Technol. 2020, 105, 105962. [Google Scholar] [CrossRef]
  52. Chen, Y.; Li, Y.; Liu, D.; Sunden, B.; Xie, G. Influences of accelerating states on supercritical n-decane heat transfer in a horizontal tube applied for scramjet engine cooling. Aerosp. Sci. Technol. 2021, 109, 106424. [Google Scholar] [CrossRef]
  53. Xu, K.; Tang, L.; Meng, H. Numerical study of supercritical-pressure fluid flows and heat transfer of methane in ribbed cooling tubes. Int. J. Heat Mass Transf. 2015, 84, 346–358. [Google Scholar] [CrossRef]
  54. Sunden, B.A.; Wu, Z.; Huang, D. Comparison of heat transfer characteristics of aviation kerosene flowing in smooth and enhanced mini tubes at supercritical pressures. Int. J. Numer. Methods Heat Fluid Flow 2016, 26, 1289–1308. [Google Scholar] [CrossRef]
  55. Zhang, C.; Yao, Z.; Qin, J.; Bao, W. Experimental study on measurement and calculation of heat flux in supersonic combustor of scramjet. J. Therm. Sci. 2015, 24, 254–259. [Google Scholar] [CrossRef]
  56. Jiang, Y.; Qin, J.; Chetehouna, K.; Gascoin, N.; Bao, W. Effect of geometry parameters on the hydrocarbon fuel flow rate distribution in pyrolysis zone of SCRamjet cooling channels. Int. J. Heat Mass Transf. 2019, 141, 1114–1130. [Google Scholar] [CrossRef]
  57. Jiang, Y.; Qin, J.; Xu, Y.; Yu, W.; Zhang, S.; Chetehouna, K.; Gascoin, N.; Bao, W. The influences of variable sectional area design on improving the hydrocarbon fuel flow distribution in parallel channels under supercritical pressure. Fuel 2018, 233, 442–453. [Google Scholar] [CrossRef]
  58. Jiang, Y.; Qin, J.; Chetehouna, K.; Gascoin, N.; Bao, W. Parametric study on the hydrocarbon fuel flow rate distribution and cooling effect in non-uniformly heated parallel cooling channels. Int. J. Heat Mass Transf. 2018, 126, 267–276. [Google Scholar] [CrossRef]
  59. ANSYS Fluent Theory Guide Release 19.0; ANSYS Inc.: Canonsburg, PA, USA, 2018.
  60. Bao, W.; Zhang, S.; Qin, J.; Zhou, W.; Xie, K. Numerical analysis of flowing cracked hydrocarbon fuel inside cooling channels in view of thermal management. Energy 2014, 67, 149–161. [Google Scholar] [CrossRef]
  61. NIST Standard Reference Database Number 69; National Institute of Standards and Technology: Gaithersburg, MD, USA, 2022.
  62. Liao, S.M.; Zhao, T. Measurements of Heat Transfer Coefficients From Supercritical Carbon Dioxide Flowing in Horizontal Mini/Micro Channels. J. Heat Transf. 2002, 124, 413–420. [Google Scholar] [CrossRef]
  63. Ackerman, J.W. Pseudoboiling heat transfer to supercritical pressure water in smooth and ribbed tubes. Trans. ASME J. Heat Transf. 1970, 92, 490–498. [Google Scholar] [CrossRef]
  64. Zhu, Y.; Liu, B.; Jiang, P. Experimental and Numerical Investigations on n-Decane Thermal Cracking at Supercritical Pressures in a Vertical Tube. Energy Fuels 2014, 28, 466–474. [Google Scholar] [CrossRef]
Figure 1. Thermo-physical properties of n-decane at a pressure of 3 MPa from NIST database (Pc, critical pressure; Tc, critical temperature).
Aerospace 09 00326 g001
Figure 2. Schematic diagram of regenerative cooling (A) and the cooling channel mesh (B) in SCRamjet.
Aerospace 09 00326 g002
Figure 3. Validation of turbulent models by comparison with published experimental data: (a) wall temperature for water; (b) wall/bulk temperature for n-decane.
Aerospace 09 00326 g003
Figure 4. Comparison of wall temperature calculated by four grid systems: (a) axial wall temperature distributions; (b) maximum wall temperature.
Aerospace 09 00326 g004
Figure 5. Variations in the wall temperature and HTC along the flow direction.
Aerospace 09 00326 g005
Figure 6. Radial distributions of fluid properties in first HTD zone: (a) density; (b) viscosity; (c) thermal conductivity; (d) specific heat; (e) fluid temperature.
Aerospace 09 00326 g006
Figure 7. Comparison of temperature gradient along the flow direction.
Aerospace 09 00326 g007
Figure 8. Flow parameters of n-decane along the flow direction: (a) radial distributions of turbulent kinetic energy; (b) radial distributions of axial velocity gradient.
Aerospace 09 00326 g008
Figure 9. Near-wall flow field: (a) velocity distribution near heated wall; (b) density distribution near to heated wall; (c) distribution of y+.
Aerospace 09 00326 g009
Figure 10. Bulk flow parameters along the flow direction.
Aerospace 09 00326 g010
Figure 11. Radial distributions of thermal conductivity in the second HTD zone.
Aerospace 09 00326 g011
Figure 12. Radial distributions of specific heat capacity in the second HTD zone.
Aerospace 09 00326 g012
Figure 13. Radial distributions of turbulent kinetic energy (a) and thermal diffusion coefficient (b) in the second HTD zone.
Aerospace 09 00326 g013
Figure 14. Axially nonuniform heat flux distributions (a) and heat flux peak positions (b) in different cases.
Aerospace 09 00326 g014
Figure 15. Variations in HTC and temperatures along the flow direction in different cases: (a) Case 1; (b) Case 6; (c) Case 9; (d) comparison of HTC in three cases.
Aerospace 09 00326 g015
Figure 16. Flow parameters of n-decane along the flow direction: (a) radial distributions of axial velocity gradient; (b) radial distributions of turbulent kinetic energy.
Aerospace 09 00326 g016
Figure 17. y+ in near-wall region (r/R = 0.98 to 1): (a) Case 1; (b) Case 6; (c) Case 9.
Aerospace 09 00326 g017
Figure 18. Comparison of flow and thermal characteristic at the initial position of the second HTD in three cases: (a) thermal diffusion coefficient; (b) turbulent kinetic energy; (c) bulk fluid temperature; (d) temperature profile.
Aerospace 09 00326 g018
Figure 19. Wall temperature distributions under different nonuniform heat flux boundaries.
Aerospace 09 00326 g019
Table 1. Details of conditions chosen from the corresponding experimental research.
ReferencesFluiddin
(mm)
dout
(mm)
Lh
(mm)
Tin
(K)
Mass Flow (g/s)Thermal BoundaryP (MPa)
Ackerman [63]water24.3827.661828.8583.00189.90284.00 kW/m2 
Nominal heat flux
24.80
Zhu et al. [64]n-Decane2.003.00940625.930.6083648.89 W
Volume heat source in wall
4.19
Table 2. Detailed information of the mesh generation for independence analysis.
Case ACase BCase CCase D
Thickness of 1st layer (mm)10−610−610−610−6
Radius growth factor1.051.051.051.05
y+<1<1<1<1
Axial No. × Radius No.
(Heated section)
483 × 33695 × 471000 × 671440 × 96
Total elements16,282 (coarsest)33,21267,928139,579 (finest)
Table 3. Pressure drops of the heated section in different cases.
Case NoNo.1No.2No.3No.4No.5No.6No.7No.8No.9No.10No.11
Pressure drop (kPa)67.4767.6168.0068.3068.4068.0567.0465.5263.7175.9271.11
Publisher’s Note: MDPI stays neutral with regard to jurisdictional claims in published maps and institutional affiliations.

