
The PAPI Lights-Based Vision System for Aircraft Automatic Control during Approach and Landing

Avionics and Control Department, Faculty of Mechanical Engineering and Aeronautics, Rzeszow University of Technology, Aleja Powstancow Warszawy 12, 35-959 Rzeszow, Poland
*
Author to whom correspondence should be addressed.
Aerospace 2022, 9(6), 285; https://doi.org/10.3390/aerospace9060285
Submission received: 19 April 2022
/
Revised: 19 May 2022
/
Accepted: 21 May 2022
/
Published: 25 May 2022
(This article belongs to the Special Issue Flight Data)
Abstract
:The paper presents the concept of a component of an aircraft’s automatic flight control system, controlling the airplane when in longitudinal motion (i.e., pitch angle, sink rate, airspeed channels) during automatic landing, from a final approach until a touchdown. It is composed of two key parts: a vision system and an automatic landing system. The first part exploits dedicated image-processing algorithms to identify the number of red and white PAPI lights appearing on an onboard video camera. Its output data—information about an aircraft’s position on a vertical profile of a landing trajectory—is used as one of the crucial inputs to the automatic landing system (the second part), which uses them to control the landing. The control algorithms implemented by the automatic landing system are based on the fuzzy logic expert system and were developed to imitate the pilot’s control actions during landing an aircraft. These two parts were teamed together as a component of a laboratory rig, first as pure software algorithms only, then as real hardware modules with downloaded algorithms. In two test campaigns (software in the loop and hardware in the loop) they controlled an aircraft model in a simulation environment. Selected results, presenting both control efficiency and flight precision, are given in the final section of the paper.
1. Introduction
Nowadays, systems using various types of unmanned aerial vehicles (UAV) are increasingly important in several military and civilian applications. Due to the permanently rising number of types of flying platforms (e.g., fixed-wing airplane, multirotor, helicopter), the greater availability of complete remotely piloted aircraft systems (RPAS), and new types of realized missions, the full automation of all flight processes (i.e., from the initial taxi to the full stop of the aircraft after its flight is completed) has become more and more important.
The most critical phase in all aircraft missions is the landing. It determines the type and quality of the functions implemented in an automatic flight control system that is capable of executing it. Moreover, both the class of aircraft and the airport infrastructure impact the configuration of the onboard instruments necessary for an efficient and safe automatic landing maneuver [1].
When analyzing the structures and operations of autopilots capable of automatic landing, the control algorithms supporting this flight phase can, in general, be considered on two levels [1,2]. The first is low-level functions, responsible for the stabilization of aircraft attitude and the airspeed. The second, master, level contains functions that guide the aircraft along the desired flight trajectory. These normally use low-level functions as a necessary tool to accomplish the main task of automatic landing.
Currently, an automatic landing is generally supported by additional aerodrome infrastructures. For manned aircraft as well as UAVs, including MALE- (medium-altitude, long-endurance) and HALE (high-altitude, long-endurance)-class aircraft, such an infrastructure is mainly based on an instrumental landing system (ILS), or begins by using a ground-based augmentation system (GBAS) [3], along with less popular systems. However, the automatic landing of micro- or mini-class aircraft, or emergency landings, can sometimes be performed with a relatively primitive, basic infrastructure, or even without any extra infrastructure at all. From this perspective, it seems reasonable to work on onboard systems that are able to conduct automatic landings of aircraft by themselves or at least with reduced ground facilities.
Aside from data regarding the aircraft state and flight parameters, an automatic landing requires proper and accurate information about the position of the aircraft in relation to the theoretical touchdown point, as well as to the desired landing trajectory [4]. These data are usually provided by landing-assist systems (e.g., the instrumental landing system, microwave landing system, and global navigation satellite system). Nevertheless, the latest technological advancements also allow us to utilize other, alternate signals coming from systems that typically assist the pilots of manned aircraft [5,6,7,8]. One such alternative could be visual signals, for example. Of course, it is clear that to extract and retrieve information given by visual signals, dedicated image-processing technology must be employed [9]. It should be mentioned here that image processing has already been applied in the identification of some aircraft flight parameters, including the aircraft’s spatial attitude [10]. One of the existing systems that are potentially ready to be used in the determination of the correct path angle is the precision approach path indicator, the so-called PAPI light system (Figure 1). The information obtained from the PAPI is in discrete form but, in combination with other signals, it is sufficiently accurate for pilots to accomplish the landing process in an appropriate way.
This paper presents a concept for the aircraft flight control system that uses the functions of the conventional autopilot, in combination with indications from the PAPI light image analysis and fuzzy logic-based control algorithms, to control aircraft in the longitudinal mode of motion. Fuzzy logic algorithms resemble the behavior of a pilot-operator whose role is to maintain the correct final approach path and perform the flare phase, leading the aircraft down to the runway.
This paper is both a continuation and an extension of the authors’ previous research on the potential utilization of image processing for acquiring the data needed by a flight control system to control an aircraft. A theoretical background is given in a previous work [11]; our earlier paper [12] presents real research on how to use dedicated ground signs to guide a small mini-class aircraft during a landing at a grass airfield.
2. The PAPI Light System
The PAPI navigation light system is used for the precise visual determination of the glide path of landing aircraft. It is usually located on the left side of the runway, approximately 300 m from the landing threshold of the runway (Figure 1) [10]. The PAPI system is a light array, normally composed of four equidistant, color-coded (white and red) light units. It provides a visual indication of an aircraft’s position relative to the desired glide path. If the pilot can see two white and two red lights, the aircraft is following the desired glide path, which is usually a 3-degree flight-path angle. If the white light dominates, the aircraft is too high. With the red light dominating, the aircraft is too low, as is shown in Figure 1a.
During landing, the pilot observes the aerodrome, runway, and PAPI lights, as well as the indications of critical onboard instruments (i.e., the airspeed indicator), and builds a mental picture of the situation, covering the aircraft state, the maintained glide path angle, and the potential touchdown point. Such a set of flight information is sufficient to accomplish the landing correctly and safely.
3. The Aircraft and the Flight Control System Used in Tests
The control algorithms presented in the paper are developed for unmanned airplanes of the MALE class. To enable future in-flight testing of the presented solution, a light, manned, propeller-driven experimental aircraft was selected as the control plant (Figure 2). The aircraft is also used as an OPV (optionally piloted vehicle). It is equipped with an experimental automatic flight control system, which was developed as a dedicated autopilot for that airplane [13]. It uses the typical pitch angle and pitch-rate feedback, supported by accelerations to stabilize the desired pitch angle and only forward the engine control signal. The autopilot can cooperate with the tested master systems and stabilize the desired attitude (pitch, roll angles) or forward the control signals from the master system to the actuators [14,15]. Moreover, it records a number of flight parameters.
The parameters of this aircraft, such as its mass, dimensions, and operational speed regimes during landing, as well as its overall dynamics, are comparable to those of a MALE-class unmanned aircraft. Thus, it can be assumed that the results of both the calculations and analyses are reliable and applicable to other MALE-class aircraft. Therefore, the aircraft described above was used in the research for measurement flights, which were performed to obtain the information used for the synthesis of the control rules and to obtain movies for the use of the image-processing algorithms. Models of its dynamics were also used in the control algorithm synthesis process and in the final real-time simulations.
The approach applied in flight research is not very sensitive to the selection of a specific type of aircraft. This is not a critical issue for the structure of developed algorithms. However, some features and flight parameters of the selected aircraft determine the numerical values of the coefficients and parameters existing in the control algorithms.
The structure of the flight control system that cooperates with the components presented in this paper is shown in Figure 3 [12,15,16]. It contains an autopilot, a traditional measurement system, and two extra modules:
- The vision system (VS)—provides information on the aircraft’s vertical position relative to the desired glide path, as defined by the PAPI light system; this information is the result of the PAPI light image-processing (the image is acquired by the onboard video camera).
- The automatic landing system (ALS)—controls the flight with the use of control algorithms, based on fuzzy logic and expert knowledge. Moreover, it either uses the traditional autopilot’s attitude and speed stabilization functions or utilizes the autopilot as an interface for direct actuator control (Figure 3).
The ALS is a master control module stimulating the traditional autopilot. It is responsible for the whole landing process (i.e., from the moment the aircraft reaches the final approach path to the moment when it touches the runway). ALS produces the desired values in two control channels: pitch angle and airspeed. The output of the first value is the desired pitch angle θd, which needs to be stabilized by the autopilot. In the airspeed channel, because of the specific features of airspeed control, the second control signal is the throttle control δT.
The control algorithms implemented in the ALS rely on two sets of aircraft flight parameters: those provided by the standard sensors and those coming from the vision system.
4. Determination of Vertical Deviation
Deviation from the desired trajectory is estimated analogically, using human-performed estimations, during the realization of the approach. Pilots observe the position of the threshold and the runway centerline in relation to the airplane. With this input, they are able to estimate their deviation from the desired course, current height, glide path angle, and the distance of the aircraft from the theoretical touchdown point; the installed runway lights (including the PAPI system) assist them in this activity [11,17,18,19].
In the case of the automatically executed landing phase, the vision system detects and interprets the state of the PAPI lights. The system provides information about the number of red lights, which is the basis for determining whether the airplane is following the glide path correctly, or if the path is above or below it. The obtained glide path deviation is discrete; however, it is sufficient for the proper execution of the approach.
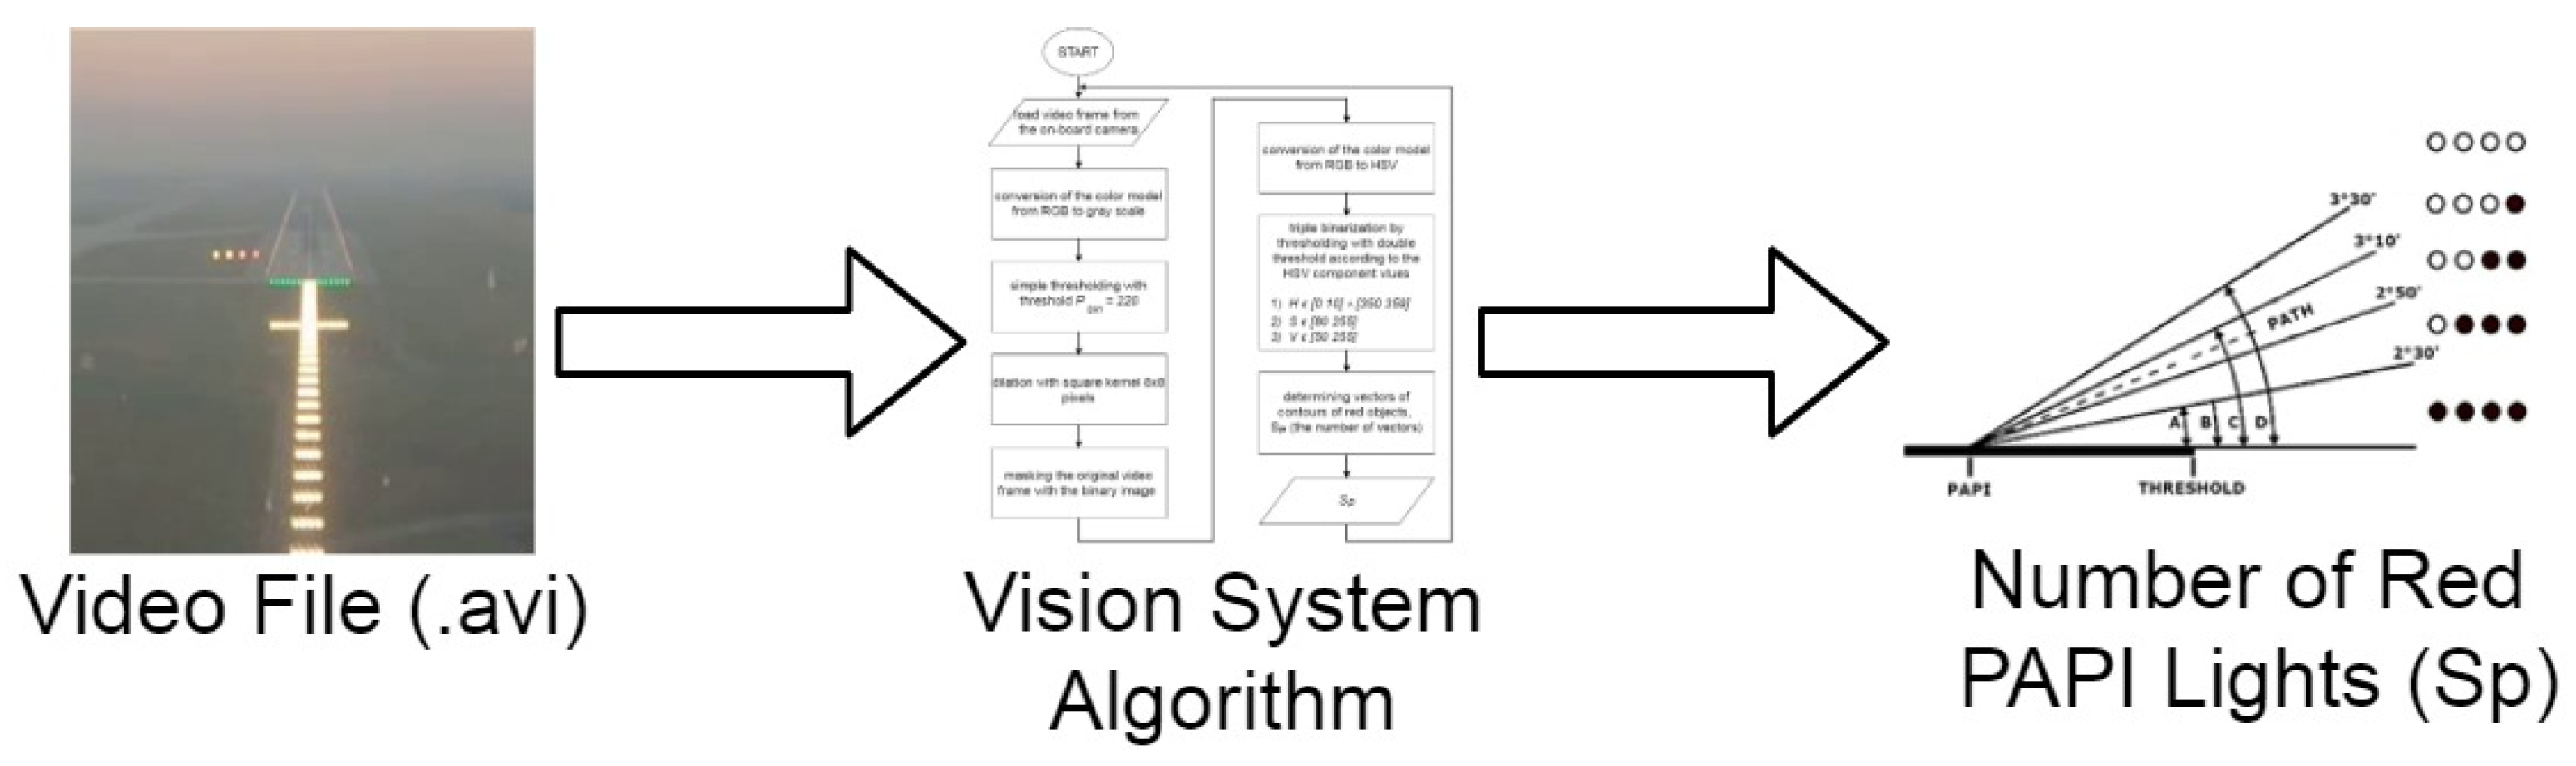
PAPI lights are shown on a video image, which is created by means of isolating the bright areas in successive frames of the film, followed by the identification of their color. This is achieved by a sequence of standard mathematical operations using pixel arrays [20] (Figure 4).
Any lights on a raw picture obtained from the camera are represented by small groups of pixels in a color brighter than the background (Figure 5).
The first step in the whole process is to determine the brightness level of particular areas of the picture. For this purpose, the image is converted from an red, green, blue (RGB) color scale to grayscale with the use of standard procedures [21,22].
The second step is binarization. This is aimed at a significant reduction of the amount of information by erasing useless objects, irrelevant items, and visual disturbances. The grayscale image of the runway is binarized by thresholding at a lower threshold [21,23,24,25]. This transformation removes all non-white pixels. However, all white pixels representing the brightest objects, including the PAPI lights, remain unchanged (Figure 6). For all other pixels, zeros are assigned, which translates to the black color. The threshold value, Pbin = 220, was determined experimentally. A higher threshold value led to the removal of areas of the lights. Conversely, a lower value did not remove either disturbances or adverse objects, which resulted in incorrect PAPI light detection and can give misleading results. To be sure that the PAPI lights were detected, their number and the distances between each one were verified.
At this stage, the disturbances are removed but the PAPI lights in red are too “small” for further processing; they consist of an insufficient number of pixels and could be lost in the next steps. This is why the grayscale picture became the subject of dilatation, where the reference object was a square shape of 8 × 8 pixels in size. As a result, some areas of the picture that contain PAPI lights and approach lights were enhanced (Figure 6).
Due to these transformations, single adverse objects that have not been removed so far by binarization (e.g., the lights of another plane, vehicles, or terrain obstacles located in the camera frame outside the runway) are not taken into account by the algorithm in the next stages.
Thus, it is necessary to recover the colors for the remaining objects still present in the picture. This is achieved by a binary sum of the grayscale picture (Figure 6) and the original picture (Figure 5). In effect, a picture that includes the colored aerodrome lights on a black background (Figure 7) in RGB code is achieved.
Until this stage, the picture has been coded in the very popular RGB scale; however, since the hue saturation value scale (HSV) is much more efficient for the next steps of picture processing, proper transformation should be performed. Figure 7 presents the resultant image after conversion to the HSV scale.
The HSV scale defines the component H of red color pixels representing the PAPI lights, in ranges of <0, >10 and <350, and >359, depending on the brightness of the background. The remaining components S and V are in the ranges of <80, >255 and <50, and >255, respectively. Red PAPI light can be extracted in the process of double-threshold binarization of the HSV scale picture. This operation is applied separately for each component of the HSV scale, with both upper and lower threshold levels matching the boundaries of the ranges of red color. Three monochromatic pictures created in this way (one for each component of the HSV scale) are merged together with the use of the binary product [20,22,24,25]. The resultant monochromatic picture enables receiving a number of red PAPI lights, which, at this stage, are represented by areas of white pixels (Figure 8).
The picture containing a white representation of the red PAPI lights on a black background is the starting point in the extraction of the number of visible PAPI lights. The number of objects (white areas in a monochromatic picture) is identified by determining the contours of these objects. They are defined in the form of vectors of points [20,23,24,25]. The number of created vectors is equal to the number of objects in the picture, which equals the number of red PAPI SP lights, as seen by the onboard video camera in this case.
5. Algorithms of Automatic Aircraft Landing
The automatic landing algorithms (ALA) implemented in the ALS module (Figure 3) are present to execute the landing, from the moment the aircraft is on the approach path until it touches the runway, efficiently and safely. They were developed as a Mamdani-type fuzzy expert system, fed with three inputs carrying information about flight parameters. During this flight phase, the key flight parameters are the number of red PAPI lights SP, the height above the runway H, and the true airspeed U. Conversely, the two outputs calculated by the ALA are the following control signals: the desired pitch angle θd and the throttle position δT.
The control algorithms presented later in this section are used to imitate the pilot’s activity, they should be capable of landing the aircraft using only the same set of data as normally used by pilots. Thus, when defining the set of system inputs, outputs, and rules, the method used by the human pilot who controls the plane was replicated [26].
Using the information gathered about airplane control employed by the human pilot, linguistic spaces and the linguistic values they contain were defined for each linguistic variable:
- for inputs:
XSP (number of PAPI lights) = {high over path, over path, on path, below path, low below path};
XH (height above the runway) = {very low, low, high};
XU (airspeed) = {very low, low, correct, high, very high}.
- and for outputs:
Xθd (desired pitch angle) = {negative big, negative small, negative, zero, positive, positive small, positive big};
XδT (desired throttle position) = {very small, small, medium, big, very big}.
The next step in the development of the expert system was to assign membership functions to fuzzy sets [27,28,29,30]. Three typical forms of membership functions were used: triangular, trapezoidal, and singleton. The use of triangular and trapezoidal membership functions for most linguistic variables facilitated the final tuning of the control algorithms. The singleton function was used for the input signal, servicing only the discrete values. For all fuzzy sets, the values of the membership function parameters were determined, on the basis of flight data acquired in real flights with the controls handled by the pilot, and on the basis of information obtained from experts (experienced GA airplane pilots Flight Instructors, flying, in particular, with the airplane selected for the tests) [30].
In the first step, the number of visible red PAPI lights SP was linked to fuzzy sets, defining the variables for the relative position of the aircraft to the approach path: very high over path, over path, on path, below path, and low below path (Figure 9).
The signal SP is discrete, with values of 0, 1, 2, 3, and 4 only. Therefore, the singleton type function was used to assign the SP variable to one-element fuzzy sets (Figure 9).
Next, the variable H, denoting the height of the plane above the runway, was linked with the fuzzy sets: very low, low, and high (Figure 10).
Both the ground proximity and the relatively low flight speed force, that increased attention must be paid for maintaining the proper flight speed all the time. For this reason, control algorithms take the airspeed U into account and link it with fuzzy sets: very low, low, correct, high, and very high (Figure 11).
There are two outputs coming out of algorithms controlling the aircraft (Figure 3): desired pitch angle θd (Figure 12) stabilized by the autopilot, and δT directly controlling the throttle lever position (Figure 13).
A number of selected fuzzy sets for all linguistic variables and their widths resulted from the aircraft characteristics, the data recorded during test flights, and expert knowledge. The ranges of both the input and output data were associated with fuzzy sets in such a way as to obtain the appropriate granularity (accuracy) of the information, securing the satisfactory precision level of expert knowledge and the precision of the control process [28,31].
A basic set of rules for an expert system contains twelve rules defining the aircraft control strategy, created on the basis of skilled pilot actions (Figure 14). It is worth noting at this point that the rules were not generated automatically. All of them were created manually, with the pilots’ and automatic flight control experts’ assistance. Consequently, it is likely that if the set were analyzed objectively, some formal scenarios would not be covered by the rules. However, when looking at the system as a whole, these scenarios are either indirectly covered by other rules, or are not feasible.
Rules one to five are directly responsible for keeping the airplane on the approach path defined by the PAPI lights when the aircraft is higher than the predefined initial height of the flare maneuver:
- Rule 1.
- IF (SP IS on path) AND (H IS high) THEN (θd IS negative small)
- Rule 2.
- IF (SP IS over path) AND (H IS high) THEN (θd IS negative)
- Rule 3.
- IF (SP IS below path) AND (H IS high) THEN (θd IS zero)
- Rule 4.
- IF (SP IS high over path) AND (H IS high) THEN (θd IS negative big)
- Rule 5.
- IF (SP IS low below path) AND (H IS high) THEN (θd IS positive small) (δT IS big)
The rules produce the desired pitch angle θd which should be slightly negative to guarantee the proper descent when the aircraft follows the glide path correctly. When the aircraft is under or over the desired trajectory, the system should vary the pitch angle to ensure that the aircraft will then follow the correct approach path.
When the plane is significantly lower than the approach path (all PAPI lights are red), rule number five is activated. Its role is to increase the thrust, in order to guarantee horizontal flight or to make the aircraft climb to reach the correct glide path.
Rules from six to ten manage the airspeed control process itself. They are intended to maintain a constant approach speed, regardless of the value of the pitch angle. They are active during the approach phase only when the aircraft is higher above the ground than the assumed flare height, and the airplane is close to the glide path defined by the PAPI lights. If the airspeed U is adequate, i.e., an aircraft approach airspeed of 100 km/h (28 m/s) for MP-02A aircraft (Figure 2), the expert system moves the throttle lever δT to a position between the middle and the minimum setting. A negative pitch angle allows the aircraft to continue the flight with the appropriate approach airspeed. If the aircraft flies too fast or too slowly, the system moves the throttle lever and decreases or increases the thrust, respectively.
- Rule 6.
- IF (SP IS NOT low below path) AND (U IS correct) AND (H IS NOT very low) THEN (δT IS small)
- Rule 7.
- IF (SP IS NOT low below path) AND (U IS small) AND (H IS NOT very low) THEN (δT IS medium)
- Rule 8.
- IF (SP IS NOT low below path) AND (U IS high) AND (H IS NOT very low) THEN (δT IS very small)
- Rule 9.
- IF (SP IS NOT low below path) AND (U IS small) AND (H IS NOT very low) THEN (δT IS very big)
- Rule 10.
- IF (SP IS NOT low below path) AND (U IS high) AND (H IS NOT very low) THEN (δT IS very small)
As soon as the airplane is near the flare height, approaching the PAPI lights line, the PAPI lights start disappearing beyond the frame of the camera, and rule number eleven is then activated. Its task is to continue maintaining the pitch angle to ensure proper descent.
- Rule 11.
- IF (H IS very low) THEN (θd IS negative small)
When the flare height is reached, rule number twelve is triggered. It slowly increases the pitch angle to small positive values and retracts the throttle lever to the minimum position. This action copies the human operator’s action during the flare maneuver. It reduces the sink rate and also causes a slow, gradual reduction of the airspeed, leading the aircraft to the touchdown [32].
- Rule 12.
- IF (H IS very low) THEN (θd IS zero) (δT IS very small)
It is worth stating, at this point, that these rules do not support any emergency situation (e.g., go around, missed approach, and other procedures); only normal flight procedures are considered.
6. Example Simulation Results
Results achieved in the theoretical discussion were checked and verified in practical tests, focusing on two main system elements: the vision system and automatic landing system. The tests of the vision system were meant to analyze the work of the algorithm, determining, on the basis of the number of white and red lights on the picture of the PAPI lights, the vertical deviation of the aircraft from the desired flight path. The tests were performed in experimental flights. The tests of the developed automatic landing system were intended to verify the control algorithms guiding the aircraft along the glide path, as defined by the PAPI light system. These were conducted in two test campaigns. Software in the loop (SIL) tests were conducted initially, followed by hardware in the loop (HIL) tests. The MP-02A aircraft simulation model (a non-linear model, built on the basics of real data gathered in dedicated flight test campaigns), an autopilot unit, an embedded vision system, and an automatic landing system, with software whose major functions were automatically generated on the basis of MATLAB/Simulink models, were integrated into laboratory stands (Figure 15 and Figure 16) [14].
6.1. Tests of PAPI Light Indication and Interpretation Algorithms
Prior to its integration with the sub-systems controlling the aircraft, the vision system (Figure 3) was tested independently. Both the test campaign scenarios and test configuration were affected by its functions and hardware configuration, which were as follows:
- An embedded computer, based on a quad-core processor with a 256-core GPU graphics chip, managed by a real-time operating system (including a built-in compiler, debugger, and system libraries containing the basic functions and algorithms for image-processing and calculation support), a quad-core ARM processor with a 256-core GPU graphics chip that allows parallel computing (a Jetson TX1 computer, based on NVIDIA Maxwell architecture, was used as a hardware platform, while Linux Ubuntu 16.04 LTS is the operating system),
- A video camera maintaining variable lighting conditions, characterized by the following parameters: 4K resolution, 155-degree view angle, and picture stabilization mechanism (FPV Foxeer Legend 3).
Software supporting image-processing algorithms was also included in the target configuration. It provides all the functions necessary to extract crucial and essential information from the image. These functions track objects moving on sequential video frames, identify their location and provide this data for further calculations. The tracking process requires objects to be recognized cyclically on successive frames of the image. To do this, the vision system detects certain predefined objects. Image-processing methods based on the operations of segmentation, filtering, binarization, and image creation were used for this purpose. Computer vision methods and techniques, contained in the OpenCV programming library, provided the basic image-processing algorithms and were used to program the algorithms for the onboard vision system [20]. Low-level functions that perform basic operations on images were not developed as part of the research; these were taken from a dedicated library and were only used as a tool for the development of algorithms interpreting the state of the PAPI lights system.
The software analyzing the PAPI light signal was tested in the three-step chain, successively merging the elements of real flights with HIL, SIL, and desktop simulations (Figure 15):
- The pilot landed the experimental aircraft in a series of real, dedicated flights using PAPI lights, and a movie capturing a PAPI image in *.avi format was recorded.
- The vision system algorithm processed the movie offline, but the real-time of both the video replay and the calculations were kept.
- The output information generated by the vision algorithms, i.e., the number of detected red lights, was compared with the real frames of PAPI lights in the movie.
The final result was a positive or negative qualitative opinion from the expert on whether the system was able to recognize the number of PAPI lights correctly or not.
6.2. Tests Campaigns of the Aircraft Automatic Landing Control Algorithms
The second part of the tests aimed to verify if the data achieved from the image-processing algorithm are sufficient for the control algorithms and if they could be used by the algorithm to land the aircraft safely. Both pieces of the system (PAPI light image-processing algorithms and control algorithms) are mutually dependent on one another; it is clear that the control algorithms should not be tested either in isolation or separate from the PAPI light indication and interpretation algorithms.
The final assessment of the cooperation between the vision system and the automatic landing system was based on the quality of execution of all phases of the landing (Figure 14). Special attention was paid to the stabilization of three aircraft flight parameters recognized as the most critical during the flare and touchdown phases: airspeed, vertical deviation from the desired glide path, and vertical speed (sink rate). The assessment was composed of the typical indexes applicable for control system evaluation and subjective expert opinions, taking into account the overall impression of the whole landing.
The first step of a test campaign was the SIL-type tests, conducted with a dedicated rig [12,16,20] (Figure 16) consisting of the following components:
- A computer with software executing both picture-processing functions and fuzzy control algorithms. A video signal was acquired by the USB interface. The calculated deviation of the aircraft position from the desired glide path was transmitted to the autopilot via an RS-232 interface.
- An autopilot—the real autopilot module that originated from the test airplane (Figure 2).
- The xPlane-based flight simulator environment, simulating aircraft dynamics and generating the picture of the PAPI lights.
- A video camera—this closes the loop by acquiring a picture of the PAPI lights and transmitting it to the vision system.
- A data recorder, recording the data from the internal CAN bus.
The main goal of that campaign was to verify the codes of the major software functions. They were launched in a software simulation environment, which was composed of modules simulating both picture-processing and automatic landing algorithms. Software automatically generated from MATLAB/Simulink models was downloaded and run on a simulating PC-class computer. These functions were intended to be downloaded into the hardware in the next step. In this step, the hardware components of the stand played only a minor, supplementary role. The main objectives of the tests were performed in the software environment.
The next step in the testing process was a typical, pure HIL test campaign. It was performed with the use of a modified SIL stand (Figure 17). The computer that was realizing the simulation was replaced with two real modules:
- The vision system (VS), executing picture-processing algorithms. It captured the video signal CSI-2 interface and transmitted the calculated vertical deviation of the aircraft position from the desired flight trajectory to the automatic landing system via the RS-232 interface.
- The automatic landing system (ALS), executing fuzzy logic algorithms maintaining the landing phase. The ALS generated the desired pitch angle θd, stabilized by an autopilot in one channel, and directly controlled the throttle level position δT in another channel (Figure 3).
The main characteristic feature of hardware in the loop-type tests, i.e., the usage of real hardware units with downloaded target software, is that this increases the quality of achieved results, which are comparable with real systems.
Figure 18, Figure 19, Figure 20, Figure 21 and Figure 22 present the results achieved during one selected sample test scenario.
Figure 19 presents the number of both red and white PAPI lights that the vision system identified in particular flight phases. It matches the aircraft’s position relative to the runway (Figure 18).
Figure 20 presents the pitch angle, while Figure 21 presents the throttle position dictated by the automatic landing system. The desired −3.5-degree pitch angle is maintained by the autopilot to keep the aircraft on the correct path (Figure 20). Once a flare height is reached (2 m, in this case) the desired pitch angle is set at close to zero degrees. This results in increasing the glide angle (the glide angle becomes less negative) and decreasing the sink rate.
Unfortunately, near the runway threshold, the system became too sensitive because even very small height deviations had an influence on the PAPI signal variations. It generated dynamic and agile variations of the desired pitch angle.
The thrust was controlled to keep the airspeed at about 100 km/h (27.8 m/s)—as recommended by the aircraft flight manual at the approach phase. During the flare phase, the thrust was reduced to decelerate the aircraft and, finally, land. The system reacted appropriately, increasing power for a moment when the aircraft started sinking too fast (at 237 s in the simulation) just after it “hopped out”.
The vertical speed (Figure 22) before the flare phase resulted directly from the glide angle and the airspeed and was not critical. In contrast, during the flare phase, it had to be reduced to a safe magnitude that is specific for each aircraft. In this scenario, it was reduced below 0.5 m/s of the sink (vertical speed higher than −0.5 m/s).
Initially, the aircraft was always controlled manually by the pilot. It was aligned to the runway centerline below the theoretical glide path line, at a height of 200 m above the runway and with an airspeed of 130 km/h (36 m/s). At 27 s of the simulation, the system was activated and the automatic landing system started to capture the glide path. Since there are no dedicated aviation procedures for glide path-capturing implemented in the control algorithms, aircraft behavior in this phase results only from the basic path stabilization rules. This may not be compliant with some aviation rules and it is not a subject for evaluation in this paper. The aircraft entered the “two whites–two reds” zone at 108 s (Figure 18). From this moment the system pitched the aircraft down and started maintaining the glide path.
Figure 18 presents the vertical profile of the aircraft flight and the sectors related to specific PAPI light configurations. There are four lines, indicating the sectors linked with particular configurations of the PAPI lights plotted on the graph. The two middle lines define the “two whites—two reds” sector, containing the desired 3-degree glide path. It is situated between 80 s and 110 s of the simulation. Next, the aircraft follows it until 235 s, when the flare phase begins. The touchdown takes place at approximately 240 s.
Control rules in the airspeed channel were assigned to maintain the desired airspeed of 100 km/h (28 m/s) until the flare phase was launched, when the thrust was to be reduced to decelerate the aircraft. The simulation started with an aircraft speed of 130 km/h (36 m/s), then the automatic landing system decreased the throttle so the airspeed was lowered. Once the aircraft entered the “two whites—two reds” sector, the airspeed stabilized at the level of 98 km/h (27 m/s), which was considered acceptable by experts. This was significantly reduced, in the flare phase before the touchdown, to approximately 80 km/h (22 m/s), which corresponds with the behavior of a real aircraft (Figure 23).
7. Conclusions
This paper discusses two issues related to aircraft flight control when supporting an automatic landing. First, it concentrates on the development of an image-processing algorithm capable of identifying the number of PAPI lights of red color appearing in front of the pilot. Second, it presents control algorithms imitating the pilot’s activities, with both the elevator and throttle lever set to maintain the desired trajectory in the longitudinal channel during a final approach, flare phase, and touchdown.
The data used for the realization of both sub-tasks were gathered during dedicated flights with a light aircraft, which, in terms of its main attributes and basic performance, was similar to a MALE-class UAV.
The algorithms were implemented in embedded systems—the vision system and the automatic landing system, which were tested using a dedicated test rig. Initially, different approaches were employed, but finally, the hardware in the loop method was chosen. During tests, an aircraft controlled by the developed control algorithms, supported by PAPI lights, successfully conducted the final approach, flare phase, and touchdown on the runway. The control applied by the automatic landing system was based on expert knowledge and a fuzzy system imitating the pilot’s actions.
The system was able to guide the aircraft along the desired approach glide path, maintaining a satisfactory theoretical shape (Figure 14), as well as vertical deviations and a correct airspeed. There appeared to be some oscillations in the flight trajectory when the aircraft was close to the flare height. There are, however, some deficiencies in the control precision. These result from the relationship between the magnitude of the vertical linear deviation and the number of red PAPI lights appearing when the aircraft was approaching the flare point.
Despite oscillations, the aircraft performed the flare maneuver and touched down on the runway safely. All flight parameters were within typical operational ranges. The control system’s behavior was very similar to the human pilot’s behavior during the final runway approach.
The most significant weakness of the system, revealed in the tests, is its sensitivity to the lighting conditions. Some of the qualitative tests showed that because of glare, it could be troublesome to extract the data in all cases, especially when the sun is low above the horizon, just at the front of the aircraft. However, the usage of filters, other cameras, or not only daylight cameras are the first proposals for mitigating this phenomenon. This is also the subject of our next research project.
To conclude, the results of the simulation can be considered promising. They confirm that the assumptions, as well as the whole approach, were correct. The system presented in the paper can eventually offer an alternative to the current systems supporting automated landings.
The research presented in the paper is part of a research campaign focused on aircraft control during landing with the use of image processing. Besides the longitudinal control, there were also lateral controls supported by the usage of a Calvert light system investigated in other tests. The results are to be presented in dedicated papers.
Author Contributions
Conceptualization, T.R. and D.N.; methodology, T.R., D.N. and G.K.; formal analysis, T.R., D.N. and G.K.; software, D.K. and D.N.; validation, T.R. and D.N.; writing—original draft preparation, T.R.; writing—review and editing, G.K.; supervision, T.R. All authors have read and agreed to the published version of the manuscript.
Funding
This research received no external funding.
Conflicts of Interest
The authors declare no conflict of interest.
References
- Stevens, B.L.; Lewis, F.L. Aircraft Control and Simulation. Aircr. Eng. Aerosp. Technol. 2004, 76, 5. [Google Scholar] [CrossRef] [Green Version]
- Vepa, R. Flight Dynamics, Simulation, and Control for Rigid and Flexible Aircraft; CRC Press: Boca Raton, FL, USA, 2014. [Google Scholar] [CrossRef]
- Kundu, A.K.; Price, M.A.; Riordan, D. Theory and Practice of Aircraft Performance; John Wiley & Sons: Hoboken, NJ, USA, 2016. [Google Scholar]
- Kopecki, G. Analysis of Control Quality of Aircraft Lateral Motion during Approach with the Use of Different Control Laws. Aviation 2006, 10, 21–29. [Google Scholar] [CrossRef]
- Belmonte, L.M.; Morales, R.; Fernández-Caballero, A. Computer vision in autonomous unmanned aerial vehicles—A systematic mapping study. Appl. Sci. 2019, 9, 3196. [Google Scholar] [CrossRef] [Green Version]
- Sabatini, R. A Low-Cost Vision Based Navigation System for Small Size Unmanned Aerial Vehicle Applications. J. Aeronaut. Aerosp. Eng. 2013, 2, 2. [Google Scholar] [CrossRef] [Green Version]
- Gomolka, Z.; Kordos, D.; Zeslawska, E. The Application of Flexible Areas of Interest to Pilot Mobile Eye Tracking. Sensors 2020, 20, 986. [Google Scholar] [CrossRef] [Green Version]
- Wubben, J.; Fabra, F.; Calafate, C.T.; Krzeszowski, T.; Marquez-Barja, J.M.; Cano, J.-C.; Manzoni, P. Accurate Landing of Unmanned Aerial Vehicles Using Ground Pattern Recognition. Electronics 2019, 8, 1532. [Google Scholar] [CrossRef] [Green Version]
- Qingii, G.; Jian, L.; Jinning, Z. Airport PAPI Lamp Image Detection Algorithm Based on Saliency and Configuration Features. In Proceedings of the 2018 IEEE CSAA Guidance, Navigation and Control Conference (CGNCC), Xiamen, China, 10–12 August 2018; pp. 1–5. [Google Scholar] [CrossRef]
- Kapuscinski, T.; Szczerba, P.; Rogalski, T.; Rzucidlo, P.; Szczerba, Z. Vision-Based Method for Determining Aircraft State during Spin Recovery. Sensors 2020, 20, 2401. [Google Scholar] [CrossRef]
- Oszust, M.; Kapuscinski, T.; Warchol, D.; Wysocki, M.; Rogalski, T.; Pieniazek, J.; Kopecki, G.; Ciecinski, P.; Rzucidlo, P. A vision-based method for supporting autonomous aircraft landing. Aircr. Eng. Aerosp. Technol. 2018, 90, 973–982. [Google Scholar] [CrossRef]
- Brukarczyk, B.; Nowak, D.; Kot, P.; Rogalski, T.; Rzucidło, P. Fixed Wing Aircraft Automatic Landing with the Use of a Dedicated Ground Sign System. Aerospace 2021, 8, 167. [Google Scholar] [CrossRef]
- Basmadji, F.L.; Gruszecki, J.; Rzucidlo, P.; Kordos, D. Development of ground control station for a terrain observer—Hardware in the loop simulations. In Proceedings of the AIAA Modeling and Simulation Technologies Conference, Minneapolis, MN, USA, 13–16 August 2012. [Google Scholar]
- ICAO. ICAO Annex 14 to the Convention on International Civil Aviation Aerodromes, 8th ed.; International Civil Aviation Organization: Montreal, QC, Canada, 2018; ISBN 978-92-9258-483-2. [Google Scholar]
- Rogalski, T.; Nowak, D.; Wałek, Ł.; Rzońca, D.; Samolej, S. Control System for Aircraft Take-off and Landing Based on Modified PID controllers. MATEC Web Conf. 2019, 252, 06008. [Google Scholar] [CrossRef] [Green Version]
- Rzonca, D.; Samolej, S.; Nowak, D.; Rogalski, T. Communication and control software development for experimental unmanned aerial system–Selected issues. In Automation 2018. Advances in Intelligent Systems and Computing; Szewczyk, R., Zieliński, C., Kaliczyńska, M., Eds.; Advances in Intelligent Systems and Computing; Springer: Cham, Switzerland, 2018; Volume 743. [Google Scholar] [CrossRef]
- Pieniazek, J. Measurement of aircraft approach using airfield image. Meas. J. Int. Meas. Confed. 2019, 141, 396–406. [Google Scholar] [CrossRef]
- Pieniazek, J. Investigation of image based measurement for aircraft approach. In Proceedings of the 5th IEEE International Workshop on Metrology for AeroSpace (MetroAeroSpace), Rome, Italy, 20–22 June 2018. [Google Scholar] [CrossRef]
- Rzucidło, P.; Rogalski, T.; Jaromi, G.; Kordos, D.; Szczerba, P.; Paw, A. Simulation studies of a vision intruder detection system. Aircr. Eng. Aerosp. Technol. 2020, 92, 621–631. [Google Scholar] [CrossRef]
- OpenCv, OpenCV Library OpenCV Website. 2014. Available online: https://opencv.org (accessed on 31 January 2022).
- Cheng, H.-W.; Chen, T.-L.; Tien, C.-H. Motion Estimation by Hybrid Optical Flow Technology for UAV Landing in an Unvisited Area. Sensors 2019, 19, 1380. [Google Scholar] [CrossRef] [PubMed] [Green Version]
- Burlion, L.; de Plinval, H. Keeping a ground point in the camera field of view of a landing UAV. In Proceedings of the 2013 IEEE International Conference on Robotics and Automation (ICRA 2013), Karlsruhe, Germany, 6–10 May 2013. [Google Scholar] [CrossRef]
- Anitha, G.; Kumar, R.N.G. Vision based autonomous landing of an unmanned aerial Vehicle. Procedia Eng. 2012, 38, 2250–2256. [Google Scholar] [CrossRef] [Green Version]
- Fadhil, A.F.; Kanneganti, R.; Gupta, L.; Eberle, H.; Vaidyanathan, R. Fusion of Enhanced and Synthetic Vision System Images for Runway and Horizon Detection. Sensors 2019, 19, 3802. [Google Scholar] [CrossRef] [Green Version]
- Liu, C.; Cheng, I.; Basu, A. Real-Time Runway Detection for Infrared Aerial Image Using Synthetic Vision and an ROI Based Level Set Method. Remote Sens. 2018, 10, 1544. [Google Scholar] [CrossRef] [Green Version]
- Olivares-Mendez, M.A.; Kannan, S.; Voos, H. Vision based fuzzy control autonomous landing with UAVs: From V-REP to real experiments. In Proceedings of the 23rd Mediterranean Conference on Control and Automation (MED), Torremolinos, Spain, 16–19 June 2015. [Google Scholar] [CrossRef]
- Bickraj, K.; Street, W.F.; Li, M.; Tansel, I.N. Fuzzy Logic Based Integrated Controller for Unmanned Aerial Vehicles. In Proceedings of the Florida Conference on Recent Advances in Robotics, Miami, FL, USA, 25–26 May 2006; Available online: https://www.researchgate.net/publication/228643261_Fuzzy_Logic_Based_Integrated_Controller_for_Unmanned_Aerial_Vehicles/citations#fullTextFileContent (accessed on 31 January 2022).
- Marcu, E. Fuzzy logic approach in real-time UAV control. J. Control Eng. Appl. Inform. 2011, 13, 12–17. [Google Scholar]
- Su, X.; Wu, Y.; Song, J.; Yuan, P. A Fuzzy Path Selection Strategy for Aircraft Landing on a Carrier. Appl. Sci. 2018, 8, 779. [Google Scholar] [CrossRef] [Green Version]
- Bandara, R.M.N.; Gaspe, S. Fuzzy logic controller design for an Unmanned Aerial Vehicle. In Proceedings of the 2016 IEEE International Conference on Information and Automation for Sustainability, Galle, Sri Lanka, 16–19 December 2016. [Google Scholar] [CrossRef]
- Nair, V.G.; Dileep, M.V.; Prahaland, K.R. Design of Fuzzy Logic Controller for Lateral Dynamics Control of Aircraft by Considering the Cross-Coupling Effect of Yaw and Roll on Each Other. Int. J. Comput. Appl. 2012, 47, 44–48. [Google Scholar] [CrossRef]
- Nowak, D.; Kopecki, G.; Orkisz, M.; Rogalski, T.; Rzucidło, P. The selected innovative solutions in UAV control systems technologies. In Innovative Control Systems for Tracked Vehicle Platforms. Studies in Systems, Decision and Control; Nawrat, M.A., Ed.; Springer: Cham, Switzerland, 2014; Volume 2. [Google Scholar] [CrossRef]
Figure 1.
PAPI light system: (a) the typical configuration of the PAPI lights; (b) a sample image of pilot’s view.
Figure 1.
PAPI light system: (a) the typical configuration of the PAPI lights; (b) a sample image of pilot’s view.

Figure 2.
The MP−02A experimental airplane, as used in the research.

Figure 3.
The structure of the flight control system, composed of a traditional autopilot, supported by an automatic landing system and vision δE, δT−the elevator position and throttle lever position are control signals affecting the aircraft [12].
Figure 3.
The structure of the flight control system, composed of a traditional autopilot, supported by an automatic landing system and vision δE, δT−the elevator position and throttle lever position are control signals affecting the aircraft [12].

Figure 4.
The image-processing algorithm, determining the number of red PAPI lights in the Pbin—binarization threshold: H, S, V—pixel color components; SP—number of red PAPI lights.
Figure 4.
The image-processing algorithm, determining the number of red PAPI lights in the Pbin—binarization threshold: H, S, V—pixel color components; SP—number of red PAPI lights.

Figure 5.
Raw picture of the PAPI light s system: (a) the raw runway light image; (b) the runway light image in grayscale. The picture was taken approaching the Rzeszow, Jasionka (EPRZ) runway 27, in September, in the late afternoon on a sunny day. The sensor was installed inside the cockpit of the experimental airplane.

Figure 6.
Transformation of the binary picture: (a) the binary picture; (b) the binary picture after treatment with dilatation transformation.
Figure 6.
Transformation of the binary picture: (a) the binary picture; (b) the binary picture after treatment with dilatation transformation.

Figure 7.
RGB vs. HSV coding: (a) colors are weakly visible in the RGB picture; (b) the same picture, once converted to the HSV scale.
Figure 7.
RGB vs. HSV coding: (a) colors are weakly visible in the RGB picture; (b) the same picture, once converted to the HSV scale.

Figure 8.
The picture containing red PAPI lights−the two white areas represent the two red PAPI lights.
Figure 8.
The picture containing red PAPI lights−the two white areas represent the two red PAPI lights.

Figure 9.
Membership degree of the input variables of the number of red PAPI lights SP associated with fuzzy sets: very high over path, over path, on path, below path, and low below path.
Figure 9.
Membership degree of the input variables of the number of red PAPI lights SP associated with fuzzy sets: very high over path, over path, on path, below path, and low below path.

Figure 10.
Membership degree of the input variable of height above the runway H associated with fuzzy sets: very low, low, high.
Figure 10.
Membership degree of the input variable of height above the runway H associated with fuzzy sets: very low, low, high.

Figure 11.
Membership degree of the input variable of airspeed U associated with fuzzy sets: very low, low, correct, high, and very high.
Figure 11.
Membership degree of the input variable of airspeed U associated with fuzzy sets: very low, low, correct, high, and very high.

Figure 12.
Membership degree of the output variable desired pitch angle θd associated with fuzzy sets: positive big, positive, positive small, zero, negative small, negative, and negative big.
Figure 12.
Membership degree of the output variable desired pitch angle θd associated with fuzzy sets: positive big, positive, positive small, zero, negative small, negative, and negative big.

Figure 13.
Membership degree of the output variable of throttle lever position δT associated with fuzzy sets: very small, small, medium, big, and very big.
Figure 13.
Membership degree of the output variable of throttle lever position δT associated with fuzzy sets: very small, small, medium, big, and very big.

Figure 14.
Phases of the landing and rule assignment.

Figure 15.
The sequence of tests applied to verify the kernel functions of the developed system.

Figure 16.
The configuration of the SIL laboratory stand used for investigating the picture-processing and control algorithms [12].
Figure 16.
The configuration of the SIL laboratory stand used for investigating the picture-processing and control algorithms [12].

Figure 17.
The configuration of the HIL laboratory stand used in the tests [12].
Figure 17.
The configuration of the HIL laboratory stand used in the tests [12].

Figure 18.
The vertical profile of the aircraft flight and sectors, related to specific PAPI light configurations.
Figure 18.
The vertical profile of the aircraft flight and sectors, related to specific PAPI light configurations.

Figure 19.
The number of both red and white PAPI lights identified by the vision system.

Figure 20.
The pitch angle commanded by the automatic landing system, as maintained by the autopilot.
Figure 20.
The pitch angle commanded by the automatic landing system, as maintained by the autopilot.

Figure 21.
Engine power control signal—throttle position δT.

Figure 22.
The vertical speed (sink rate) during landing.

Figure 23.
The airspeed variations during landing.

Publisher’s Note: MDPI stays neutral with regard to jurisdictional claims in published maps and institutional affiliations. |
© 2022 by the authors. Licensee MDPI, Basel, Switzerland. This article is an open access article distributed under the terms and conditions of the Creative Commons Attribution (CC BY) license (https://creativecommons.org/licenses/by/4.0/).
Share and Cite
MDPI and ACS Style
Nowak, D.; Kopecki, G.; Kordos, D.; Rogalski, T. The PAPI Lights-Based Vision System for Aircraft Automatic Control during Approach and Landing. Aerospace 2022, 9, 285. https://doi.org/10.3390/aerospace9060285
AMA Style
Nowak D, Kopecki G, Kordos D, Rogalski T. The PAPI Lights-Based Vision System for Aircraft Automatic Control during Approach and Landing. Aerospace. 2022; 9(6):285. https://doi.org/10.3390/aerospace9060285
Chicago/Turabian StyleNowak, Dariusz, Grzegorz Kopecki, Damian Kordos, and Tomasz Rogalski. 2022. "The PAPI Lights-Based Vision System for Aircraft Automatic Control during Approach and Landing" Aerospace 9, no. 6: 285. https://doi.org/10.3390/aerospace9060285
Note that from the first issue of 2016, this journal uses article numbers instead of page numbers. See further details here.