Article

System Noise Assessment and Uncertainty Analysis of a Conceptual Supersonic Aircraft

Aviation Environmental Sustainability Innovation Hub, Japan Aerospace Exploration Agency (JAXA), Tokyo 182-8522, Japan
*
Author to whom correspondence should be addressed.
Aerospace 2022, 9(4), 212; https://doi.org/10.3390/aerospace9040212
Submission received: 25 February 2022 / Revised: 2 April 2022 / Accepted: 7 April 2022 / Published: 12 April 2022
(This article belongs to the Special Issue Aircraft Noise)

Abstract

:
This paper describes a system noise assessment of a conceptual supersonic aircraft called the NASA 55t Supersonic Technology Concept Aeroplane (STCA), its prediction uncertainty, and related validation tests. A landing and takeoff noise (LTO) standard for supersonic aircraft is needed to realize future supersonic aircraft, and the noise impact due to the introduction of future supersonic aircraft should be analyzed to develop the standard. System noise assessments and uncertainty analyses using Monte Carlo simulation (MCS) were performed. The predicted noise levels showed good agreement with the prior study for both the benchmark case and statistics of the predictions. The predicted cumulative noise level satisfied the ICAO Chapter 4 noise standard, and its standard deviation was approximately 2 EPNdB. Moreover, sensitivity analysis using the obtained datasets revealed strong correlations with the takeoff noise for jet noise, fan exhaust noise at the flyover measurement point, and airframe trailing edge noise. Further understanding of these extracted factors, which were estimated to have a significant impact on the LTO noise, will be beneficial for the development of LTO noise standards and the design of supersonic aircraft.

1. Introduction

In recent years, the development of supersonic business jets and supersonic transport has gained interest due to their potential for high-speed transportation. Several manufacturers have already announced the development of these aircraft; however, the development of such new aircraft requires appropriate standards to obtain type certifications. Concorde, a commercial supersonic aircraft, was launched more than 50 years ago, and the standards for environmental compatibility at that time are now outdated. One of the most important standards for environmental compatibility is the standard for landing and takeoff (LTO) noise, because a trade-off relationship between LTO noise and cruise performance is expected in the design of supersonic aircraft, which are different from conventional subsonic airliners. In general, supersonic aircraft are characterized by the use of high-specific-thrust engines and lower aerodynamic performance during takeoff and landing, compared with conventional subsonic airliners, to maintain supersonic cruise performance.
A new LTO noise standard for supersonic aircraft is anticipated to be added to the International Civil Aviation Organization (ICAO) Annex 16 Vol.1 Chapter 12 [1]. The ICAO has been discussing the development of the LTO noise standard for supersonic aircraft; however, there is currently no specific description. According to the published documents described in the following paragraphs, considering the noise of supersonic aircraft, the important points are as follows: (1) the necessity of predicting the noise of aircraft which does not exist at this time; (2) the necessity of clarifying the difference between supersonic and subsonic aircraft, because the LTO noise trend is expected to be different from that of subsonic aircraft; and (3) the necessity of assessing the environmental impact of supersonic aircraft, and identifying the uncertainty of the prediction and the sensitive factors that need to be taken into account. In this respect, system noise prediction and assessment are important. This effort can be seen in the published literature. Piccirillo et al. [2] predicted the noise of Concorde, the only supersonic aircraft for which data are available, and showed that the difference between the prediction and published data was ± 2.19% for LAmax and SEL; guidelines for supersonic aircraft prediction were clarified. Stone et al. [3] performed a preliminary assessment of airport noise for supersonic business jets using several noise reduction concepts. They demonstrated that the most critical noise component that satisfies the noise standards specified in ICAO Chapter 3 is the jet at the lateral noise measurement point, and the mixed exhaust velocity should be less than approximately 400 m/s, and should be shock-free jets. Many novel noise reduction methods for supersonic jets have also been studied. Chevron [4] and fluidic injection [5,6] have been shown to be effective in reducing shock noise, and their mechanisms have been investigated. To extend the range of supersonic cruise, a high jet Mach number and low bypass ratio during takeoff must be maintained as much as possible. From this point of view, noise reduction devices for supersonic jets have promising potential. However, because the difference between the sideline take-off noise of Concorde [2] and the noise limit for subsonic aircraft (ICAO Chapters 3, 4 and 14) exceeds 20 EPNdB, it is still challenging to fill this gap only with jet noise reduction devices, and noise reduction techniques for the entire system, including engine design and multi-purpose optimization, should be studied. Berton et al. [7] performed a comparative study on the engine cycle for future commercial supersonic aircraft and examined the effects of the takeoff procedure using automatically derated engine thrust, called the programmed lapse rate (PLR), to reduce the lateral noise levels. Huff et al. [8] and Henderson et al. [9] assessed several noise-reduction techniques to satisfy the latest LTO standard (Chapter 14). They reported that future commercial supersonic aircraft have the potential to satisfy Chapter 4 or 14 noise standards using noise-reduction techniques and PLR. However, they also suggested that detailed mission studies are required to investigate the impact of the range resulting from the incorporation of noise-reduction techniques. In 2017, Berton et al. [10] extended their study and proposed an advanced noise abatement takeoff procedure for a supersonic aircraft. In their study, they created a 55-ton conceptual reference airplane with three engines called the NASA 55t Supersonic Technology Concept Aeroplane (STCA). This conceptual reference airplane was also used to discuss future noise standards for supersonic aircraft in ICAO, and the dataset of the STCA was published by NASA [11]. The Japan Aerospace Exploration Agency (JAXA) has conducted a silent supersonic research program (S4) [12]. In this program, the authors studied LTO noise based on a 70-ton class conceptual supersonic airplane [13] and developed a system noise estimation tool called AiNEST [14]. They also predicted the NASA 55t STCA [15] and discussed technical issues through the ICAO working group. The German Aerospace Center (DLR) is also conducting a project to investigate the LTO noise of supersonic aircraft, and recently reported results of their system noise assessments for supersonic aircraft, including the NASA 55t STCA [16].

Scope of This Article

These previous studies have revealed many LTO noise levels of supersonic aircraft that will be developed in the near future, and the differences from those of conventional subsonic airliners. However, further analyses and discussions are required to clarify the uncertainty of the prediction. In addition, it is beneficial to identify the key factors of the LTO noise of supersonic aircraft obtained through prediction to support the discussion for future LTO noise standards and aircraft design.
The objective of this study is to investigate the prediction uncertainty of LTO noise and extract key factors to perform a system noise assessment for future supersonic aircraft. To determine key uncertainty models, component-based validation studies were conducted. Then, a system noise assessment of the NASA 55t STCA and an uncertainty analysis using a Monte Carlo simulation (MCS) were performed as an aircraft representing a supersonic aircraft for which noise standards are currently under consideration. In addition, based on the sensitivity analysis, important factors to be considered in the system noise assessment of future supersonic aircraft were discussed.

2. Technical Approach for System Noise Prediction of Supersonic Aircraft

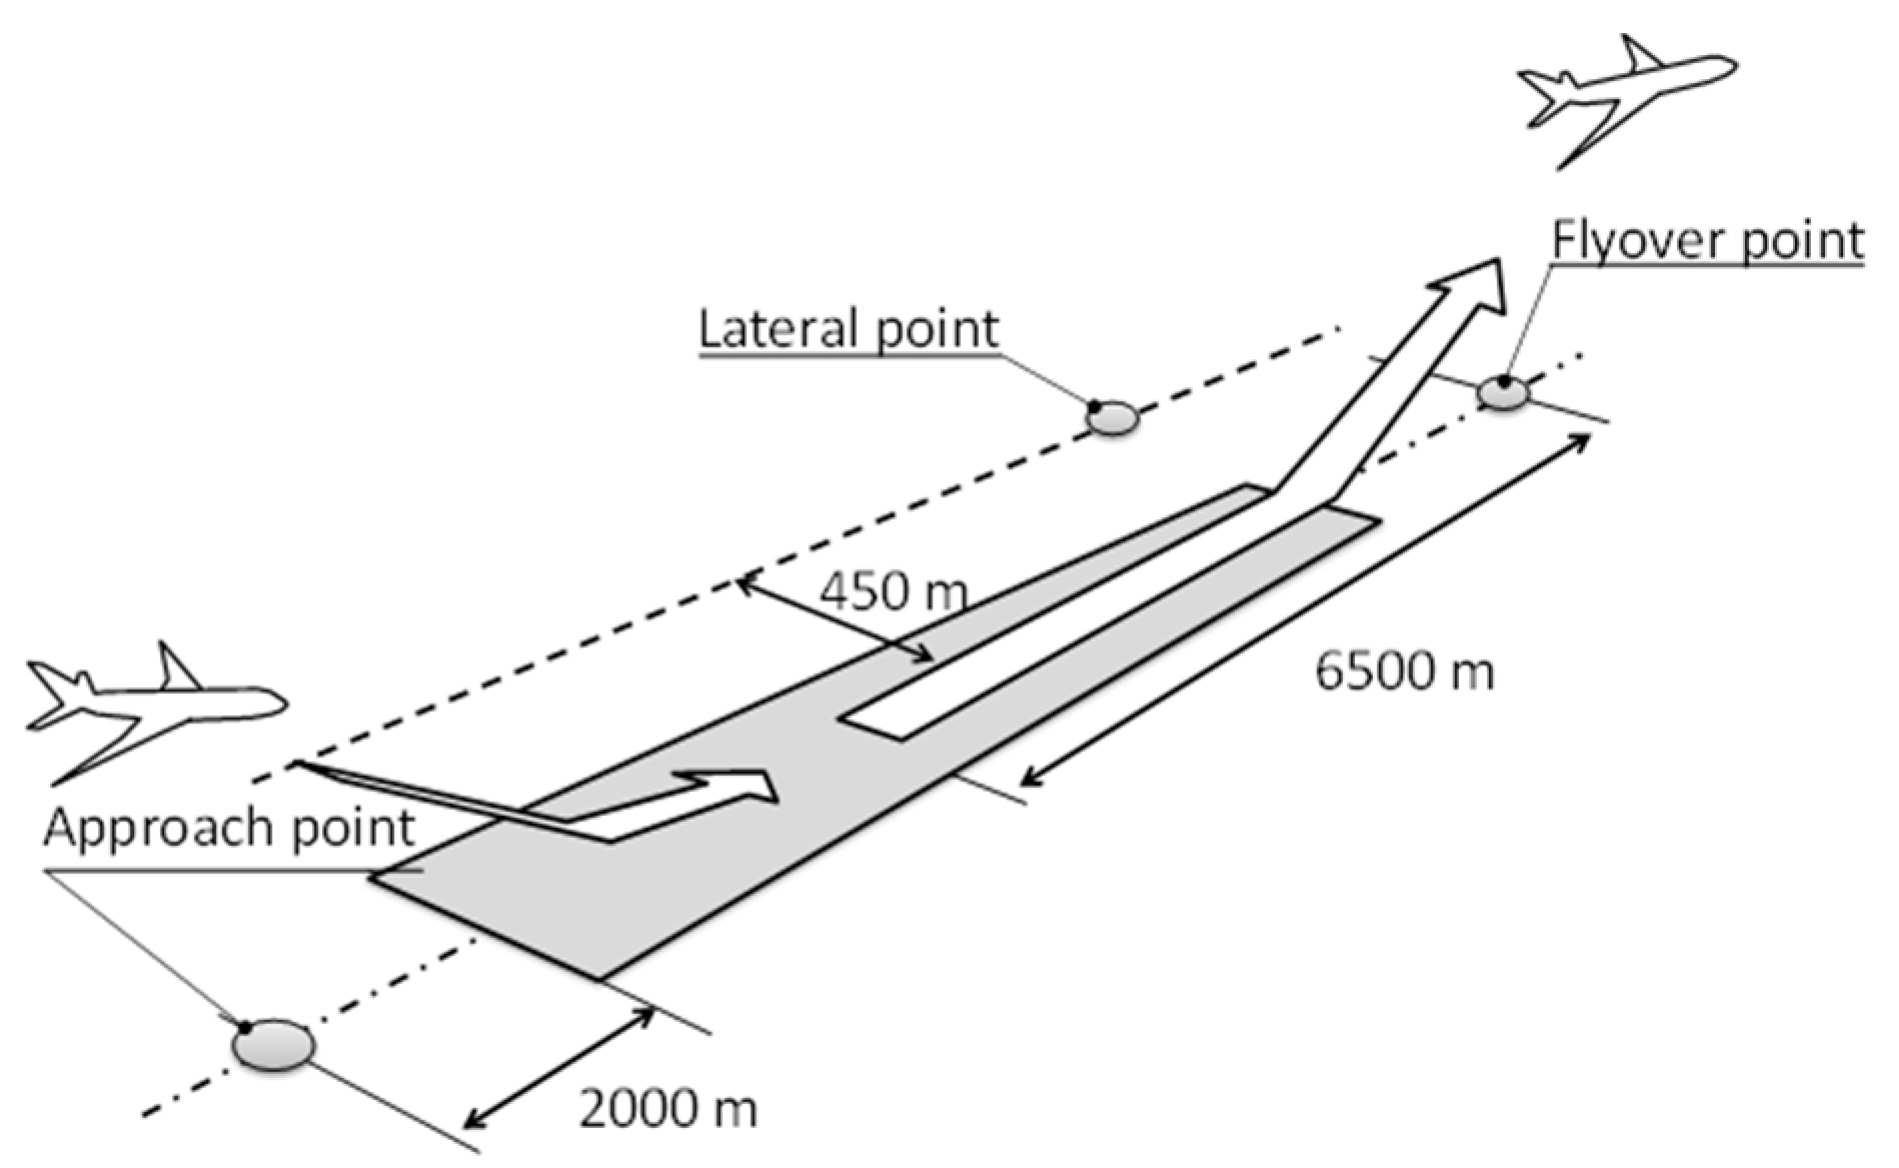
2.1. Standard for LTO Noise

While discussing the LTO noise of supersonic aircraft, the LTO noise standard for subsonic aircraft can be used as a reference, and the standards are briefly introduced in this section.
The noise standards for a subsonic aircraft mentioned in ICAO Chapters 3, 4, and 14 [1] are defined by the margins for limits at three reference noise measurement points: lateral full-power, flyover, and approach. These limits are related to the maximum takeoff mass and the number of engines.
According to the latest standard (Chapter 14), the cumulative margin must be 17 EPNdB or more, and the margins at each measurement point must be 1 EPNdB or more. The position of each reference noise measurement point is shown in Figure 1.
The lateral reference noise measurement point is on a line parallel to and 450 m from the runway center line, where the noise level is at its maximum during takeoff. The flyover reference noise measurement point is on the extended center line of the runway and at a distance of 6.5 km from the start of the roll. The approach reference noise measurement point is on the ground, on the extended center line of the runway 2000 m from the threshold.
The reference takeoff and approach procedures are defined in the standard. The average takeoff thrust is maintained at the lateral measurement point. For the flyover measurement point, the thrust can be reduced at a height above 260 m from the runway for an aircraft with three engines, but the thrust should not be reduced below that required to maintain a climb gradient of 4%, or level flight with one engine inoperative. The takeoff climb speed is between V2 + 10 kt and V2 + 20 kt. The approach glide path is 3°, and Vref + 10 kt is maintained over the reference measurement point. Further information is available in Ref. [1].

2.2. NASA 55t Supersonic Technology Concept Aeroplane

The NASA 55t STCA is a conceptual airplane defined by NASA [10,11] to perform a gap analysis on the LTO noise between the conventional subsonic airliner and the supersonic aircraft currently being planned. The maximum takeoff weight, cruise Mach number and designed range of the STCA are 55 tons, 1.4 and 4243 nautical miles, respectively. The engine is a commercial off-the-shelf CFM56-7B. Using the core engine, it is assumed that the fan, low-pressure system, and nacelle are redesigned for supersonic aircraft. The engine type is a fixed-cycle mixed-flow turbofan. A summary of the engine performance provided by NASA [11] is presented in Table 1. The bypass ratio is 3, and the fan pressure ratio is 1.9 at sea level static. As indicated by previous studies, jet noise is the dominant noise component, and a shock-free jet at takeoff is necessary for the noise levels at takeoff and landing to be similar to those of a subsonic aircraft. Therefore, the exhaust jet Mach number of the NASA 55t STCA at takeoff is approximately 1. It is not necessary to consider the broadband shock-associated noise and screech tones generated by supersonic jets in LTO noise prediction, as represented by the STCA.

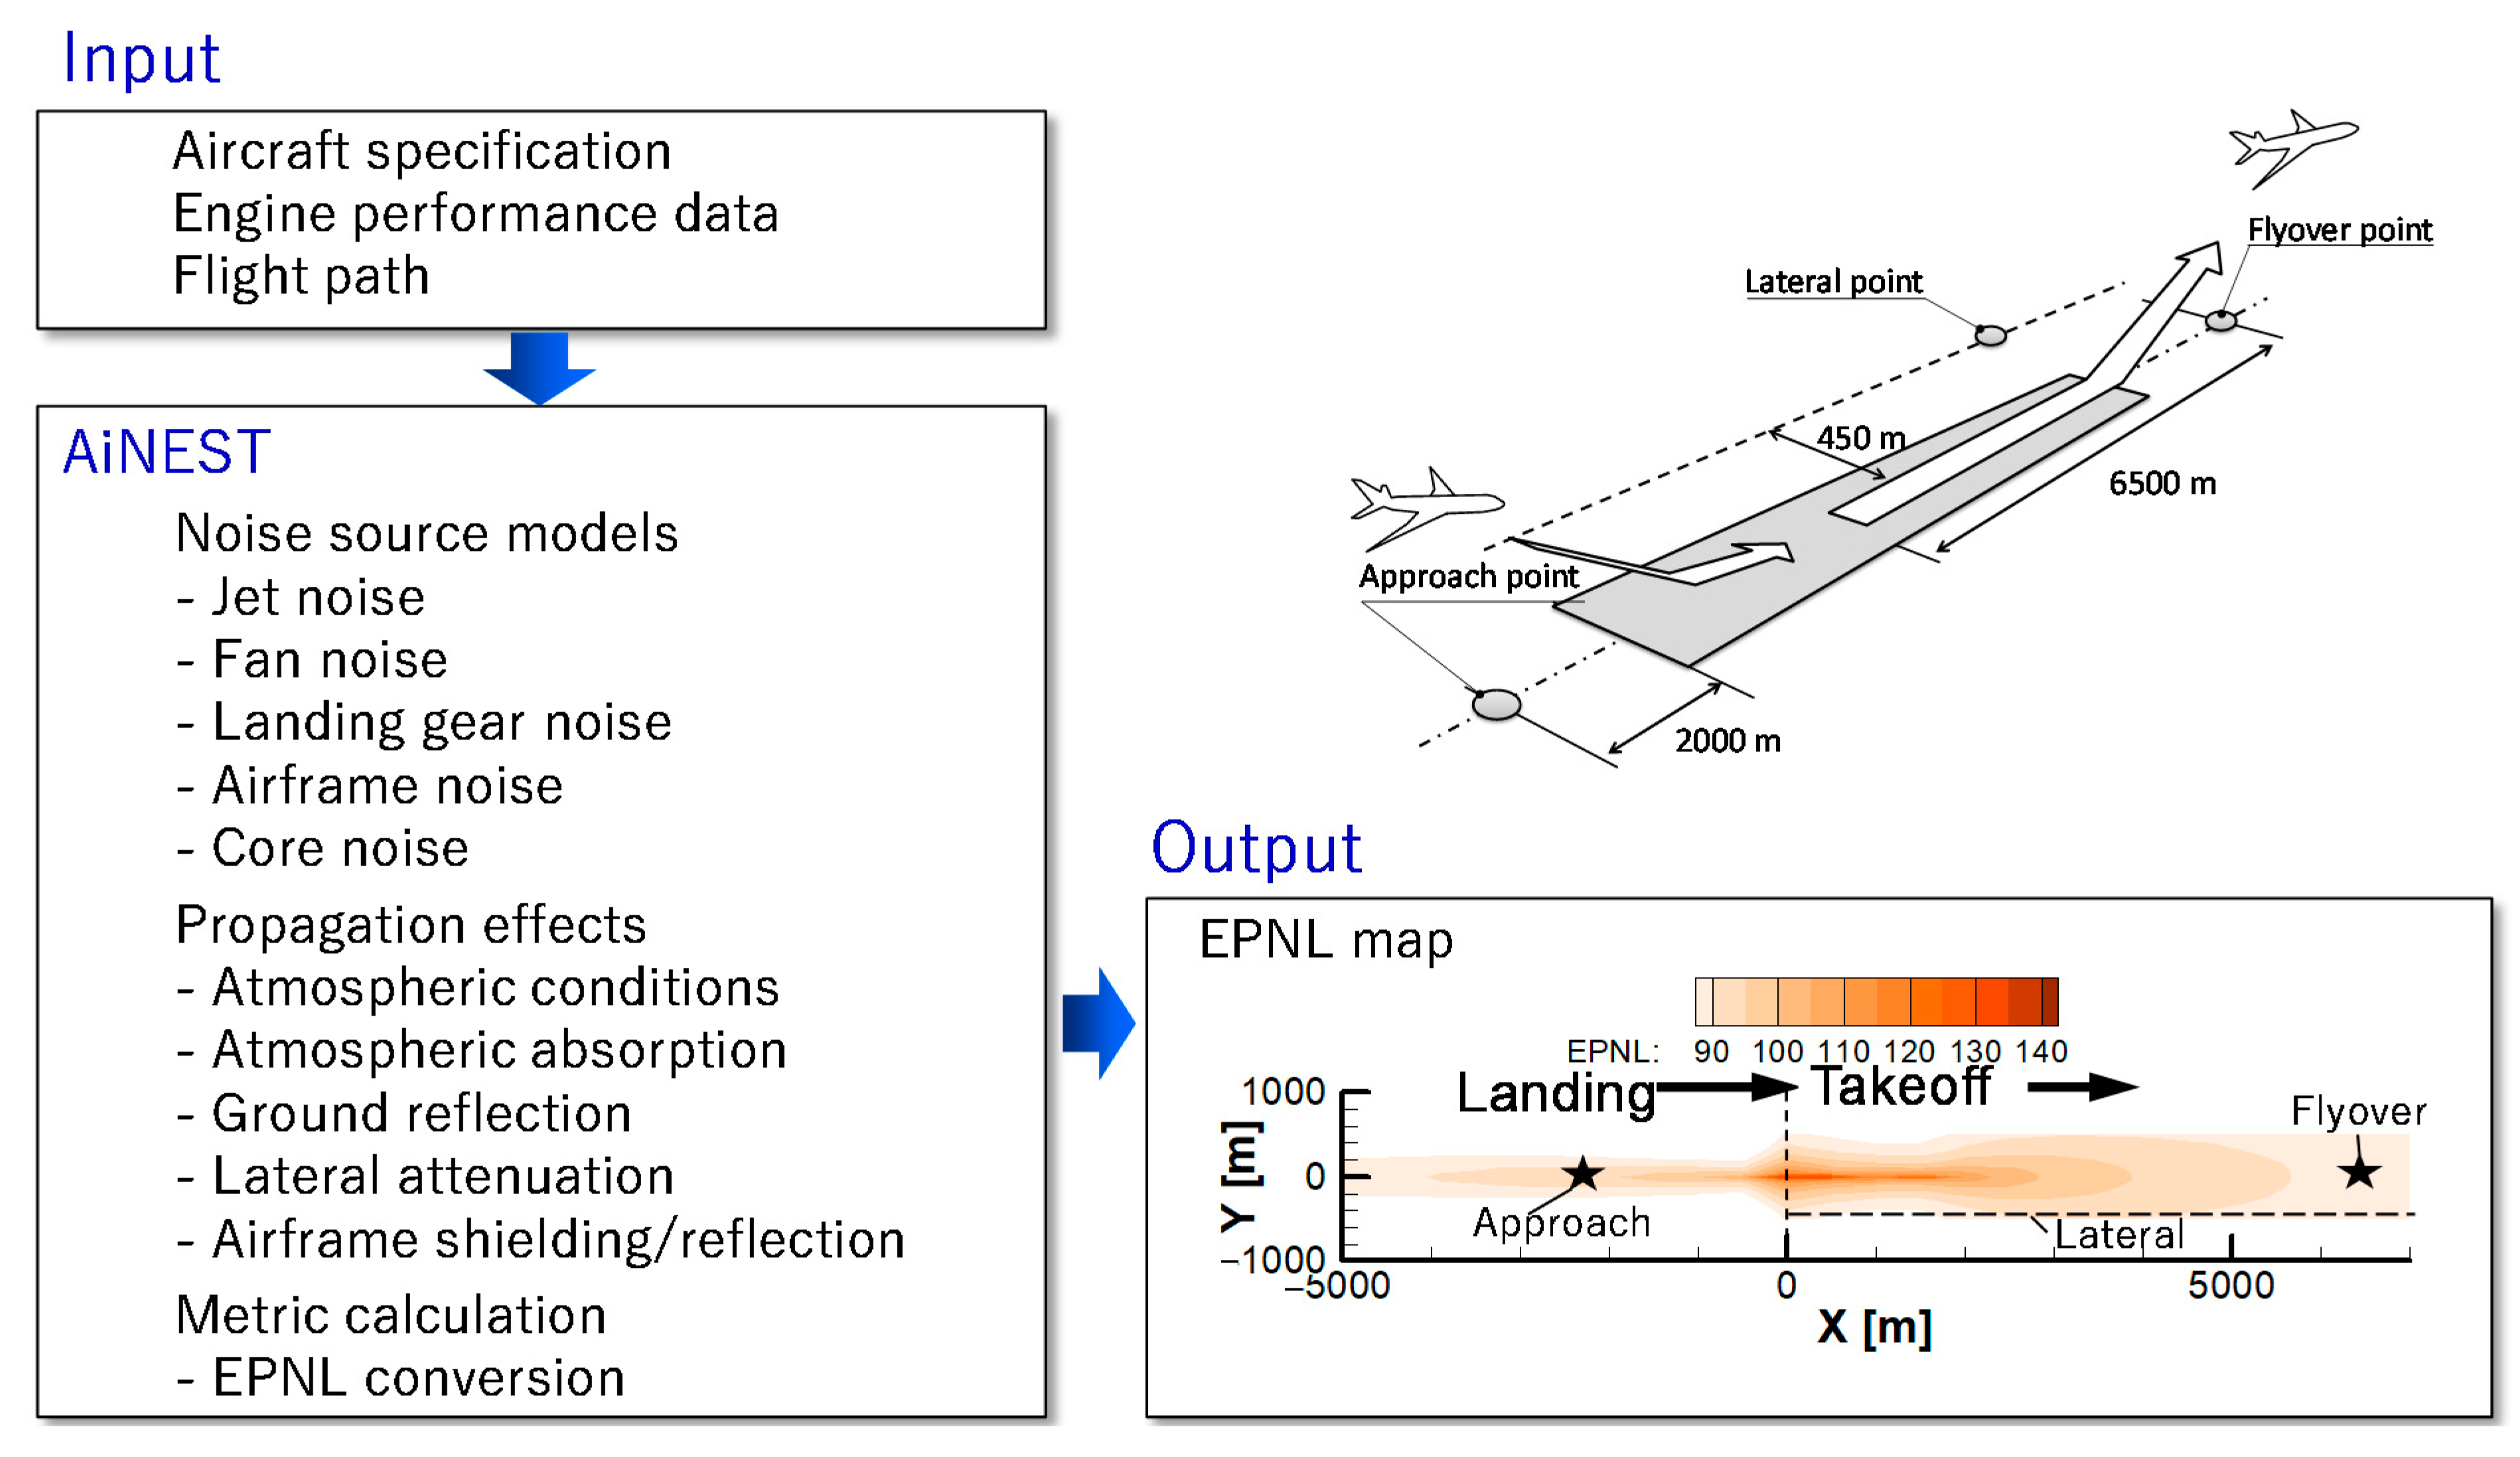
2.3. LTO Noise Prediction Tools and Input Data

AiNEST [14], developed by JAXA, is a semi-empirical prediction tool for LTO noise. An outline of this tool is shown in Figure 2. It is a software package that predicts the noise level of an entire aircraft from each noise source component and propagation effect based on semi-empirical or theoretical models. The inputs are flight trajectories, aircraft specifications, and engine operating conditions, and the outputs are the time histories of the tone-corrected perceived noise level (PNLT) and effective perceived noise level (EPNL) at the locations specified in the input.
The noise sources and propagation models used are listed in Table 2. To clarify the difference between the results of the prior noise predictions made by NASA, a configuration similar to that of NASA’s ANOPP [17], used in Ref. [11], was selected for our tool, and the differences are clarified herein.
The first difference is in the jet noise prediction model. The LTO noise of a supersonic aircraft is dominated by jet noise; therefore, verifying its sensitivity to the selection of the jet noise model is important. The jet noise model used in this study was based on SAE ARP876 [18]; however, several modifications were implemented in the original model. The model was adjusted to our rig and the engine test data previously conducted, and calculations of the forward flight effects of jet noise were performed based on Viswanathan’s model [19]. Another difference was in the selection of the airframe noise model. We used the original Fink model [20] without any special correction for supersonic aircraft. The prediction method for the fan noise shielding effect was also different from that used in a previous study. The shielding effect was predicted by ray-tracing using the Maekawa method [21] for a given plane form. Only the shielding effect of fan inlet noise by the main wing was considered in the STCA study. Fan treatment was considered based on the GE model [22]; however, a few modifications were performed by NASA in the STCA study, and their results were used to predict the fan treatment effect. Based on the differences from prior NASA studies, the uncertainty models for jet noise and fan noise shielding effects were set independently in this study. These were determined based on the results of our validation tests, which are described in the following sections.
The specifications of the aircraft and engine operating conditions as input values were provided by NASA. The noise abatement takeoff procedure, called the advanced takeoff procedure, is examined in this study. An advanced takeoff procedure was proposed by Berton [10,11]. It uses a 10% PLR and high-speed climbout to reduce takeoff noise. Figure 3a–c shows a comparison of the trajectory, flight velocity, and engine thrust for the conventional standard takeoff procedure and advanced takeoff procedure. Notably, this takeoff procedure is not allowed for use in contemporary noise certifications for subsonic airliners; however, the newly announced notice of proposed rule-making (NPRM) from FAA [23] allows the use of this procedure. Prior studies [11,15,16] have clarified that this procedure is effective in reducing the noise impact of supersonic aircraft.
Table 2. Noise source models and propagation models.
ComponentJAXA AiNEST [14]NASA ANOPP [11]
Jet noiseModified SAE methodSAE method [20]
Fan noiseGE-Heidmann method [24]GE-Heidmann method [24]
TreatmentModified GE method [22]Modified GE method [22]
Core noiseEmmerling method [25]Emmerling method [25]
Airframe noiseFink method [20]Modified Fink method
Atmospheric
absorption
ISO 9613-1:1993 [26]
(ISA + 10 °C, 70%RH)
SAE ARP866 [27]
(ISA + 10 °C, 70%RH)
Ground reflectionChien-Soroka method [28]
(Grass-covered ground)
Chien-Soroka method [28]
(Grass-covered ground)
Lateral attenuationSAE AIR 5662 [29]
(Fuselage-mounted engines)
SAE AIR5662 [29]
(Fuselage-mounted engines)
Shielding effectRay-tracing + Maekawa method [21]Maekawa diffraction method [30]

3. Component-Based Validation

To investigate the difference between our predictions and previous studies, a validation test was conducted for the original acoustic model of jet noise and fan noise shielding, and the predictions were compared with the validation data obtained.

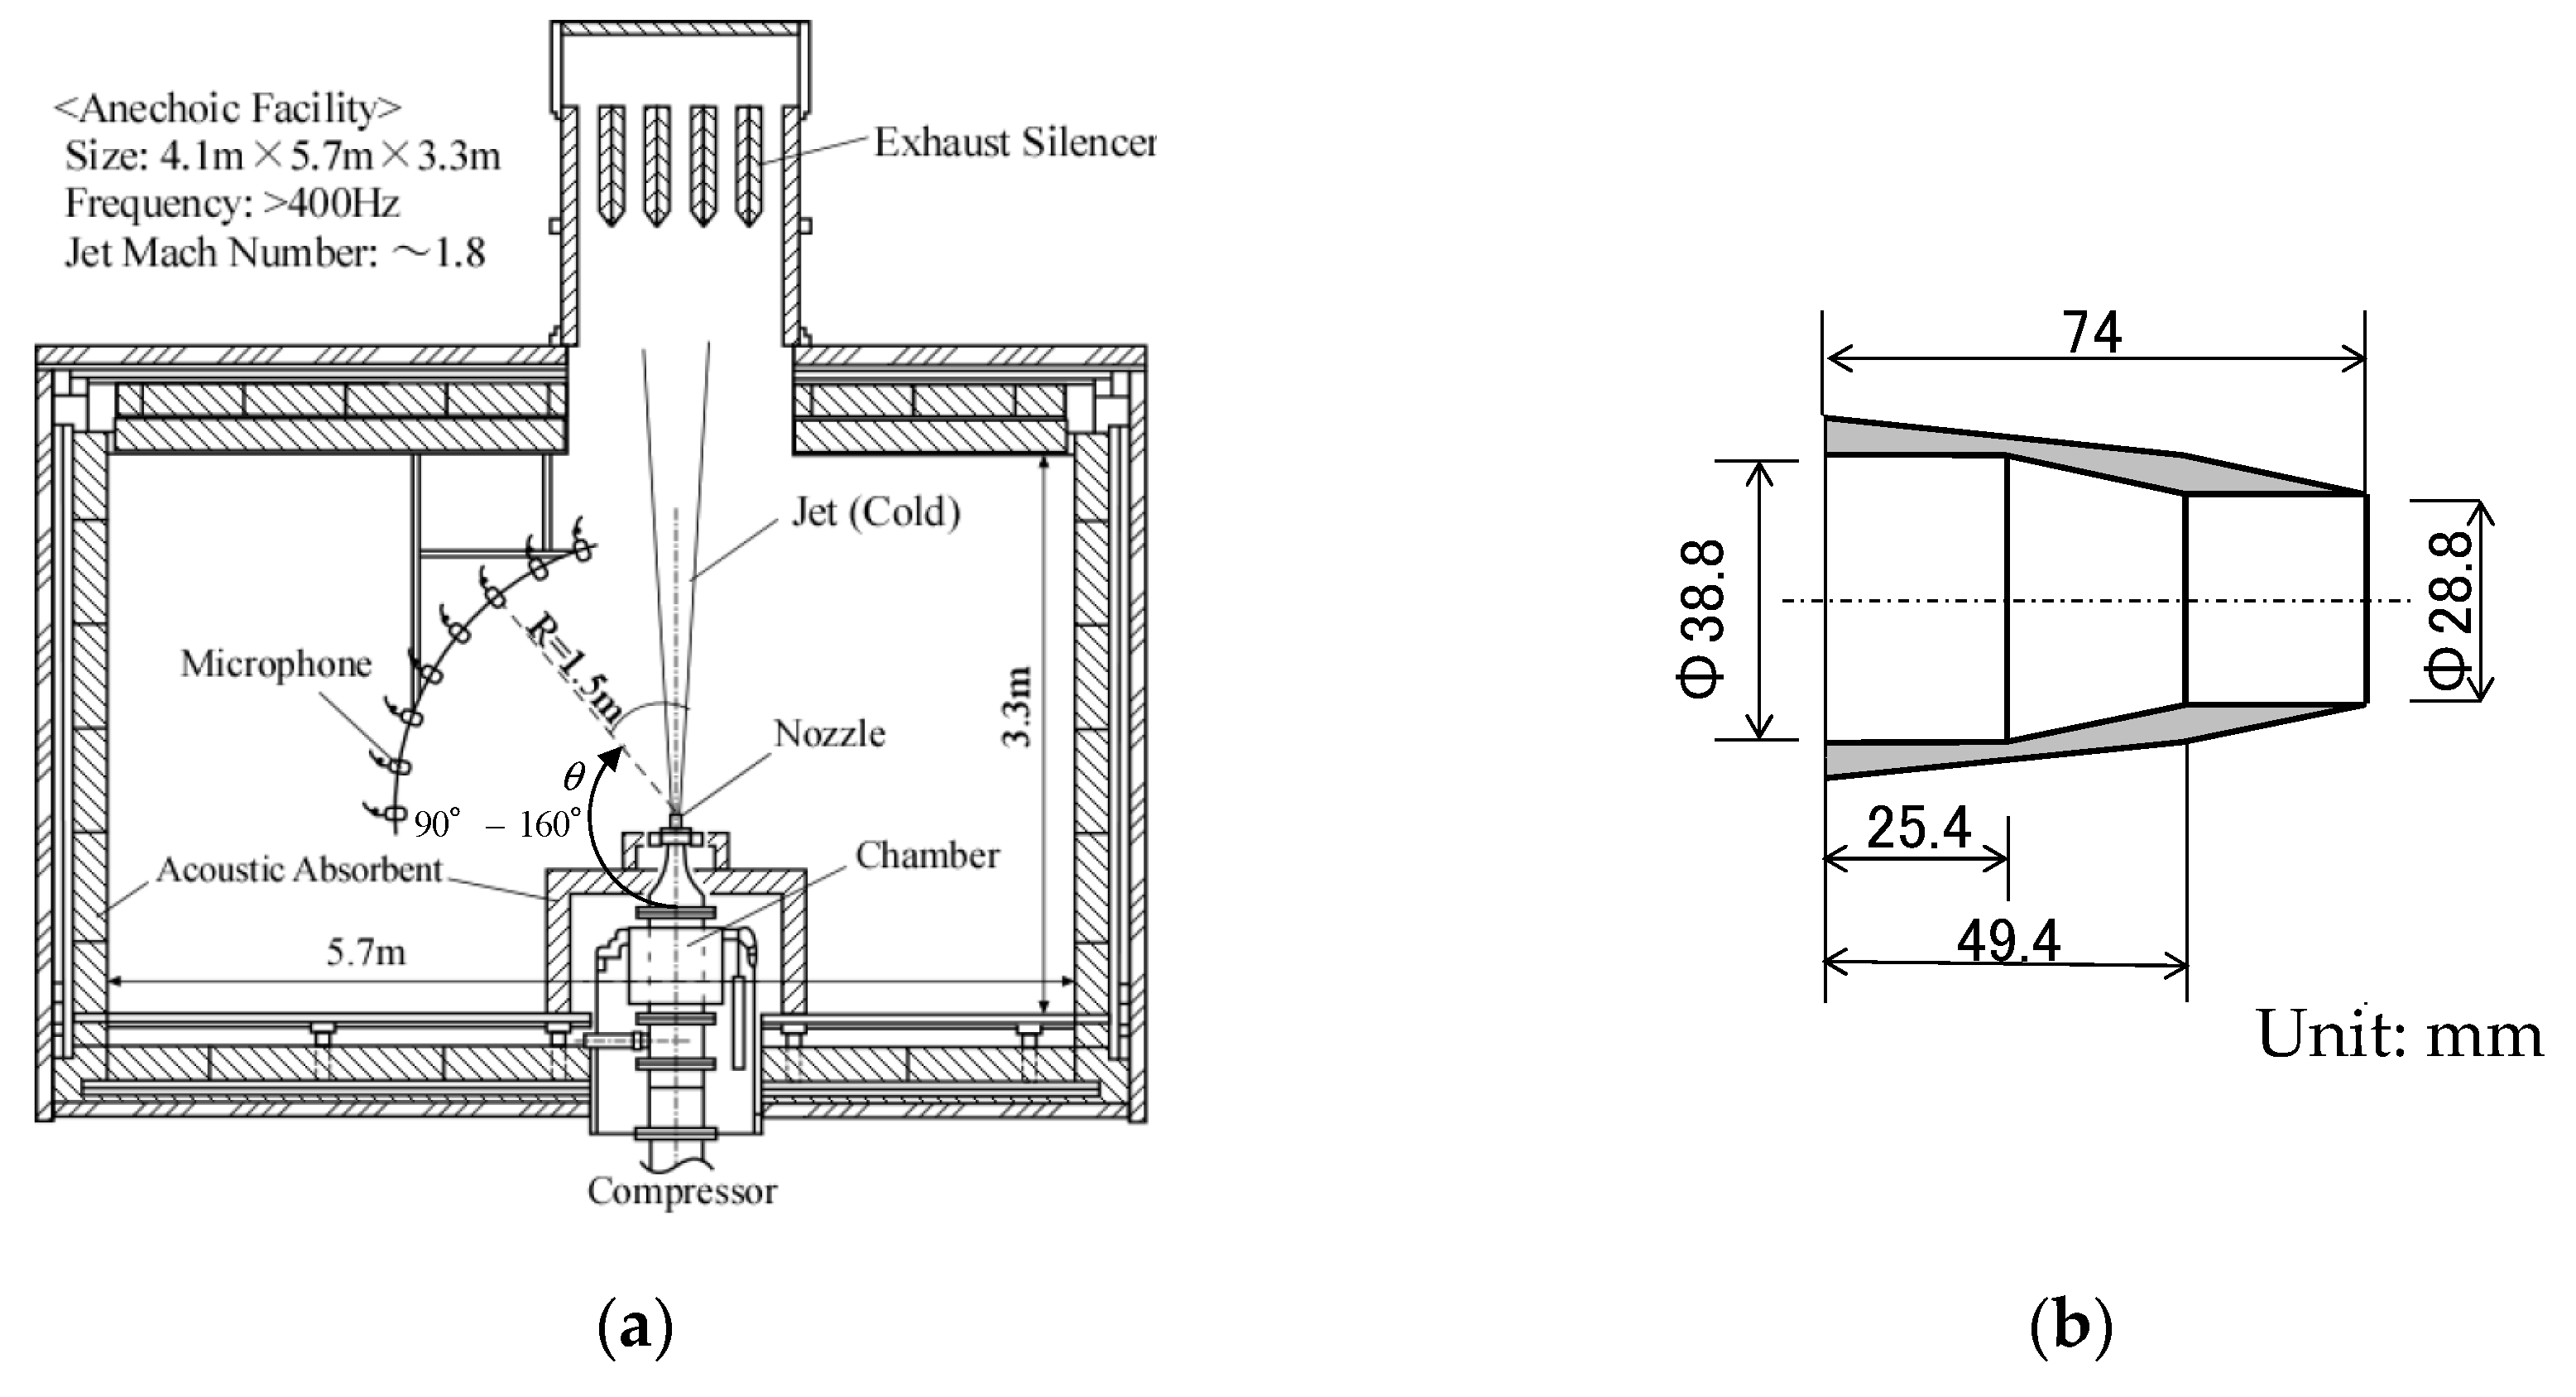
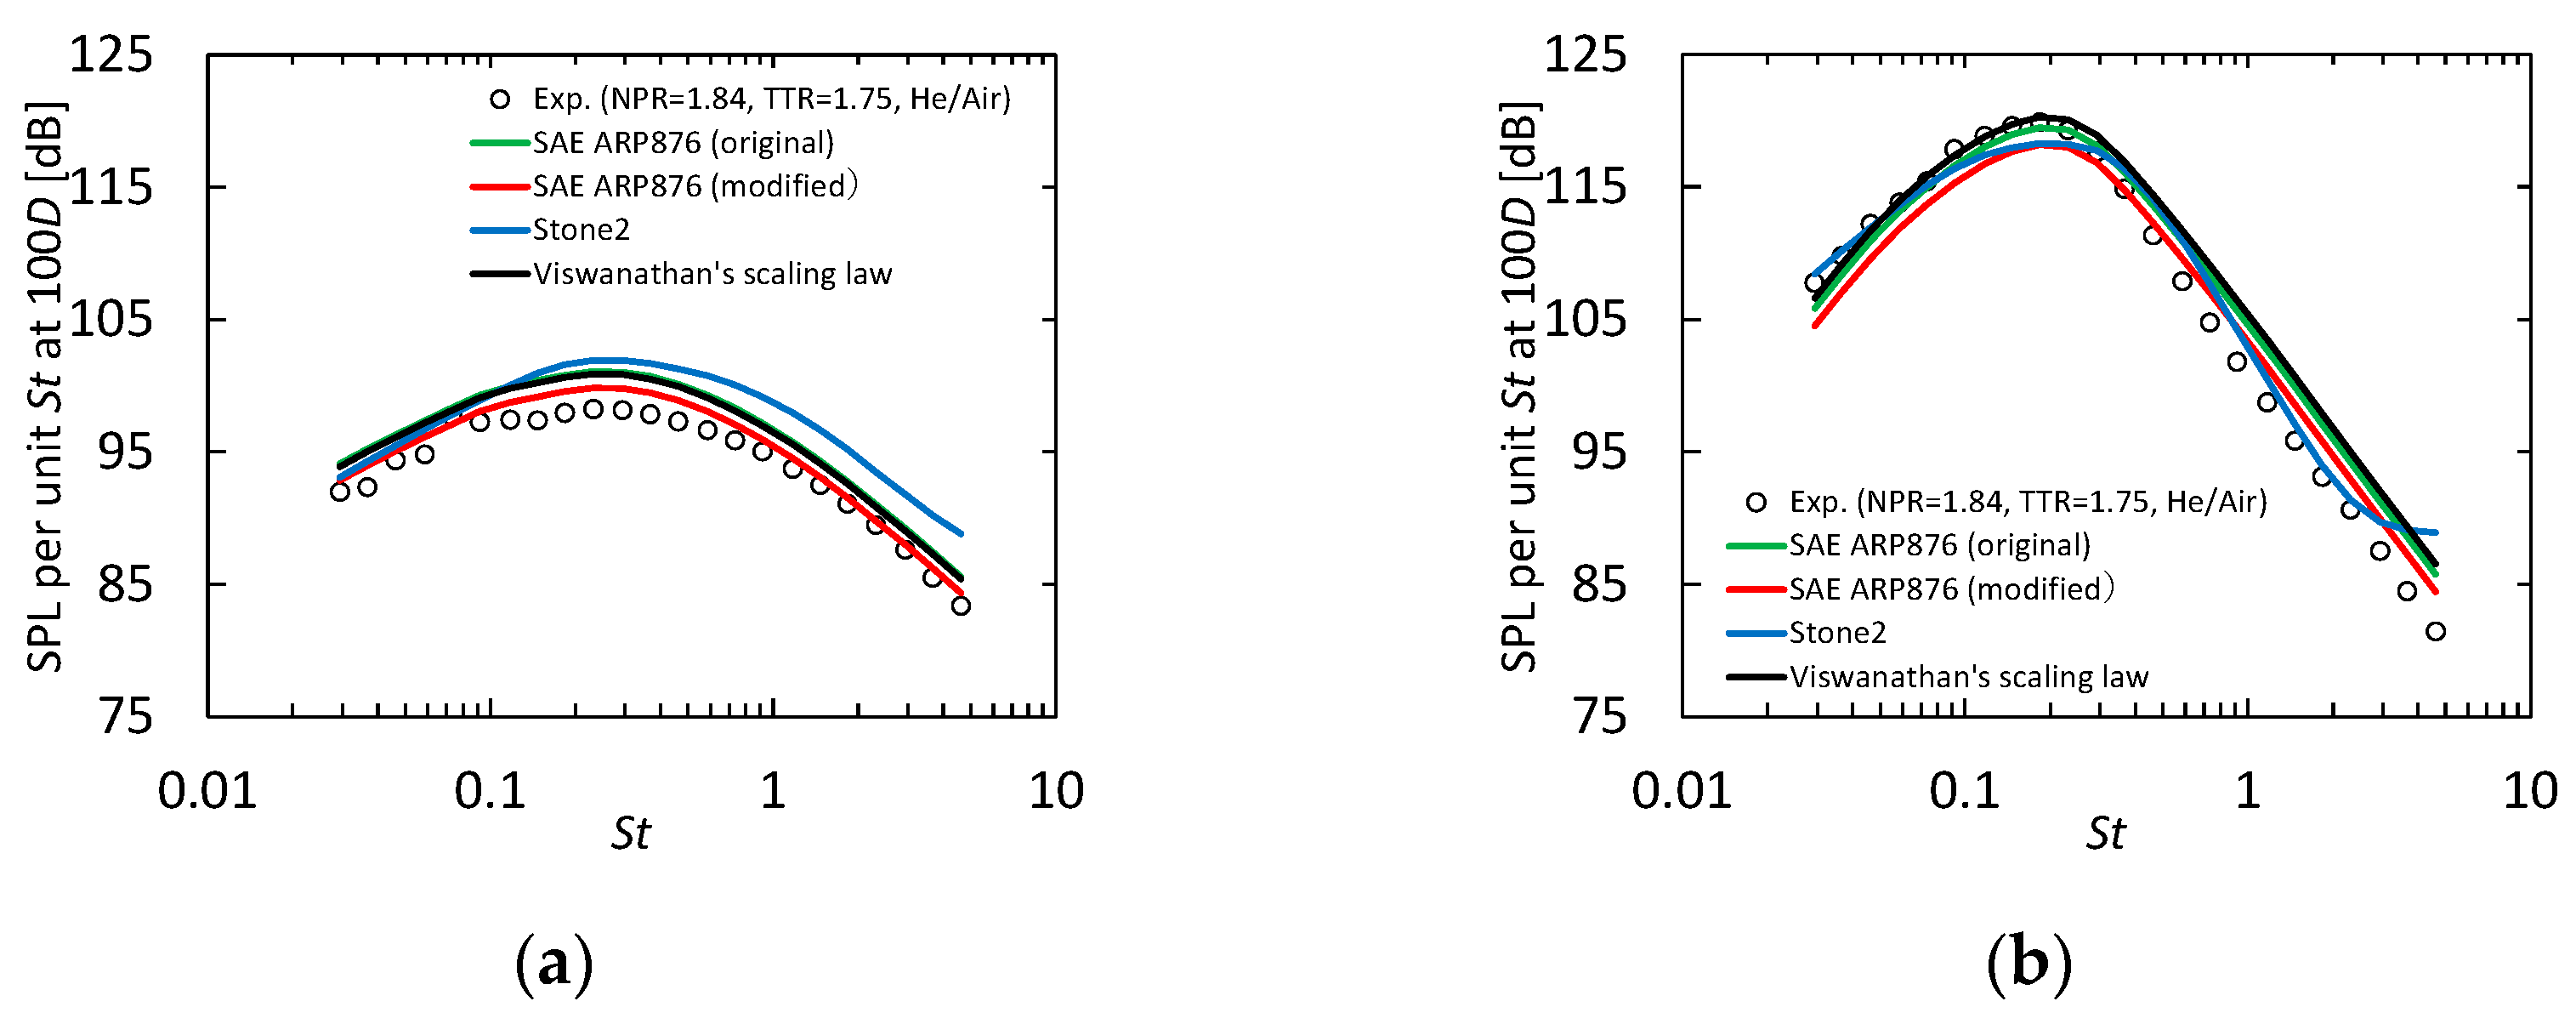
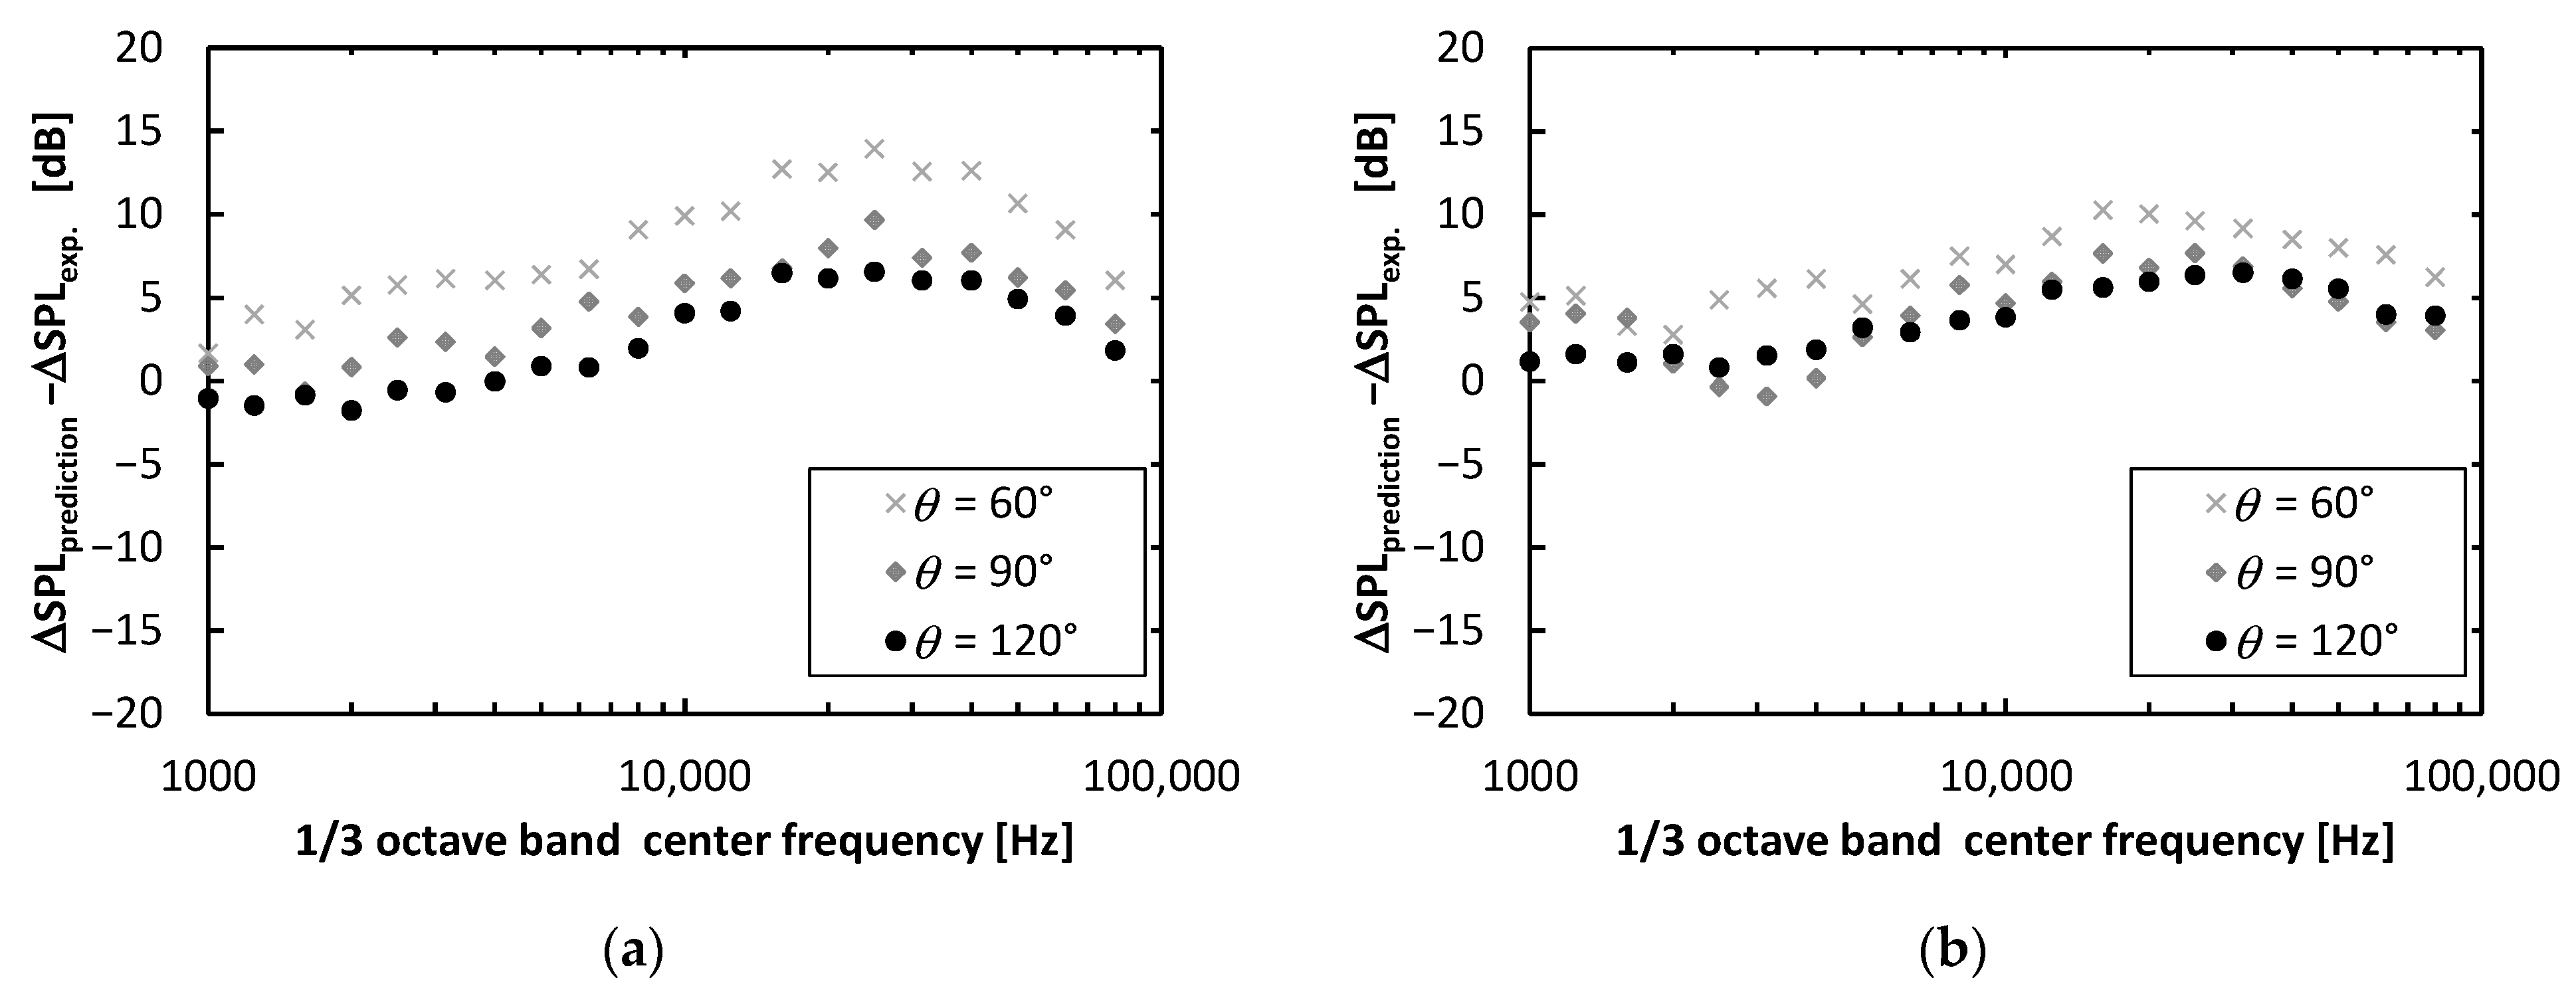
3.1. Scale Model Tests for a Single Heat-Simulated Jet

Acoustic tests using a scaled nozzle model were conducted to validate the jet noise model under the exhaust velocity conditions of the NASA 55t STCA, which are different from those of recent subsonic aircraft equipped with high bypass-ratio engines.
The JAXA jet noise test facility [31], the schematic of which is shown in Figure 4a, was used. The test nozzle was mounted vertically in a 4.1 m wide, 5.7 m deep, and 3.3 m high anechoic room equipped with a settling chamber on the floor. The methodology was based on a prior study performed by Doty [32] and validated using the published jet noise database [33].
The test nozzle is shown in Figure 4b. The nozzle had an exit diameter, D, of 28.8 mm, and it had a convergent configuration of a convergent–divergent nozzle used to simulate a nozzle for a typical supersonic aircraft.
Far-field noise measurements were conducted with an array of eight Brüel & Kjær 4939 1/4-inch microphones arranged in an arc 1.5 m from the nozzle exit at polar angles, θ, from 90° to 160° at 10° intervals. The lower-limit frequency of the anechoic room was 400 Hz. The acoustic data were sampled at 200 kHz for 5 s and obtained through an 80 kHz low-pass filter using a TEAC DS160R data logger. Fast Fourier transform analysis was performed for each 4096-data point and averaged over the entire sampling time. The estimated uncertainties in the 1/3-octave band SPL, including uncertainties associated with the instruments, jet conditions, duration, and sampling rate, were ± 0.47 dB for the heat-simulated jets at 400 Hz, which was the minimum frequency. The SPL data were corrected for atmospheric absorption and each microphone spectral response, and subsequently normalized as SPL per unit St for a reference distance of 100 D.
Figure 5 shows a typical result of the comparisons between the measurements and predictions of the four types of jet noise prediction models, namely, Stone2 [34], SAE ARP876, modified SAE ARP876, and Viswanathan’s scaling law [35]. The jet condition had a jet velocity of 392.8 m/s and a jet total temperature ratio (TTR) of 1.75. The condition was set to simulate the takeoff. The results of the validation tests showed that the modified SAE ARP876 model used in this study and the original SAE ARP876 model used by NASA in previous studies showed good agreement between the predictions and experimental values under the jet conditions covering the STCA takeoff and cutback ratings.
The statistical differences between the predicted and measured SPLs were examined for the jet noise model used in this study. The average difference was approximately 1 dB (over-prediction) at θ = 90°, and less than the measurement uncertainty at θ = 150°. The standard deviation was more sensitive to changes in the jet noise spectral shape, due to the polar angle. The values were 0.6 dB at θ = 90°, and 2 dB at θ = 150°. Further details of the validation test, including other results not described here, can be found in Ref. [36].

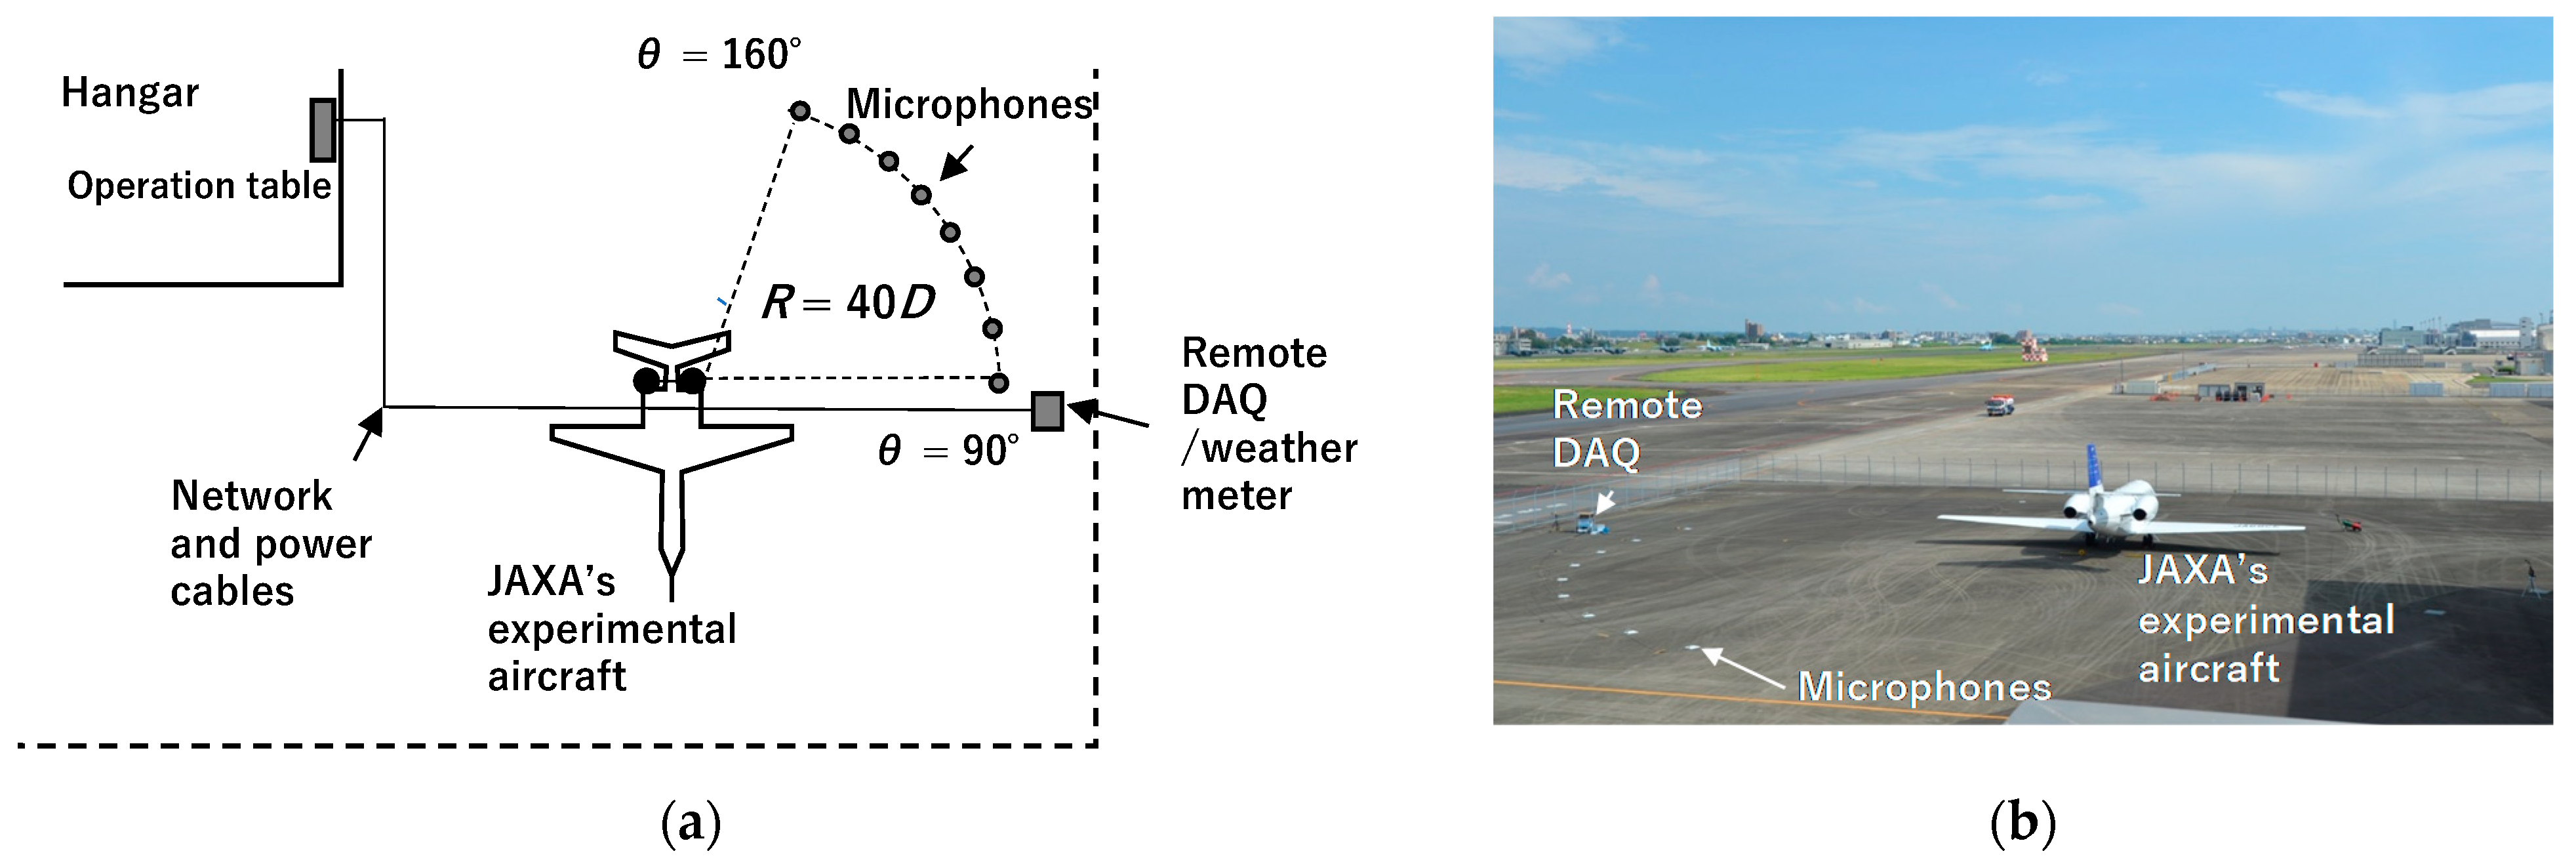
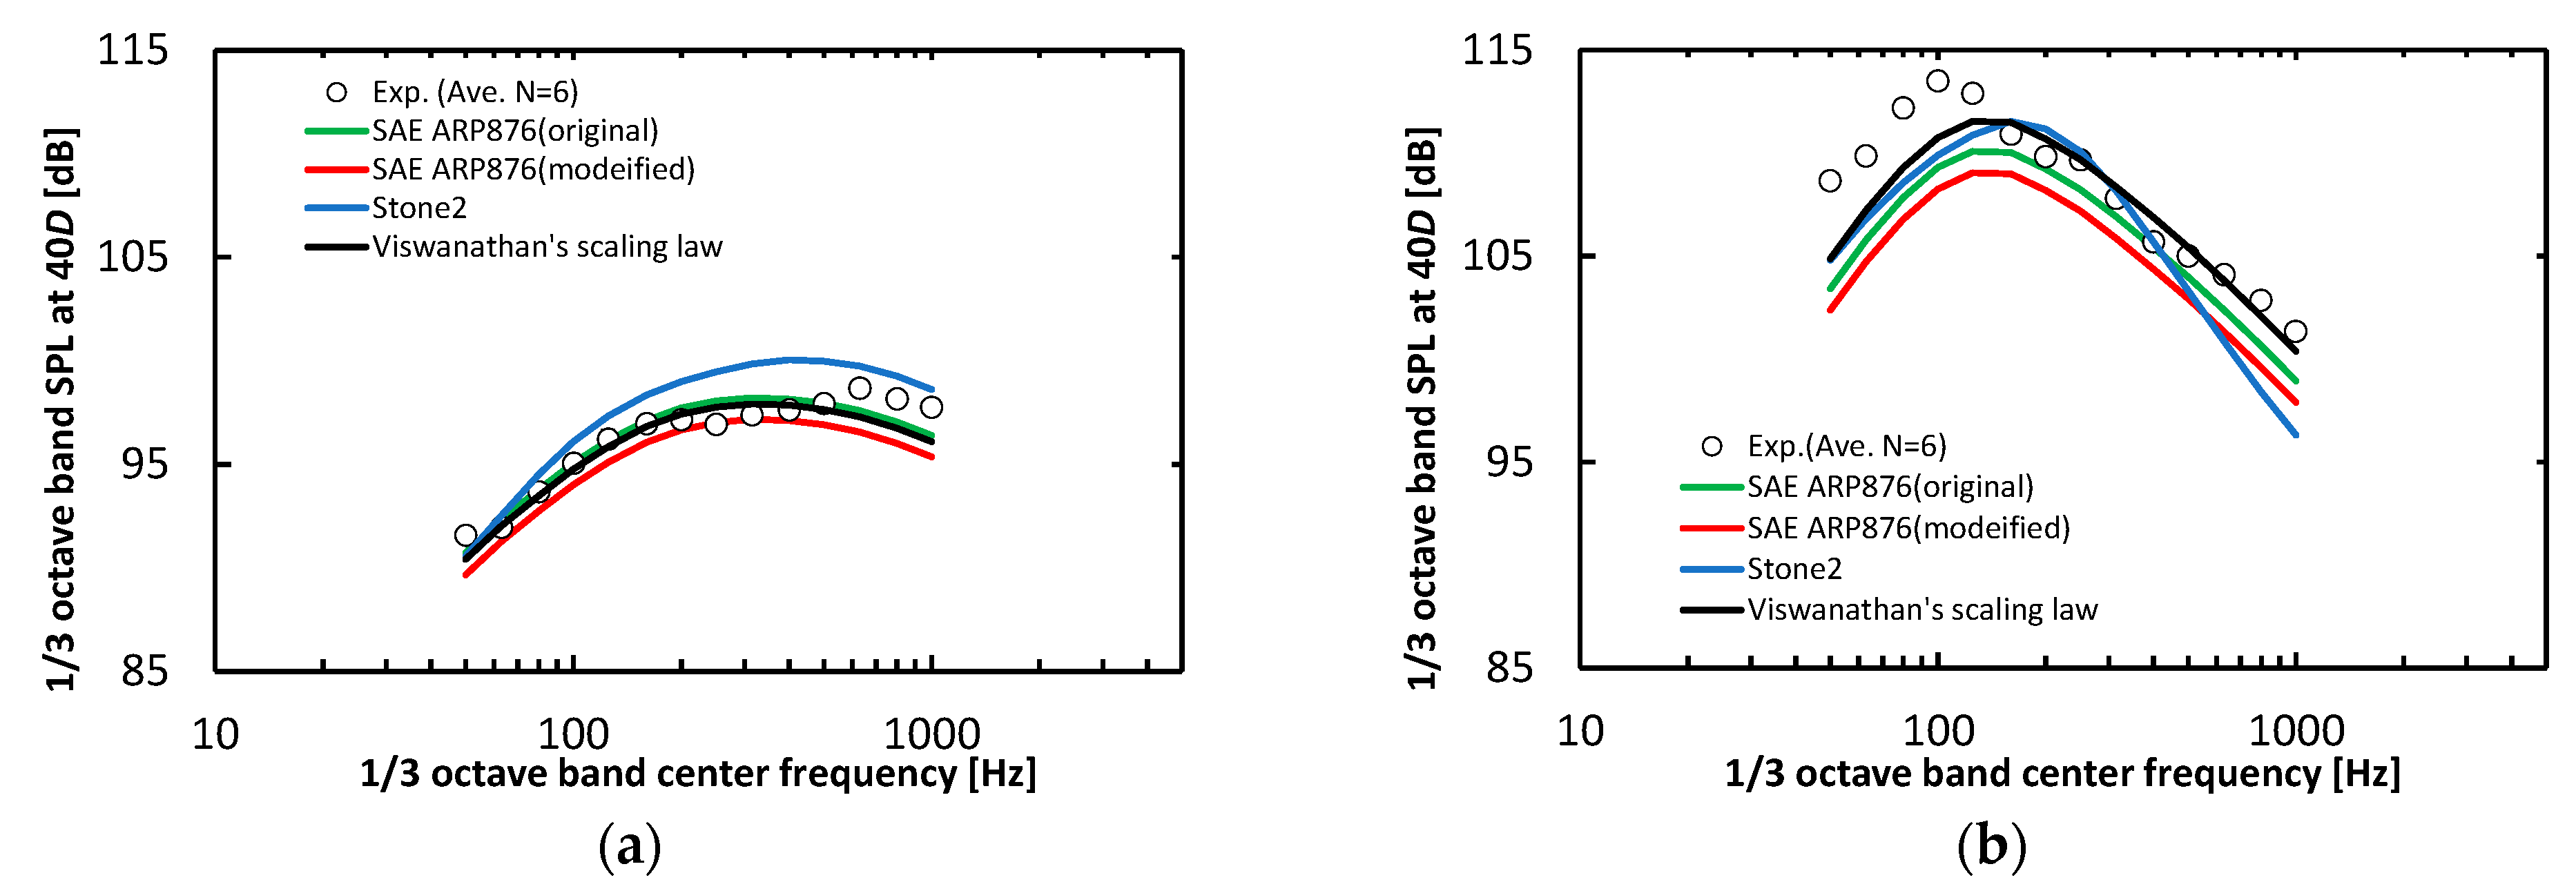
3.2. Ground Noise Measurement Tests Using JAXA’s Experimental Aircraft

Ground noise measurement tests using a JAXA experimental aircraft (Hisho [37]) were conducted at Nagoya Airport Flight Research Center to validate the prediction of the jet noise generated by the engine, similar to that anticipated for use in the NASA 55t STCA. The original aircraft, a Cessna 680, was equipped with two PW306C engines on its rear fuselage. The engine was a two-spool mixed-flow turbofan. The bypass ratio under static sea-level conditions was 4.5.
The layout of the aircraft and measurement system, and a photograph of the test site, are shown in Figure 6. The noise was measured using eight microphones arranged in an arc, which was 40 times the nozzle exit diameter from the nozzle exit of the left engine, at polar angles θ ranging from 90° to 160° at 10° intervals. The microphones used for the acoustic measurements were 1/4-inch pressure-field microphones (B&K4938-L-002 and GRAS40BD). The sampling frequency and time were 102.4 kHz and 20 s, respectively. A 20 Hz high-pass filter was passed through the preamplifier. The estimated precision limit for the averaged SPL based on the results of the repeated tests was less than 0.6 dB.
For safety reasons, the maximum engine rating was restricted to low-pressure spool speed N1 = 95% for single-engine operation. The estimated jet velocity and TTR based on our engine cycle calculation system using the measured FADEC data were 322 m/s and 1.5, respectively, at N1 = 95%. This jet condition was similar to that of the cutback phase of NASA 55t STCA.
Figure 7 shows a typical result of the comparisons between the measurements and predictions of the four types of jet noise prediction models at N1 = 95%. The results showed that the modified and original SAE ARP876 models showed good agreement between the predictions and experimental values at θ = 90°, whereas the models underpredicted the jet noise at θ = 150°. The averaged differences of the modified SAE ARP876 used in this study were 1 dB (under-prediction) at θ = 90° and 2.7 dB (under-prediction) at θ = 150° The standard deviation was 0.8 dB at θ = 90° and approximately 1.8 dB at θ = 150°. Further information on this test can be found in Ref. [36].

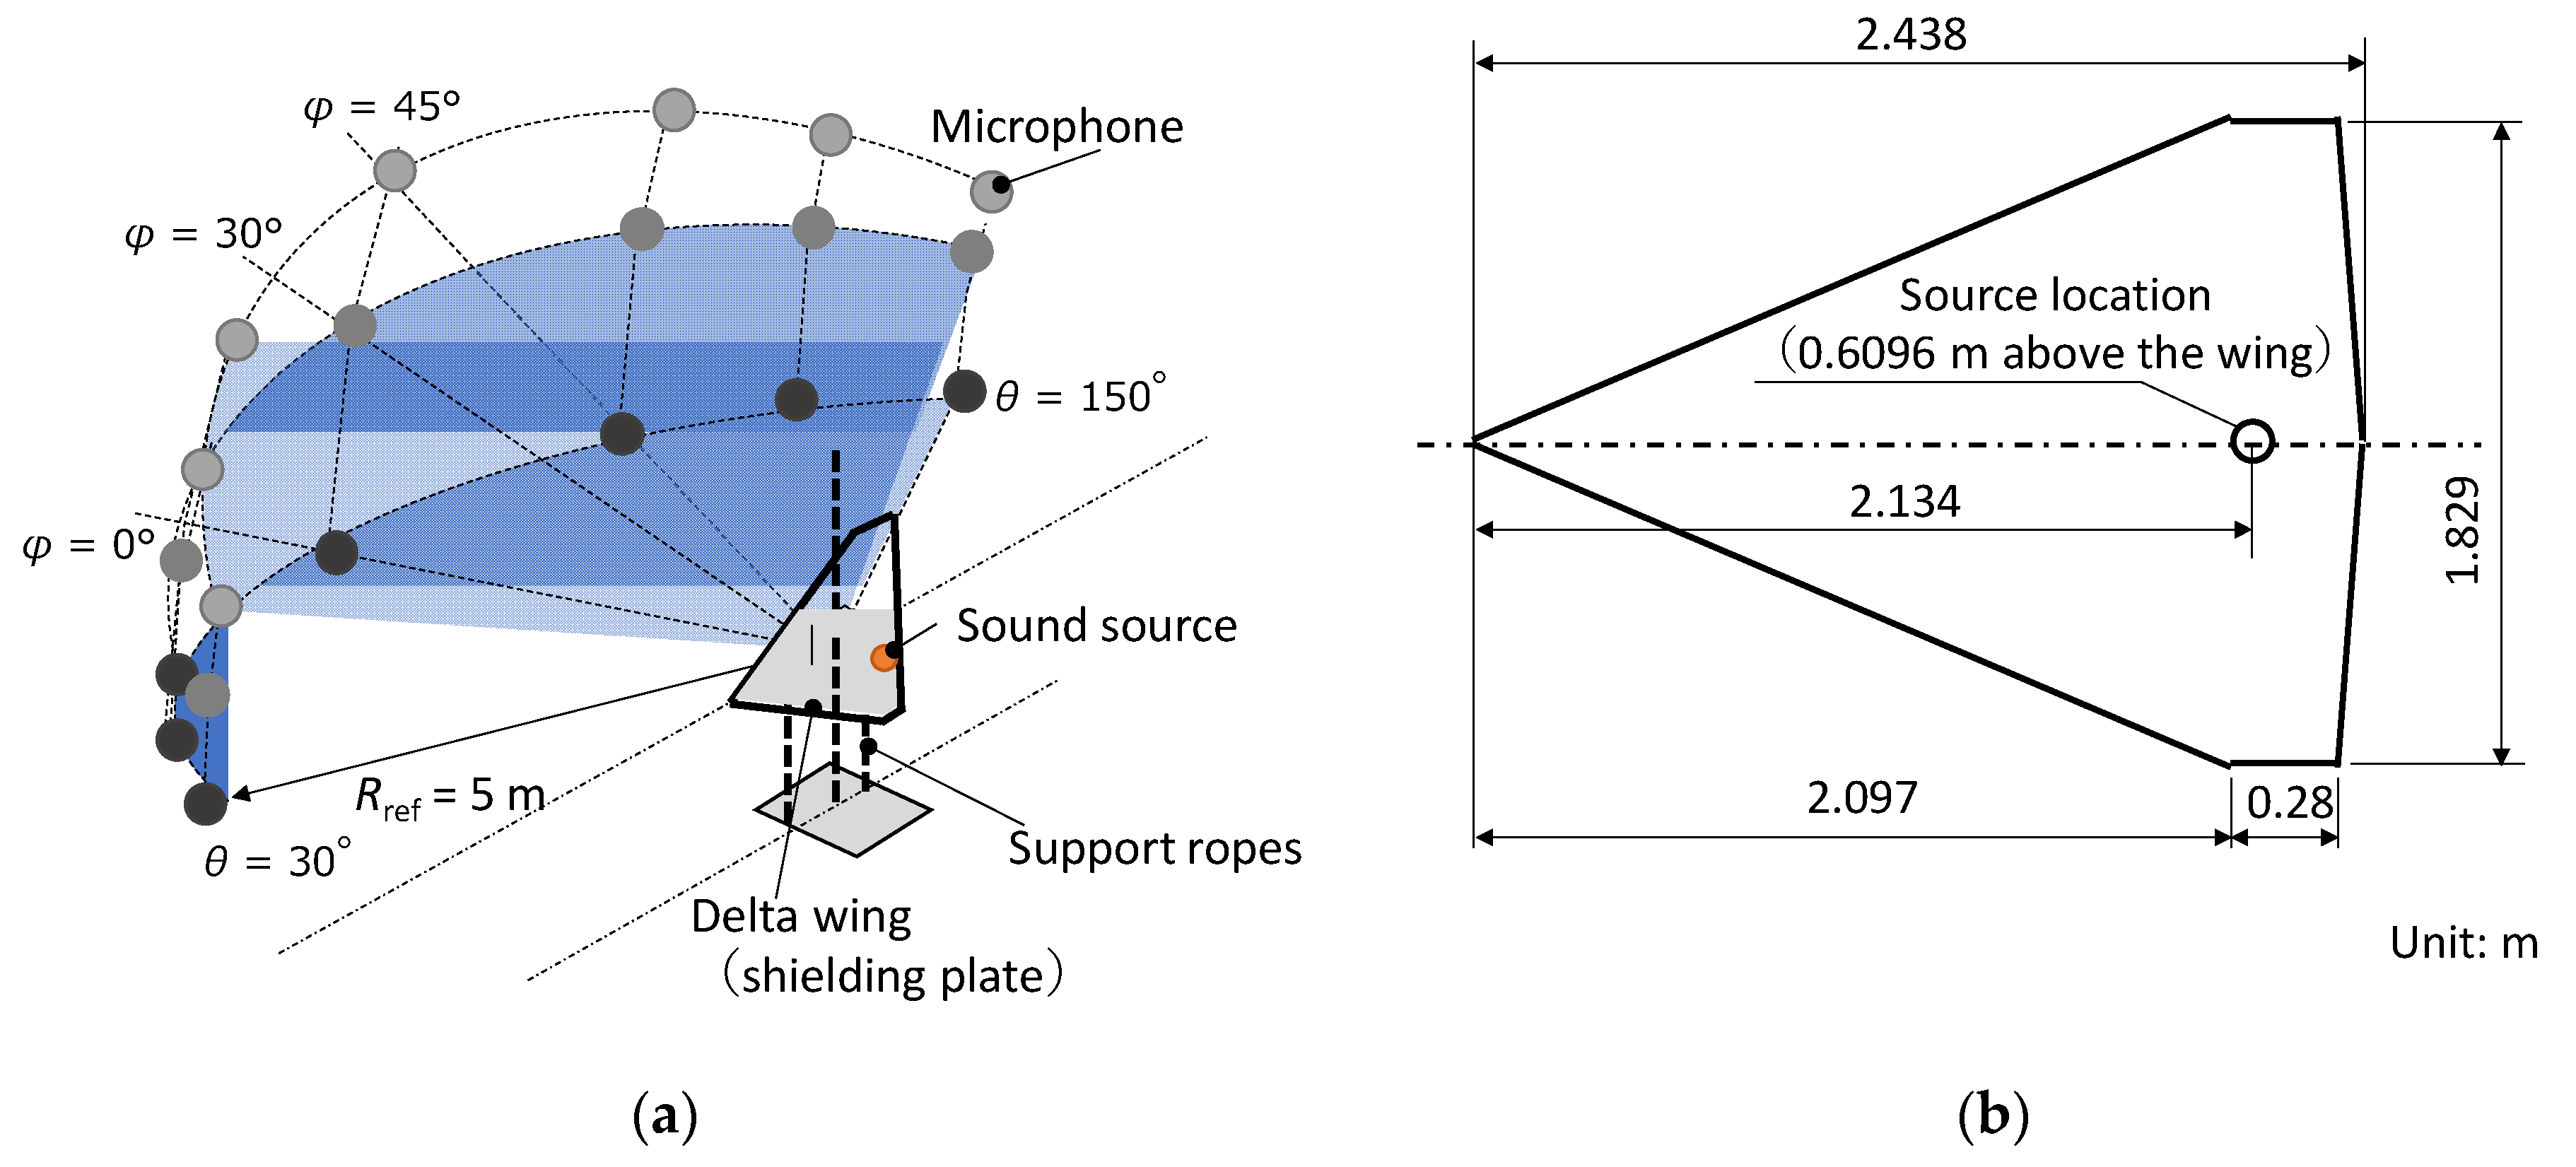
3.3. Fan Noise Shielding Effect

Validation tests of the fan noise shielding effect were performed using a 10% scale delta wing model, which represents the initial planform of the STCA defined by NASA, and a simulated point sound source with high-pressure air. Schematics of the experimental setup are shown in Figure 8. The tests were conducted in an anechoic room (12 m × 12 m × 9 m) at Kawasaki Heavy Industries. The cutoff frequency of the room was 160 Hz. The delta-wing model was made of an aluminum plate with a thickness of 3 mm, and it was supported by ropes from both the ceiling and the floor. Acoustic data were obtained using 21 GRAS 46BF microphones and Brüel & Kjaer LAN-XI 3052-A-030 systems. The data were sampled at 204.8 kHz and evaluated for differences with and without the wing model over the frequency range of 1 kHz to 80 kHz at 1/3-octave-band frequency.
Comparisons between the predicted and experimental results are shown in Figure 9a,b. Prediction using ray-tracing with the Maekawa method can predict the trend of the shielding effect. However, the prediction model overestimated the effect over almost the entire frequency range. The mean difference between the prediction and the measured values over the frequency range was 8.9 dB for θ = 60°, 5.2 dB for θ = 90°, and 3.8 dB for θ =120° at the direction below the aircraft (φ = 0°). Figure 9b shows a comparison of the shielding effects at φ = 45°. A trend similar to that of φ = 0° can be seen at φ = 45°, and the mean difference between the predicted and measured values was slightly smaller than that for φ = 0°.

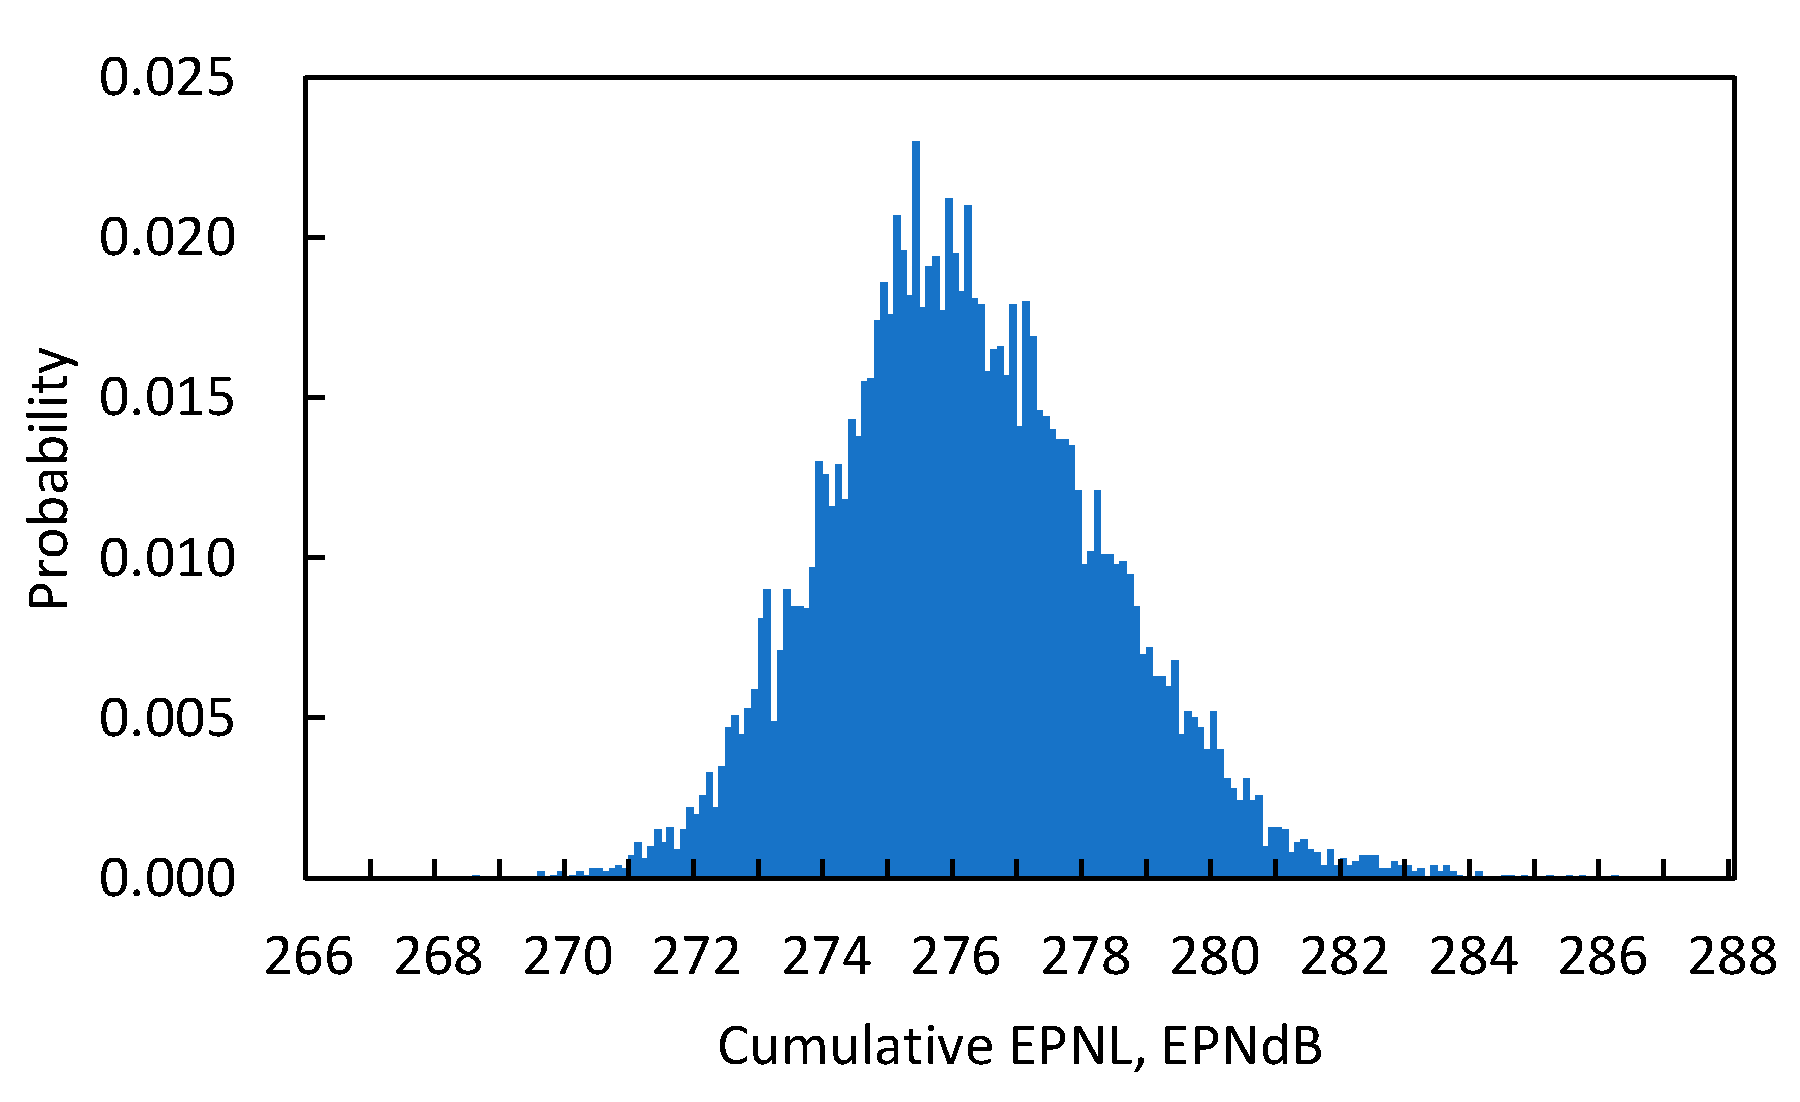
3.4. Uncertainty Analysis of the System Noise Assessment

An uncertainty analysis was performed using a Monte Carlo simulation (MCS) to clarify how much variation could be expected when estimating the LTO noise of a conceptual supersonic aircraft with the best possible effort.
The uncertainty models required to perform the MCS are listed in Table 3. The uncertainty models used were almost the same as those used by NASA in a previous study [11]. The major differences between the previous study and the present study are the uncertainty models for jet noise and fan noise shielding effects, which were determined based on the validation tests described above.
For the jet noise uncertainty model, the results of the tests described in Section 3.1 and Section 3.2 were summarized, and the uncertainty was modeled for each polar angle. For fan noise shielding, the uncertainty was modeled as independent of the polar and azimuthal angles based on the test results described in Section 3.3. Other uncertainty models were based on the values provided by NASA. Note that the analysis focused on the uncertainty of the acoustic prediction model. Uncertainties in aircraft design variables and specifications are outside the scope of this analysis.
The calculations were performed using JAXA’s general-purpose parallel computing system utilizing Monte Carlo simulation [38]. The system can execute the AiNEST in parallel to accelerate the simulation. A total of 10,000 datasets were sampled and used to calculate statistical values for comparison with NASA’s results.

4. Results and Discussions

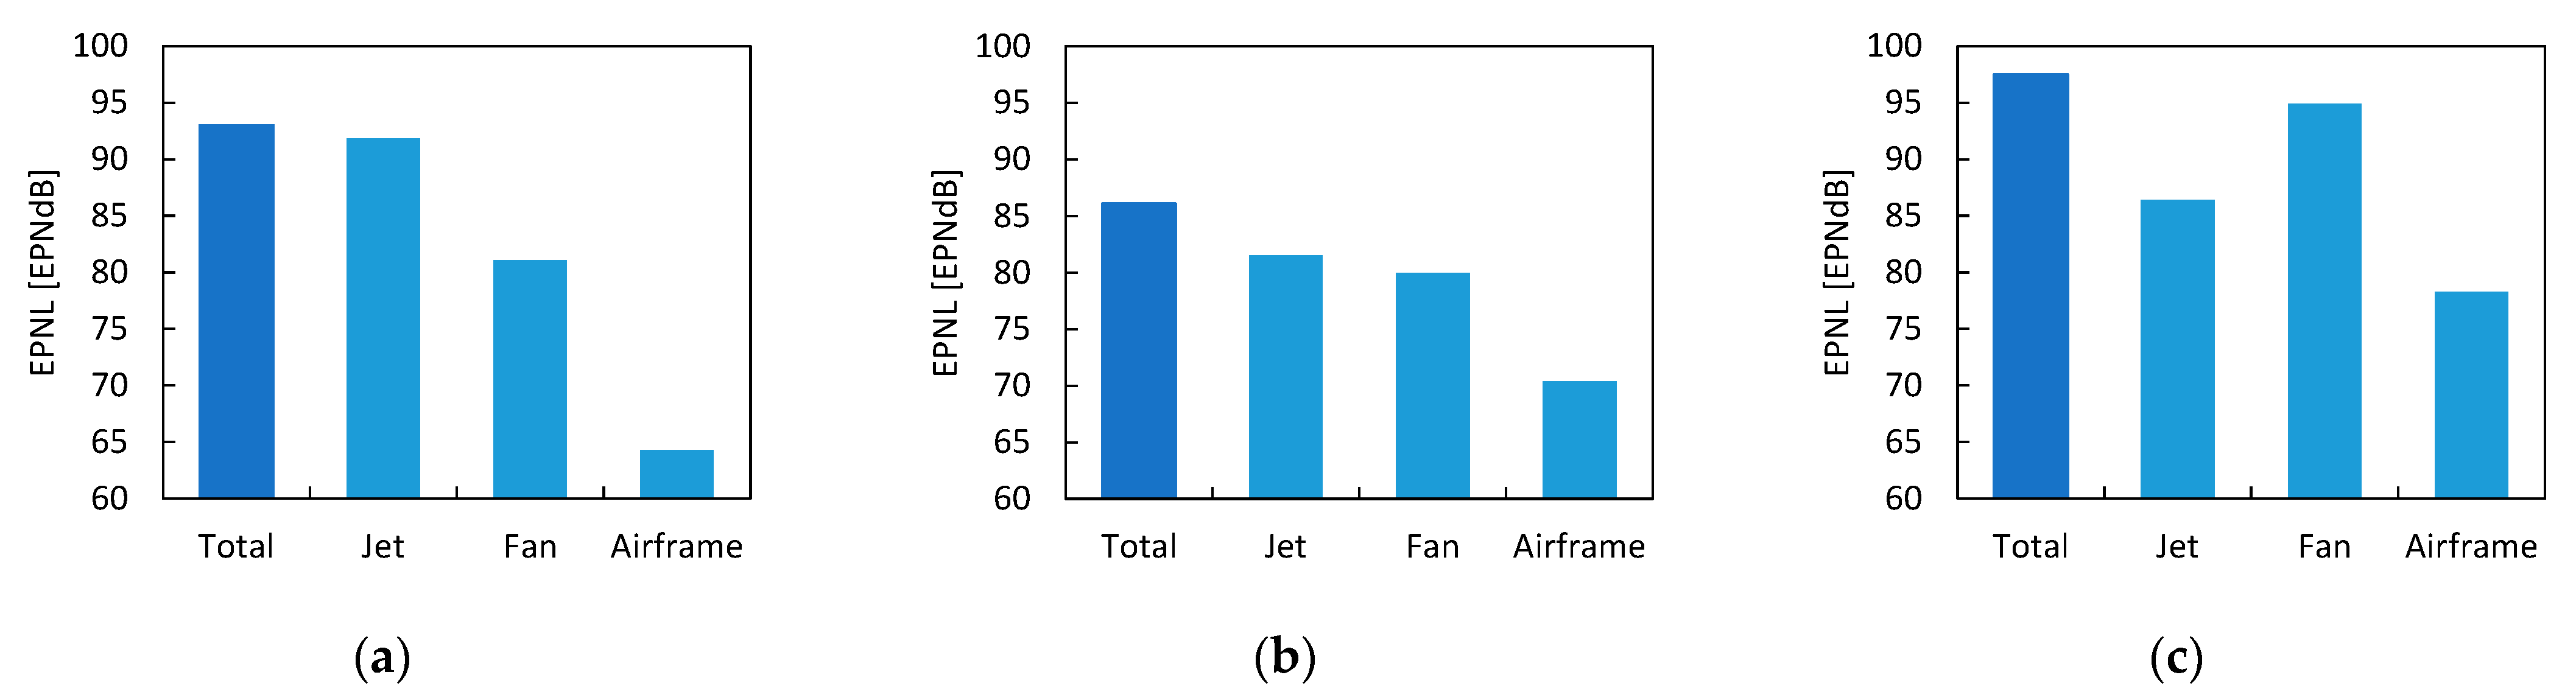
4.1. Results of System Noise Assessment of NASA 55t STCA

The results of the system noise assessment of the NASA 55t STCA in this study are shown in Table 4, in comparison with the NASA results. The predictions for the benchmark case agreed well with those of the NASA. The ranges of the samples were slightly larger than those of NASA for all measurement points, whereas the standard deviations were in good agreement. They were 1.58 EPNdB, 0.56 EPNdB, and 1.11 EPNdB for the approach, lateral, and flyover, respectively. Although there is a difference in the selection of the noise and uncertainty models between the prior study performed by NASA and the present study, there is no significant difference between these two predictions and the statistics. The results of this cross-validation indicate that predictions and their statistics can be reproduced if the prediction model is appropriately selected for the target aircraft.
Figure 10 shows the jet, fan, and airframe noise levels in EPNL at each measurement point. Even with the advanced takeoff procedure, the contribution of jet noise is still large for the lateral measurement point, whereas for the flyover and approach measurement points, other components also have a large impact. This indicates that the small standard deviation of the lateral measurement point in Table 4 is because of the large influence of a single component: jet noise. In terms of the magnitude of LTO noise for supersonic aircraft, lateral measurement points are often considered to be an issue; however, flyover and approach measurement points are more difficult for noise prediction, and many factors need to be considered.
Figure 11 shows a histogram of the predicted cumulative noise. The shape of the histogram is close to a normal distribution, and there is no large degree of skewness or any outliers.

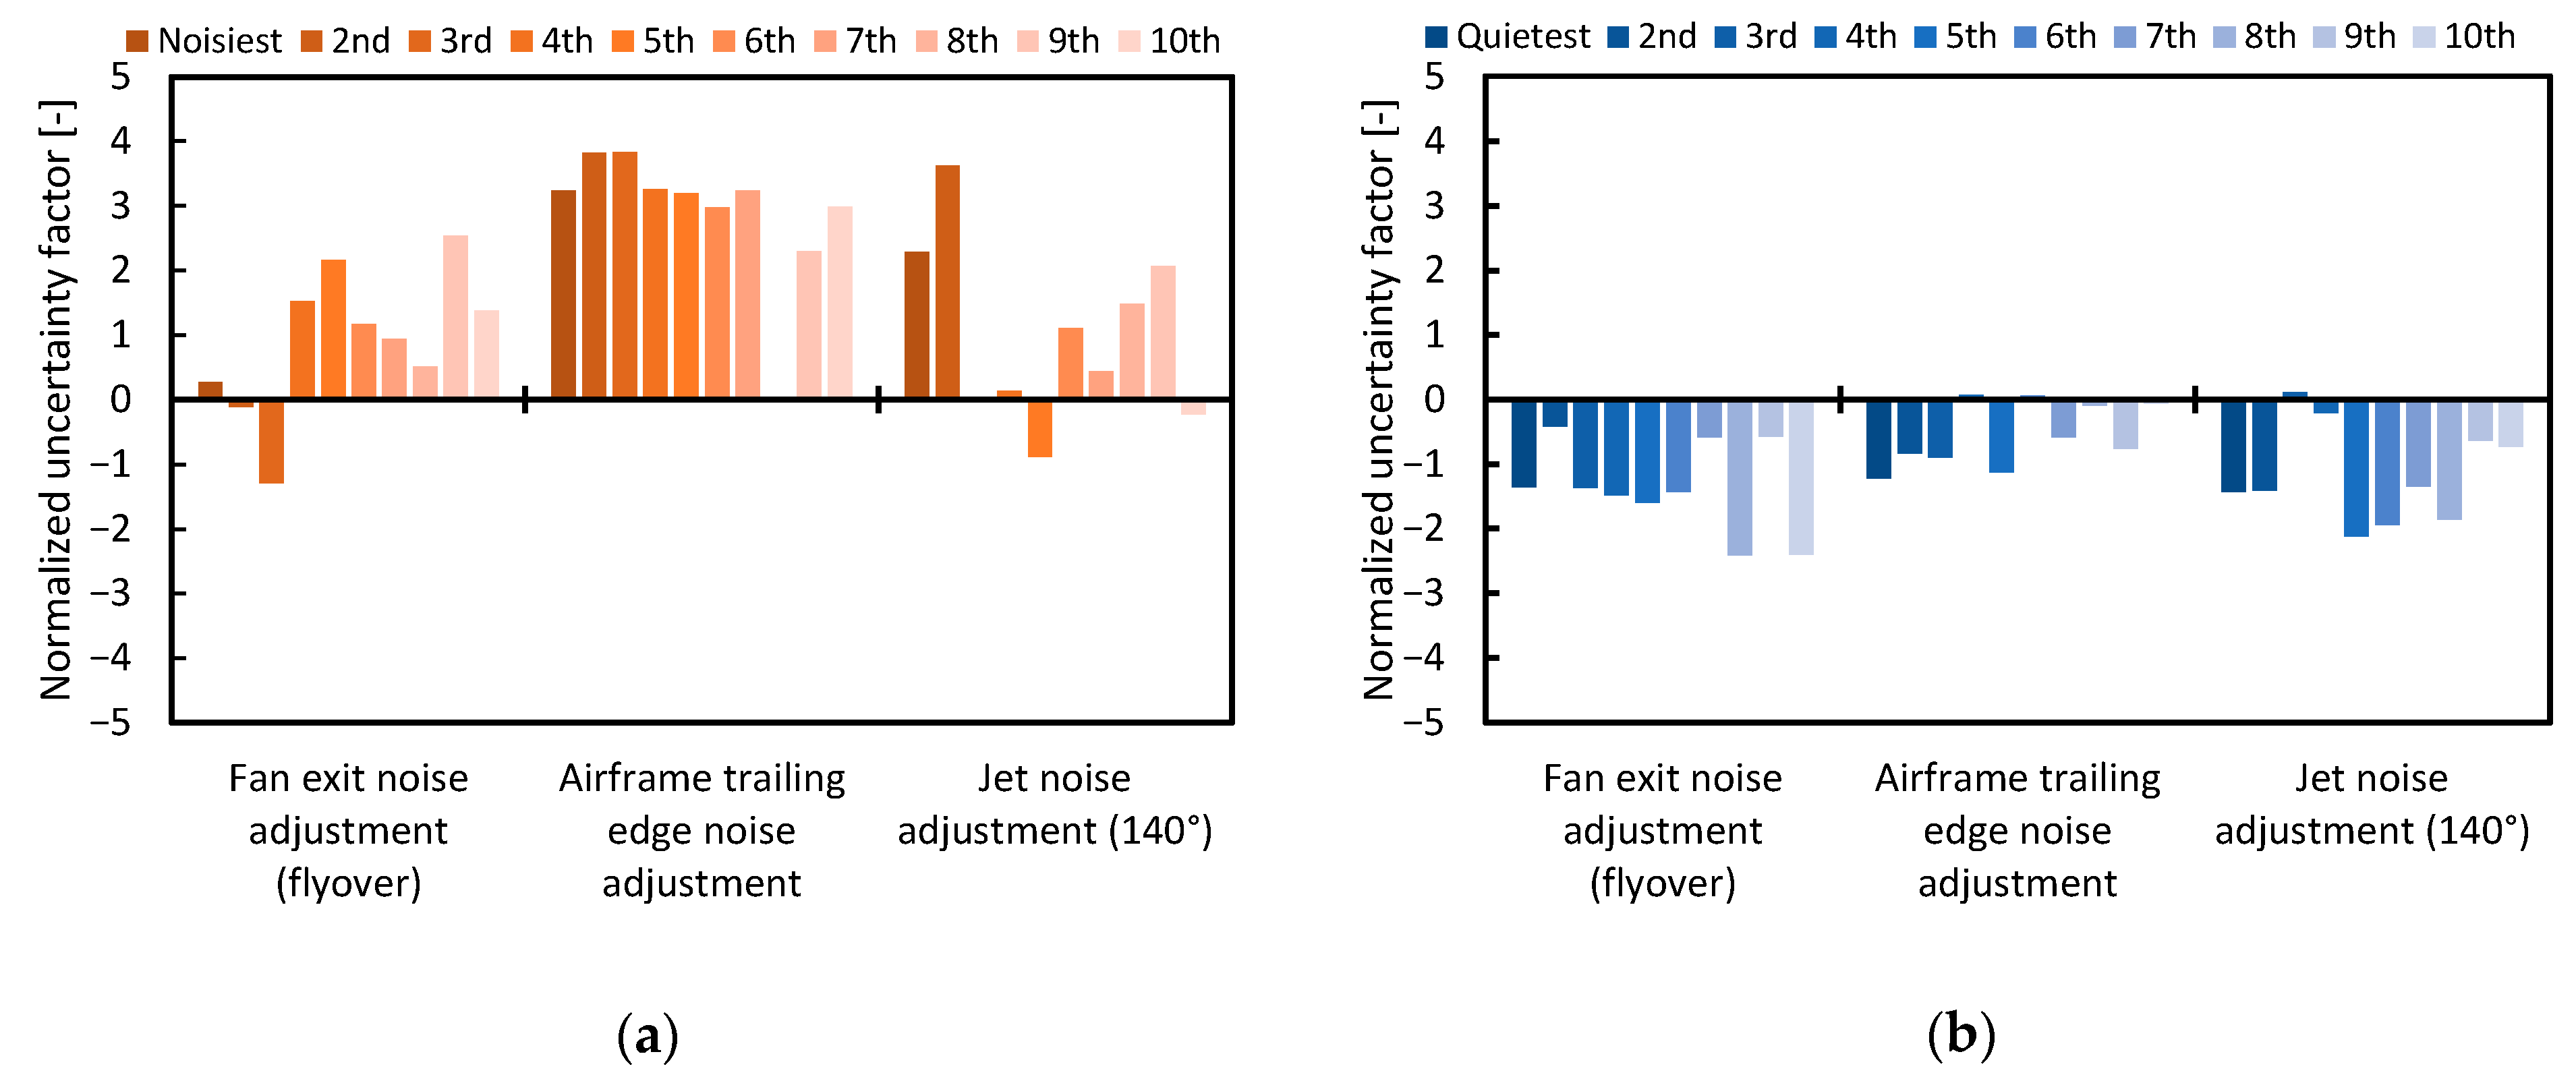
4.2. Sensitivity Analysis and Discussion

A sensitivity analysis was performed based on the noise dataset obtained using MCS. In the analysis, the sum of the lateral and flyover noise levels was used as the explained variable, and a multiple regression analysis was repeated to extract explanatory variables with large correlations. The explanatory variables were each of the factors listed in Table 3, standardized by standard deviation and mean value.
The analysis revealed that the uncertainty of the total jet noise, fan exit noise during the flyover, and airframe trailing edge noise were identified in the order of the strongest correlation. In addition, when the correlation was analyzed for each polar angle of jet noise, a larger correlation was observed at a polar angle of 140°.
Figure 12a shows the values of the top three explanatory variables for the ten cases with the highest takeoff noise, and Figure 12b shows those for the ten cases with the lowest takeoff noise. Both figures clearly show that these three factors are correlated with takeoff noise levels.
Jet noise is a significant factor in the takeoff noise of supersonic aircraft, which have lower bypass ratio engines than recent subsonic airliners, which also support this feature. The strong correlation with jet noise at a polar angle of 140° can be explained by the directivity of the jet noise and the change in distance to the observer. This point should be considered in the design of jet-noise reduction devices.
The strong correlation with the fan exit noise at the flyover measurement point might be because the effect of the jet noise was relatively weakened by the cutback thrust over the flyover measurement point shown in Figure 10b, and shielding was assumed only for the fan inlet noise for the aircraft configuration of the NASA 55t STCA. This also implies that it is important to consider the shielding effect when shielding is assumed. Even if there is a relatively large uncertainty due to the low fidelity of the prediction method, it is recommended to employ the shielding model in the system noise assessment because it has a large impact on the fan noise.
The reason for the strong correlation with the airframe trailing-edge noise is that its directivity does not overlap with jet noise and shielded fan exit noise, and the aircraft is assumed to climb at a high speed due to the advanced takeoff procedure, as shown in Figure 10b. As for the prediction modeling of airframe trailing-edge noise of supersonic aircraft, there is a difference in the correction between the model used in this study and the model used by NASA, although both models originate from the same model. The airframe trailing-edge noise generated by the delta wing during high-speed climbout requires further discussion because there are not enough data to validate this.

5. Summary and Future Work

A system noise assessment of a conceptual supersonic aircraft called NASA 55t STCA and an uncertainty analysis using MCS were performed to investigate the prediction uncertainty of LTO noise and extract key factors to perform a system noise assessment of future supersonic aircraft.
In comparison with the prior study, the predicted noise levels showed good agreement both for the benchmark case and for the statistics of the sampled 10,000 predictions, although there was a difference in the selection of the noise models and uncertainty models between the prior study and the present study. The results of this cross-validation indicate that predictions and their statistics can be reproduced if the prediction model is appropriately selected for the target aircraft. The predicted cumulative noise level satisfied ICAO Chapter 4 noise standard, and its standard deviation was approximately 2 EPNdB.
The sensitivity analysis revealed that strong correlations with the takeoff noise were found for jet noise, fan exhaust noise at the flyover measurement point, and airframe trailing edge noise. Regarding the jet noise, there was a strong correlation between the noise at a polar angle of 140° and the takeoff noise. This should be considered in the design of jet-noise reduction devices. As for the fan exit noise at the flyover measurement point, it was suggested that the effect of fan noise was relatively large at the flyover point because of the cutback thrust, and that only the fan inlet noise was shielded, due to the STCA airframe configuration. This result indicates the importance of fan noise shielding. As for the airframe trailing edge noise, the relationship between takeoff noise and high-speed climbout is indicated; however, further study is needed.
In future, the LTO noise of different aircraft configurations will be investigated; the effect of aircraft configuration has been suggested in this study. Further validation and updating of the prediction model will be considered for the factors where uncertainty significantly affects the LTO noise estimation results.

Author Contributions

Conceptualization, J.A.; methodology, J.A. and T.I.; software, J.A.; validation, J.A.; formal analysis, J.A.; investigation, J.A.; resources, J.A.; data curation, J.A. and T.I.; writing—original draft preparation, J.A.; writing—review and editing, J.A. and T.I.; visualization, J.A.; supervision, T.I.; project administration, J.A.; funding acquisition, J.A. and T.I. All authors have read and agreed to the published version of the manuscript.

Funding

This research received no external funding.

Data Availability Statement

Not applicable.

Acknowledgments

The authors would like to thank H. Tomita, M. Naruoka, R. Hirai, H. Sawada, I. Shirota, K. Mizobe, T. Kumazawa, and T. Kumagai for their technical support with ground noise tests. We also thank H. Oinuma, K. Nagai, K. Wada, Y. Naka, S. Koganezawa, and O. Hamamura for their contributions to the experiments and useful discussions. T. Motoda developed and supported the MCS system used in this study. Special acknowledgement is extended to J. Berton for developing and providing the NASA 55t STCA model.

Conflicts of Interest

The authors declare no conflict of interest.

References

  1. International Civil Aviation Organization. Chaps. 3, 4, 12 and 14. In Annex 16 Environmental Protection Volume I Aircraft Noise, 7th ed.; International Civil Aviation Organization: Montreal, QC, Canada, 2014. [Google Scholar]
  2. Piccirillo, G.; Viola, N.; Fusaro, R.; Federico, L. Guidelines for the LTO Noise Assessment of Future Civil Supersonic Aircraft in Conceptual Design. Aerospace 2022, 9, 27. [Google Scholar] [CrossRef]
  3. Stone, J.R.; Krejsa, E.A.; Halliwell, l.; Clark, B.J. Noise Suppression Nozzles for a Supersonic Business Jet. In Proceedings of the 36th AIAA/ASME/SAE/ASEE Joint Propulsion Conference and Exhibit, Las Vegas, NV, USA, 24–28 July 2000. AIAA 2000-3194. [Google Scholar]
  4. Rask, O.; Kastner, J.; Gutmark, E.J. Understanding How Chevrons Modify Noise in a Supersonic Jet with Flight Effects. AIAA J. 2011, 49, 8. [Google Scholar] [CrossRef]
  5. Semlitsch, B.; Cuppoletti, D.R.; Gutmark, E.J.; Mihăescu, M. Transforming the Shock Pattern of Supersonic Jets Using Fluidic Injection. AIAA J. 2019, 57, 5. [Google Scholar] [CrossRef] [Green Version]
  6. Scupski, N.; Akatsuka, J.; McLaughlin, D.K.; Morris, P.J. Experiments with Rectangular Supersonic Jets with Potential Noise Reduction Technology. J. Acoust. Soc. Am. 2022, 151, 56–66. [Google Scholar] [CrossRef]
  7. Berton, J.J.; Haller, W.J.; Senick, P.F.; Jones, S.M.; Seidel, J.A. A Comparative Propulsion System Analysis for the High-Speed Civil Transport; NASA/TM-2005-213414; NASA: Washington, DC, USA, 2005.
  8. Huff, D.L.; Henderson, B.S.; Berton Jeff, J.; Seidel, J.A. Perceived Noise Analysis for Offset Jets Applied to Commercial Supersonic Aircraft. In Proceedings of the 54th AIAA Aerospace Sciences Meeting, San Diego, CA, USA, 4–8 January 2016. AIAA 2016-1635. [Google Scholar]
  9. Henderson, B.; Huff, D.L. The Aeroacoustics of Offset Three-Stream Jets for Future Commercial Supersonic Aircraft. In Proceedings of the 22nd AIAA/CEAS Aeroacoustics Conference, Lyon, France, 30 May–1 June 2016. AIAA 2016-2992. [Google Scholar]
  10. Berton, J.J.; Jones, S.M.; Seidel, J.A.; Huff, D.L. Advanced Noise Abatement Procedures for a Supersonic Business Jet. In Proceedings of the 23rd International Symposium on Air Breathing Engines (ISABE): Economy, Efficiency and Environment, Manchester UK, 3–8 September 2017. ISABE-2017-22538. [Google Scholar]
  11. Berton, J.J.; Huff, D.L.; Geiselhart, K.; Seidel, J. Supersonic Technology Concept Aeroplanes for Environmental Studies. In Proceedings of the AIAA Scitech 2020 Forum, Orlando, FL, USA, 6–10 January 2020. AIAA2020-0263. [Google Scholar]
  12. Yoshida, K. Supersonic drag reduction technology in the scaled supersonic experimental airplane project by JAXA. Prog. Aerosp. Sci. 2009, 45, 124–146. [Google Scholar] [CrossRef]
  13. Akatsuka, J.; Ishii, T. Experimental and Numerical Study of Jet Noise Reduction for Supersonic Aircraft Using Variable Folding Nozzle Concept. In Proceedings of the 2018 AIAA/CEAS Aeroacoustics Conference, Atlanta, GA, USA, 25–29 June 2018. AIAA 2018-3612. [Google Scholar]
  14. Akatsuka, J. Development of Aircraft Noise Estimation Tool; JAXA RR 2016-0005; JAXA: Tokyo, Japan, 2017. (In Japanese)
  15. Akatsuka, J.; Ishii, T. System Noise Assessment of NASA Supersonic Technology Concept Aeroplane Using JAXA’s Noise Prediction Tool. In Proceedings of the AIAA Scitech 2020 Forum, Orlando, FL, USA, 6–10 January 2020. AIAA202-0265. [Google Scholar]
  16. Nöding, M.; Schuermann, M.; Bertsch, L.; Koch, M.; Plohr, M.; Jaron, R.; Berton, J.J. Simulation of Landing and Take-Off Noise for Supersonic Transport Aircraft at a Conceptual Design Fidelity Level. Aerospace 2022, 9, 9. [Google Scholar] [CrossRef]
  17. Zorumski, W.E. Aircraft Noise Prediction Program Theoretical Manual, Parts 1 and 2; NASA TM-83199; NASA: Washington, DC, USA, 1982.
  18. ARP 876E; Gas Turbine Jet Exhaust Noise Prediction. Society of Automotive Engineers (SAE): Warrendale, PA, USA, 2012.
  19. Viswanathan, K.; Czech, M.J. Measurement and Modeling of Effect of Forward Flight on Jet Noise. AIAA J. 2011, 49, 216–234. [Google Scholar] [CrossRef]
  20. Fink, M.R. Airframe Noise Prediction Method; FAA RD-77-29; FAA: Washington, DC, USA, 1977.
  21. Ogino, S.; Kanazaki, M.; Ito, Y.; Murayama, M.; Yamamoto, K. Noise Evaluation Based on Geometrical Acoustics Approach and Its Application to Fan Noise Shielding Effect of Nacelle Over Wide-Body Aircraft. In Proceedings of the 2018 JSASS North Branch Annual Meeting, Sendai, Miyagi, Japan, 3–5 March 2018. (In Japanese). [Google Scholar]
  22. Kontos, K.B.; Krafta, R.E.; Gliebe, P.R. Improved NASA-ANOPP Noise Prediction Computer Code for Advanced Subsonic Propulsion Systems Volume 2: Fan Suppression Model Development; Technical Report NASA CR 202309; NASA: Washington, DC, USA, 1997.
  23. Department of Transportation and Federal Aviation Administration. Noise Certification of Supersonic Airplanes. Technical Report. Federal Register, Notice of Proposed Rulemaking (NPRM). 2021; Volume 85, No. 71; pp. 20431–20447. Available online: https://www.govinfo.gov/content/pkg/FR-2020-04-13/pdf/2020-07039.pdf (accessed on 21 February 2022).
  24. Kontos, K.; Janardan, B.; Gliebe, P. Improved NASA-ANOPP Noise Prediction Computer Code for Advanced Subsonic Propulsion Systems; Technical Report NASA-CR-195480; NASA: Washington, DC, USA, 1996.
  25. Emmerling, J.J.; Kazin, S.B.; Matta, R.K. Core Engine Noise Control Program. Vol. III, Supplement 1-Prediction Methods; FAA RD-74-125, III-I; FAA: Washington, DC, USA, 1976.
  26. International Organization for Standardization (ISO). Acoustics—Attenuation of Sound during Propagation Outdoors. Part 1: Calculation of the Absorption of Sound by the Atmosphere; Technical Report ISO 9613-1:1993; ISO: Geneva, Switzerland, 1993. [Google Scholar]
  27. ARP 866B; Standard Values of Atmospheric Absorption as a Function of Temperature and Humidity. Society of Automotive Engineers (SAE): Warrendale, PA, USA, 2012.
  28. Chien, C.F.; Soroka, W.W. Sound Propagation Along an Impedance Plane. J. Sound Vib. 1975, 43, 9–20. [Google Scholar] [CrossRef]
  29. Society of Automotive Engineers (SAE). Method for Predicting Lateral Attenuation of Airplane Noise; Aerospace Information Report, AIR5662; Society of Automotive Engineers (SAE): Warrendale, PA, USA, 1981. [Google Scholar]
  30. Maekawa, Z. Noise reduction by screens. Appl. Acoust. 1968, 1, 157–173. [Google Scholar] [CrossRef]
  31. Ishii, T.; Yamamoto, K.; Nagai, K.; Ishii, Y. Overview of Jet Noise Measurement at JAXA. Trans. Jpn. Soc. Aeronaut. Space Sci. Aerosp. Technol. Jpn. 2014, 12, 123–132. [Google Scholar] [CrossRef] [Green Version]
  32. Doty, M.J.; McLaughlin, D.K. Acoustic and mean flow measurements of high-speed, helium-air mixture jets. Int. J. Aeroacoustics 2003, 2, 293–333. [Google Scholar] [CrossRef]
  33. Tanna, H.K.; Dean, P.D.; Burin, R.H. The Generation and Radiation of Supersonic Jet Noise: Vol. I11 Turbulent Mixing Noise Data; U.S.A.F. Aero Propulsion Lab; Technical Report AFAPLTR-76-65; Air Force Aero Propulsion Laboratory: Dayton, OH, USA, 1976. [Google Scholar]
  34. Stone, J.; Krejsa, E.; Clark, B.; Berton, J. Jet Noise Modeling for Suppressed and Unsuppressed Aircraft in Simulated Flight; Technical Report NASA/TM—2009-215524; NASA, Glenn Research Center: Cleveland, OH, USA, 2009.
  35. Viswanathan, K. Improved Method for Prediction of Noise from Single Jets. AIAA J. 2007, 5, 151–161. [Google Scholar] [CrossRef]
  36. Akatsuka, J.; Ishii, T. Comparative Study of Semi-empirical Jet Noise Prediction Models for Future Commercial Supersonic Aircraft. In Proceedings of the AIAA Aviation 2021 Forum, Virtual Event, 2–6 August 2021. AIAA2021-2219. [Google Scholar]
  37. Tomita, H.; Naruoka, M. JAXA Flying Test Bed “Hisho”. Aeronaut. Space Sci. Jpn. 2014, 62, 195–201. (In Japanese) [Google Scholar]
  38. Motoda, T.; Stengel, R.F.; Miyazawa, Y. Robust control system design using simulated annealing. J. Guid. Control. Dyn. 2002, 25, 267–274. [Google Scholar] [CrossRef]
Figure 1. Schematic of reference noise measurement points.
Aerospace 09 00212 g001
Figure 2. JAXA’s LTO noise prediction tool, AiNEST [14].
Aerospace 09 00212 g002
Figure 3. Flight path and thrust setting for the standard and the advanced takeoff procedure: (a) trajectory; (b) calibrated air speed; (c) thrust per engine.
Aerospace 09 00212 g003
Figure 4. Experimental setup of the scale model tests for a single heat-simulated jet: (a) schematic diagram of JAXA’s jet noise test facility; (b) schematic diagram of the test nozzle.
Aerospace 09 00212 g004
Figure 5. Comparison between the predicted and measured SPLs for a single heat-simulated jet operated at the jet velocity of 392.8 m/s and the jet total temperature ratio of 1.75: (a) θ = 90°, (b) θ = 150°.
Aerospace 09 00212 g005
Figure 6. Experimental setup of ground noise measurement tests using JAXA’s experimental aircraft: (a) schematic diagram of the layout of the instruments; (b) photograph of the test field.
Aerospace 09 00212 g006
Figure 7. Comparison between the predicted and measured jet noises for single-engine operation at N1 = 95%, jet velocity =322 m/s, and TTR = 1.5: (a) θ = 90°; (b) θ = 150°.
Aerospace 09 00212 g007
Figure 8. Schematics of scale model tests of the fan noise shielding effect: (a) experimental setup; (b) test model and the source location.
Aerospace 09 00212 g008
Figure 9. Results of validation tests for fan noise shielding effect: (a) φ = 0°, (b) φ = 45°.
Aerospace 09 00212 g009
Figure 10. Predicted component noise: (a) lateral measurement point; (b) flyover measurement point; and (c) approach measurement point.
Aerospace 09 00212 g010
Figure 11. Histogram of the predicted cumulative noise.
Aerospace 09 00212 g011
Figure 12. Normalized values of top three explanatory variables for: (a) the 10 cases with the loudest takeoff noise; (b) the 10 cases with the quietest takeoff noise.
Aerospace 09 00212 g012
Table 1. Engine performance summary provided by NASA, reprinted from Ref. [11].
M1.4, 50 kft, ISAM0.25, Sea Level, ISA + 27 °FSea Level Static, ISA + 27 °F
Net thrust, lb/engine333014,14016,620
Specific fuel consumption, lb/hr/lb0.9430.5880.479
Bypass ratio2.92.93
Burner temperature, °R330031503130
Turbine inlet temperature, °R318030403020
Compressor exit temperature, °R145014401430
Overall pressure ratio222121
Fan pressure ratio21.91.9
Compressor pressure ratio11.211.111.2
Extraction ratio1.11.11.1
Nozzle pressure ratio5.91.91.8
Table 3. Uncertainty models used in the MCS.
No.ItemModeModelMinMaxStd.dev.Offset
1Approach indicated airspeed, ktBenchmark caseTriangular−10+10--
2Lateral indicated airspeed, ktBenchmark caseTriangular−10+10--
3Flyover indicated airspeed, ktBenchmark caseTriangular−10+10--
4Approach angle of attack, °Benchmark caseTriangular−1+1--
5Lateral angle of attack, °Benchmark caseTriangular−1+1--
6Flyover angle of attack, °Benchmark caseTriangular−1+1--
7Flyover altitude, ftBenchmark caseTriangular−140+140--
8Fan inlet noise adjustment (lateral), dB-Normal--11
9Fan inlet noise adjustment (flyover), dB-Normal--11
10Fan inlet noise adjustment (approach), dB-Normal--4−4
11Fan exit noise adjustment (lateral), dB-Normal--2−2
12Fan exit noise adjustment (flyover), dB-Normal--3−3
13Fan exit noise adjustment (approach), dB-Normal--3−3
14Core noise adjustment (lateral), dB-Normal--30
15Core noise adjustment (flyover), dB-Normal--10
16Core noise adjustment (approach), dB-Normal--10
17Gear noise adjustment, dB-Normal--50
18Flap noise adjustment, dB-Normal--50
19Airframe trailing edge noise adjustment, dB-Normal--50
20Inlet treatment effectiveness, dB0Triangular−2+2--
21Exhaust treatment effectiveness, dB0Triangular−2+2--
22Ground specific flow resistance, sl/s-ft3291Triangular262320--
23Shielding effect, dB-Normal--2.65
24Jet noise adjustment (20°–90°), dB-Normal--1.10.1
25Jet noise adjustment (100°), dB-Normal--1.00.2
26Jet noise adjustment (110°), dB-Normal--1.30.8
27Jet noise adjustment (120°), dB-Normal--1.10.6
28Jet noise adjustment (130°), dB-Normal--1.21.3
29Jet noise adjustment (140°), dB-Normal--1.71.9
30Jet noise adjustment (150°), dB-Normal--1.61.4
31Jet noise adjustment (160°), dB-Normal--2.11.5
Table 4. Summary of the results and statistics of the system noise assessment of NASA 55t STCA.
Source of DataNASA Ref. [11]Present Study
Statistic in EPNLApproachLateralFlyoverCumulativeApproachLateralFlyoverCumulative
Benchmark case96.493.087.0276.497.593.086.1276.6
Min. of samples91.690.383.9270.291.586.783.2268.6
Max. of samples102.697.592.9286.8103.796.197.1286.1
Range of samples11.07.29.016.612.29.413.917.6
Mean of samples95.494.088.1277.596.493.886.0276.1
Standard deviation1.330.961.322.271.580.561.112.13
LTO Noise Standard for Subsonic AircraftApproachLateralFlyoverCumulative
Noise limits in EPNL (Chapter4)99.595.792.8278.0
Noise limits in EPNL (Chapter14)98.594.791.8271.0
Publisher’s Note: MDPI stays neutral with regard to jurisdictional claims in published maps and institutional affiliations.

