
In-Flight Demonstration of Stall Improvement Using a Plasma Actuator for a Small Unmanned Aerial Vehicle


Abstract
:1. Introduction
2. Experimental Equipment
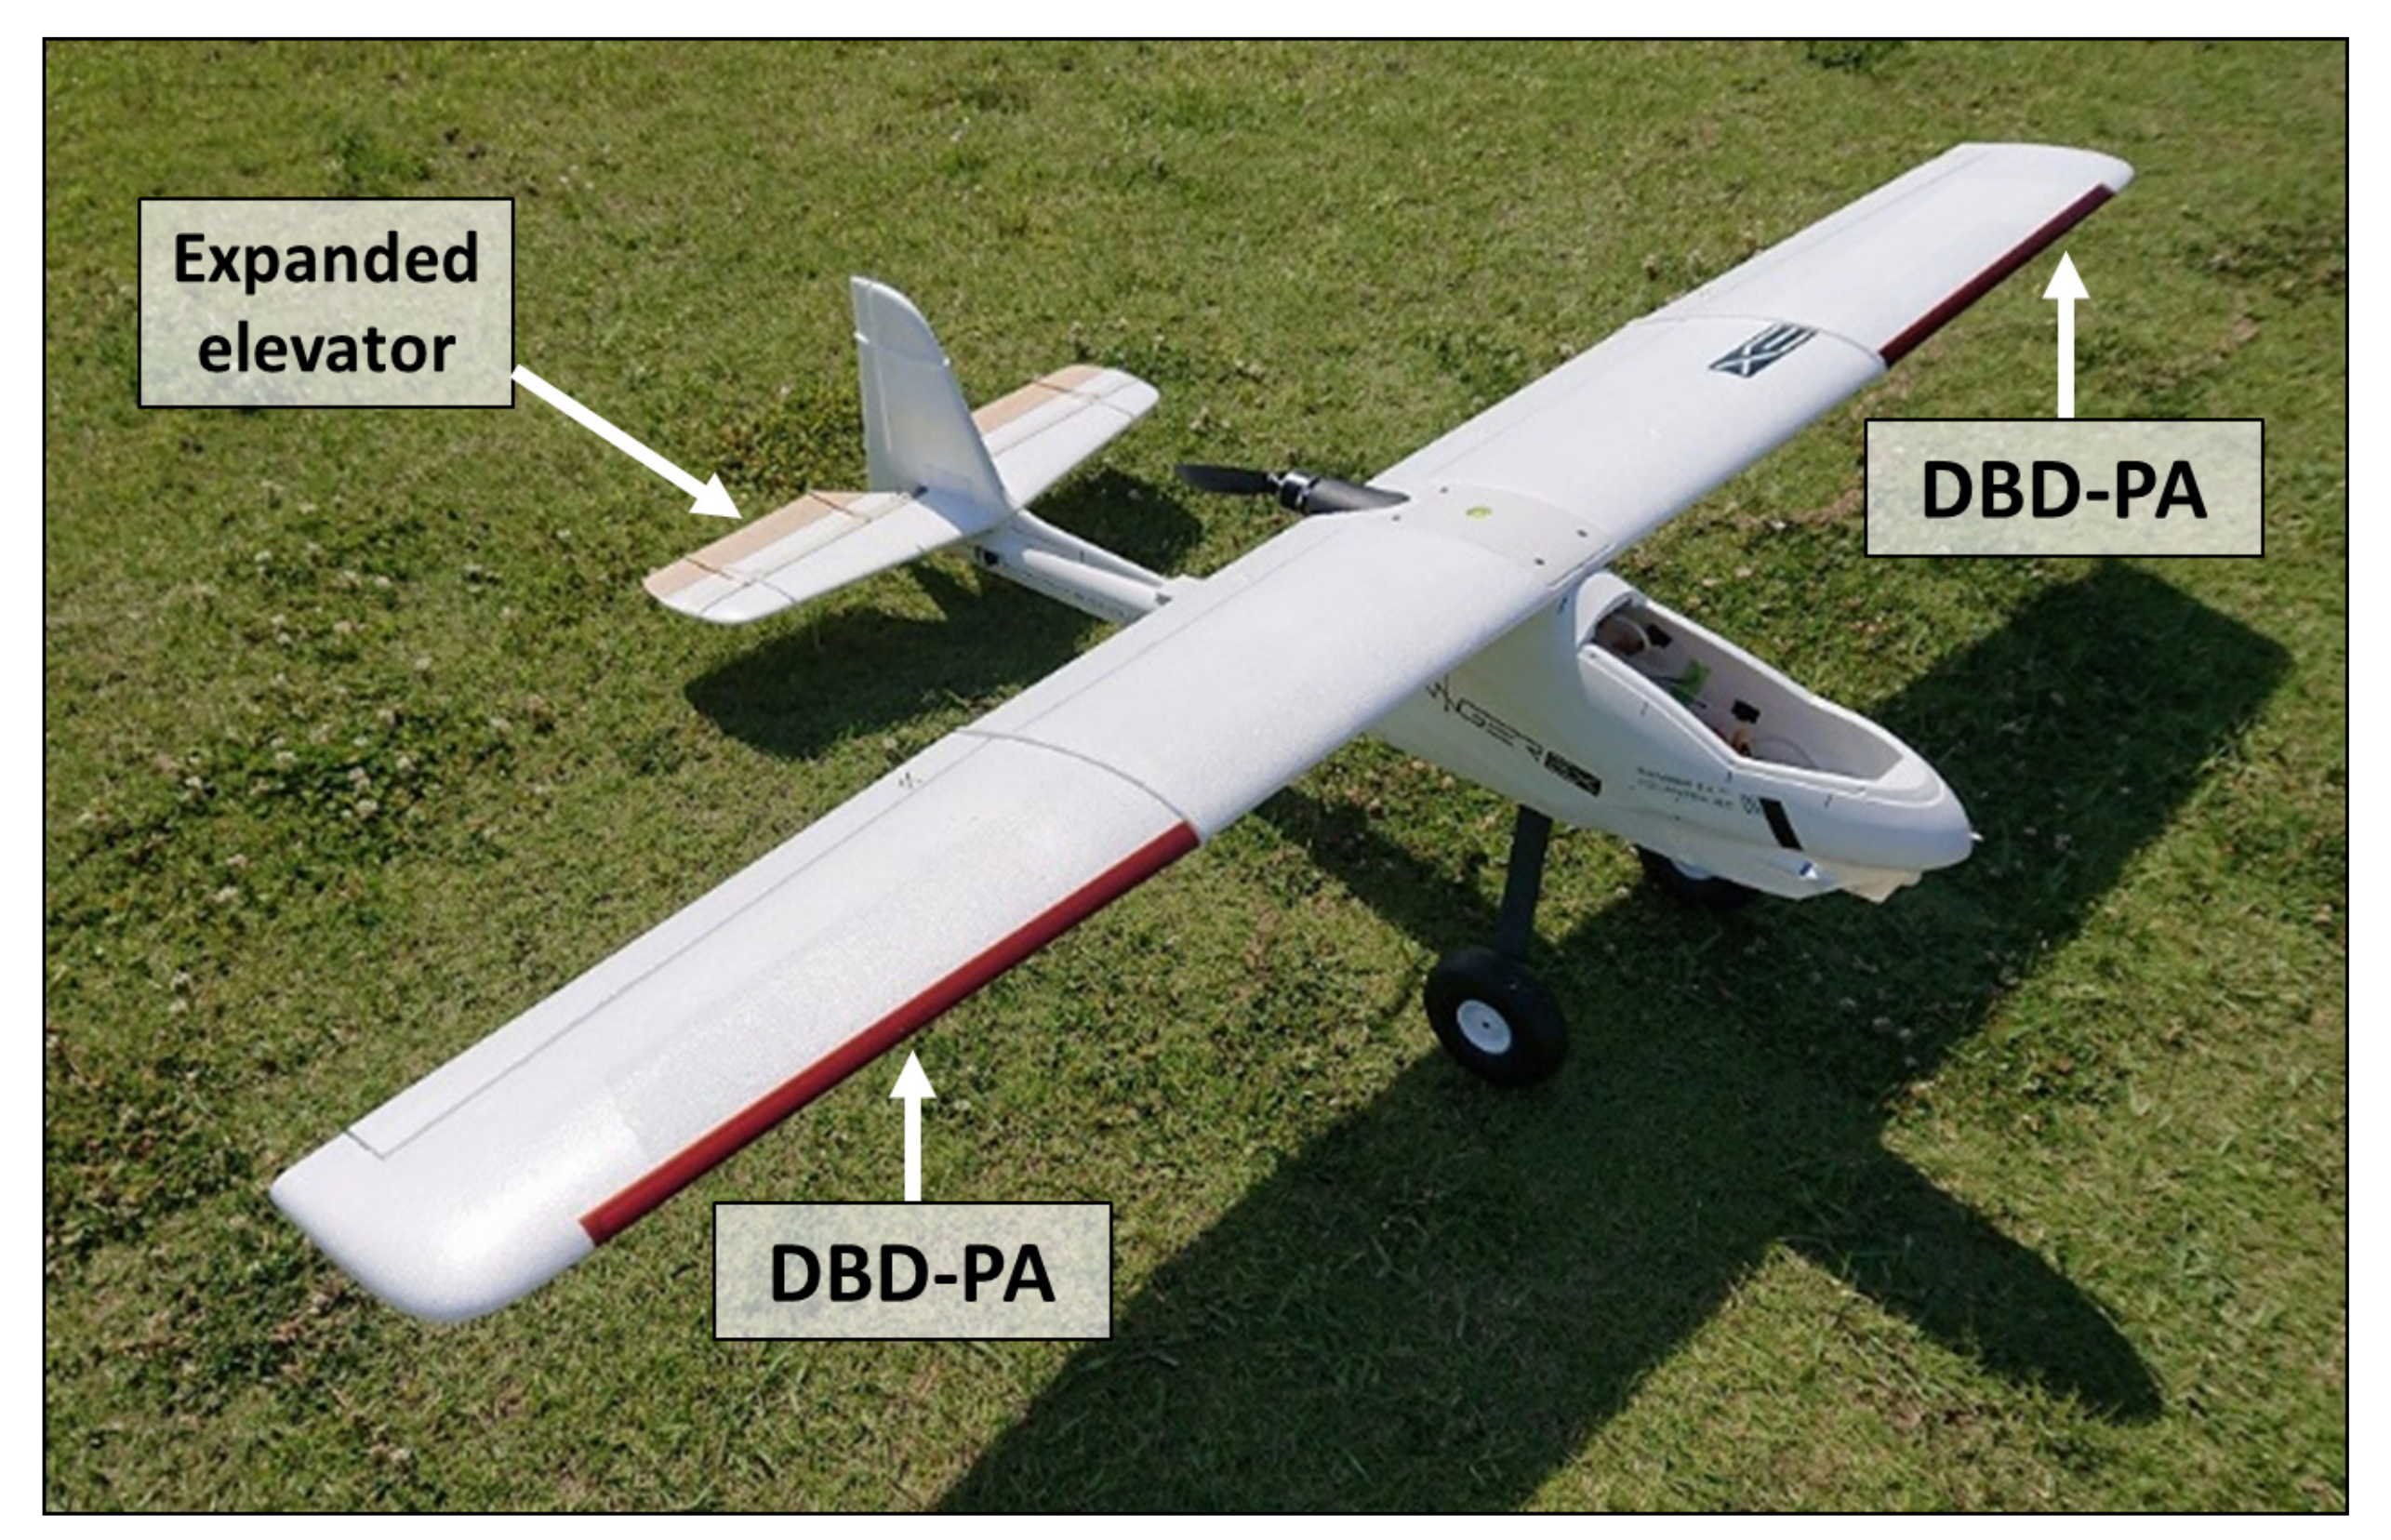
2.1. UAV
- Scale and speed:The Reynolds number based on the wing chord length and flight speed should be approximately .
- Loading weight and space:A small HV power supply (see Section 2.2), a battery, and an autonomous flight control module (see Section 2.3) can be mounted.
- Availability and ease of assembly:Assuming that the UAV could crash and be totally lost, components should be cheap and easy to purchase as well as easy to construct.
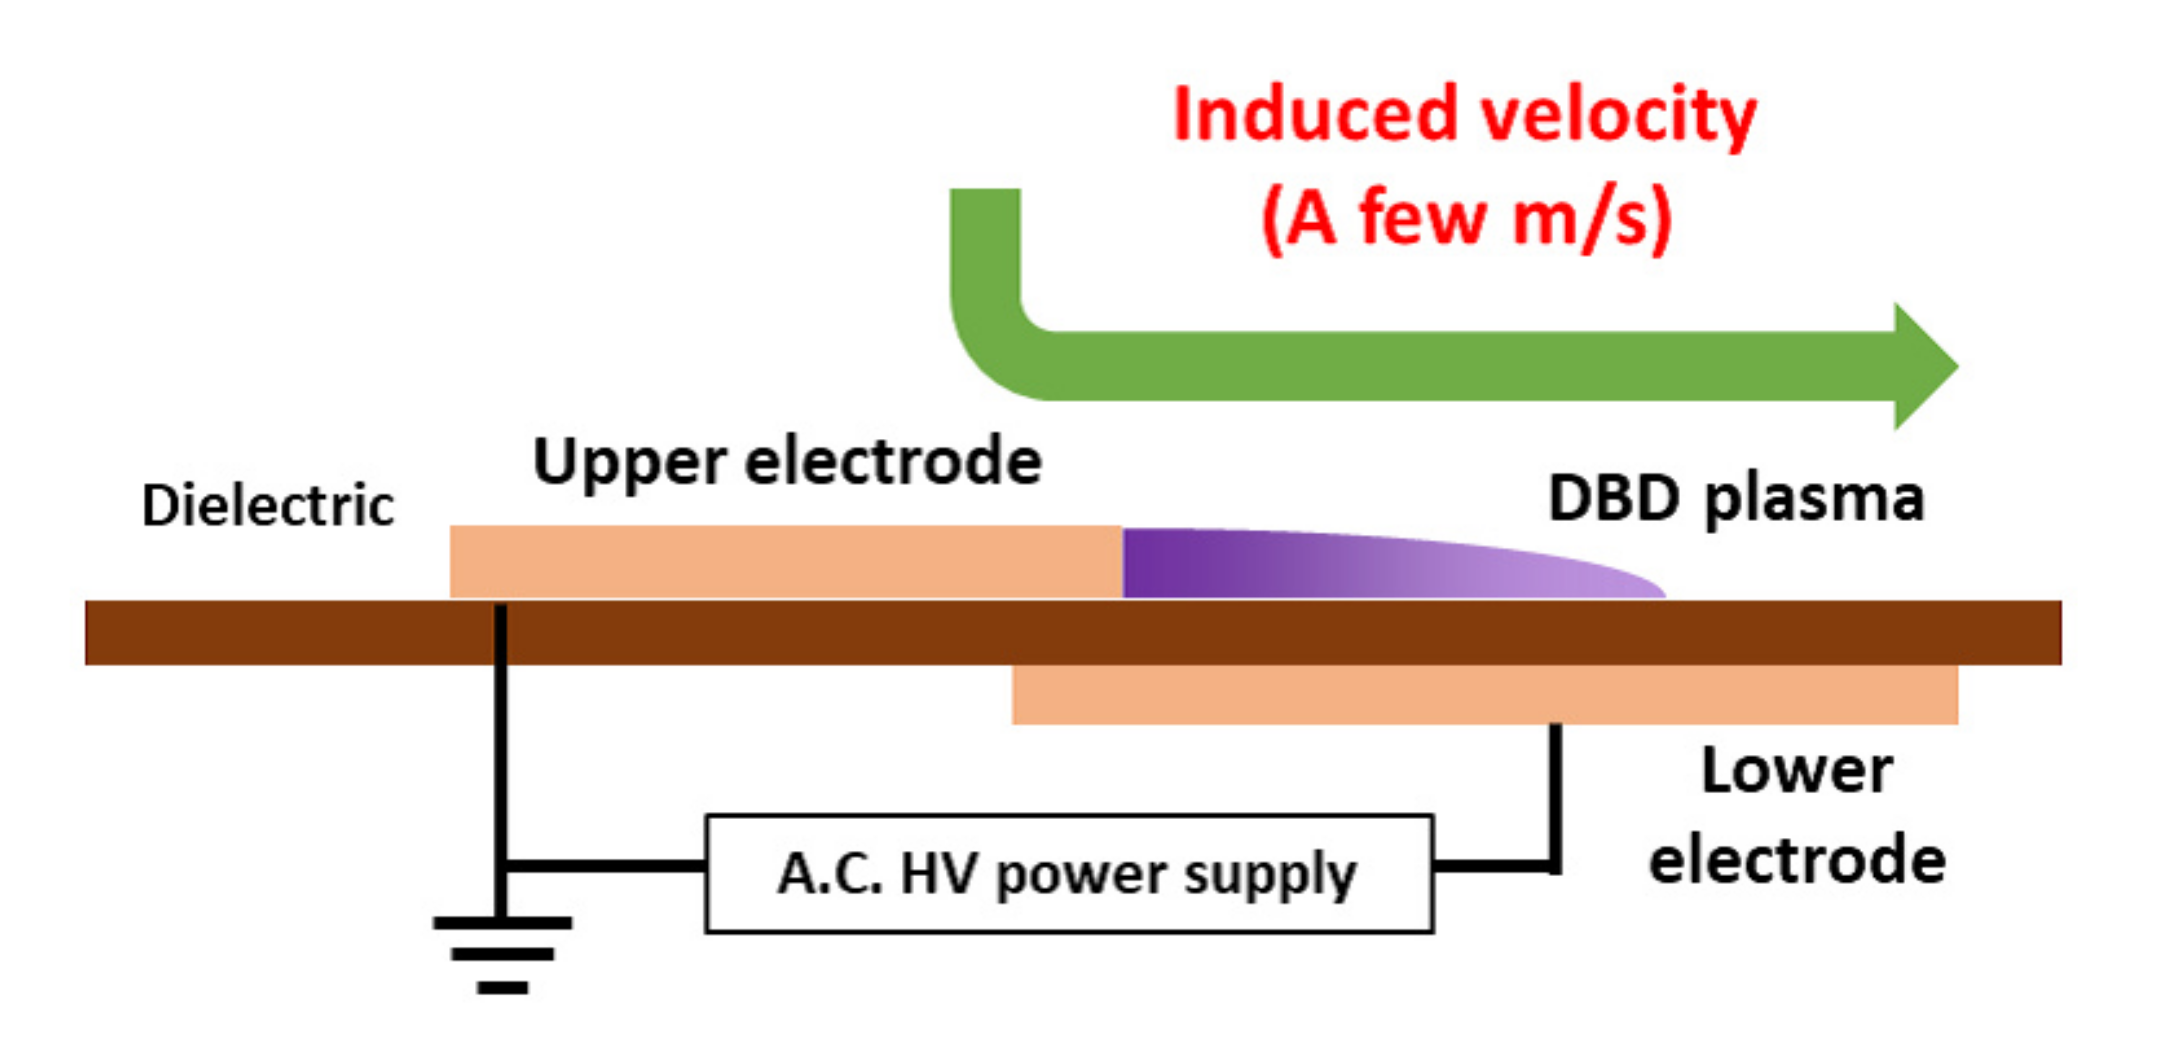
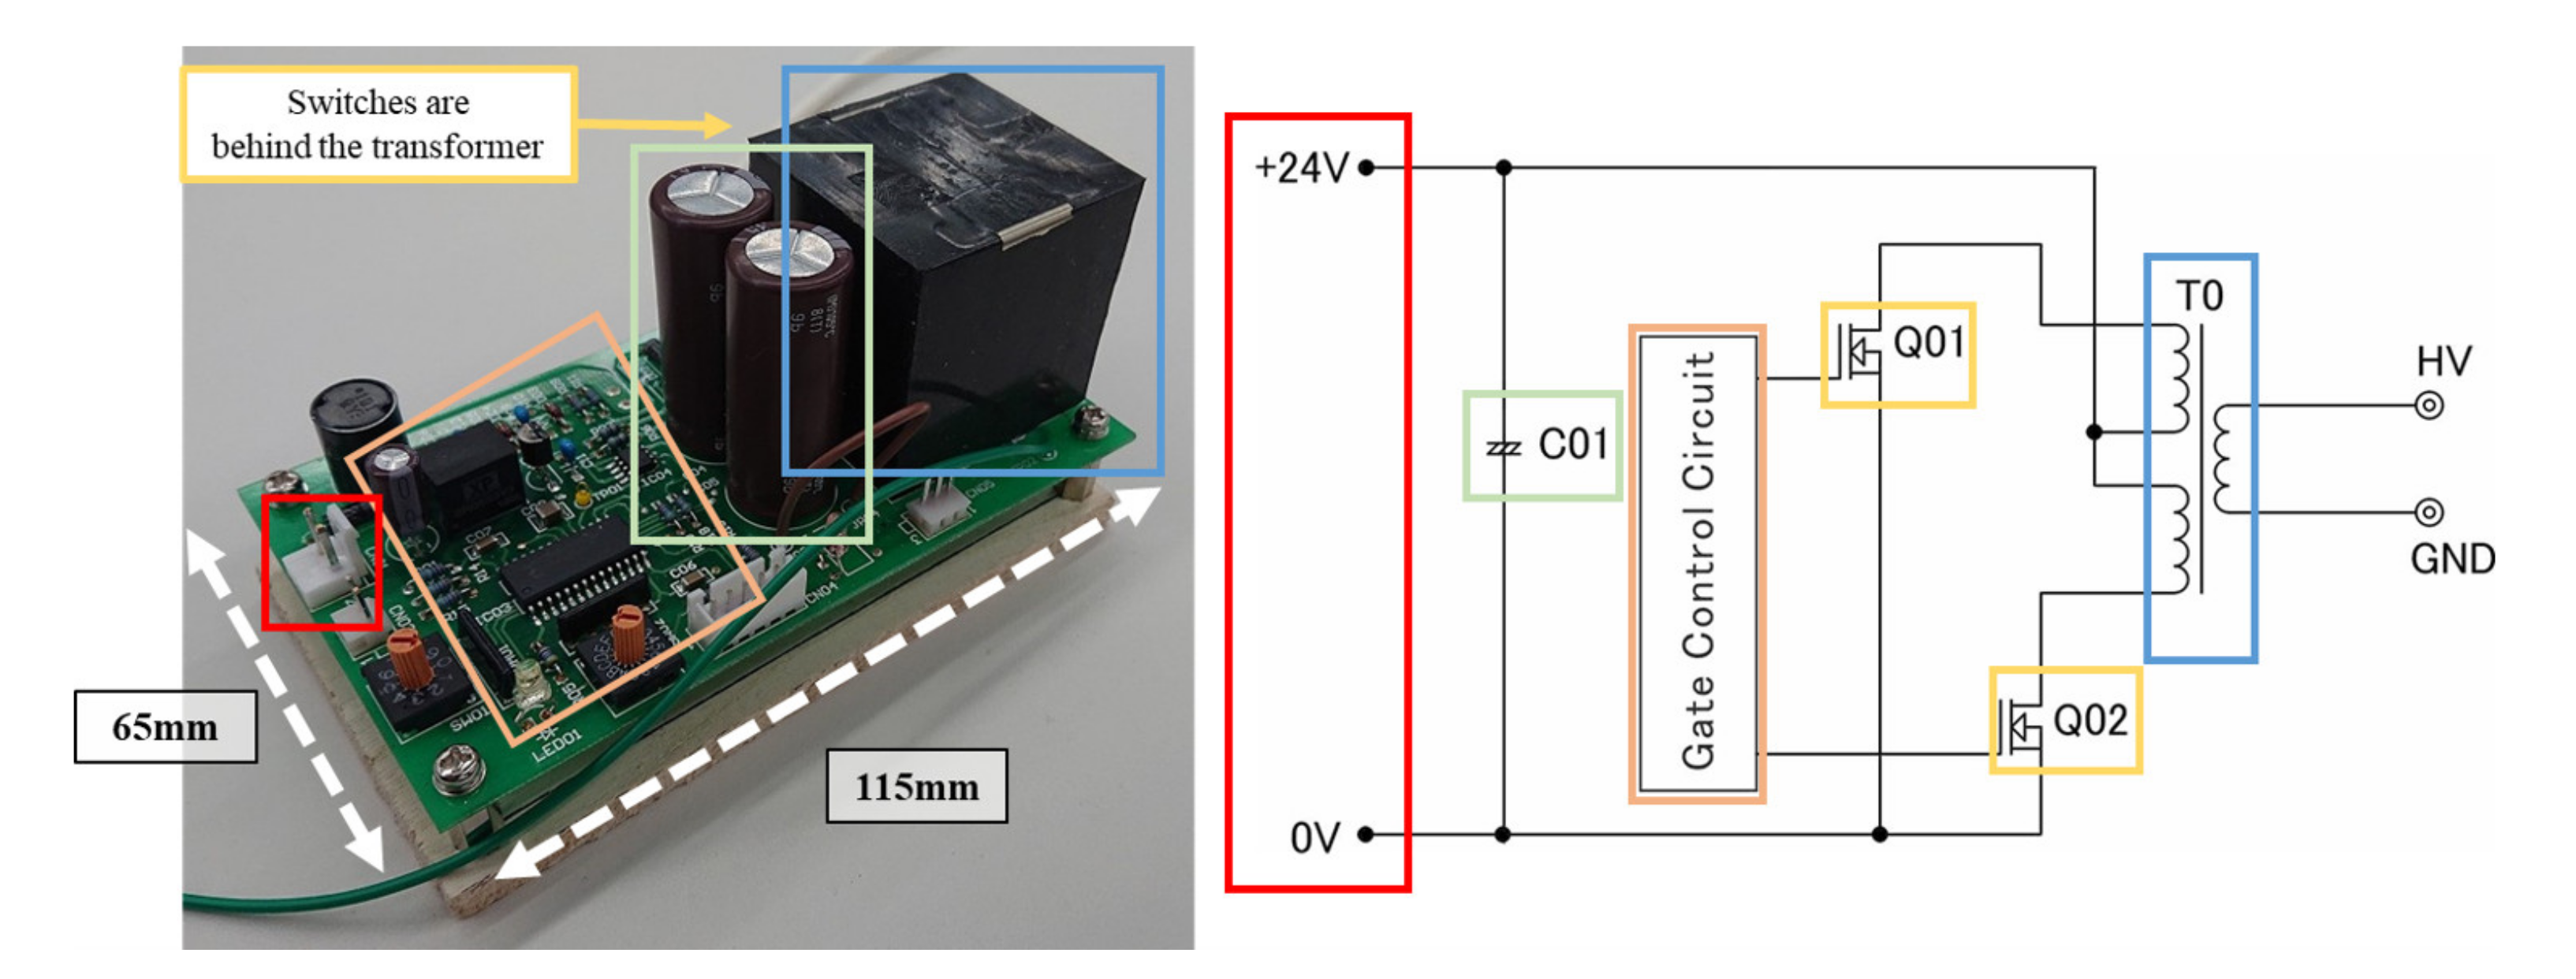
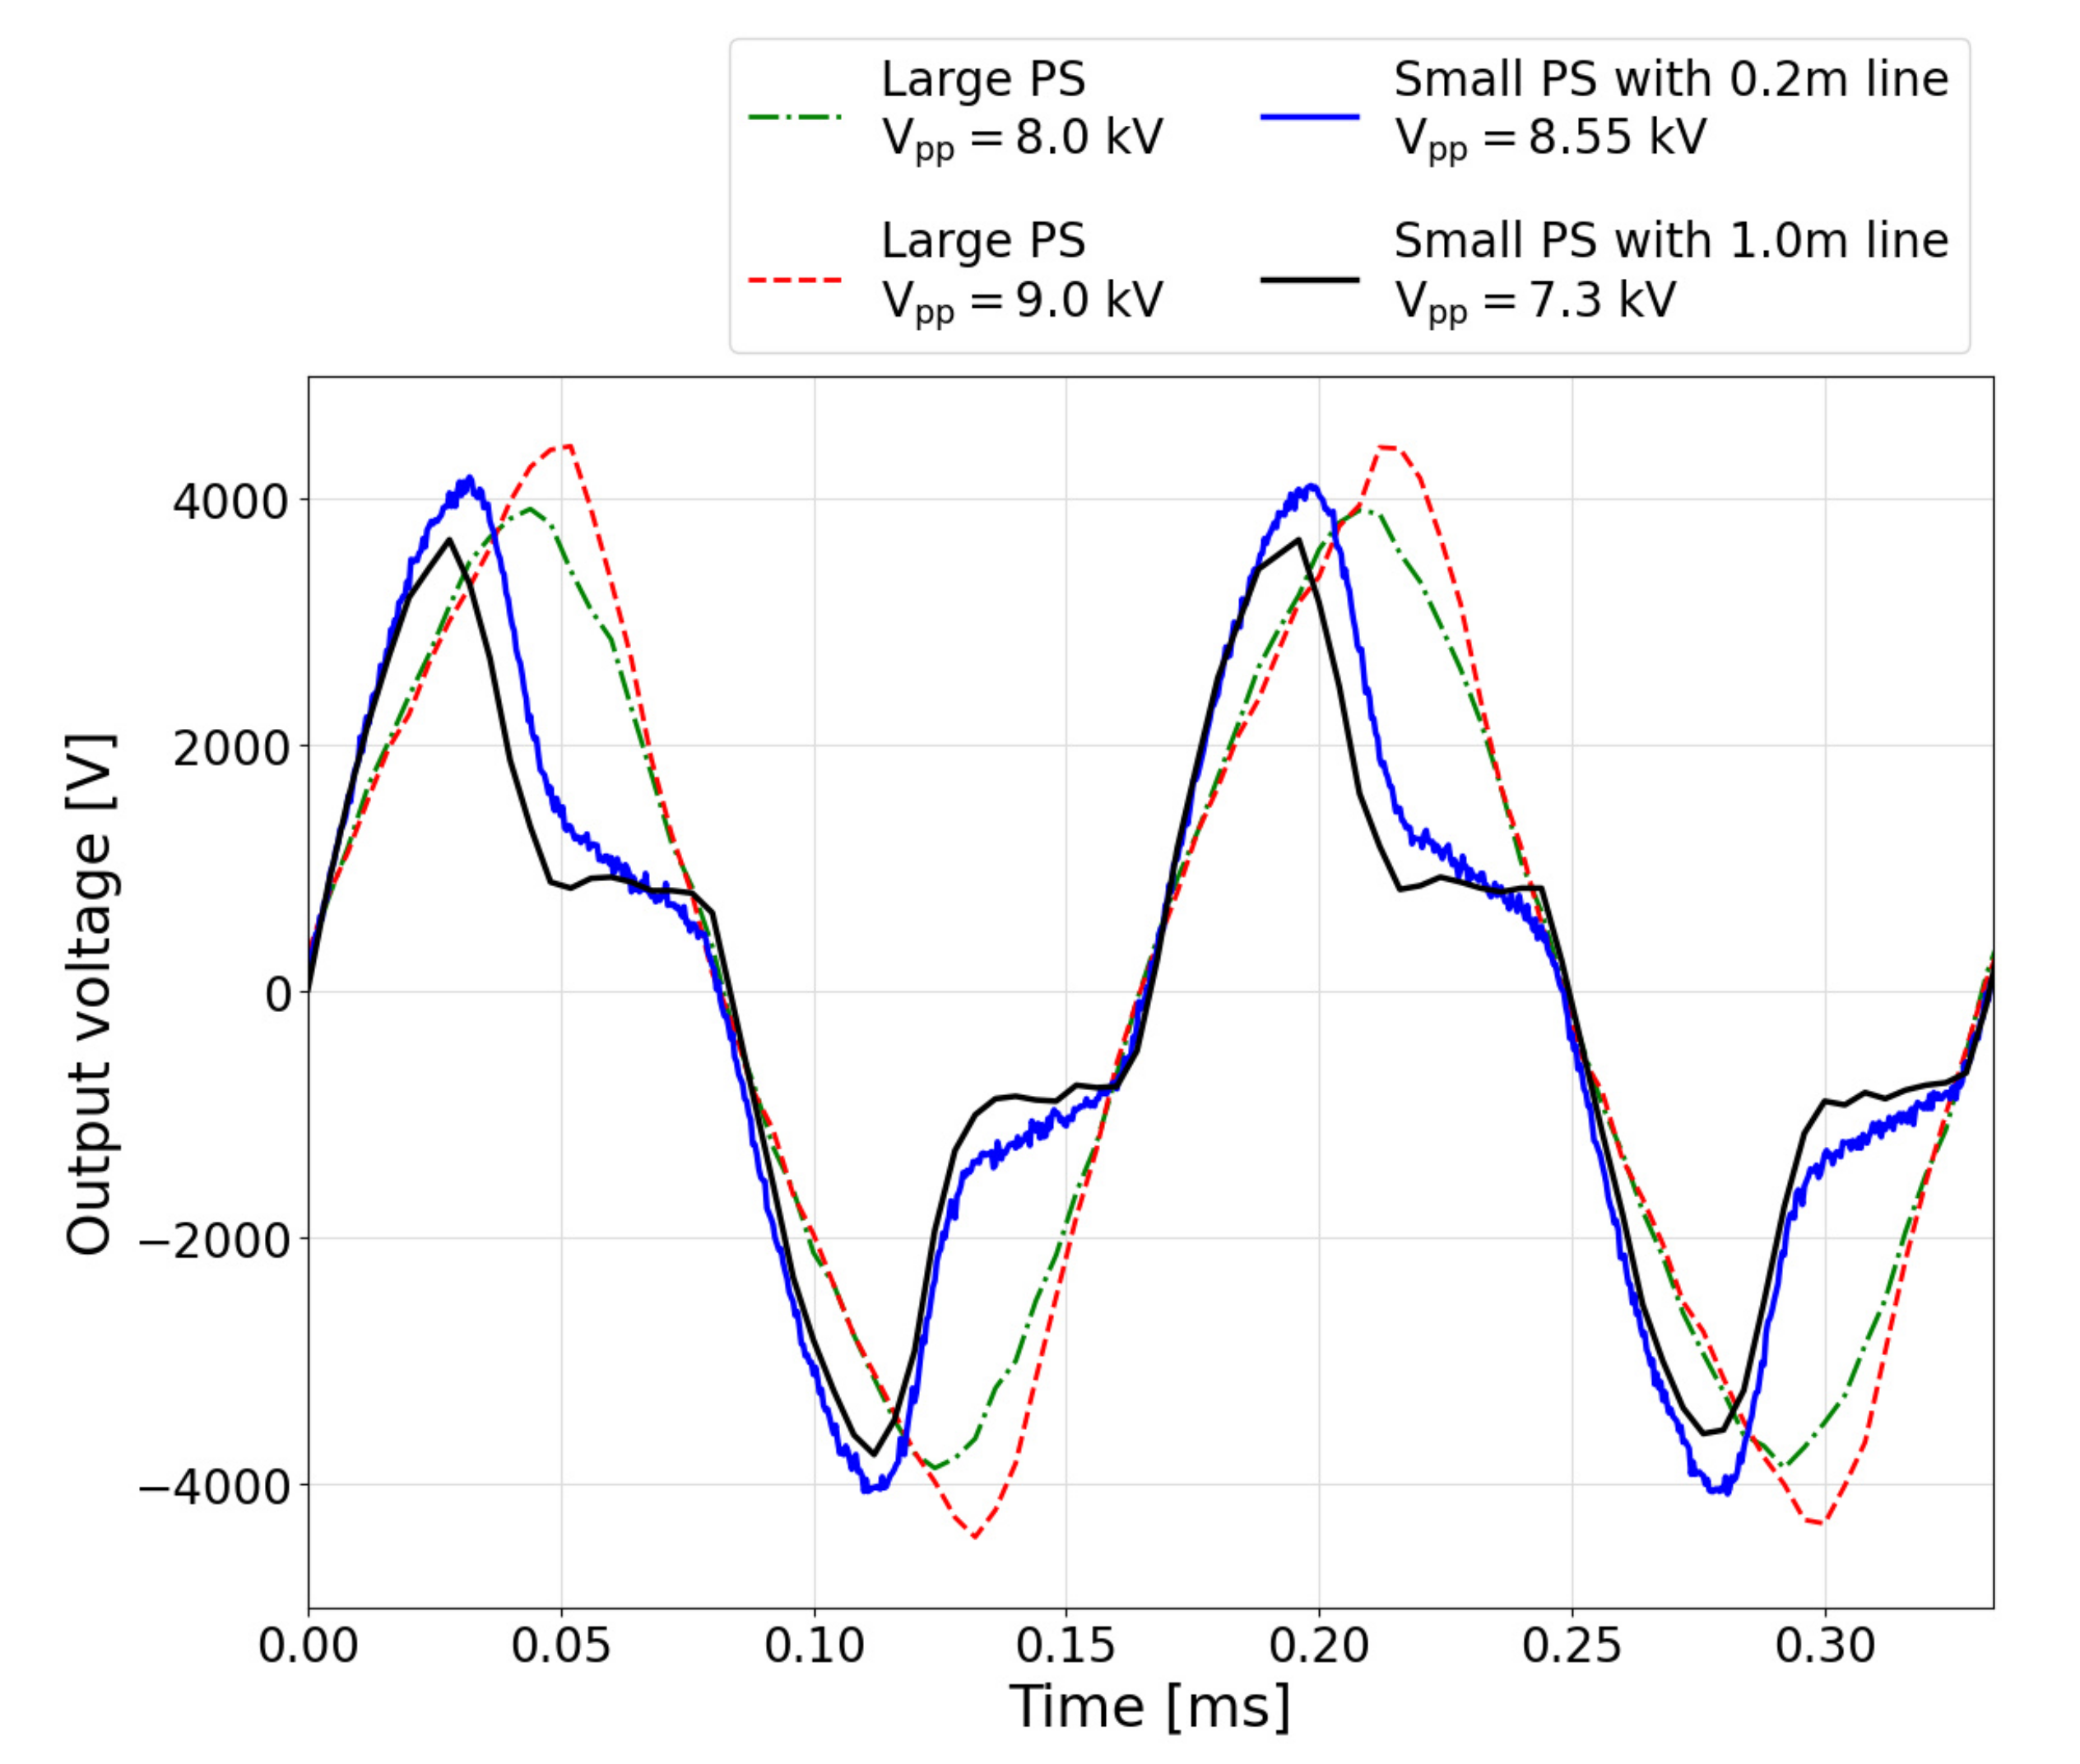
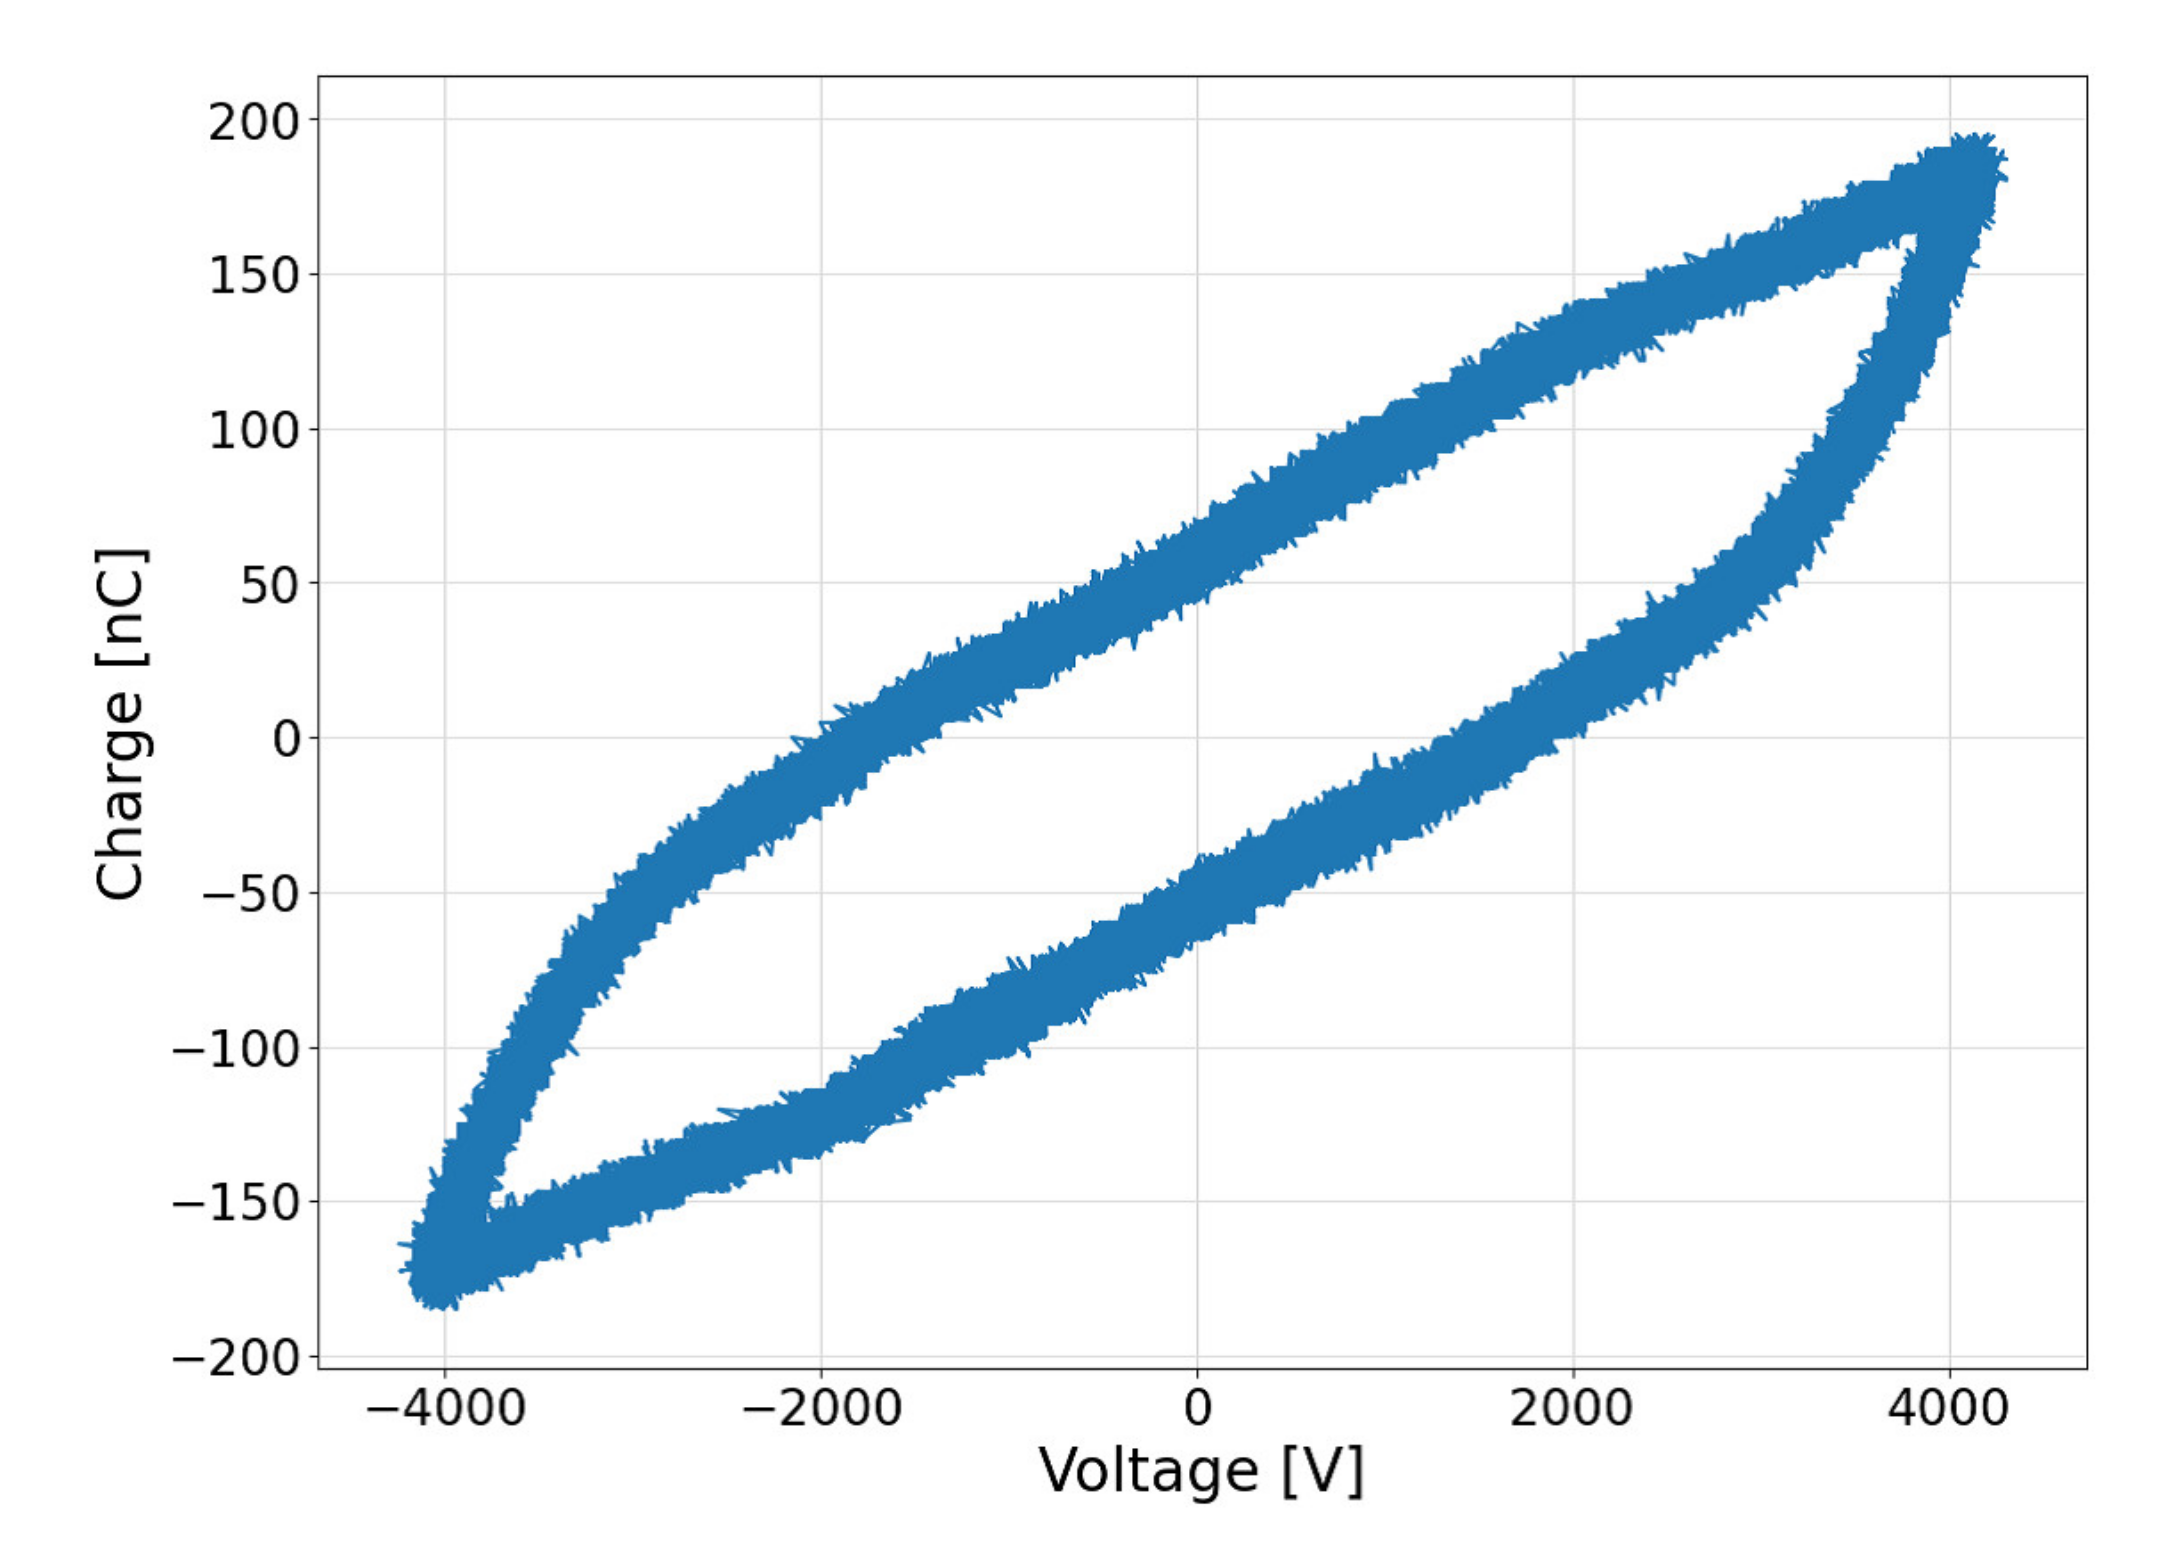
2.2. Small HV Power Supply and PA
2.3. Autonomous Flight-Control System
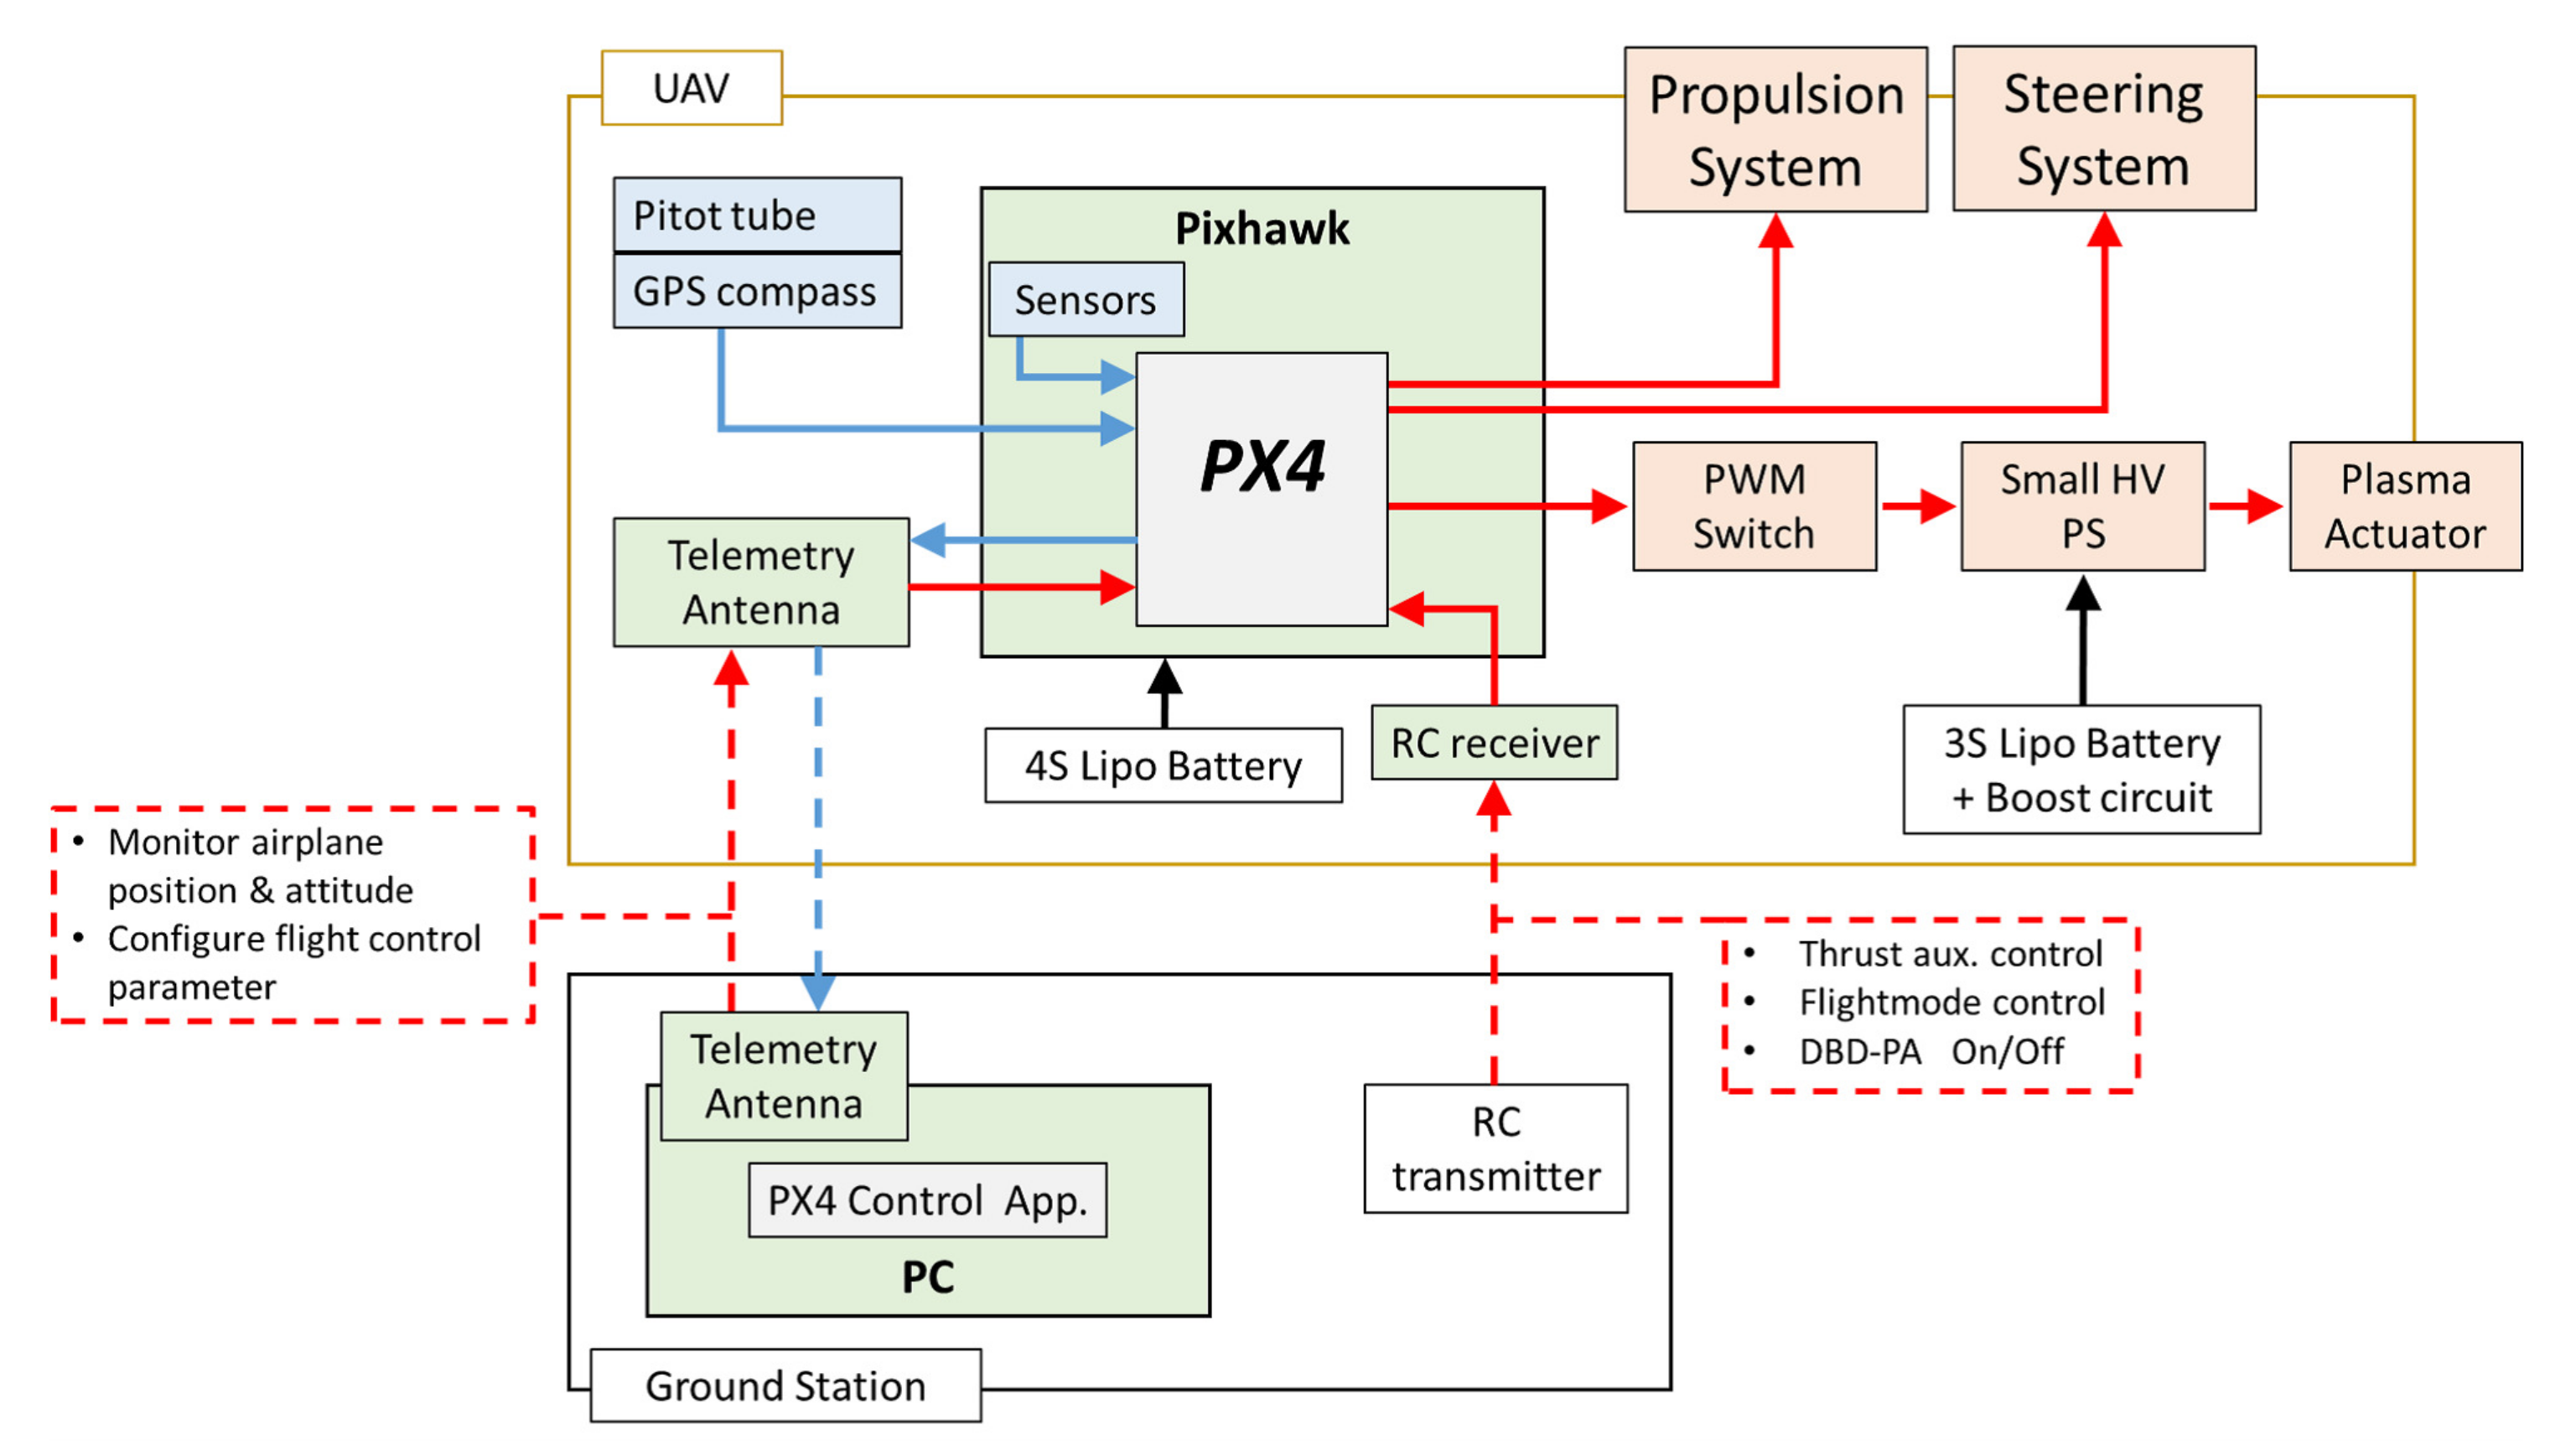
2.4. System Diagram
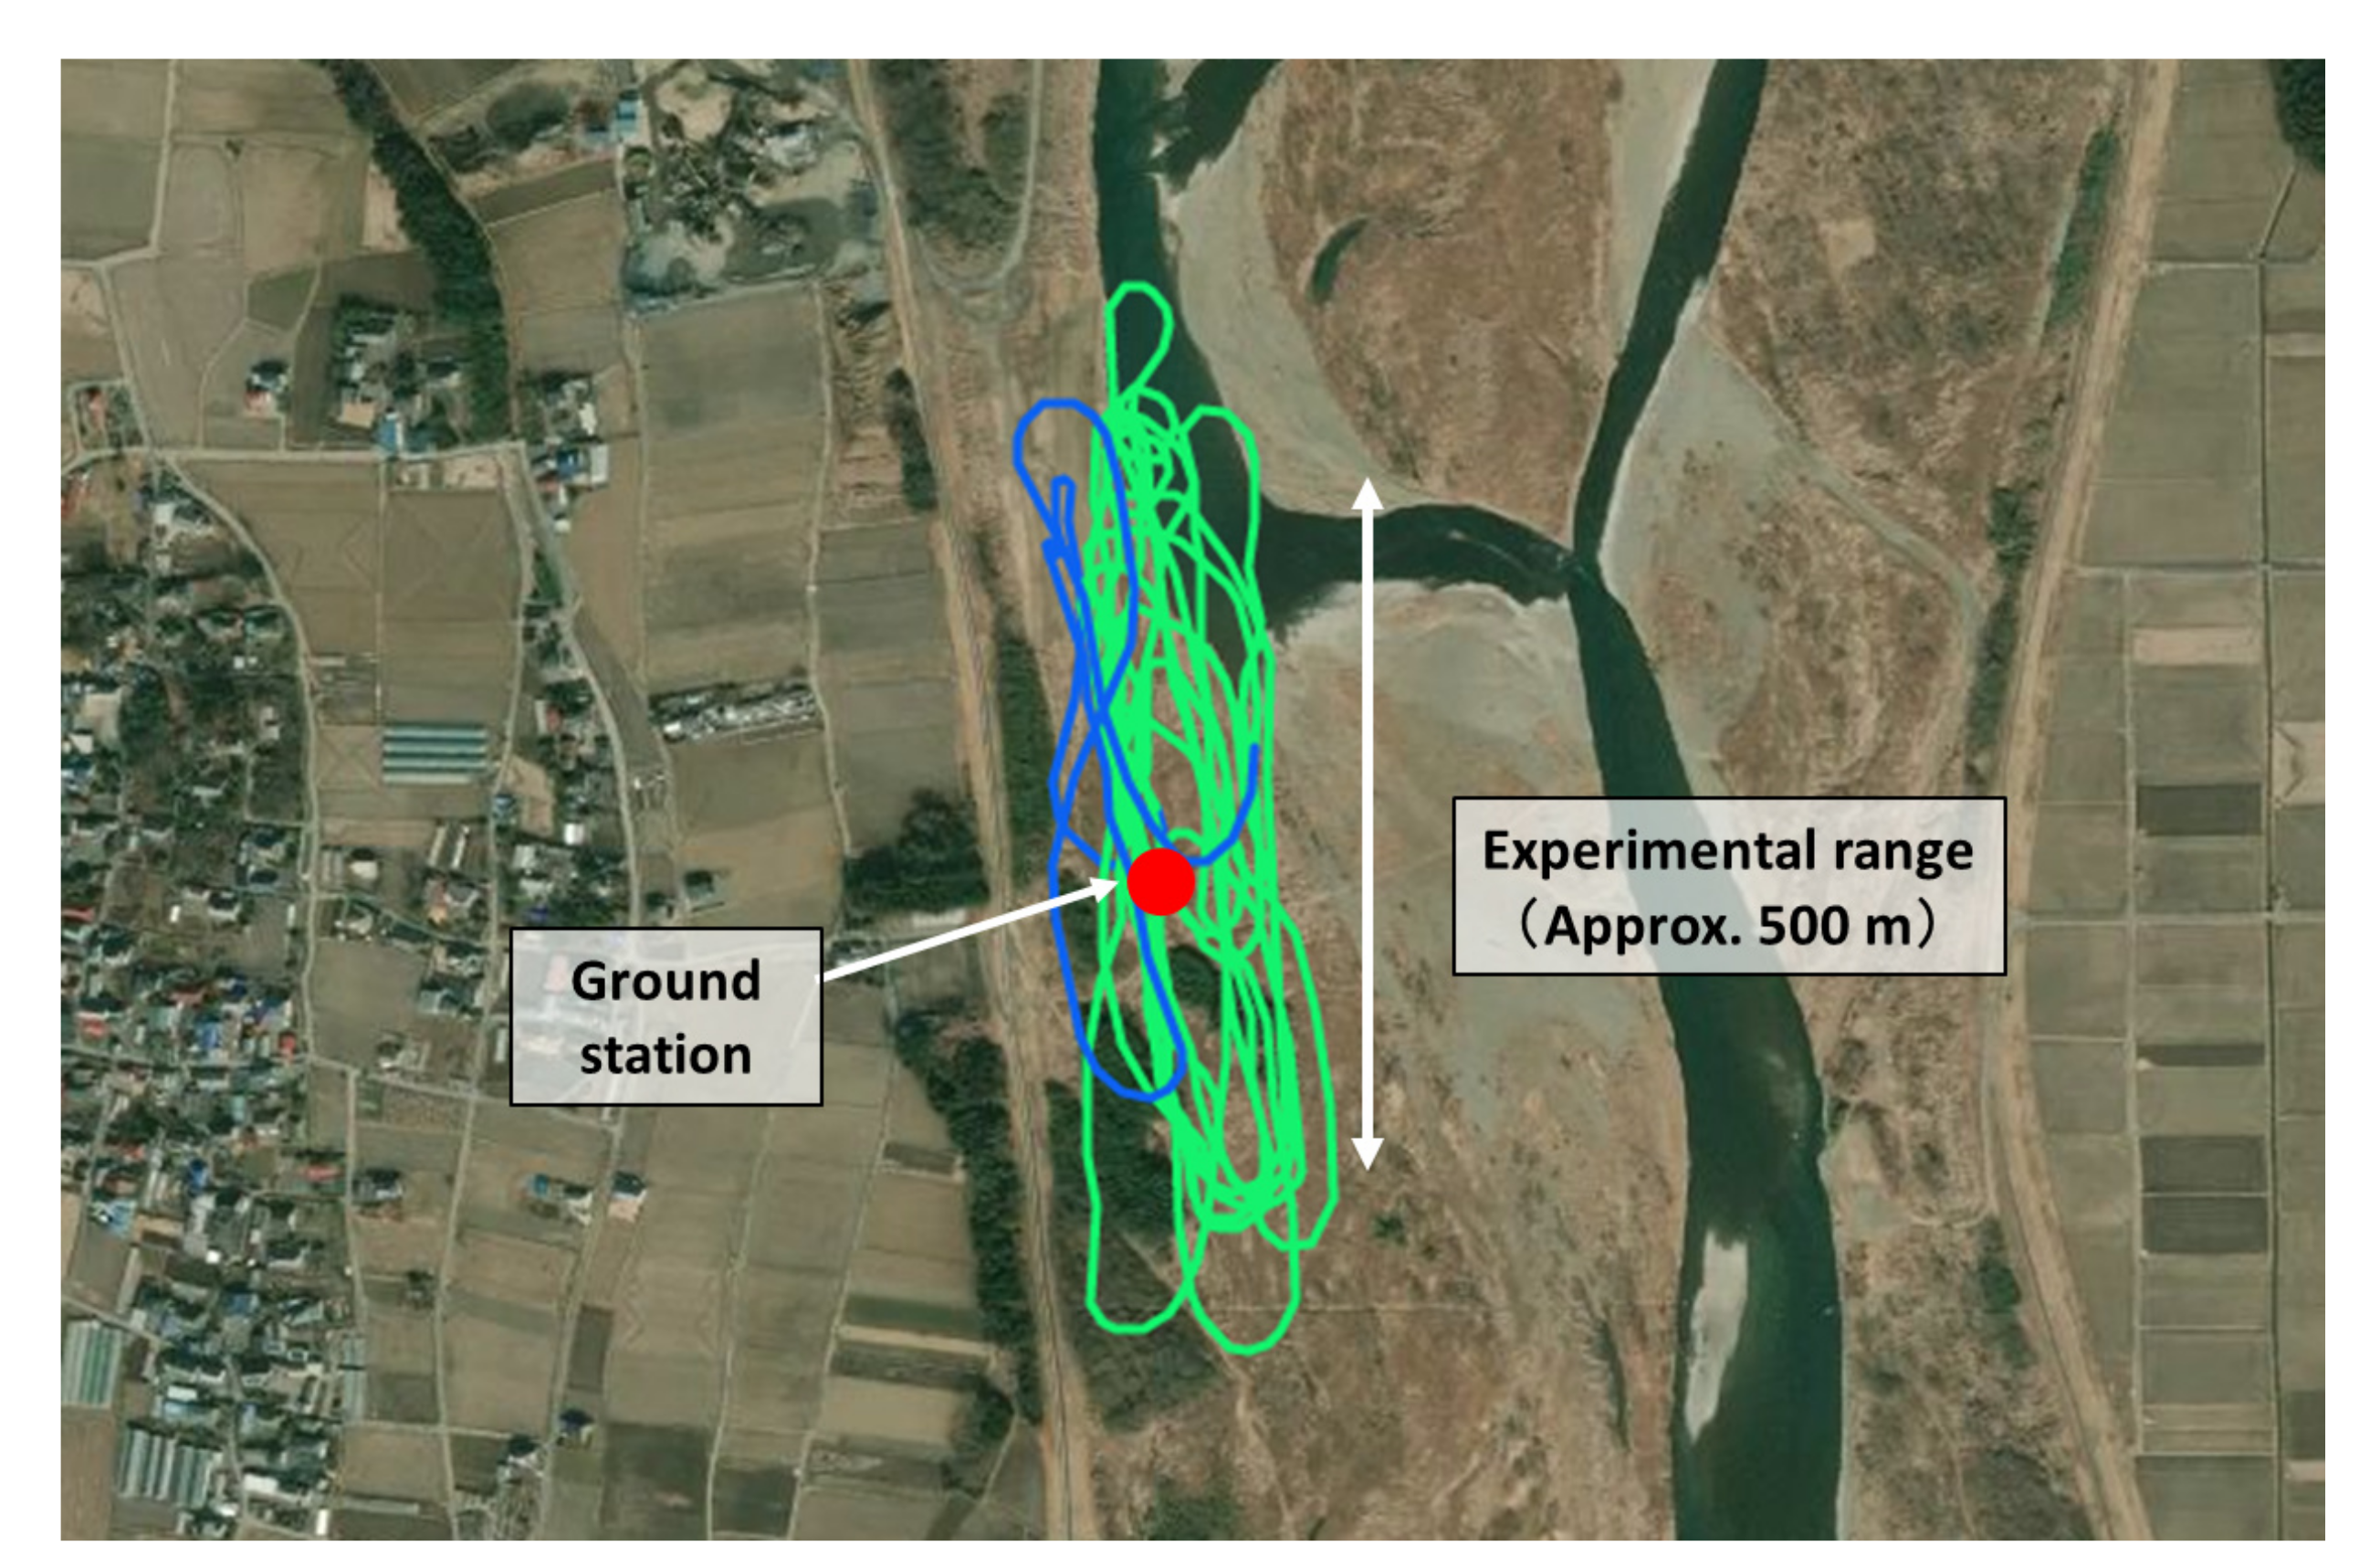
3. Results of Flight Test
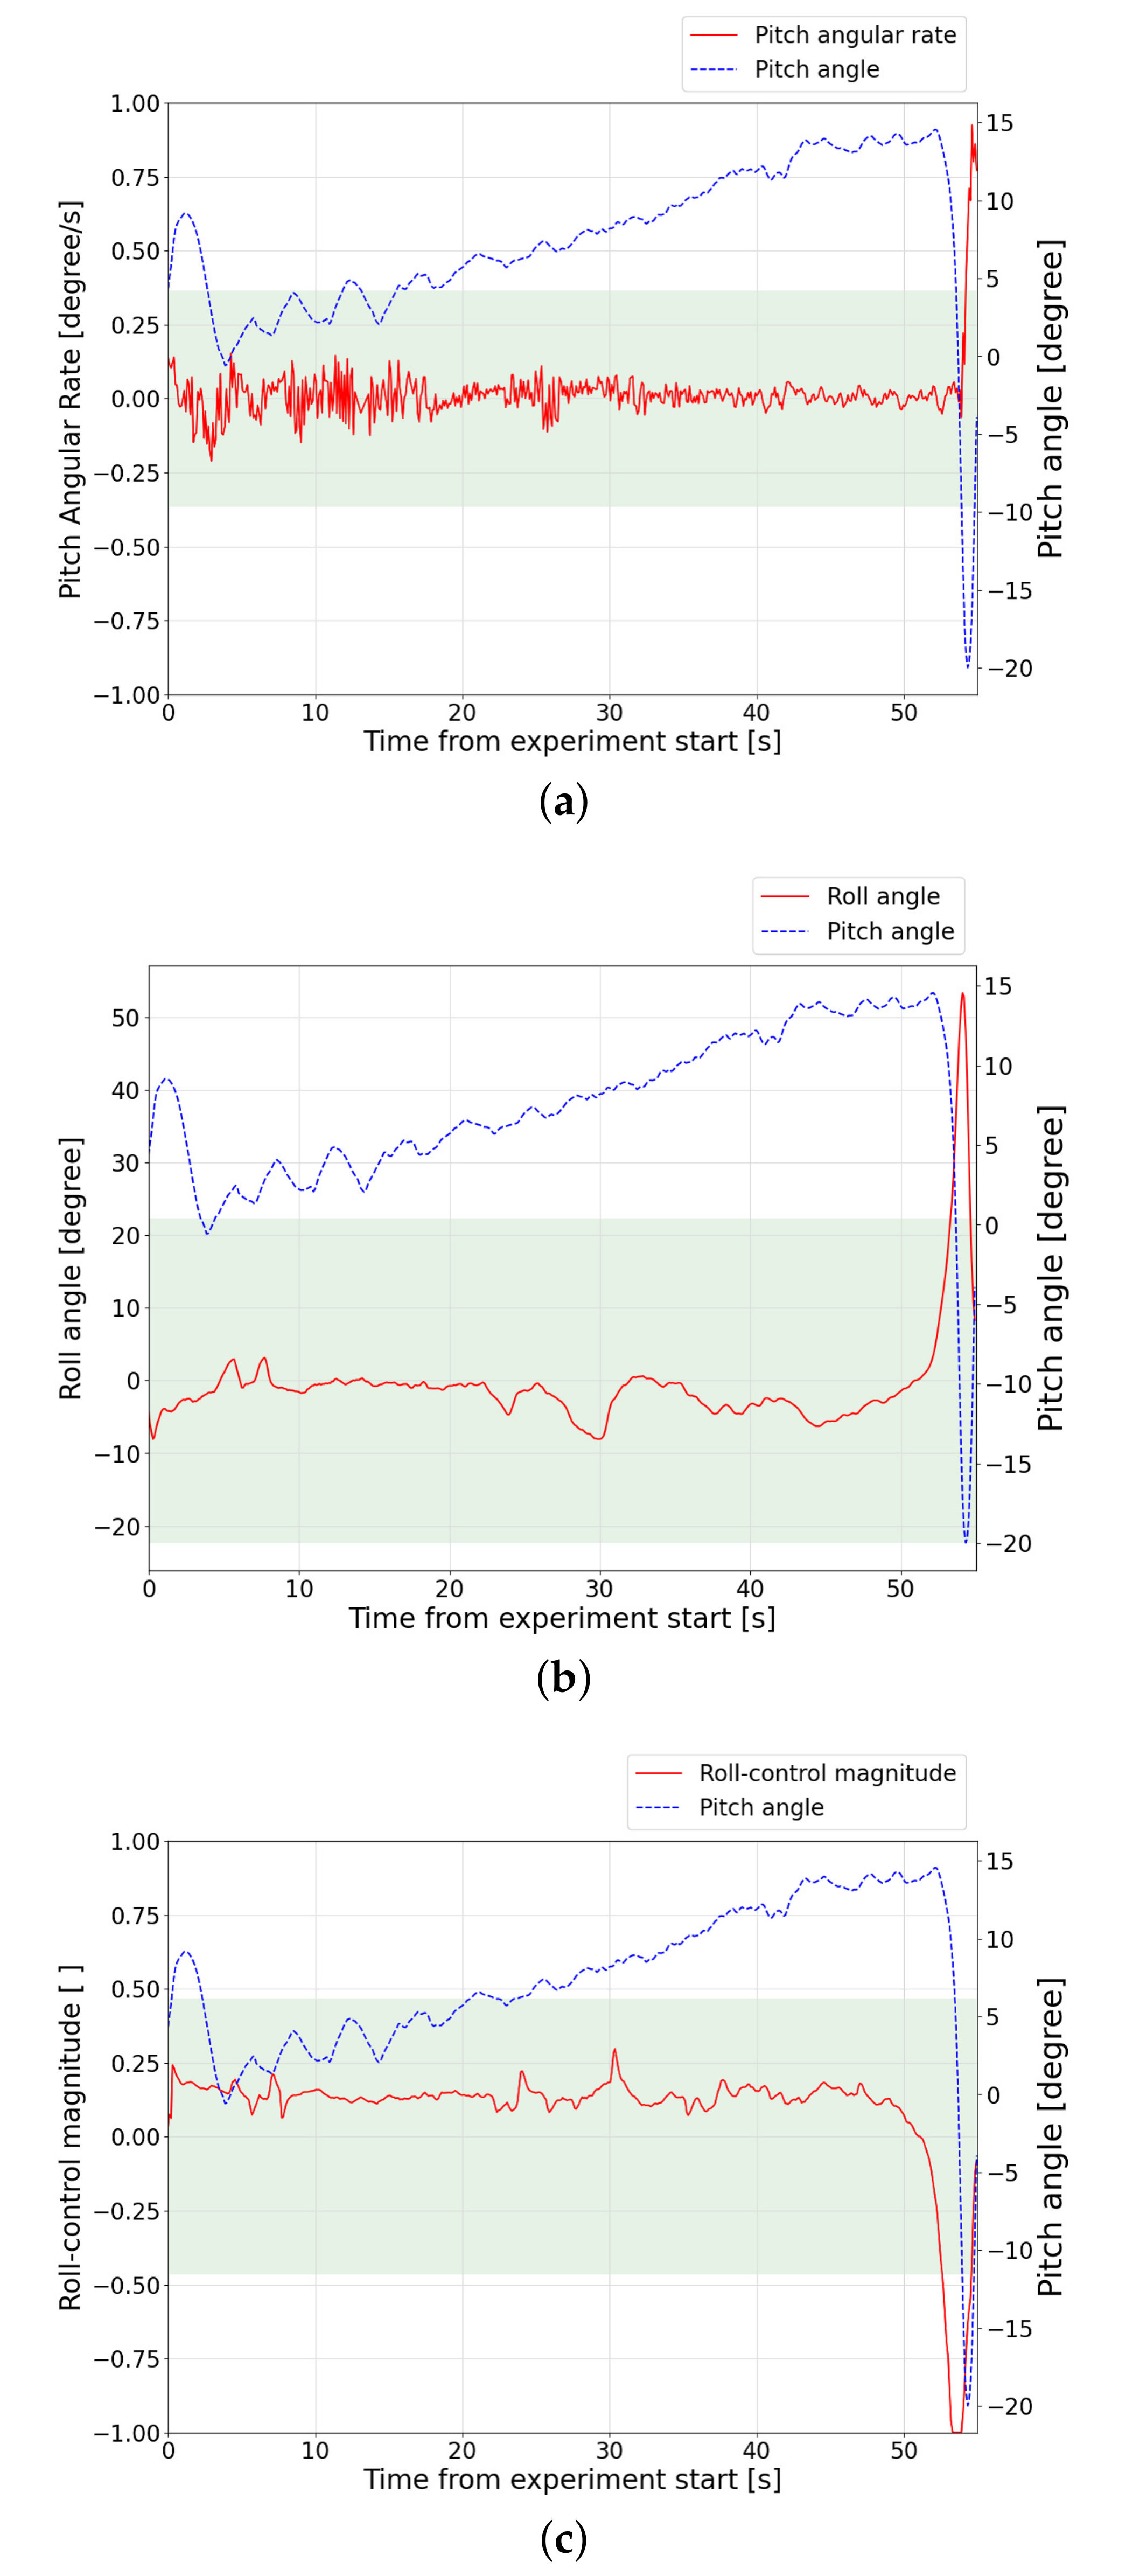
4. Evaluation of DBD-PA Flow Control
- Pitch angular rate (Figure 11a, [deg/s], where is the pitch angle).
- Roll angle (Figure 11b, [deg]).
- Roll-control magnitude (Figure 11c, [-]).
5. Conclusions
Author Contributions
Funding
Institutional Review Board Statement
Informed Consent Statement
Data Availability Statement
Acknowledgments
Conflicts of Interest
References
- Enloe, C.L.; McLaughlin, T.E.; VanDyken, R.D.; Kachnew, K.D.; Jumper, E.J.; Corke, T.C. Mechanisms and Responses of a Single Dielectric Barrier Plasma Actuator: Plasma Morphology. AIAA J. 2004, 42, 589–594. [Google Scholar] [CrossRef]
- Corke, T.C.; Enloe, C.L.; Wilkinson, S.P. Dielectric Barrier Discharge Plasma Actuators for Flow Control. Annu. Rev. Fluid Mech. 2010, 42, 505–529. [Google Scholar] [CrossRef]
- Boeuf, J.P.; Lagmich, Y.; Unfer, T.; Callegari, T.; Pitchford, L. Electrohydrodynamic force in dielectric barrier discharge plasma actuators. J. Phys. D 2007, 40, 652–662. [Google Scholar] [CrossRef]
- Nishida, H.; Abe, T. Numerical analysis of plasma evolution on dielectric barrier discharge plasma actuator. J. Appl. Phys. 2011, 110, 013302. [Google Scholar] [CrossRef]
- Kotsonis, M.; Ghaemi, S.; Veldhuis, L.; Scarano, F. Measurement of the body force field of plasma actuators. J. Phys. D Appl. Phys. 2011, 44, 045204. [Google Scholar] [CrossRef]
- Geuns, R.; Goekce, S.; Plyushchev, G.; Leyland, P.; Pimentel, R.; de Champlain, A.; Jean, Y. Understanding SDBD Actuators: An Experimental Study on Plasma Characteristics. In Proceedings of the AIAA Aviation, 45th AIAA Plasmadynamics and Lasers Conference, Atlanta, GA, USA, 16–20 June 2014. AIAA-2014-2811. [Google Scholar]
- Benard, N.; Moreau, E. Electrical and mechanical characteristics of surface AC dielectric barrier discharge plasma actuators applied to airflow control. Exp. Fluids 2014, 55, 1846. [Google Scholar] [CrossRef] [Green Version]
- Post, M.L.; Corke, T.C. Separation Control on High Angle of Attack Airfoil Using Plasma Actuators. AIAA J. 2004, 42, 2177–2184. [Google Scholar] [CrossRef]
- Visbal, M.R.; Gaitonde, D.V.; Roy, S. Control of Transitional and Turbulent Flows Using Plasma-Based Actuators. In Proceedings of the 36th AIAA Fluid Dynamics Conference and Exhibit, San Francisco, CA, USA, 5–8 June 2006. AIAA-2006-3230. [Google Scholar]
- Greenblatt, D.; Goksel, B.; Schule, C.Y.; Romann, D.; Paschereit, C.O. Dielectric Barrier Discharge Flow Control at Very Low Flight Reynolds Numbers. AIAA J. 2008, 46, 1528–1541. [Google Scholar] [CrossRef]
- Sato, M.; Aono, H.; Yakeno, A.; Nonomura, T.; Fujii, K.; Okada, K.; Asada, K. Multifactorial Effects of Operating Conditions of Dielectric-Barrier-Discharge Plasma Actuator on Laminar-Separated-Flow Control. AIAA J. 2015, 53, 2544–2559. [Google Scholar] [CrossRef]
- Sekimoto, S.; Nonomura, T.; Fujii, K. Frequency Effects in Burst-mode Actuation of Dielectric-Barrier-Discharge Plasma Actuator for Separation Control. AIAA J. 2016, 55, 1385–1392. [Google Scholar] [CrossRef]
- Jukes, T.N.; Segawa, T.; Furutani, H. Flow Control on a NACA 4418 Using Dielectric-Barrier-Discharge Vortex Generators. AIAA J. 2013, 51, 452–465. [Google Scholar] [CrossRef]
- Matsuno, T.; Kawaguchi, M.; Fujita, N.; Yamada, G.; Kawazoe, H. Jet Vectoring and Enhancement of Flow Control Performance of Trielectrode Plasma Actuator Utilizing Sliding Discharge. In Proceedings of the 6th AIAA Flow Control Conference, New Orleans, LA, USA, 25–28 June 2012. AIAA-2012-3238. [Google Scholar]
- Corke, T.C.; Post, M.L. Overview of Plasma Flow Control: Concepts, Optimization, and Applications. In Proceedings of the 43rd AIAA Aerospace Sciences Meeting and Exhibit(USA), Reno, NV, USA, 10–13 January 2005. AIAA-2005-563. [Google Scholar]
- Asada, K.; Ninomiya, Y.; Oyama, A.; Fujii, K. Airfoil Flow Experiment on the Duty Cycle of DBD Plasma Actuator. In Proceedings of the 47th AIAA Aerospace Sciences Meeting Including the New Horizons Forum and Aerospace Exposition(USA), Orlando, FL, USA, 5–8 January 2009. AIAA-2009-531. [Google Scholar]
- Goksel, B.; Greenblatt, D.; Rechenberg, I.; Nayeri, C.N.; Paschereit, C.O. Steady and Unsteady Plasma Wall Jets for Separation and Circulation Control. In Proceedings of the 3rd AIAA Flow Control Conference(USA), San Francisco, CA, USA, 5–8 June 2006. AIAA-2006-3686. [Google Scholar]
- Sidorenko, A.A.; Zanin, B.Y.; Postnikov, B.V.; Budovsky, A.D.; Starikovskii, A.Y.; Roupassov, D.V.; Zavialov, I.N.; Malmuth, N.D.; Smereczniak, P.; Silkey, J.S. Pulsed Discharge Actuators for Rectangular Wings Separation Control. In Proceedings of the 45th AIAA Aerospace Sciences Meeting and Exhibit, Reno, NV, USA, 8–11 January 2007. AIAA-2007-941. [Google Scholar]
- Fujii, K. High-performance computing-based exploration of flow control with micro devices. Phlosop. Trans. R. Soc. A 2014, 372, 20130326. [Google Scholar] [CrossRef] [PubMed] [Green Version]
- Skourides, C.; Nyfantis, D.; Leyland, P.; Bosse, H.; Ott, P. Mechanisms of Control Authority by Nanosecond Pulsed Dielectric Barrier Discharge Actuators on Flow Separation. Appl. Sci. 2019, 9, 2989. [Google Scholar] [CrossRef] [Green Version]
- Little, J.; Takashima, K.; Nishihara, M.; Adamovich, I.; Samimy, M. Separation Control with Nanosecond-Pulse-Driven Dielectric Barrier Discharge Plasma Actuators. AIAA J. 2012, 50, 350–365. [Google Scholar] [CrossRef]
- Fujii, K. Three flow features behind the flow control authority of DBD plasma actuator: Result of high-fidelity simulations and the related experiments. Appl. Sci. 2018, 8, 546. [Google Scholar] [CrossRef] [Green Version]
- Borghi, C.A.; Cristofolini, A.; Neretti, G.; Seri, P.; Rossetti, A.; Talamelli, A. Duty cycle and directional jet effects of a plasma actuator on the flow control around a NACA0015 airfoil. Meccanica 2017, 52, 3661–3674. [Google Scholar] [CrossRef]
- Zoppini, G.; Belan, M.; Zanotti, A.; Di Vinci, L.; Campanardi, G. Stall control by plasma actuators: Characterization along the airfoil span. Energies 2020, 13, 1374. [Google Scholar] [CrossRef] [Green Version]
- Sekimoto, S.; Fujita, K.; Fujii, K. Flow-control experiment around half-span wing model for dbd-pa application on UAV. In Proceedings of the AIAA Scitech 2021 Forum, Virtual Event, Nashville, TN, USA, 11–15 & 19–21 January 2021. AIAA-2021-1944. [Google Scholar]
- Imanberdiyev, N.; Fu, C.; Kayacan, E.; Chen, I.M. Autonomous navigation of UAV by using real-time model-based reinforcement learning. In Proceedings of the 2016 14th International Conference on Control, Automation, Robotics and Vision (ICARCV), Phuket, Thailand, 13–15 November 2016; pp. 1–6. [Google Scholar]
- Cui, J.h.; Wei, R.x.; Liu, Z.c.; Zhou, K. UAV motion strategies in uncertain dynamic environments: A path planning method based on Q-learning strategy. Appl. Sci. 2018, 8, 2169. [Google Scholar] [CrossRef] [Green Version]
- Matsuda, H.; Tanaka, M.; Osako, T.; Yamazaki, K.; Simura, N.; Asayama, M.; Oryu, Y. Plasma Actuation Effect on a MW class Wind Turbine. Int. J. Gas Turbine Propuls. Power Syst. 2017, 9, 47–52. [Google Scholar] [CrossRef]
- Sidorenko, A.A.; Budovsky, A.D.; Pushkarev, A.V.; Maslov, A.A. Flight Testing of DBD Plasma Separation Control System. In Proceedings of the 46th AIAA Aerospace Sciences Meeting and Exhibit, Reno, NV, USA, 7–10 January 2008. AIAA-2008-373. [Google Scholar]
- Grundmann, S.; Frey, M.; Tropea, C. Unmanned Aerial Vehicle (UAV) with Plasma Actuators for Separation Control. In Proceedings of the 47th AIAA Aerospace Sciences Meeting Including the New Horizons Forum and Aerospace Exposition, Orlando, FL, USA, 5–8 January 2009. AIAA-2009-698. [Google Scholar]
- Friedrichs, W. Unmanned Aerial Vehicle for Flow Control Experiments with Dielectric Barrier Discharge Plasma Actuators. Ph.D. Thesis, Technischen Universität Darmstadt, Darmstadt, Germany, 2014. [Google Scholar]
- GBSElectronik. Special Pulse Generators. Available online: https://www.gbs-elektronik.de/en/hv-pulse-technology/special-pulse-generators.php (accessed on 20 December 2021).
- Sekimoto, S.; Fujii, K.; Yoneda, H. Flow Control on an Unmanned Aerial Vehicle Using a Plasma Actuator Driven By a Substrate-Size Power Supply. In Proceedings of the AIAA Scitech 2020 Forum, Orlando, FL, USA, 6–10 January 2020. AIAA-2020-0825. [Google Scholar]
- VOLANTEXRC. Volantex RC Ranger EX Long Range FPV/UAV Platform Unibody Big Weight Carrier (V757-3) PNP|VolantexRC. Available online: https://www.volantexrc.eu/volantex-rc-ranger-ex-long-range-fpv-uav-platform-unibody-big-weight-carrier-v757-3-pnp-p-224.html (accessed on 20 December 2021).
- Hamada, S.; Moreno, C.P. Development of an Unmanned Aerial Vehicle (UAV) Research Platform for Flutter Analysis. In Proceedings of the 2018 AIAA Atmospheric Flight Mechanics Conference, Kissimmee, FL, USA, 8–12 January 2018. AIAA-2018-0021. [Google Scholar]
- Sekimoto, S.; Fujii, K.; Hosokawa, S.; Akamatsu, H. Flow-control capability of electronic-substrate-sized power supply for a plasma actuator. Sens. Actuators A Phys. 2020, 306, 111951. [Google Scholar] [CrossRef]
- Ashpis, D.; Laun, M.; Griebeler, E. Progress toward accurate measurements of power consumption of DBD plasma actuators. In Proceedings of the 50th AIAA Aerospace Sciences Meeting Including the New Horizons Forum and Aerospace Exposition, Nashville, TN, USA, 9–12 January 2012. AIAA 2012-823. [Google Scholar]
- Suzuki, K.; Komuro, A.; Sato, S.; Sakurai, M.; Mitsuhashi, K.; Sekiya, N.; Watanabe, Y.; Kanagawa, K.; Ando, A. Development of small high-voltage AC power supply for a dielectric barrier discharge plasma actuator. Rev. Sci. Instrum. 2021, 92, 024707. [Google Scholar] [CrossRef] [PubMed]
- Pixhawk. The Open Standards for Drone Hardware. Available online: http://pixhawk.org/ (accessed on 20 December 2021).
- PX4. PX4 Autopilot User Guide (Master). Available online: https://docs.px4.io/master/en/ (accessed on 20 December 2021).
- Yoneda, H.; Goto, A.; Kato, H.; Sekimoto, S.; Fujii, K. Flight Test of UAV with DBD-Pa Flow Control. In Proceedings of the AIAA Scitech 2021 Forum, Virtual Event, Nashville, TN, USA, 11–15 & 19–21 January 2021. AIAA-2021-1942. [Google Scholar]
- Ogawa, T.; Asada, K.; Tatsukawa, T.; Fujii, K. Computational Analysis of the Control Authority of Plasma Actuators for Airfoil Flows at Low Angle of Attack. In Proceedings of the AIAA Scitech 2020 Forum, Orlando, FL, USA, 6–10 January 2020. AIAA-2020-0578. [Google Scholar]


| Wing span | 1980 mm |
| Overall Length | 1170 mm |
| Mean aerodynamic chord | 216 mm |
| Wing surface | 0.426 |
| Weight | 225 g |
| Dimension | D115 mm × W65 mm × H60 mm |
| Supply Voltage | DC 24 V |
| Voltage amplitude | Approx. 7 to 8 kV (fixed, depending on PA length) |
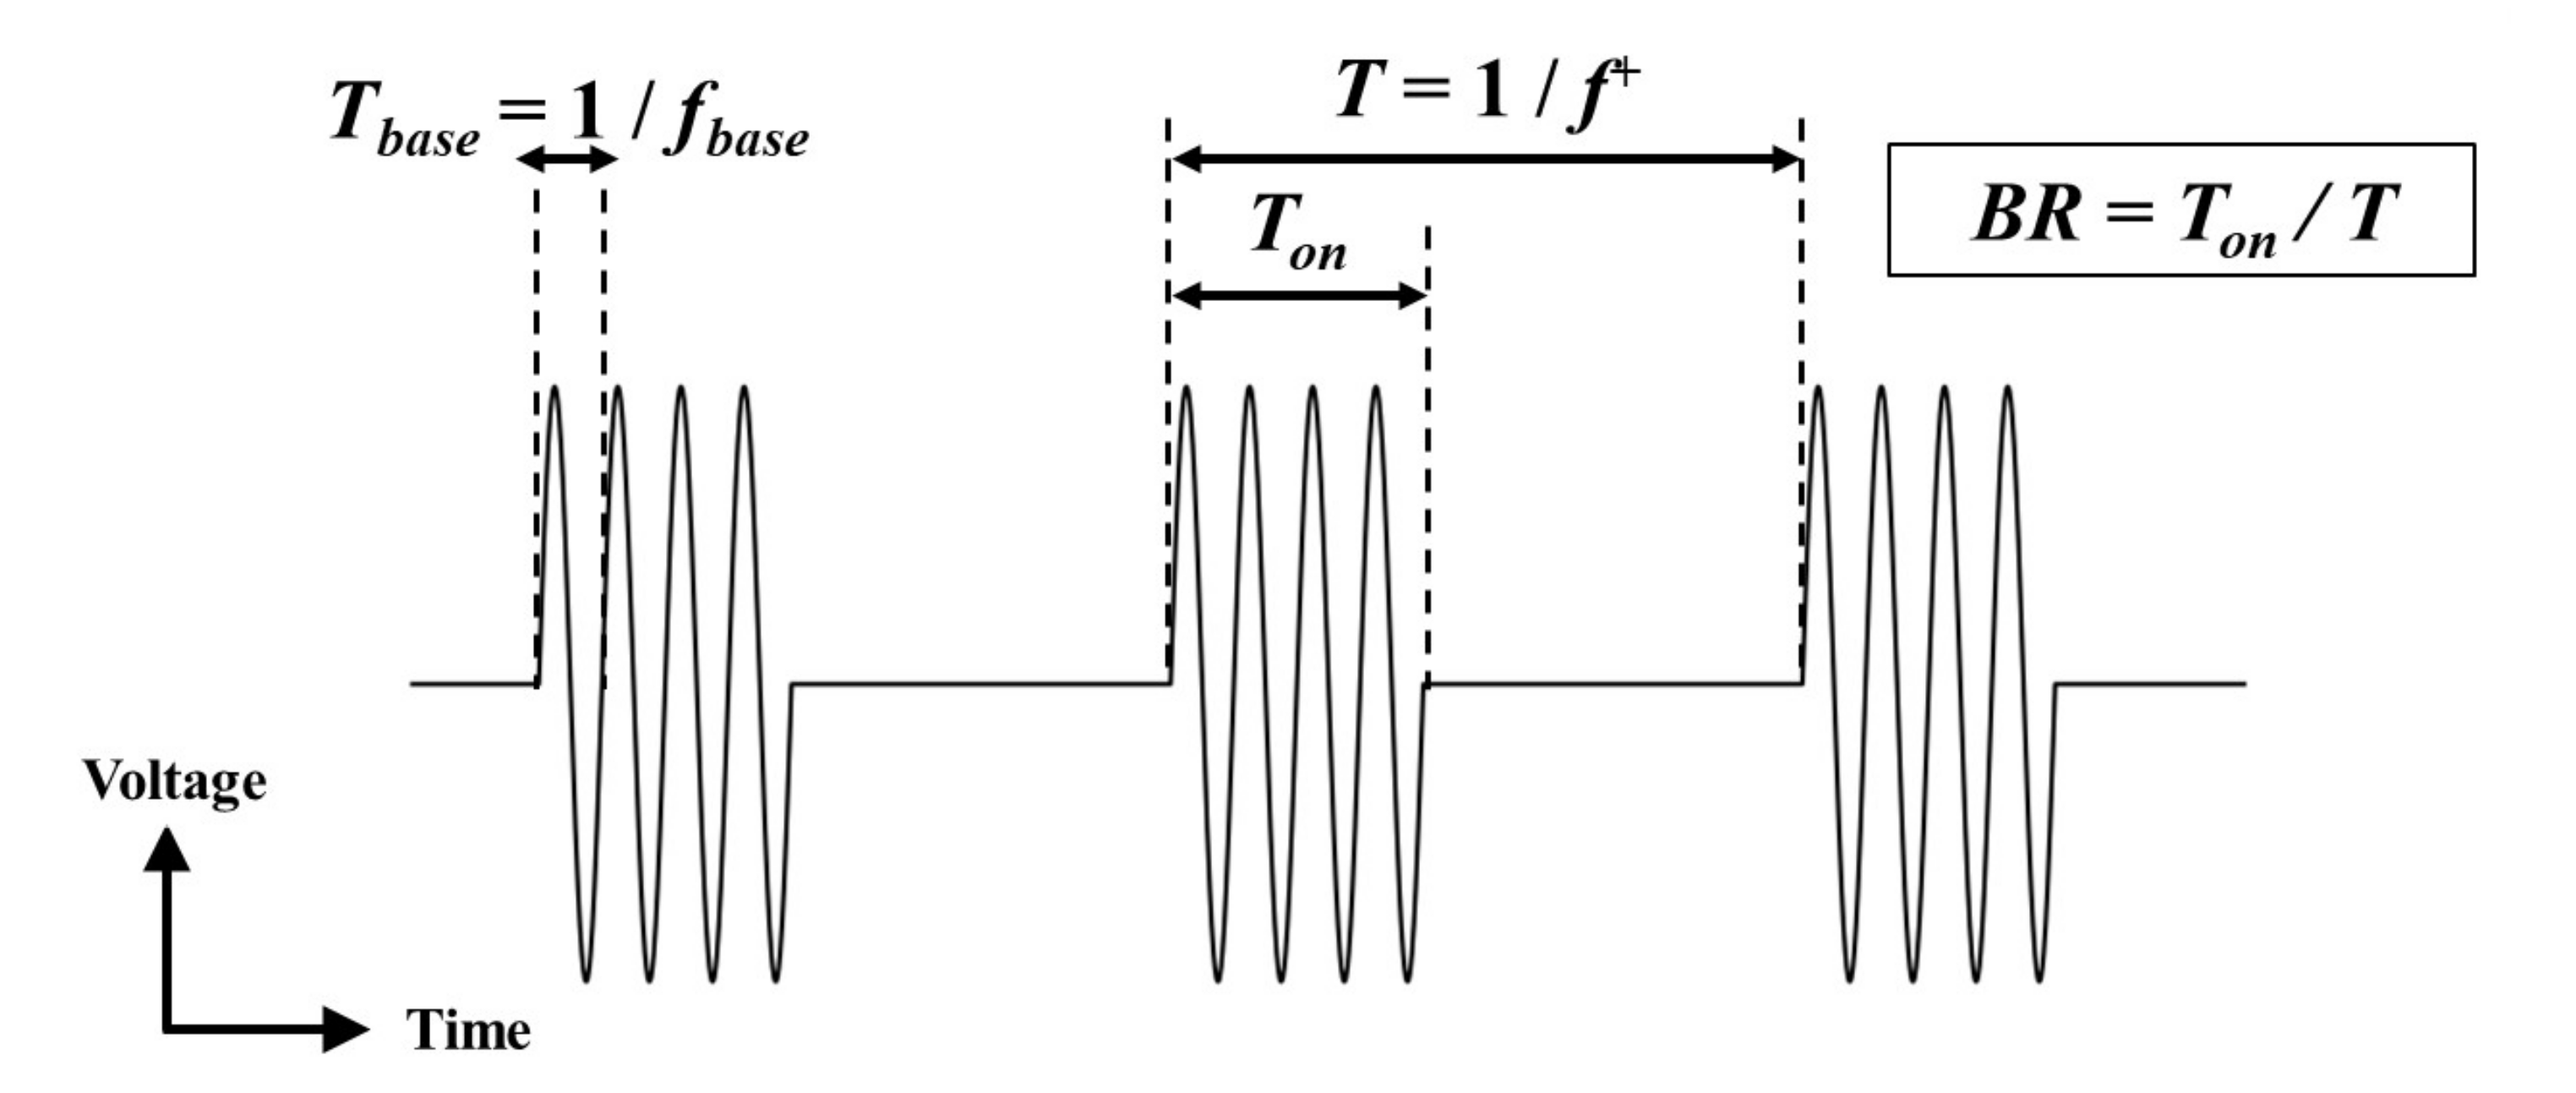
| Base frequency () | 6000 Hz (fixed) |
| Burst frequency () | 100 to 600 Hz (every 100 Hz) |
| Burst ratio () | 0 to 100% (every 10%) |
| Design load | 280 pF (under no-load condition) |
| Item | Weight [g] | Impact on Overall [%] |
|---|---|---|
| UAV | 1930 | 60.3 |
| Propulsion battery | 420 | 13.1 |
| PA system | 355 | 11.1 |
| Autonomous flight system and related items | 495 | 15.5 |
| Total | 3200 |
| Parameter | Average | Standard Deviation |
|---|---|---|
| Q [deg/s] | 0.730 | 0.272 |
| [deg] | 44.6 | 17.8 |
| [-] | −0.932 | 0.185 |
| Number | Vehicle Pitch Angle |
|---|---|
| Total Case Num | 246 |
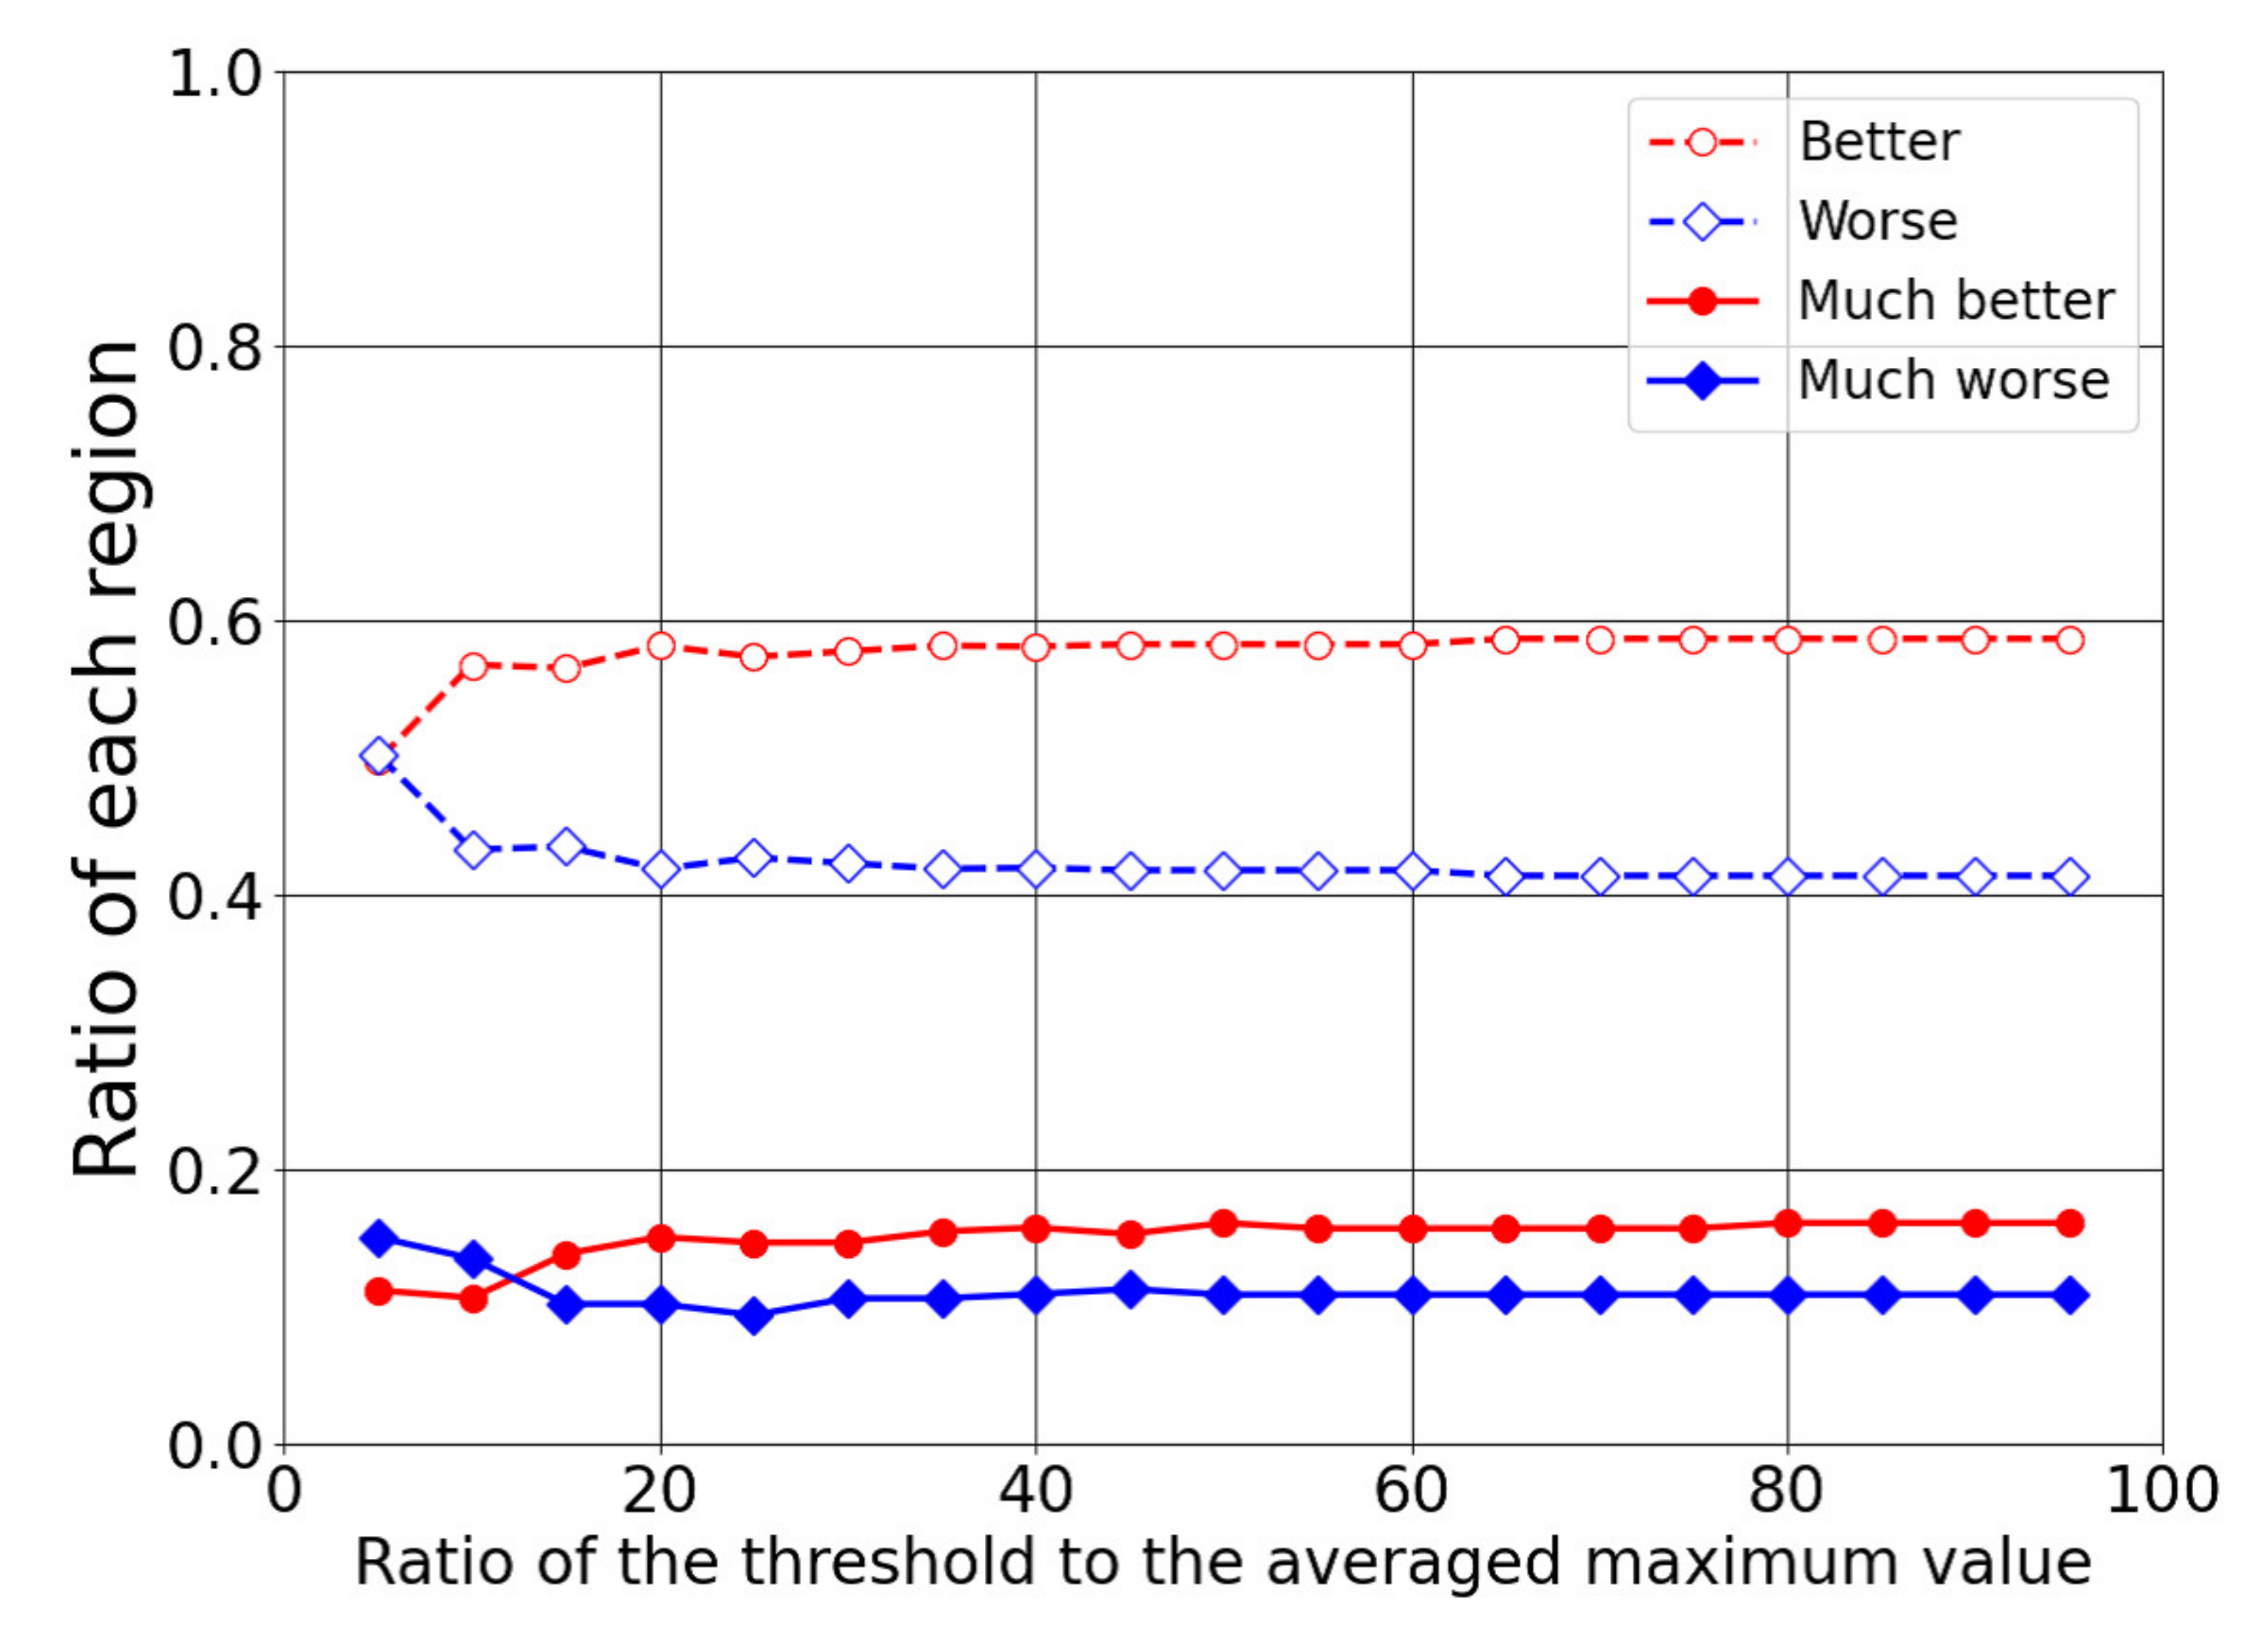
| ON > OFF (better) | 146 (59.3%) |
| ON < OFF (worse) | 100 (40.7%) |
| ON > OFF + 4 (much better) [deg] | 39 (15.9%) |
| ON < OFF − 4 (much worse) [deg] | 26 (10.6%) |
Publisher’s Note: MDPI stays neutral with regard to jurisdictional claims in published maps and institutional affiliations. |
© 2022 by the authors. Licensee MDPI, Basel, Switzerland. This article is an open access article distributed under the terms and conditions of the Creative Commons Attribution (CC BY) license (https://creativecommons.org/licenses/by/4.0/).
Share and Cite
Sekimoto, S.; Kato, H.; Fujii, K.; Yoneda, H. In-Flight Demonstration of Stall Improvement Using a Plasma Actuator for a Small Unmanned Aerial Vehicle. Aerospace 2022, 9, 144. https://doi.org/10.3390/aerospace9030144
Sekimoto S, Kato H, Fujii K, Yoneda H. In-Flight Demonstration of Stall Improvement Using a Plasma Actuator for a Small Unmanned Aerial Vehicle. Aerospace. 2022; 9(3):144. https://doi.org/10.3390/aerospace9030144
Chicago/Turabian StyleSekimoto, Satoshi, Hiroki Kato, Kozo Fujii, and Hiroshi Yoneda. 2022. "In-Flight Demonstration of Stall Improvement Using a Plasma Actuator for a Small Unmanned Aerial Vehicle" Aerospace 9, no. 3: 144. https://doi.org/10.3390/aerospace9030144