Article

Simulation of Runway Irregularities in a Novel Test Rig for Fully Electrical Landing Gear Systems

Department of Mechanical and Aerospace Engineering, Politecnico di Torino, 10129 Turin, Italy
*
Author to whom correspondence should be addressed.
Aerospace 2022, 9(2), 114; https://doi.org/10.3390/aerospace9020114
Submission received: 14 January 2022 / Revised: 15 February 2022 / Accepted: 17 February 2022 / Published: 21 February 2022

Abstract

:
The E-LISA research project, under way within the Clean Sky 2 framework, has the objective of developing an innovative iron bird dedicated to executing tests on the landing gear of a small aircraft transport equipped with an electro-mechanical landing gear and electrical brake. Such tests include the simulation of complete landing procedures under different operating conditions such as runway friction, presence of periodical defects along the runway, variable aircraft weight, and approach speed. To this end, the iron bird requires novel solutions in both its architecture and its control scheme. This paper details an innovative solution that is being implemented in the E-LISA iron bird to enable the execution of tests on a landing gear, reproducing the effects of any type of runway irregularity. First, the rig architecture is presented in detail, with particular care toward the hybrid position/force control system that manages its operations. Then, a simulation model is introduced with the objective of verifying the control system stability and the test rig capability to reproduce on the test articles the effects produced on the landing gear leg of periodical runway irregularities. Simulations results are presented, highlighting the stability of the proposed control scheme and providing a preliminary assessment of the system performances.

1. Introduction

The E-LISA research project, under way within the Clean Sky 2 framework, has the objective of developing an innovative iron bird dedicated to executing tests on the landing gear of a small aircraft transport equipped with an electro-mechanical landing gear and electrical brake. The E-LISA iron bird consists of a multi-functional intelligent test facility integrating hardware and software, allowing all the tests and analyses perceived as fundamental to be performed to demonstrate the maturity of an electro-mechanical landing gear, hence paving the way for its implementation in a small passenger aircraft and will include prognostics and health management (PHM) functionalities for the electrical brake system. Such tests include the simulation of complete landing procedures under different operating conditions such as runway friction (wet/dry), presence of waving and irregularities along the runway, variable aircraft weight, and approach speed.
The development and certification process of landing gear systems involves the characterization and analysis of several components, often tested separately on different test benches. A test rig dedicated to the study of the fatigue behavior of a landing gear is reported in [1], while a hydraulic solution to execute the drop-test is reported in [2]. In [3], the authors present the implementation of a high-dynamics force control loop to test the actuation system of a main landing gear within the M-346 iron bird. In [4], the authors performed the experimental validation of a simulation model of a landing gear leg through a comparison with the results obtained with a dedicated experimental setup. In this work, the landing gear leg, complete with braking system, was mounted horizontally and pressed with a pre-defined force set against a rotating cylinder to evaluate the performance of the anti-skid system. Literature on the development of PHM systems for landing gear legs is thus far limited to preliminary simulation studies for the actuation system [5], or to certain components of the electrical brakes [6], while a preliminary comparative analysis of data-driven methods was reported in [7]. The proposed iron bird is set to provide meaningful experimental data by collecting signals difficult to extract from the currently in-service aircraft. To this end, the E-LISA iron bird is able to reproduce fully comprehensive test scenarios and conditions, following the workflow described in [8]. Such scenarios include the dynamic representation of the loads on the landing gear actuator and of aircraft velocity during the entire landing phase as well as taxi and take-off, aircraft inertia and weight, lift and drag forces acting on the aircraft during landing, taxiing, and take-off, and real contact between the landing gear wheel and runway. This last subject is of particular importance to determine the expected aircraft behavior during take-off and landing procedures [9]. In [10], the authors provide an evaluation of the effects that the most common runway defects have on the contact between thee wheel and pavement, while an analysis on the effects of pavement anti-skid properties is provided in [11]. With specific reference to the last topic, an important condition to be explored is the effect of runway irregularities on the landing gear while the aircraft is moving on the runway at different speeds. Such functionalities are not usually present in classic test-bench architecture, which are usually not concerned with the simulation of the aircraft dynamics during the landing procedure. The aim of reproducing such dynamic behavior has a cascade effect on the test bench architecture, fostering the introduction of a software-in-the-loop approach typical of iron birds where the aircraft behavior is simulated in real time to compute the load pattern applied to the landing gear during the test. The runway is reproduced in the iron bird by a rotating cylinder with a large diameter, whose tip velocity is equal to that of the aircraft, and the contact force between simulated runway and landing gear wheel is generated by a hydraulic force control system, with the contact force continuously modulated as a function of aircraft conditions (weight, speed, attitude, etc.). The effect of runway irregularities is reproduced by superimposing fluctuations of the controlled force, which are a function of the irregularities and of the aircraft operating conditions to the progressively varying contact force resulting from the variation in aircraft speed and attitude during landing. A dedicated algorithm computes the instantaneous force command, and a highly responsive force control system generates the required contact force. The paper first details the test bench architecture and its control system, highlighting the innovative solutions employed to meet the program objective. The simulation model prepared to evaluate the system behavior is then presented in detail and used to study the control system stability and its expected performances for different combinations of command frequency and amplitude. The dynamic model was also used to obtain the dynamic requirements that the test-bench must meet to be capable of reproducing the effects of periodical runway irregularities on the landing gear. The expected performances were then compared against these requirements with nominal and increased aircraft weight, finally leading to the preliminary assessment of the test-bench capabilities.

2. Materials and Methods

The E-LISA iron bird is currently under development following a model-based design approach, where a high-fidelity dynamic model of the rig was prepared in MATLAB/Simulink to support the choice of its components, define its control system, and allow the preliminary study of its performances. This paragraph details the test-bench architecture and presents the employed control system, with particular care toward the novel solutions employed to meet the program ambitions. The dynamic model employed to represent the expected behavior of the test rig is then presented and its most significant features discussed.

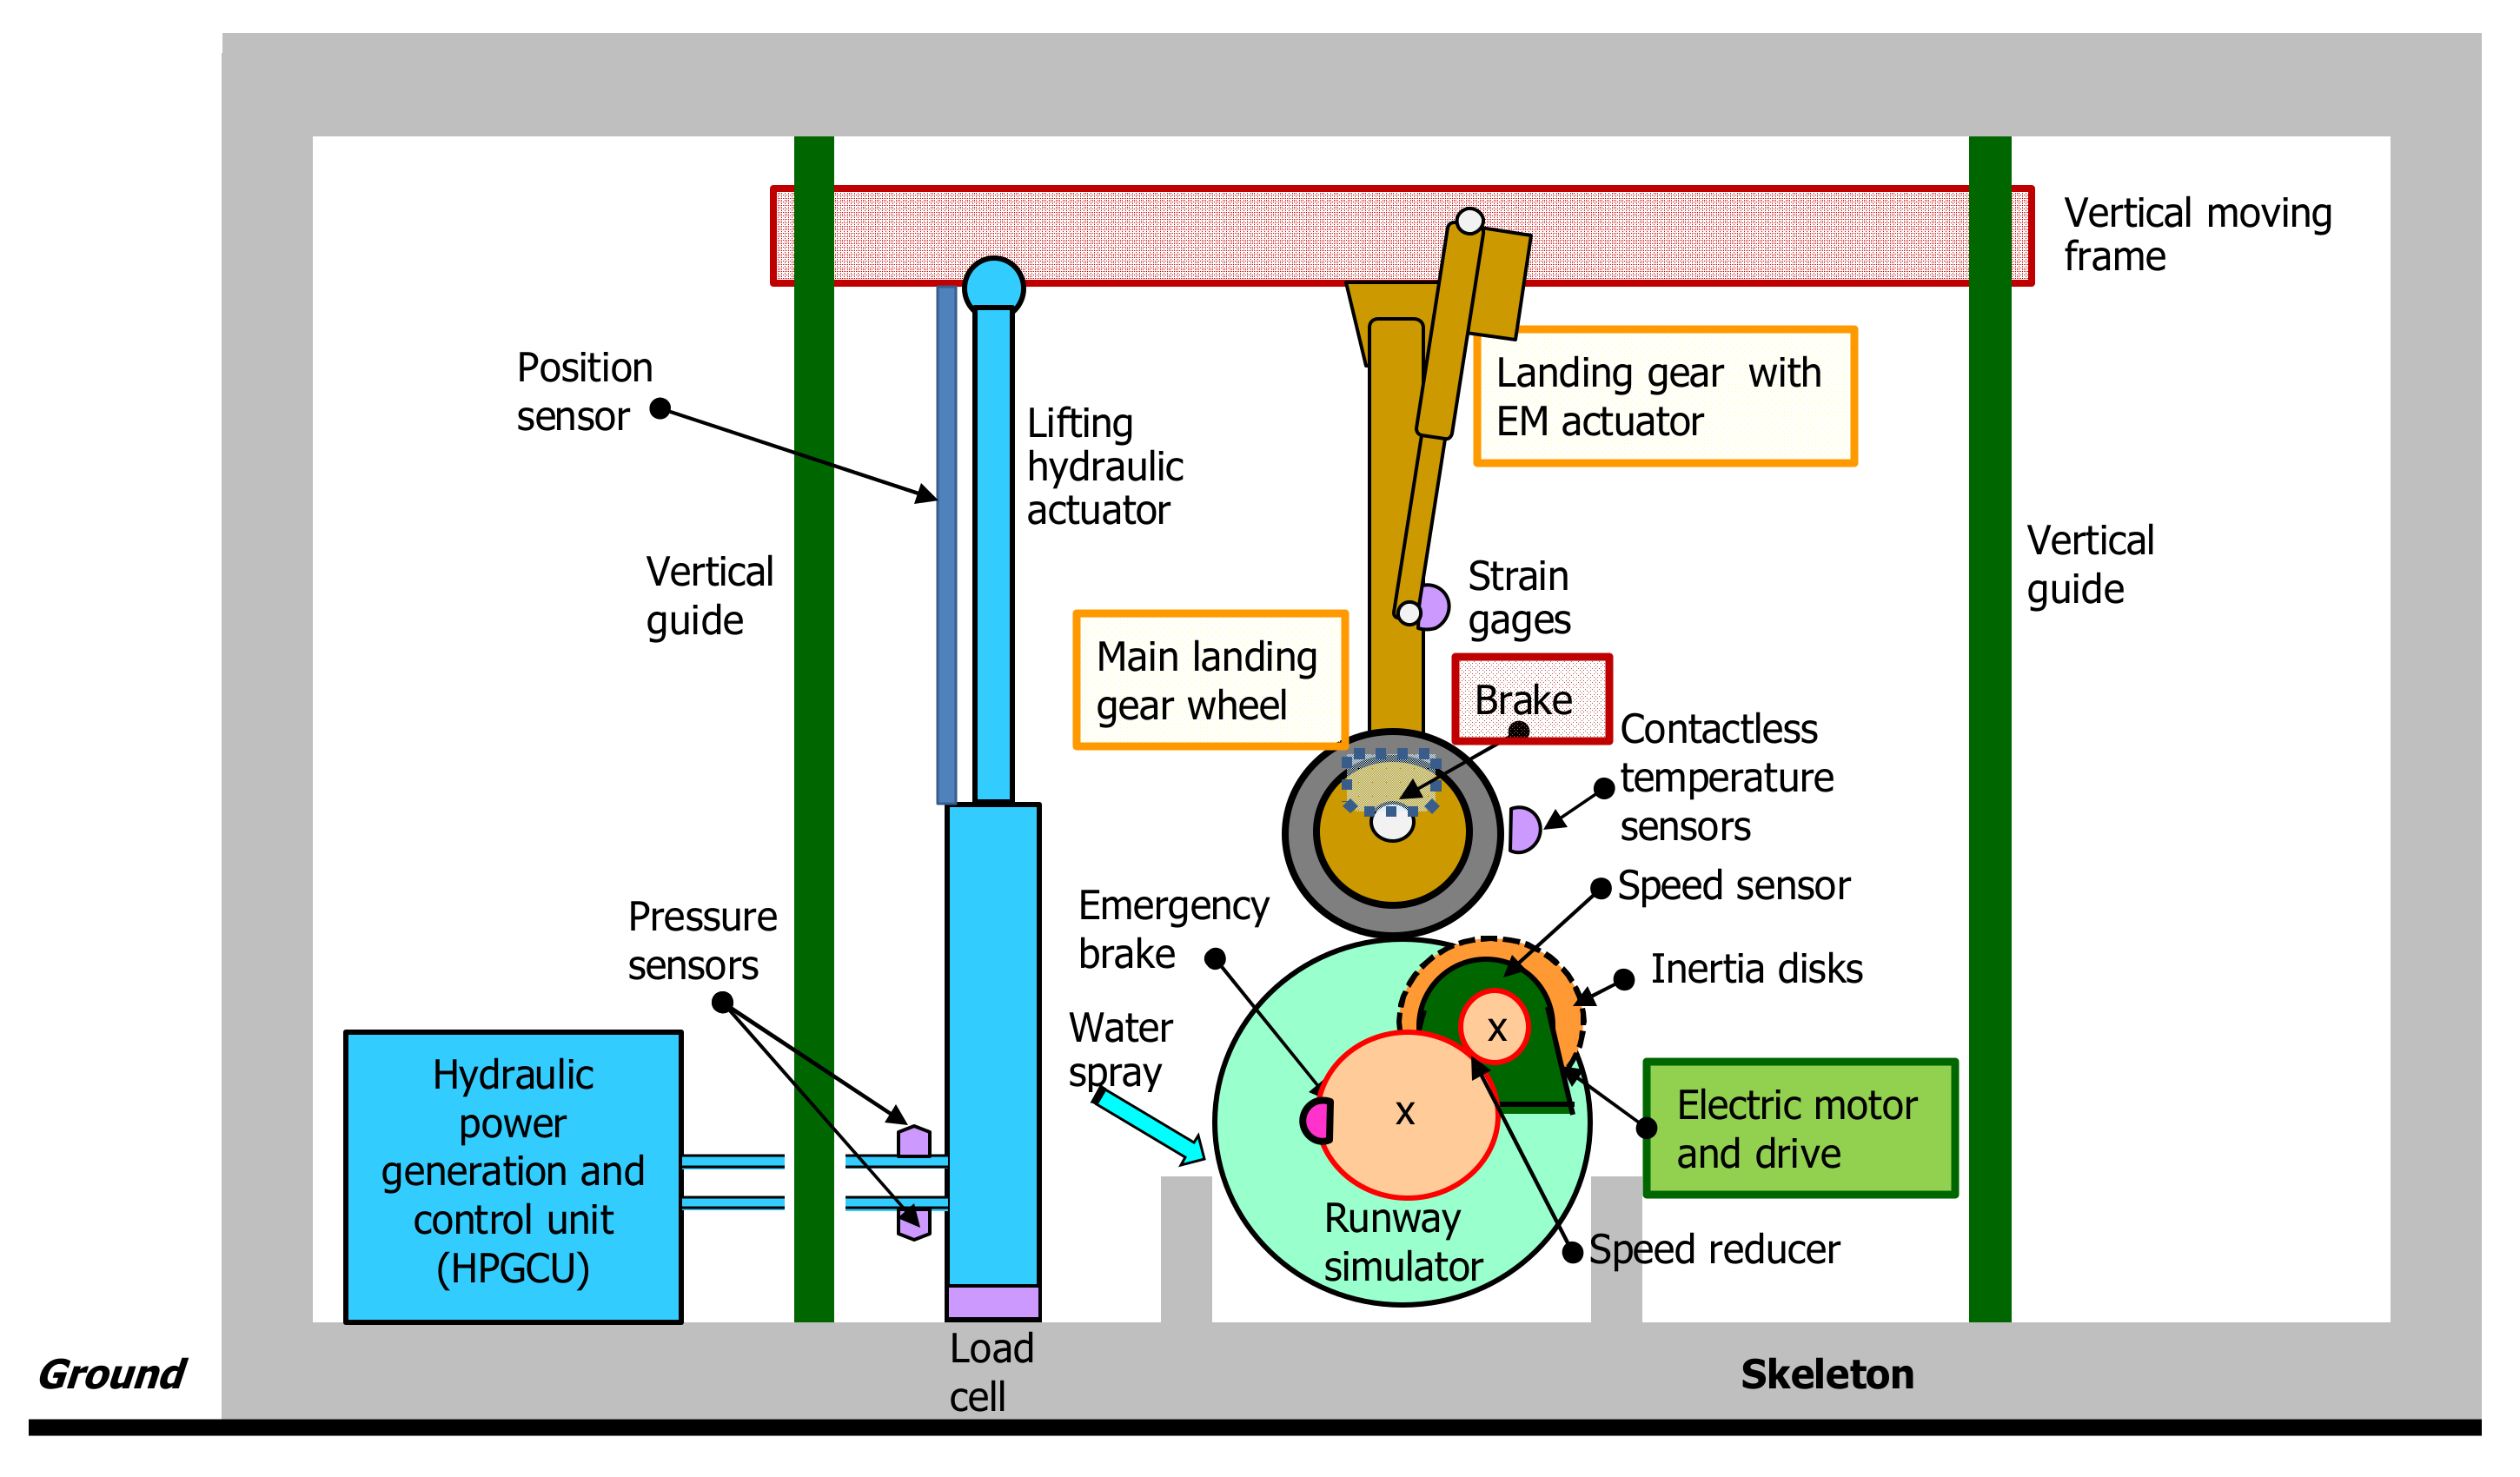
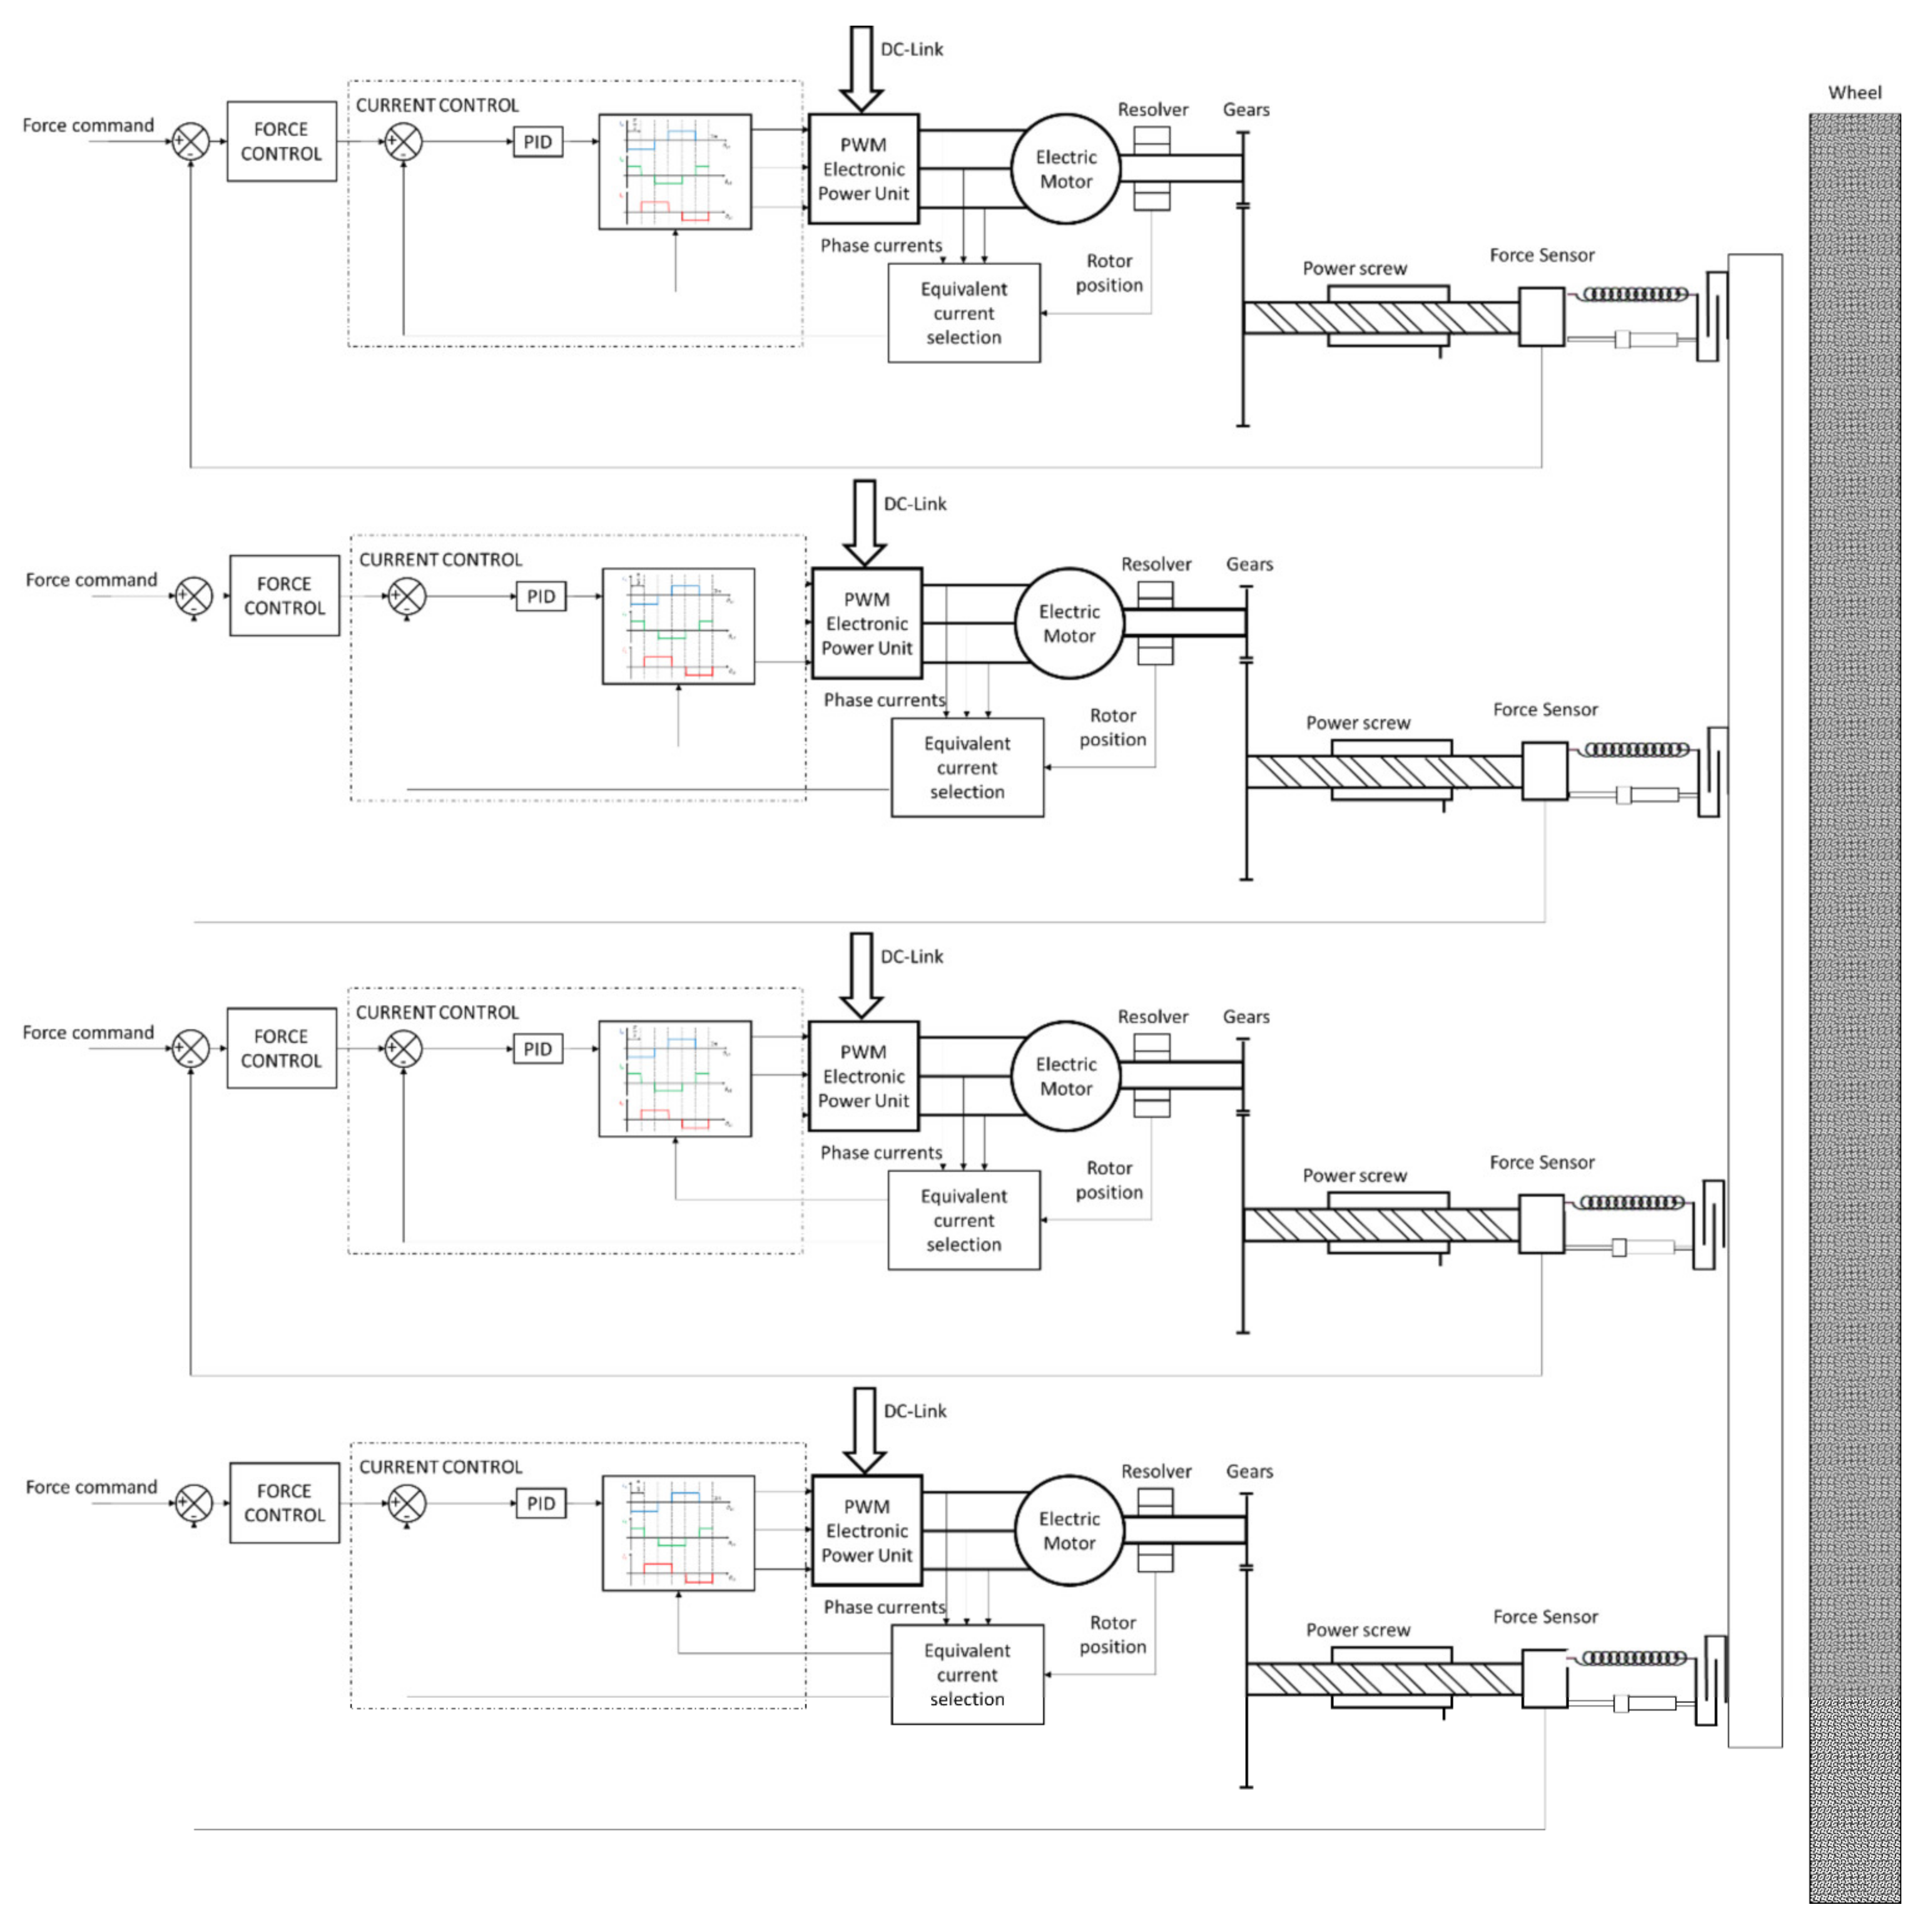
2.1. Test-Bench Architecture
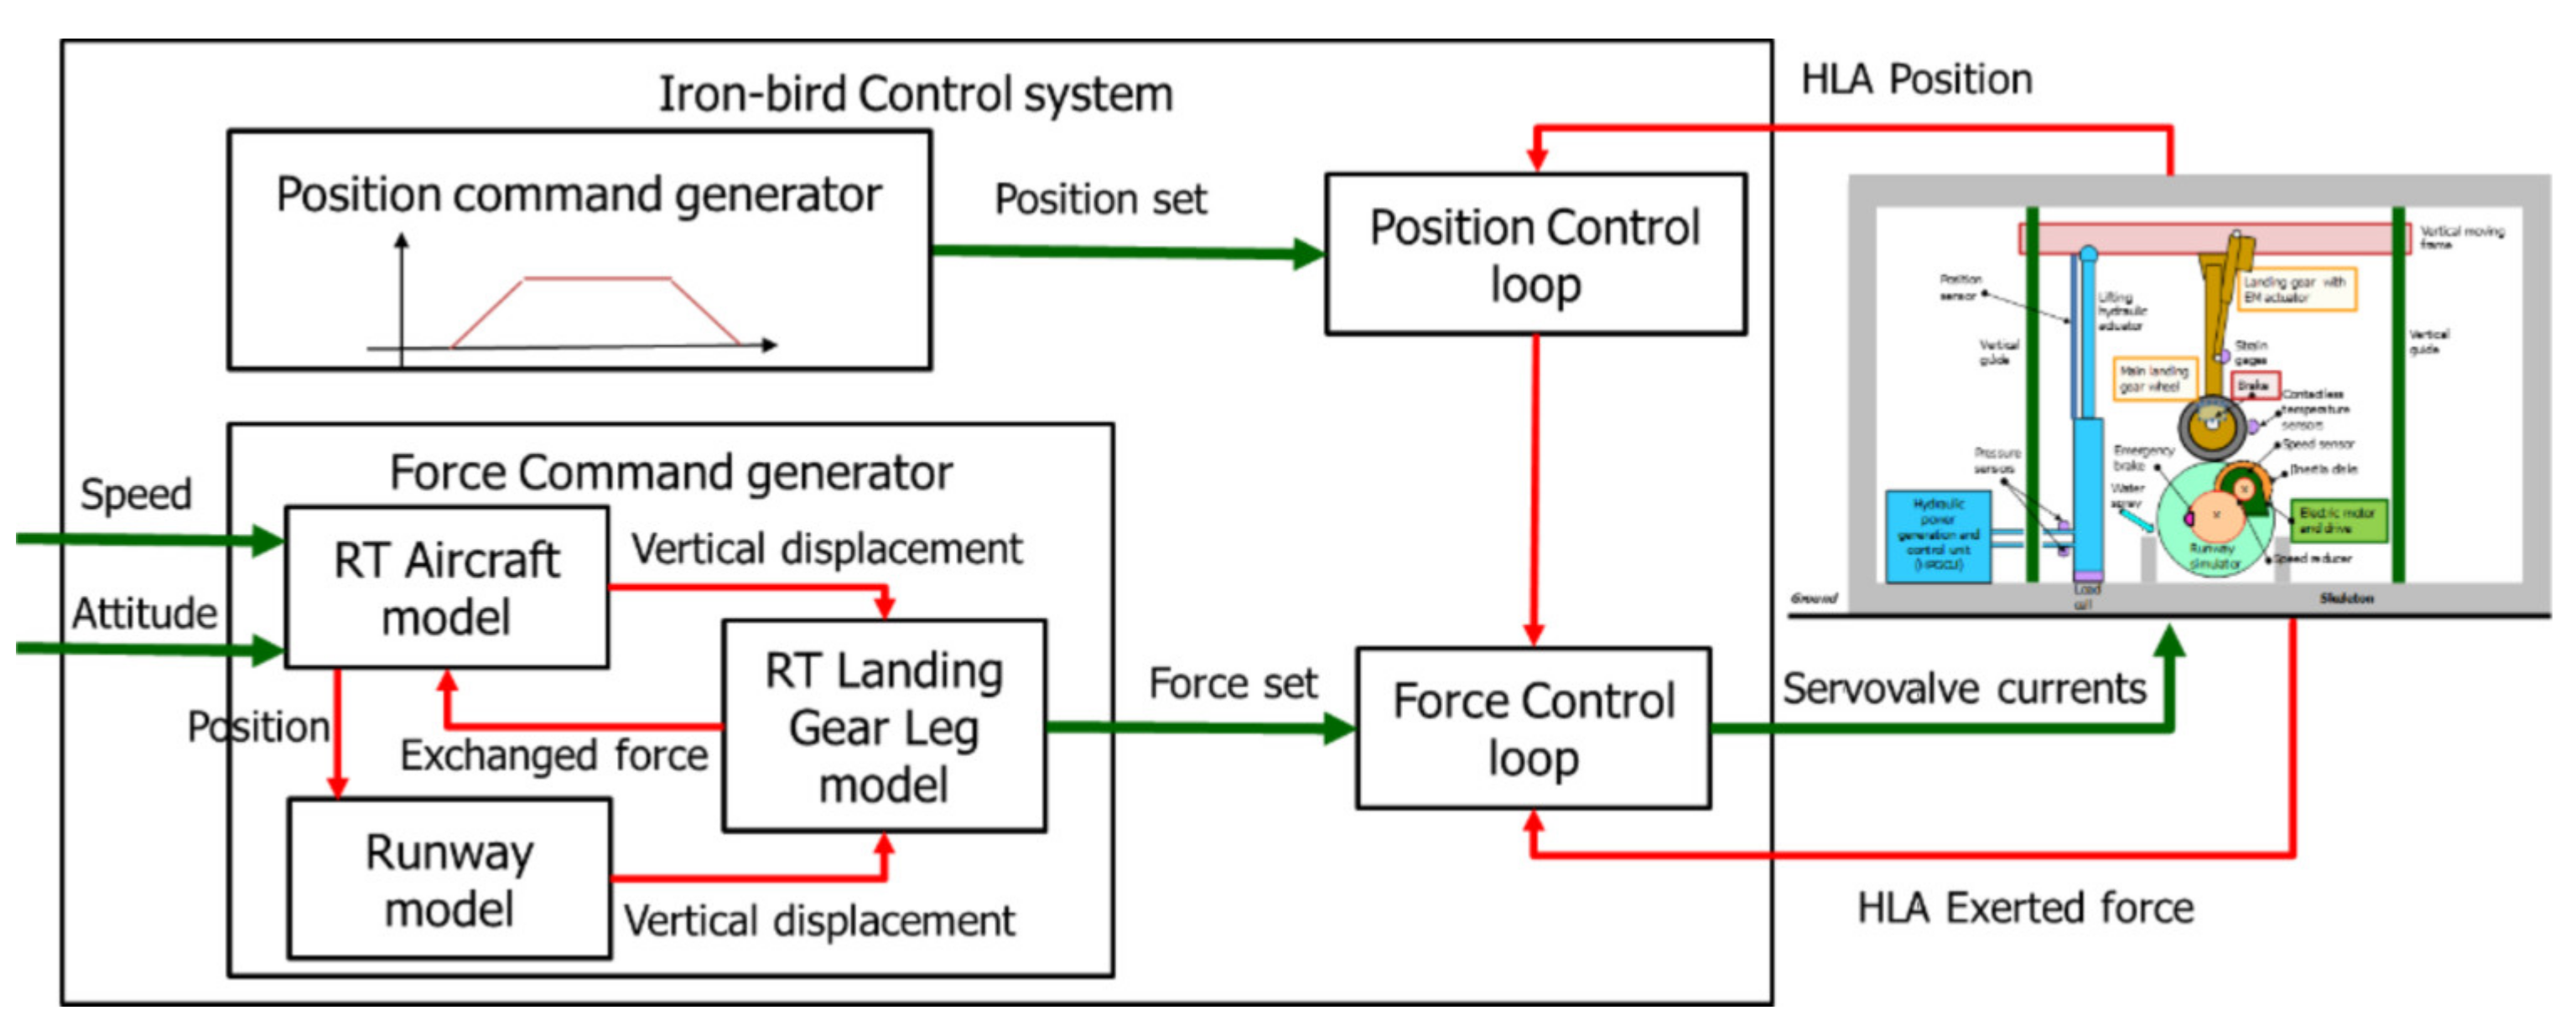
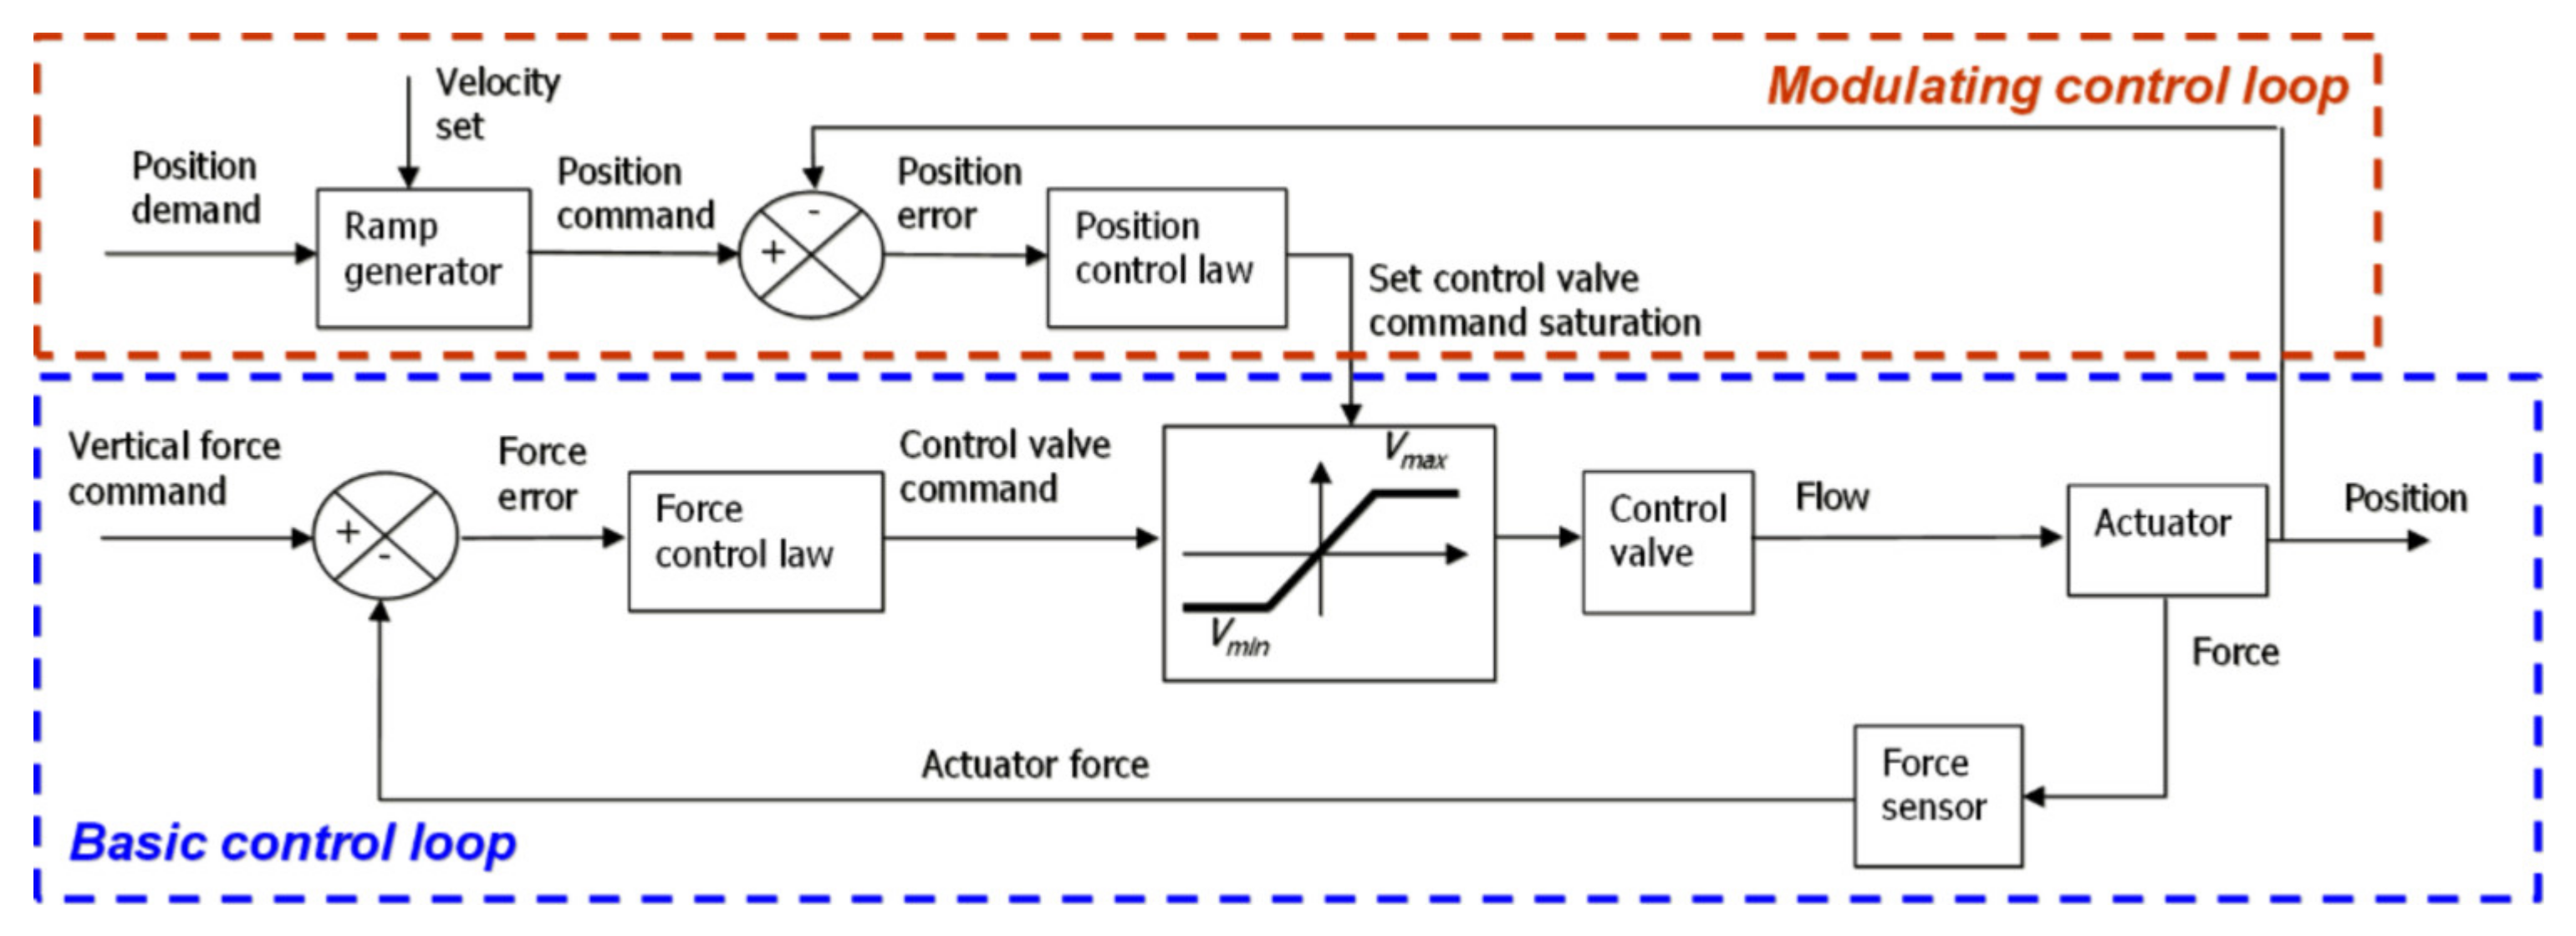
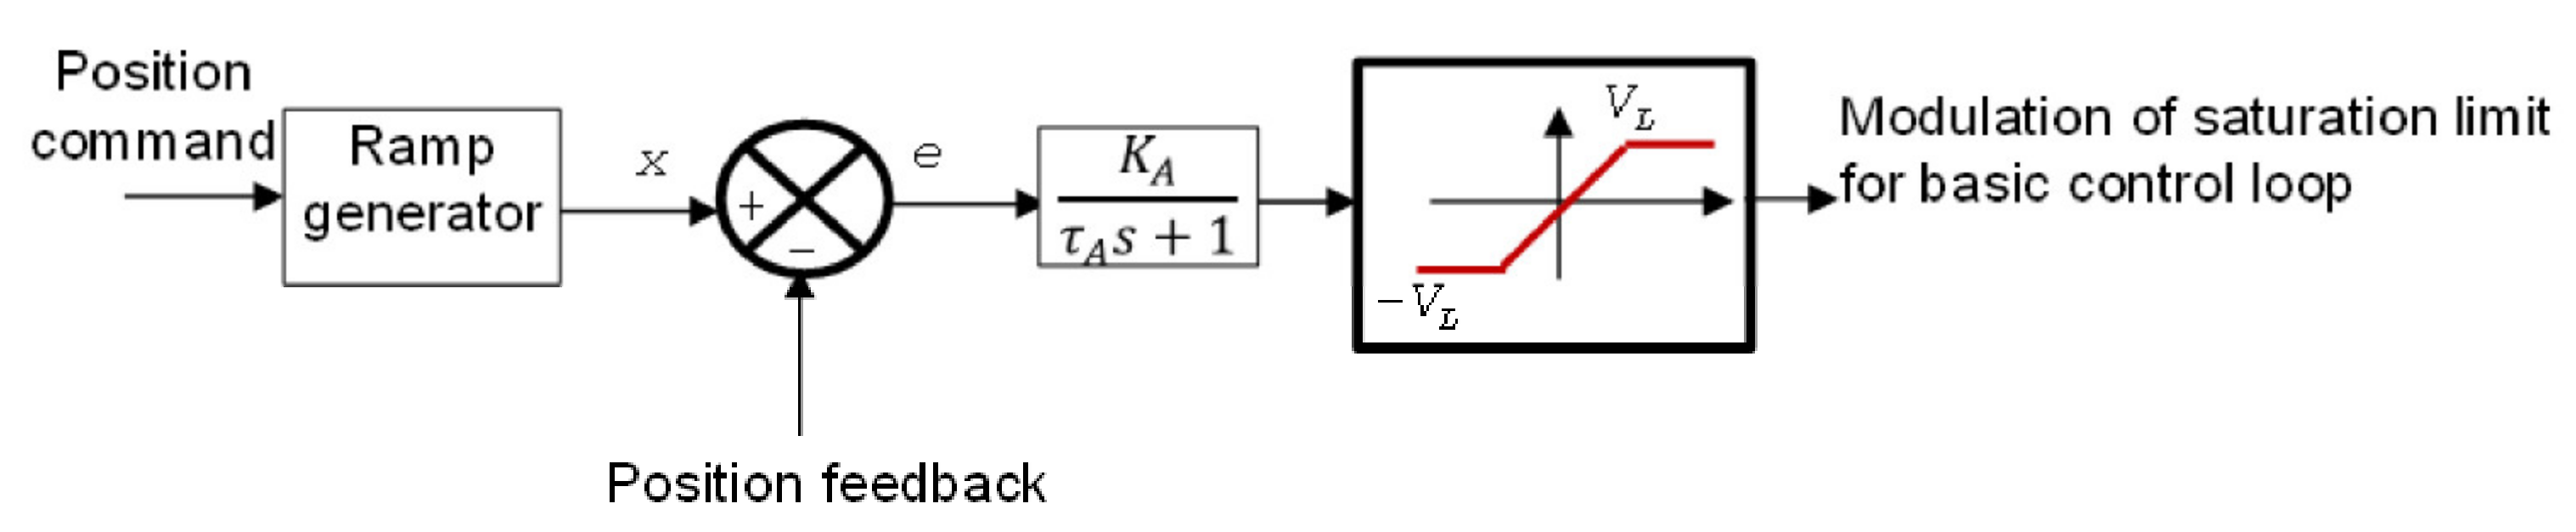
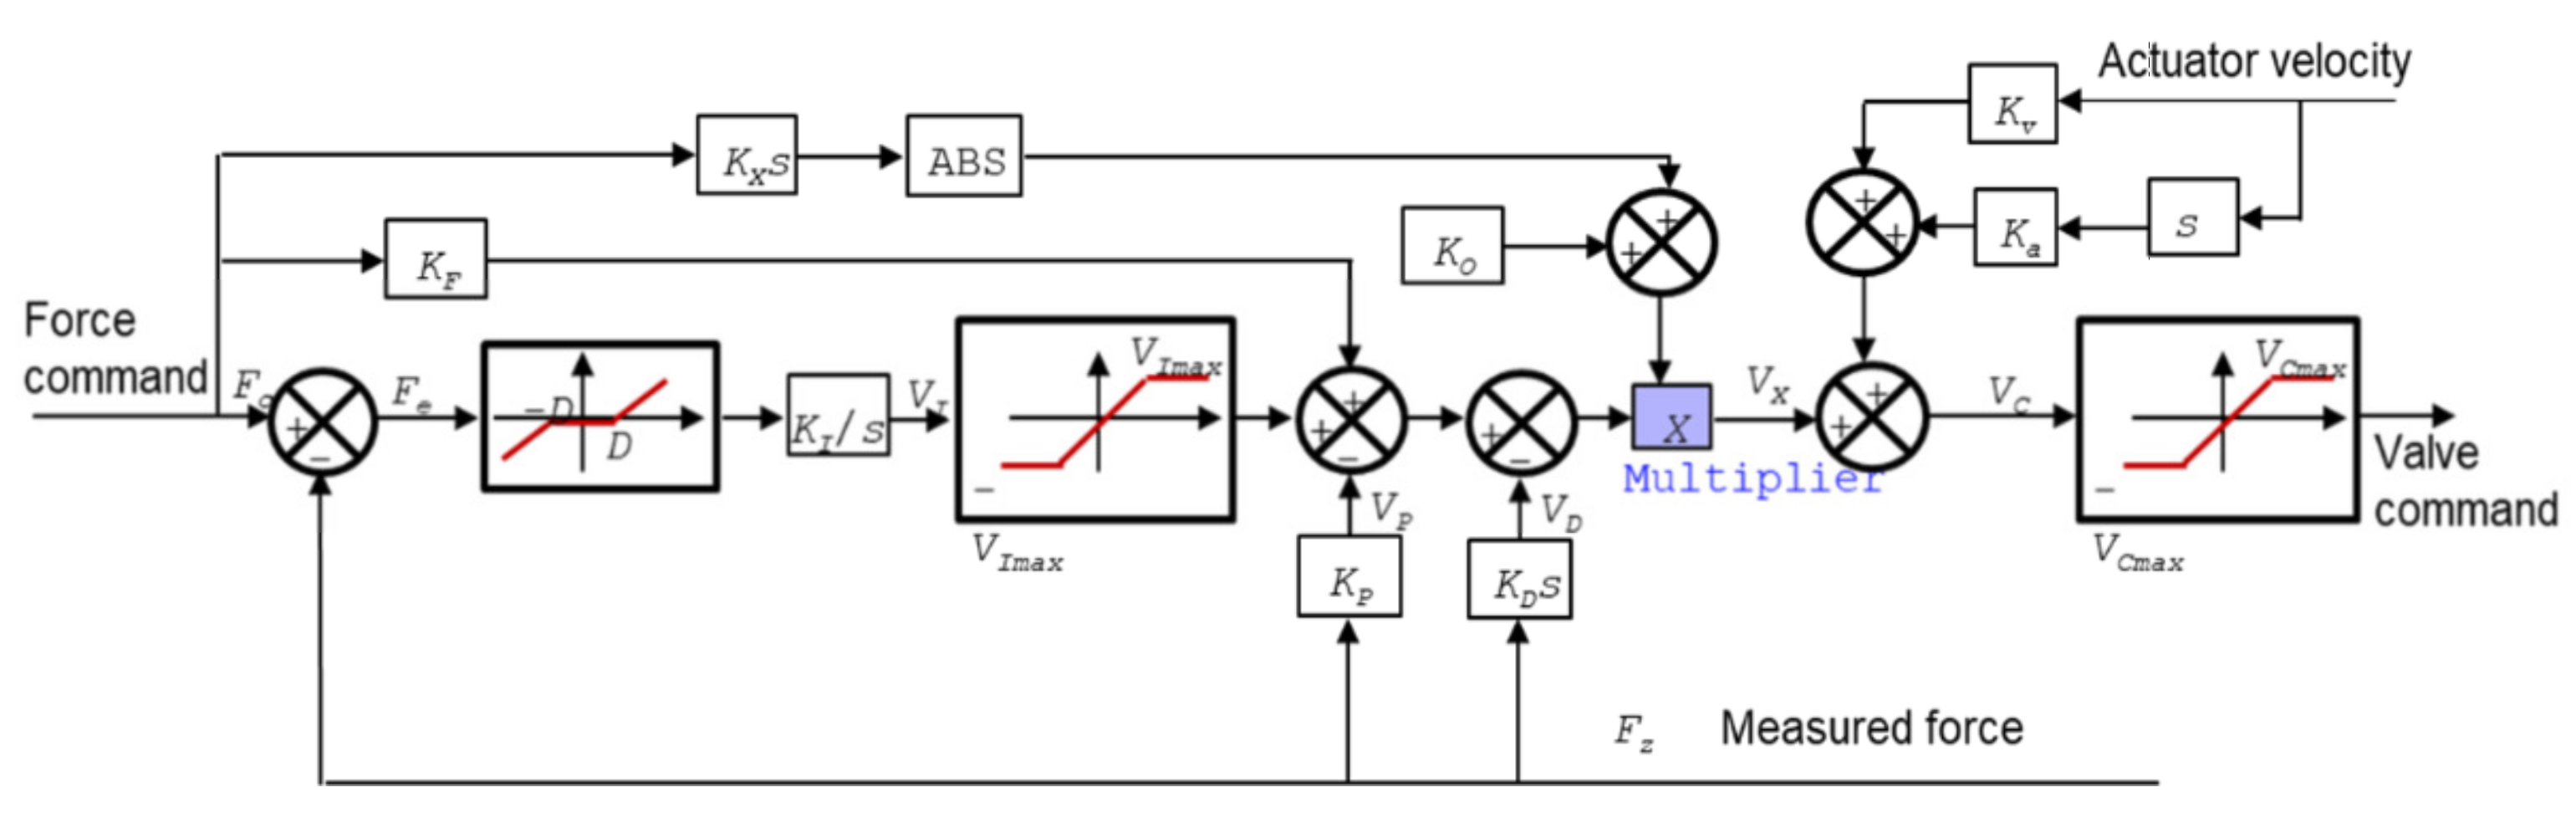
The iron bird, whose schematic is depicted in Figure 1, is based upon a fixed mechanical structure and a moving platform integral with the landing gear leg, complete with a wheel and electrical brake. The platform slides along low friction vertical guides according to the force provided by an electro-hydraulic servoactuator. A 160 L/min three-stage servovalve is used to control the flowrates according to the commands provided by the test rig control system. A calibrated by-pass orifice connects the two hydraulic lines serving the actuator to improve the dynamic response of the force-controlled system. The sensor suite includes one linear variable differential transformer (LVDT) sensor monitoring the hydraulic actuator travel, and a load cell measuring the force exchanged between the actuator and the moving platform. The hydraulic power necessary for the actuator operation is provided by a dedicated power generation unit operating at 207 bar.
The contact between the landing gear wheel and the runway is represented through a runway simulator, a rotating disk, connected to a selected number of inertia disks, representative of the aircraft inertia, through a gearbox. The diameter of the rotating cylinder is to be representative of the expected linear speed of the aircraft along the runway during the landing procedure and must be higher than the wheel diameter. The gearbox is interposed to significantly reduce the mass and the encumbrance of the flywheels, the number of which can be increased or decreased to scale-up or -down the weight of the simulated aircraft. The runway simulator was designed with the possibility to change the external coating to allow for a change in the friction coefficient between the wheel and rotating disk, while a sprinkler can be activated to reproduce the wet-runway conditions. An electric motor is used to accelerate the runway simulator up to the angular frequency corresponding to the aircraft horizontal speed given the diameter of the rotating disk.
The iron bird operation is managed by an engineering test station (ETS), which accepts the inputs from a central control unit (CCU) that in turn receives the commands from an operator via a user interface. As depicted in Figure 2, both the input data and the rig signals are sent to a dedicated computer running the real-time (RT) simulation of the aircraft conditions. The control system was designed to combine a position control loop to descend the moving platform until the wheel makes contact with the runway simulator and a force control loop to simulate the effects of the landing procedure on the landing gear leg. The real-time simulation was based upon three modules: the aircraft dynamics module receives as input the linear speed of the runway simulator and computes the expected position of the vehicle along the runway, along with the forces exchanged between the airframe and the landing gears. The runway module is used to generate the contact surface at the interface between the wheel and the runway, allowing for the introduction of waving or pavement irregularities. Finally, real-time landing gear models are used to link the aircraft with the runway and compute the force that must be imposed by the hydraulic load actuator (HLA) to replicate the aircraft behavior foreseen by the aircraft real-time model in the article.

2.2. Control System

Control of the moving platform is obtained through a combination of a basic control loop, regulating the force exerted by the hydraulic actuator, and a modulating control loop, which is used to manage the moving platform approach and retrieval at the beginning and at the end of each test. The general architecture of the two control loops and their interactions are described in Figure 3. The basic control loop implements a closed loop force control that compares the vertical force command with the actual force exerted by the HLA measured by the load cell installed on the test rig. A force error is then obtained and processed by a suitable control law, thus generating a control signal for the three-stage servovalve. Before reaching the servovalve, this signal is limited by a dynamic saturation block, where the upper and lower bounds are defined by the modulating control loop.
To better understand the reasoning behind the control scheme, let us consider the test rig starting conditions. At the beginning of each test, the hydraulic actuator is fully extended, and a command is given to bring the landing gear wheel in contact with the runway simulator. In these conditions, three inputs are given to the hydraulic actuator control system. A force command equal to the force required at the initial contact between the landing gear wheel and ground is computed by the aircraft simulator computer. Then, a position demand equal to an actuator position lower than the one corresponding to the contact between the landing gear wheel and runway simulator is obtained; the actuator is hence commanded to move beyond what can be physically attainable. Finally, a velocity set that establishes the actuator lowering velocity is required. As long as there is no contact between the landing gear wheel and runway simulator, the error of the force control loop is large, and a maximum control valve command is thus generated. This would cause a fast acceleration of the hydraulic actuator, which is, however, prevented because the modulating control loop limits the maximum value of the servovalve control current in a way that maintains the actuator velocity at the value established by the ramp generator. This process continues until the landing gear wheel touches the runway simulator. When the landing gear wheel makes contact with the runway simulator, the actuator movement stops, and the position error increases. The control valve saturation limit consequently reaches the maximum and the force developed by the actuator increases to the value established by the force command. For the remainder of the test, the control valve saturation limit remained at the maximum and the basic control loop performed the continuous force control according to the force commands received from the aircraft simulation computer. An opposite process takes place at the end of the test to raise the landing gear assembly.
The control law for the modulating control loop is shown in Figure 4. Since this loop is active only during the ascent/descent portion of the test, there are no strict requirements on its dynamic performance, and a simple first-order transfer function with saturation is used.
The control law for the basic control loop is instead depicted in Figure 5. The employed architecture implements a force control system similar to those provided in other demanding applications such as iron birds for flight control systems [12,13] and test rigs for actuators under PHM experimentation [14]. The control law is based upon a modified PID controller, where the integral contribute K I / s is computed on the error between the force set F c and force feedback F z , while both the proportional ( K p ) and the derivative ( K D s ) signals act directly on the feedback, while a feedforward K F of the force command is added to improve the system dynamics. As described in Equation (1), a feedforward signal of the time derivative of the force command, saturated between zero and a maximum value, is then used in conjunction with the fixed gain K 0 to increase the system response to quick variations of the set by increasing the voltage V x applied to the servovalve coils.
V x ¯ = F c ¯ F z ¯ K I s + K F F c ¯ K P + K D s   F z ¯ K x s F c ¯ + K 0  
For this specific application, the actuator velocity and acceleration compensations may not be necessary and are provisionally not proposed, although present in the scheme; as the project development continues, more refined data on the parameters of the test rig and of the equipment under test will become available.

2.3. Force Command Generator

The force command generator links the test rig with the control system, allowing the definition of the hardware-in-the-loop architecture of the test rig. As stated in Section 2.1, the force command generator is comprised of three modules: a simplified aerodynamic model of the aircraft; the dynamic representation of the landing gears; and a runway model. The aircraft dynamics can be described according to the two-dimensional representation depicted in Figure 6. The model is prepared to solve the vertical dynamics of the system, along with the rotation around the pitch axis as:
i F M L G , i F N L G W + L   c o s ϑ y + L t c o s ϑ y + T s i n ϑ y D s i n ϑ y = m a i r z ¨ W   Y G   c o s ϑ y W   X G   s i n ϑ y T   H t + D   H D L   H L L T   H L t F N L G H N L G = I y , a i r ϑ y ¨
where F M L G , i is the force exerted by each leg of the main landing gear (MLG) and the analogous F N L G of the nose landing gear (NLG). L and L t are the lift components due to the wing and the tail; D is the drag force; and T the engine thrust. The aircraft mass is m a i r , while I y is its moment of inertia. The parameters H T , L , L t are the distances of the application points of each considered force from the MLG leg. L a i r is the aircraft pitch, while X G , Y G are the center of mass coordinates with respect to the MLG. The model assumes symmetric loading conditions on the two legs of the main landing gear and a null roll angle. Being a two-dimensional model, the NLG steering is not represented. The aerodynamic actions are computed through the aerodynamic coefficients of lift ( C L , C L t ) and drag ( C D ) , the data for which were provided by the industrial partners of the project as a function of the aircraft attitude:
L = C L t A w i n g v 2 L T = C L t t A t a i l v 2 D = C D t A d r a g t v 2
Each force is proportional to the area of the aerodynamic surface of interest, function of the aircraft attitude, and to the square of the horizontal speed of the aircraft along the runway v . On the test rig, this signal is derived from the angular frequency of the runway simulator and used as input to the aerodynamic mode. The presence of surface irregularities on the runway is modeled as a vertical movement of the pavement function of the position of the simulated aircraft along the runway. At first, only periodical runway irregularities were considered and thus have been introduced according to the sinusoidal law hereby provided, where L0 is the irregularities pitch and X0 their amplitude.
x r w = X 0 sin 2   π v L 0   t

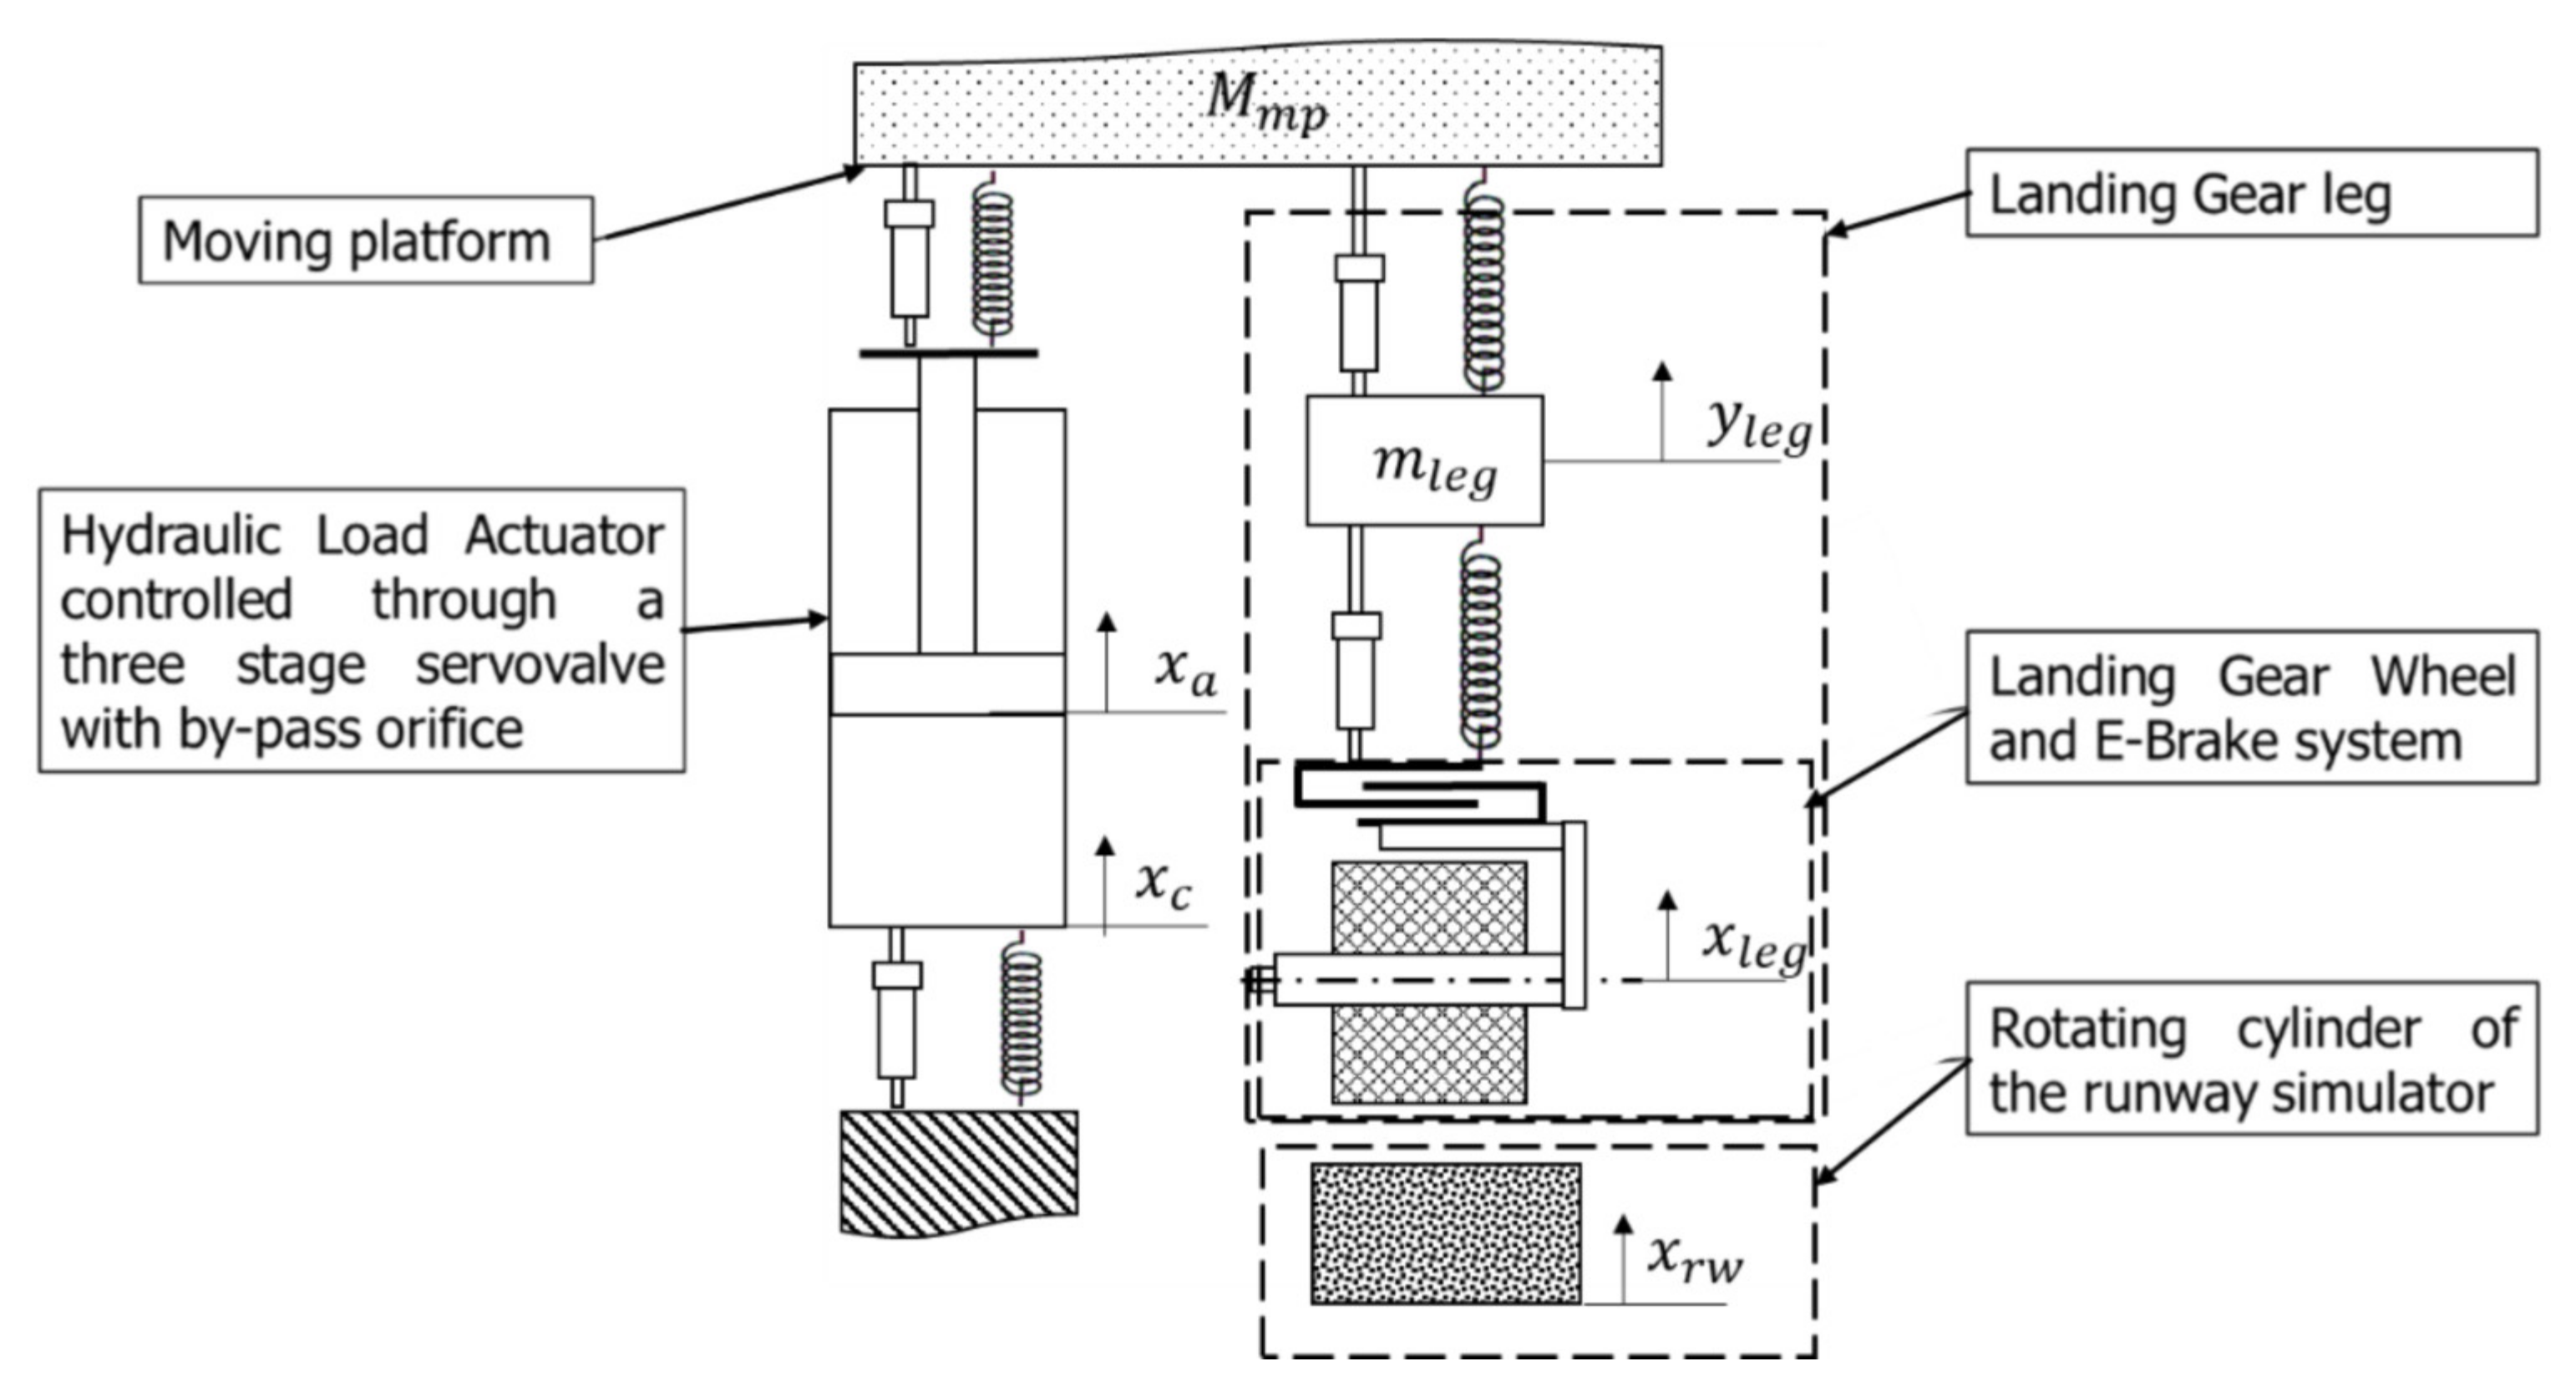
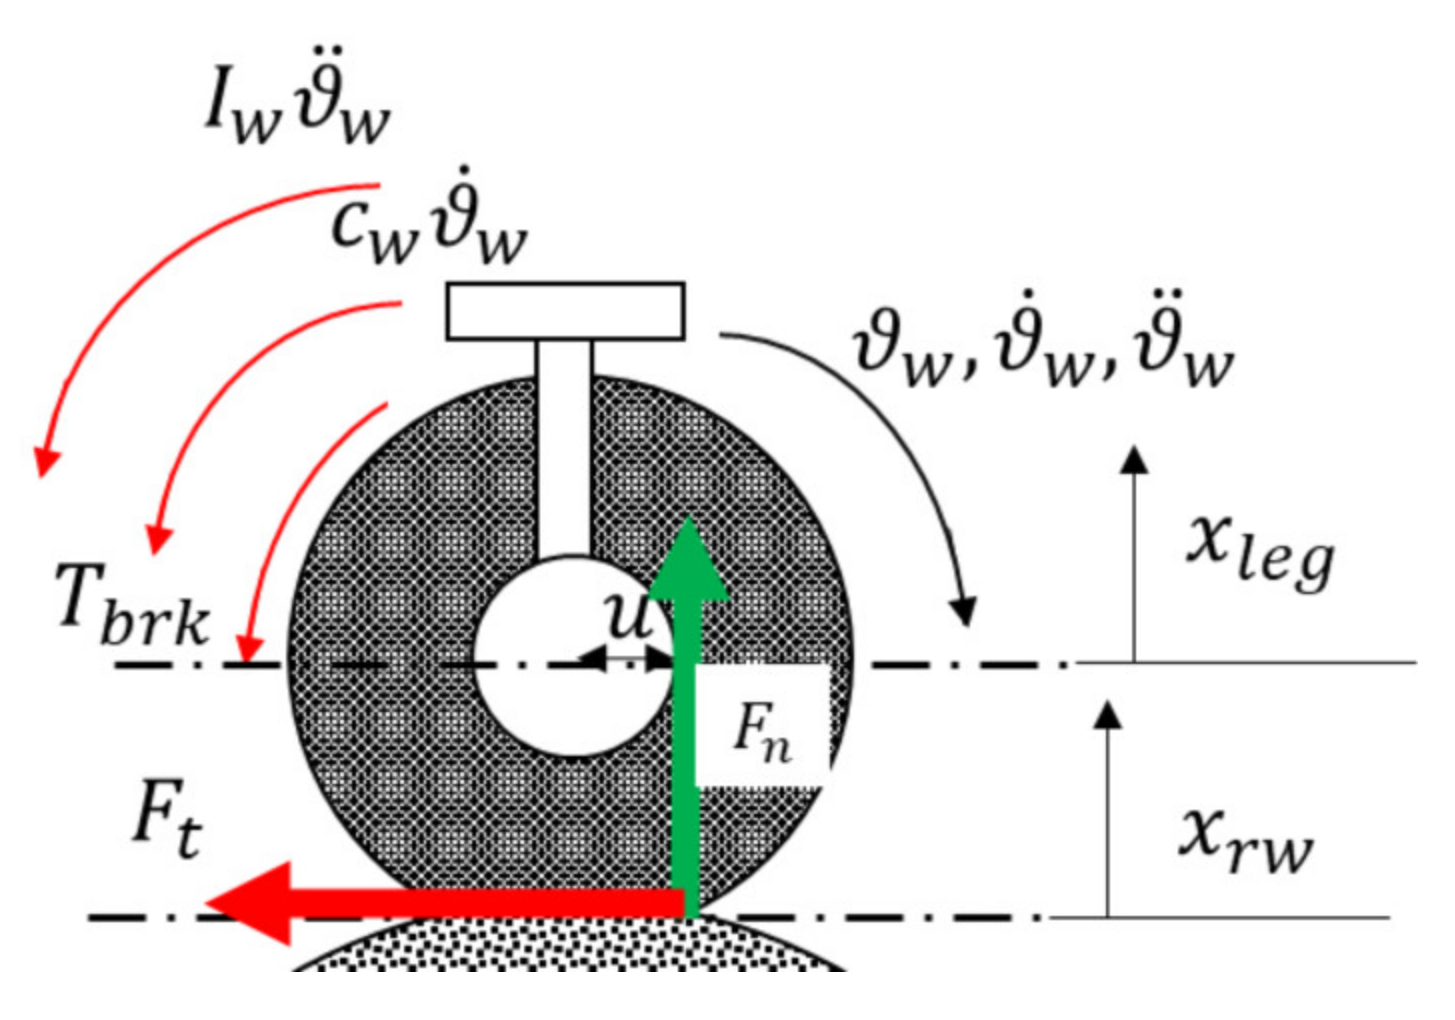
2.4. Test Rig Simulation Model

To simulate the test bench behavior under a variety of operating conditions, a non-linear mathematical model representative of the test-bench dynamics was prepared.
The test bench was first divided into a selected number of functional subsystems. The test bench software comprised the real-time model used to simulate the aircraft landing, which was responsible for the definition of the command issued to the test bench and for the control of the moving platform, and the control system, which implemented the position and force control law. On the hardware side, it is possible to identify the electro-hydraulic servo actuator, the moving platform and test article assembly, the runway simulator, and the braking system of the landing gear. The model of both the command generator and the control system followed the equations and block schemes provided in Section 2.2. A simple transport delay model was added to represent the effects of the computational time over the test bench dynamics. The model of the electro-hydraulic actuator was prepared in accordance with the high-fidelity representation provided in [15], where the dynamics of the servovalve, the cylinder, and the supports are represented without resorting to black box modeling. The internal parameters of the servovalve model were tuned to mimic the expected characteristics of the considered model as provided by the manufacturer’s catalogue. The displacement of the rod x a was obtained as a function of the pressure drop across the chambers p 1 p 2 , itself dependent on the balance between the flowrates Q 1 and Q 2 exchanged between the actuator and the servovalve.
Q 1 A c x ˙ a Q l , i Q b p = β V 0 + A c , 1 x a d p 1 d t   Q 2 + A c x ˙ + Q l , i + Q b p = β V 0 A c , 2 x a d p 2 d t p 1 A c , 1 p 2 A c , 2 F f r γ x a ˙ k m p x a z c m p x ˙ a z ˙ m a g = m a x ¨ a Q b p = s i g n p 1 p 2 C d R e A b p 2 p 1 p 2 ρ
where Q l , i is the flow rate lost due to internal leakage. Q b p is instead the flow through the by-pass orifice, computed as a function of the pressure drop across the actuator chambers, the area of metering section A b p and the discharge coefficient, dependent on the local Reynolds number, C d . The trust areas of the two chambers are assumed equal to A c , 1 and A c , 2 , respectively, while the bulk modulus and the chamber volume at mid stroke are addressed by β and V 0 . The bulk modulus is computed as a function of the fluid temperature and air fraction, assumed to be respectively equal to 40 °C and 0.5% in the preliminary analysis. Friction forces due to contact between the sealing elements and the cylinder F f r can be computed according to [4], while γ is the viscous friction coefficient. Finally, we address with z the vertical displacement of the moving platform and with k m p , c m p the stiffness and the damping coefficient of the attachments, respectively. Considering the two attachments equal, the dynamic equilibrium of the cylinder can be obtained as
p 2 A c , 2 p 1 A c , 1 F f r γ x ˙ c k m p x c c m p x ˙ c m c g = m x ¨ c
where x c is the cylinder movement. The attachments on both sides of the actuator were modeled as viscoelastic components to account for their deformation. The vertical dynamics of the assembly including the moving platform and the test article were modeled according to the scheme provided in Figure 7. In the absence of a detailed mass breakdown, the moving platform is connected to the mass m, representative of the single landing gear (LG) leg, by a non-linear spring-damper element representative of the shock-absorber. On the other side, the eventual viscoelastic contact between the LG tires and the runway simulator is represented. The dynamic equilibrium of the moving platform can then be represented considering the following equation, where y l e g is the vertical displacement of the leg, while k l e g and c l e g are the shock absorber stiffness and damping. F l e g * is the preload of the shock absorber.
k m p x a z + c m p x ˙ a z ˙ + k m p y l e g z + c m p y ˙ l e g z ˙ m m p g = m m p z ¨
The shock absorber characteristics are known and provided by the landing gear supplier. Similarly, the vertical dynamics of the leg can be represented as follows:
k l e g x l e g y l e g + c t x ˙ l e g y ˙ l e g k m p   y l e g z + F l e g * + c m p   y ˙ l e g z ˙   = m l e g y ¨ l e g k t x l e g x r w + c t x ˙ l e g x ˙ r w k l e g x l e g z F l e g * c x ˙ l e g z ˙ = m w x ¨ l e g
where k t and c t are the stiffness and damping coefficient representative of the tire-runway simulator contact, respectively, while x l e g and x r w are respectively the vertical displacement of the wheel and that of the runway simulator, by default equal to zero. The wheel mass is m w . Please note that the force exerted by the contact between the tire and the rotating cylinder can only apply a compressive load on the leg. The characteristics of the tire are derived from data provided by the industrial partners. The rotational dynamics of the wheel can be described according to the free-body diagram of Figure 8. With F n = k t x l e g x r w + c t x ˙ l e g x ˙ r w , the vertical force exchanged between the wheel and the runway simulator, with F t = F n μ the friction force and with u r w the rolling friction parameter, function of the wheel angular frequency, and of the tire pressure [16], we can obtain:
F n μ D w 2 x l e g x r w sign λ F n u tanh ϑ ˙ w c w ϑ ˙ w T b r k = I w ϑ ¨ w
where ϑ w is the wheel rotation in [rad]; I w is the moment of inertia of the wheel assembly; D w its diameter; and c w is the viscous friction coefficient roughly representative of the dissipation in the wheel supports. The friction coefficient μ is evaluated according to the Burckhardt model [17] as a function of the slip factor between the wheel and runway simulator.
The runway simulator is modeled as a cylinder, where the moment of inertia I r w is representative of the mass of the decelerating aircraft. Although the chosen configuration is different, the effects of the adoption of a geared solution over the system behavior are negligible since they only interest the acceleration phase of the cylinder and the eventual activation of the emergency brake. Both the process of accelerating the cylinder up to the required speed and that of decelerating the runway simulator down until a complete stop due to the activation of the emergency brake are expected to be fairly long processes and thus not suitable for simulation through a complex model of the test bench. As such, by defining the diameter of the runway simulator with D r w , it is possible to express its rotational dynamics as follows:
F n μ D r w 2 sign λ F n u tanh ϑ ˙ r w c r w ϑ ˙ r w = I r w ϑ ¨ r w
Within the simulation model, the runway simulator is brought to the required speed by means of a simplified speed control loop, which is then disconnected as a non-zero position command is issued to the moving platform.

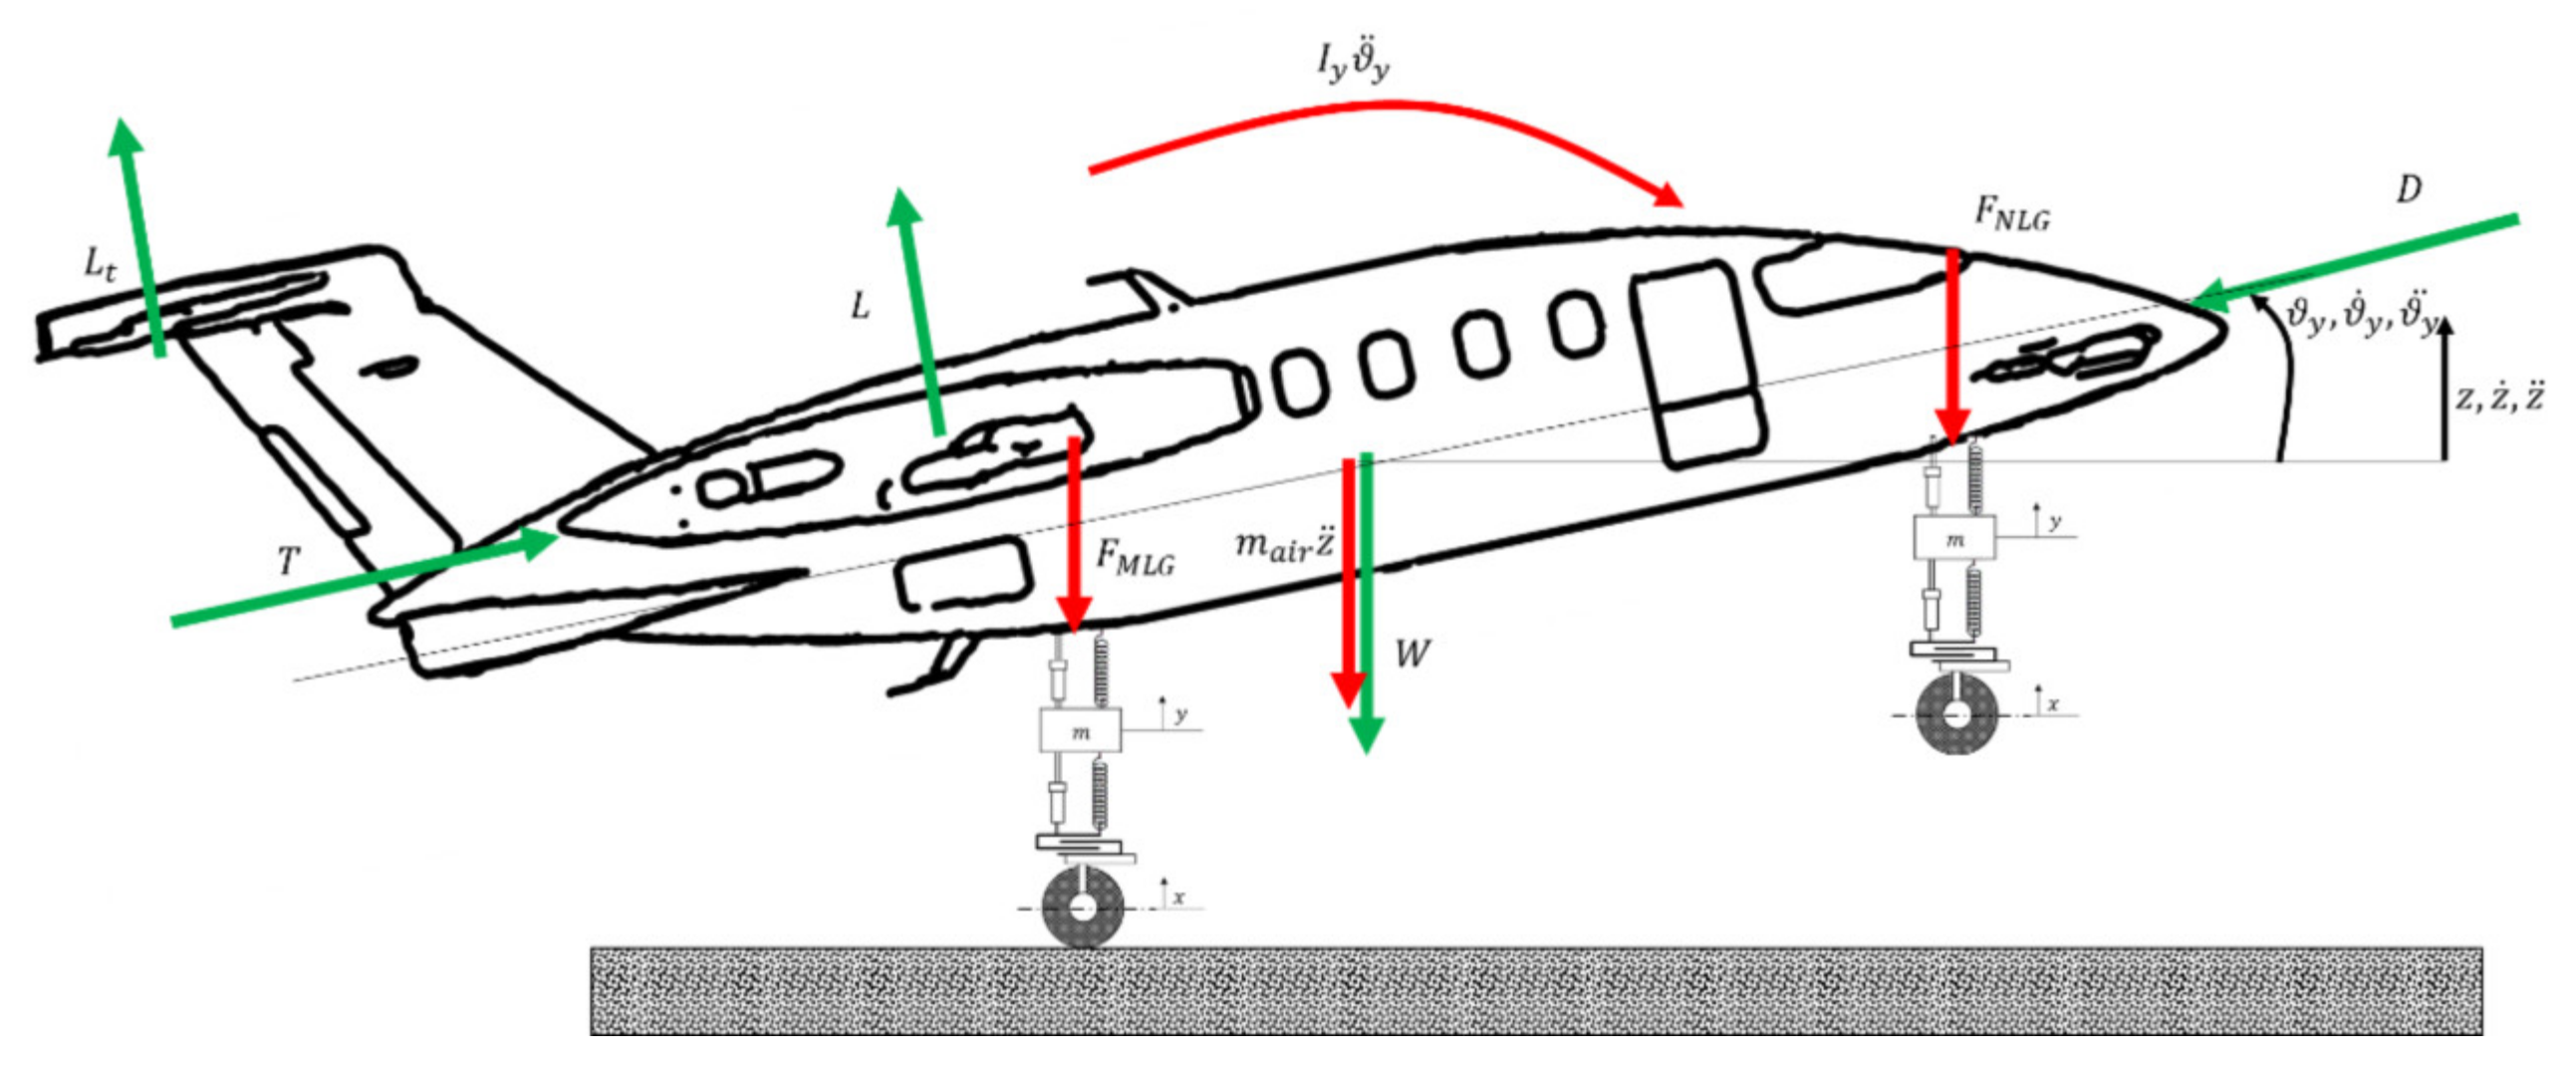
2.5. Test-Article Simulation Model

The E-Brake system is made of four electro-mechanical actuators (EMAs) controlled in force and acting in parallel on a disk brake. The functional scheme of the system is reported in Figure 9. Each actuator is driven by a brushless-DC motor connected to the braking pad though a gearbox and a ballscrew each. Each actuator was equipped with a dedicated load cell used to measure the exerted force and close the force control loop. The model of the actuators control system was similar to that of the testbench, where a sequence of proportional-integrative controllers operated on the force control loop and the current control loop of each brushless motor. The sensor suit was modeled through second order transfer functions replicating the expected dynamics of the load cell and of the Hall-effect sensors employed to monitor the angular position of the brushless-DC rotor. The simulation of the measure chain is completed with the model of the employed A/D converters. The dynamic model of each EMA is derived from the simulation models previously employed for prognostic activities on flight control systems [18]. The electronic power converter was modeled as a three-phase inverter with pulse width modulation (PWM) following the functional modeling provided in [19]. An initial value of 10 kHz was chosen for the carrier frequency of the PWM modulator. The electrical dynamics of the motor can be described according to a streamlined three-phase model of the system.
V a , b , c = R a , b , c T w i a , b , c + L T w d d t i a , b , c + d d t ϕ a , b , c ϑ e l
where R a , b , c is the electric resistance matrix, the elements of which depend on the windings’ temperature T w . L is the inductance matrix, accounting for self-induction and mutual induction phenomena, along with the effect of magnetic flux dispersion. Finally, ϕ a , b , c is the concatenated magnetic flux provided by the permanent magnets, function of the electrical angle ϑ e l . The torque at the motor shaft, and thus the dynamic equilibrium of the rotor, can be computed as:
a , b , c d ϕ d t i a , b , c c ϑ ˙ m k m ϑ m ϑ g b c m ϑ ˙ m ϑ ˙ g b = I m ϑ ¨ m
where ϑ m is the motor rotation, while ϑ g b is the angular position of the gear shaft and I m is the moment of inertia of the rotor. The parameters k m and c m represent the torsional stiffness of the motor shaft and its associated damping. The gear pair is described within the test bench model as a rotational mass–spring–damper system, thus leading to the following equation
k m ϑ m ϑ g b + c m ϑ ˙ m ϑ ˙ g b 1 τ k g b ϑ g b ϑ r s + c g b ϑ ˙ g b ϑ ˙ r s T f r , g b = I g b ϑ ¨ g b
where τ is the transmission ratio; T f r , g b is the friction torque, while ϑ r s is the angular position of the rotating part of the screw. The friction torque is computed as the sum of three components: one dependent on the acting load, one related to the viscous friction, and a drag torque component. The power-screw is modeled as two-degrees of freedom elements, where the rotating part is connected to the translating element through a viscoelastic element. Defining the position of the translating portion of the screw pertaining to the i-th actuator with x r s , i , it becomes possible to describe the brake dynamics. The force provided by each actuator F n , i to the brake disks is modeled as a viscoelastic backlash, where no force is exerted until contact is made. Addressing the stiffness and the preload of the return spring with k e b and F * , respectively, it is possible to evaluate the braking torque acting on the landing gear wheel as a function of the translating mass of the brake disks m e b , its translation x e b , and the angular speed of the wheel ϑ ˙   w as:
T b r k = f e b F n ϑ ˙ w 0   T b r k = min f e b * F n , F n μ D w 2 x l e g x r w sign λ F n u tanh ϑ ˙ w  
where f e b and f e b * are the friction coefficients under sliding and adhering conditions. λ is the slip parameter, computed as the ratio between the horizontal speed of the aircraft along the runway (the linear speed of the runway simulator in the test rig) and linear velocity of the landing gear tires. The brake system features an anti-skid logic that modulates the braking force command depending on the required slip factor, chosen as a function of the runway conditions.

3. Results

The non-linear model of the test rig was implemented in MATLAB/Simulink and used to evaluate the performances of the control system and to study its capability to replicate the effects of the presence of different kinds of runway irregularities under different operating conditions.

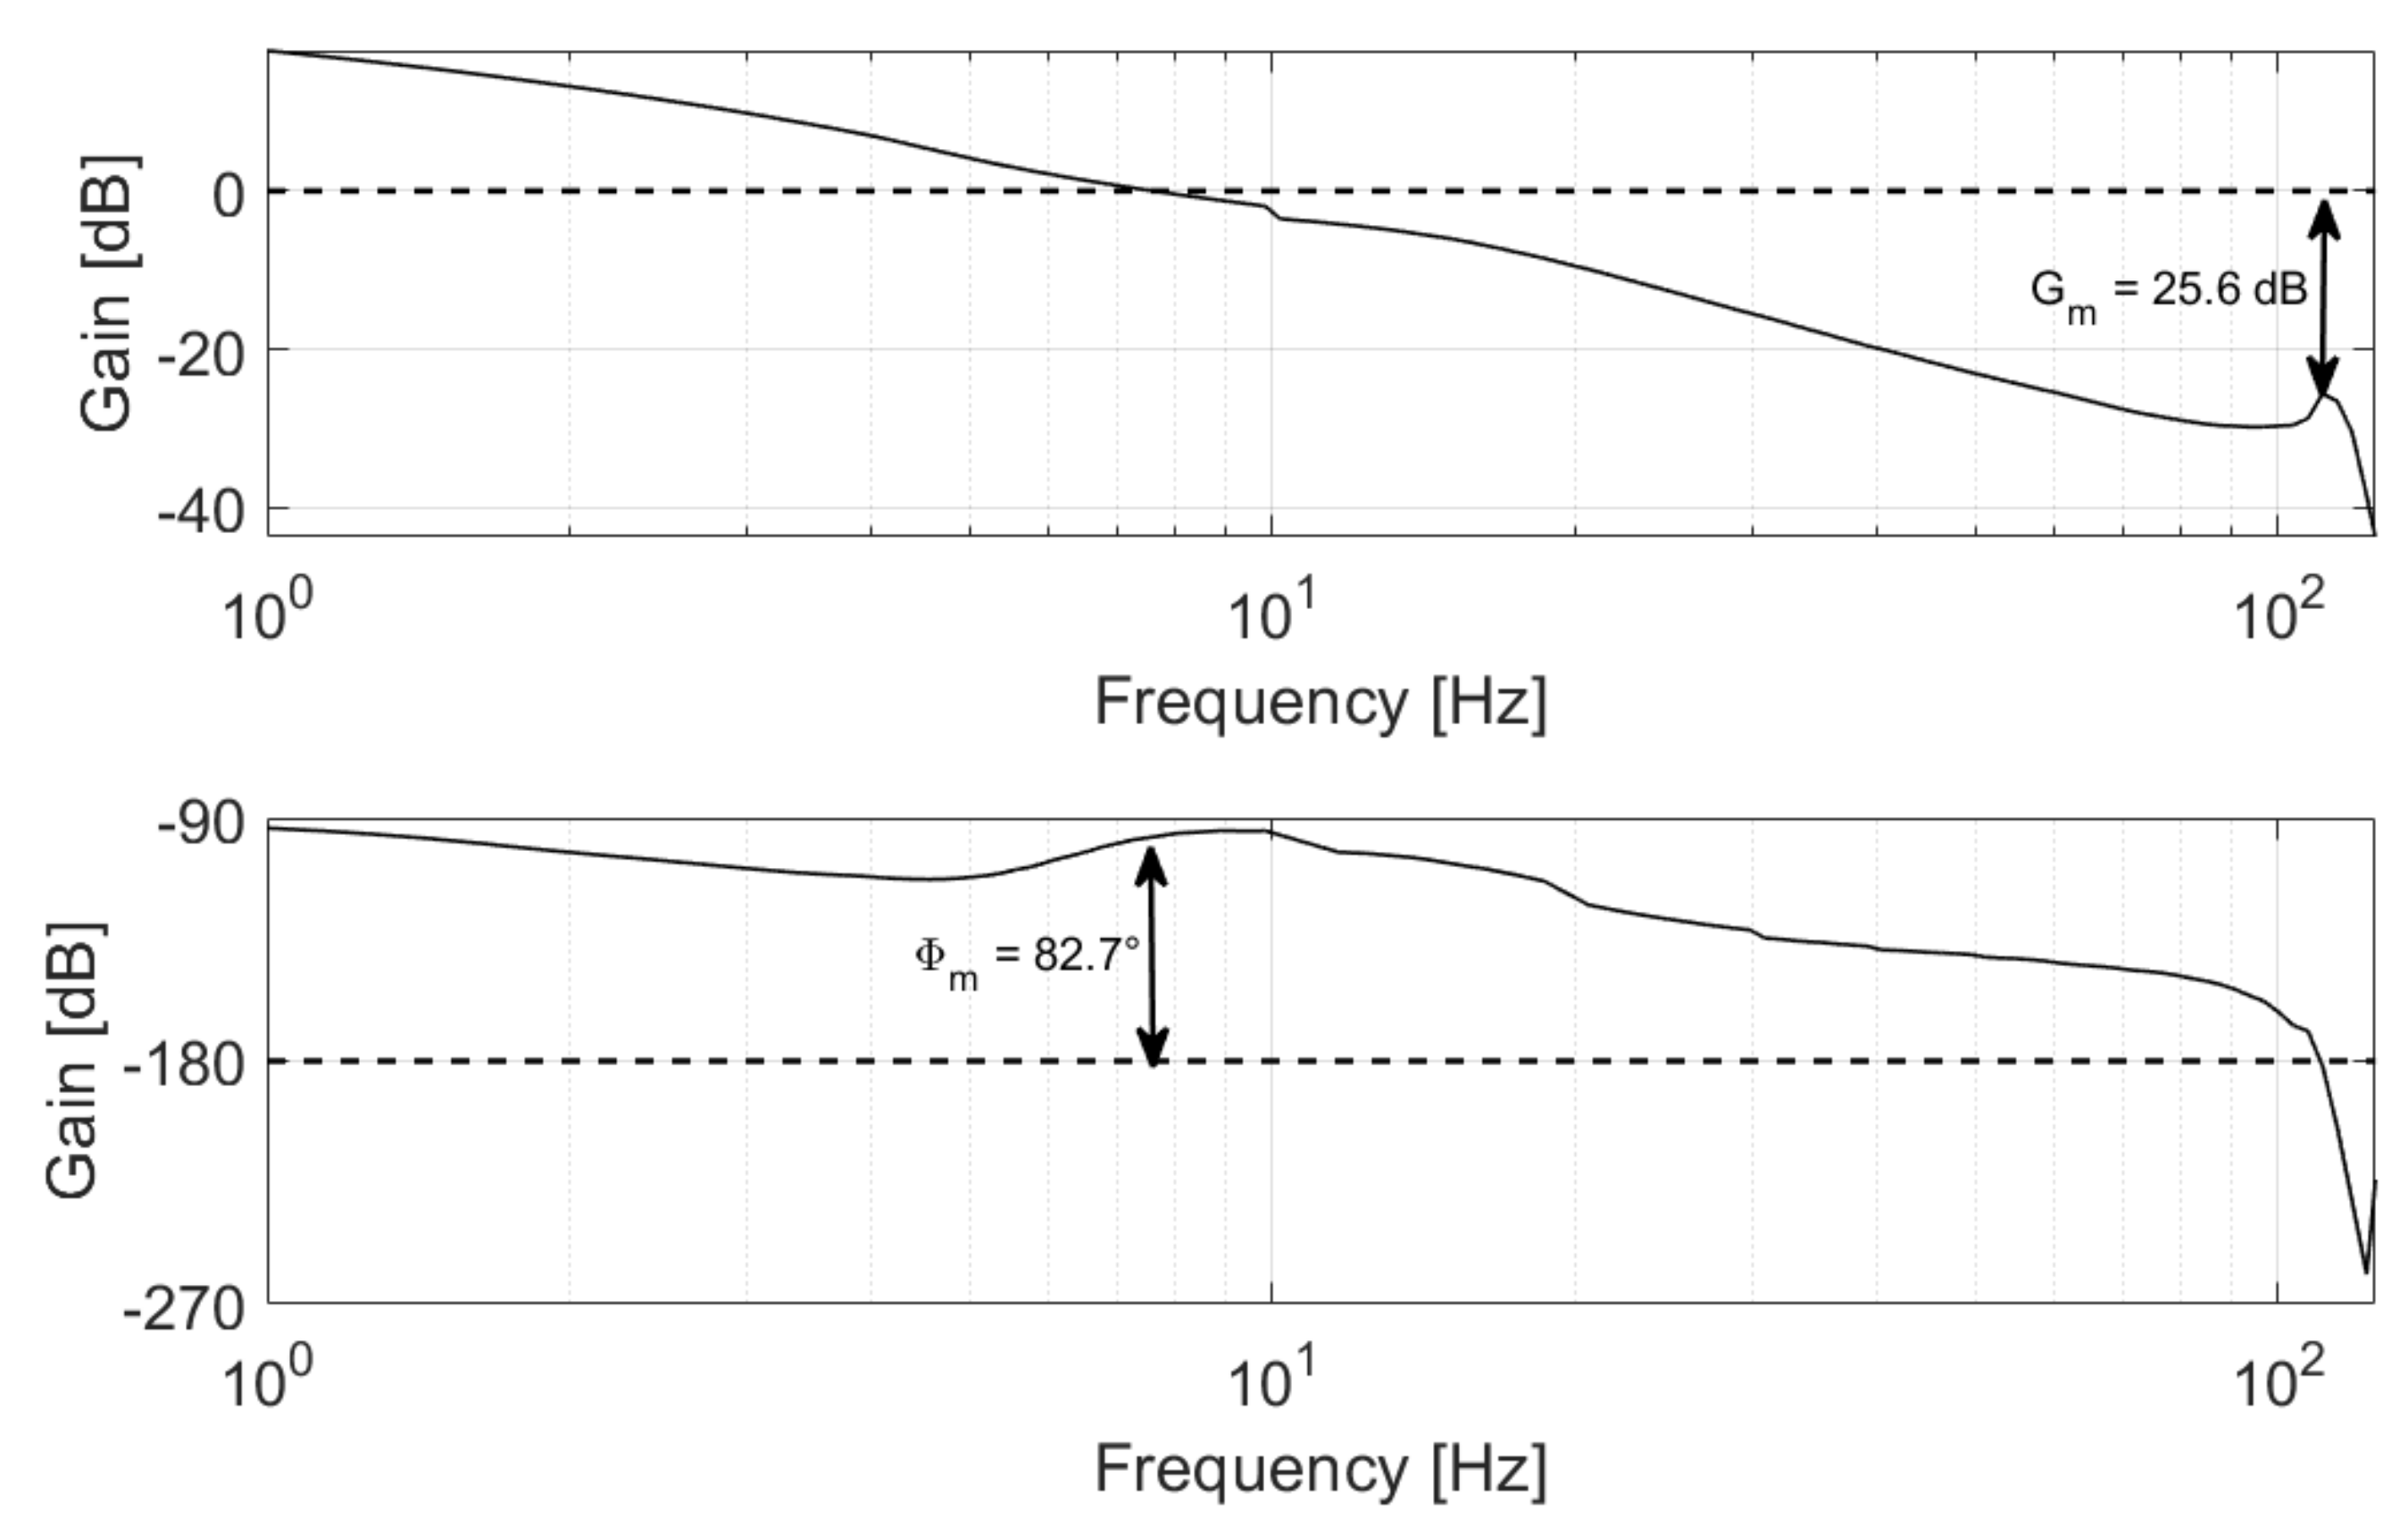
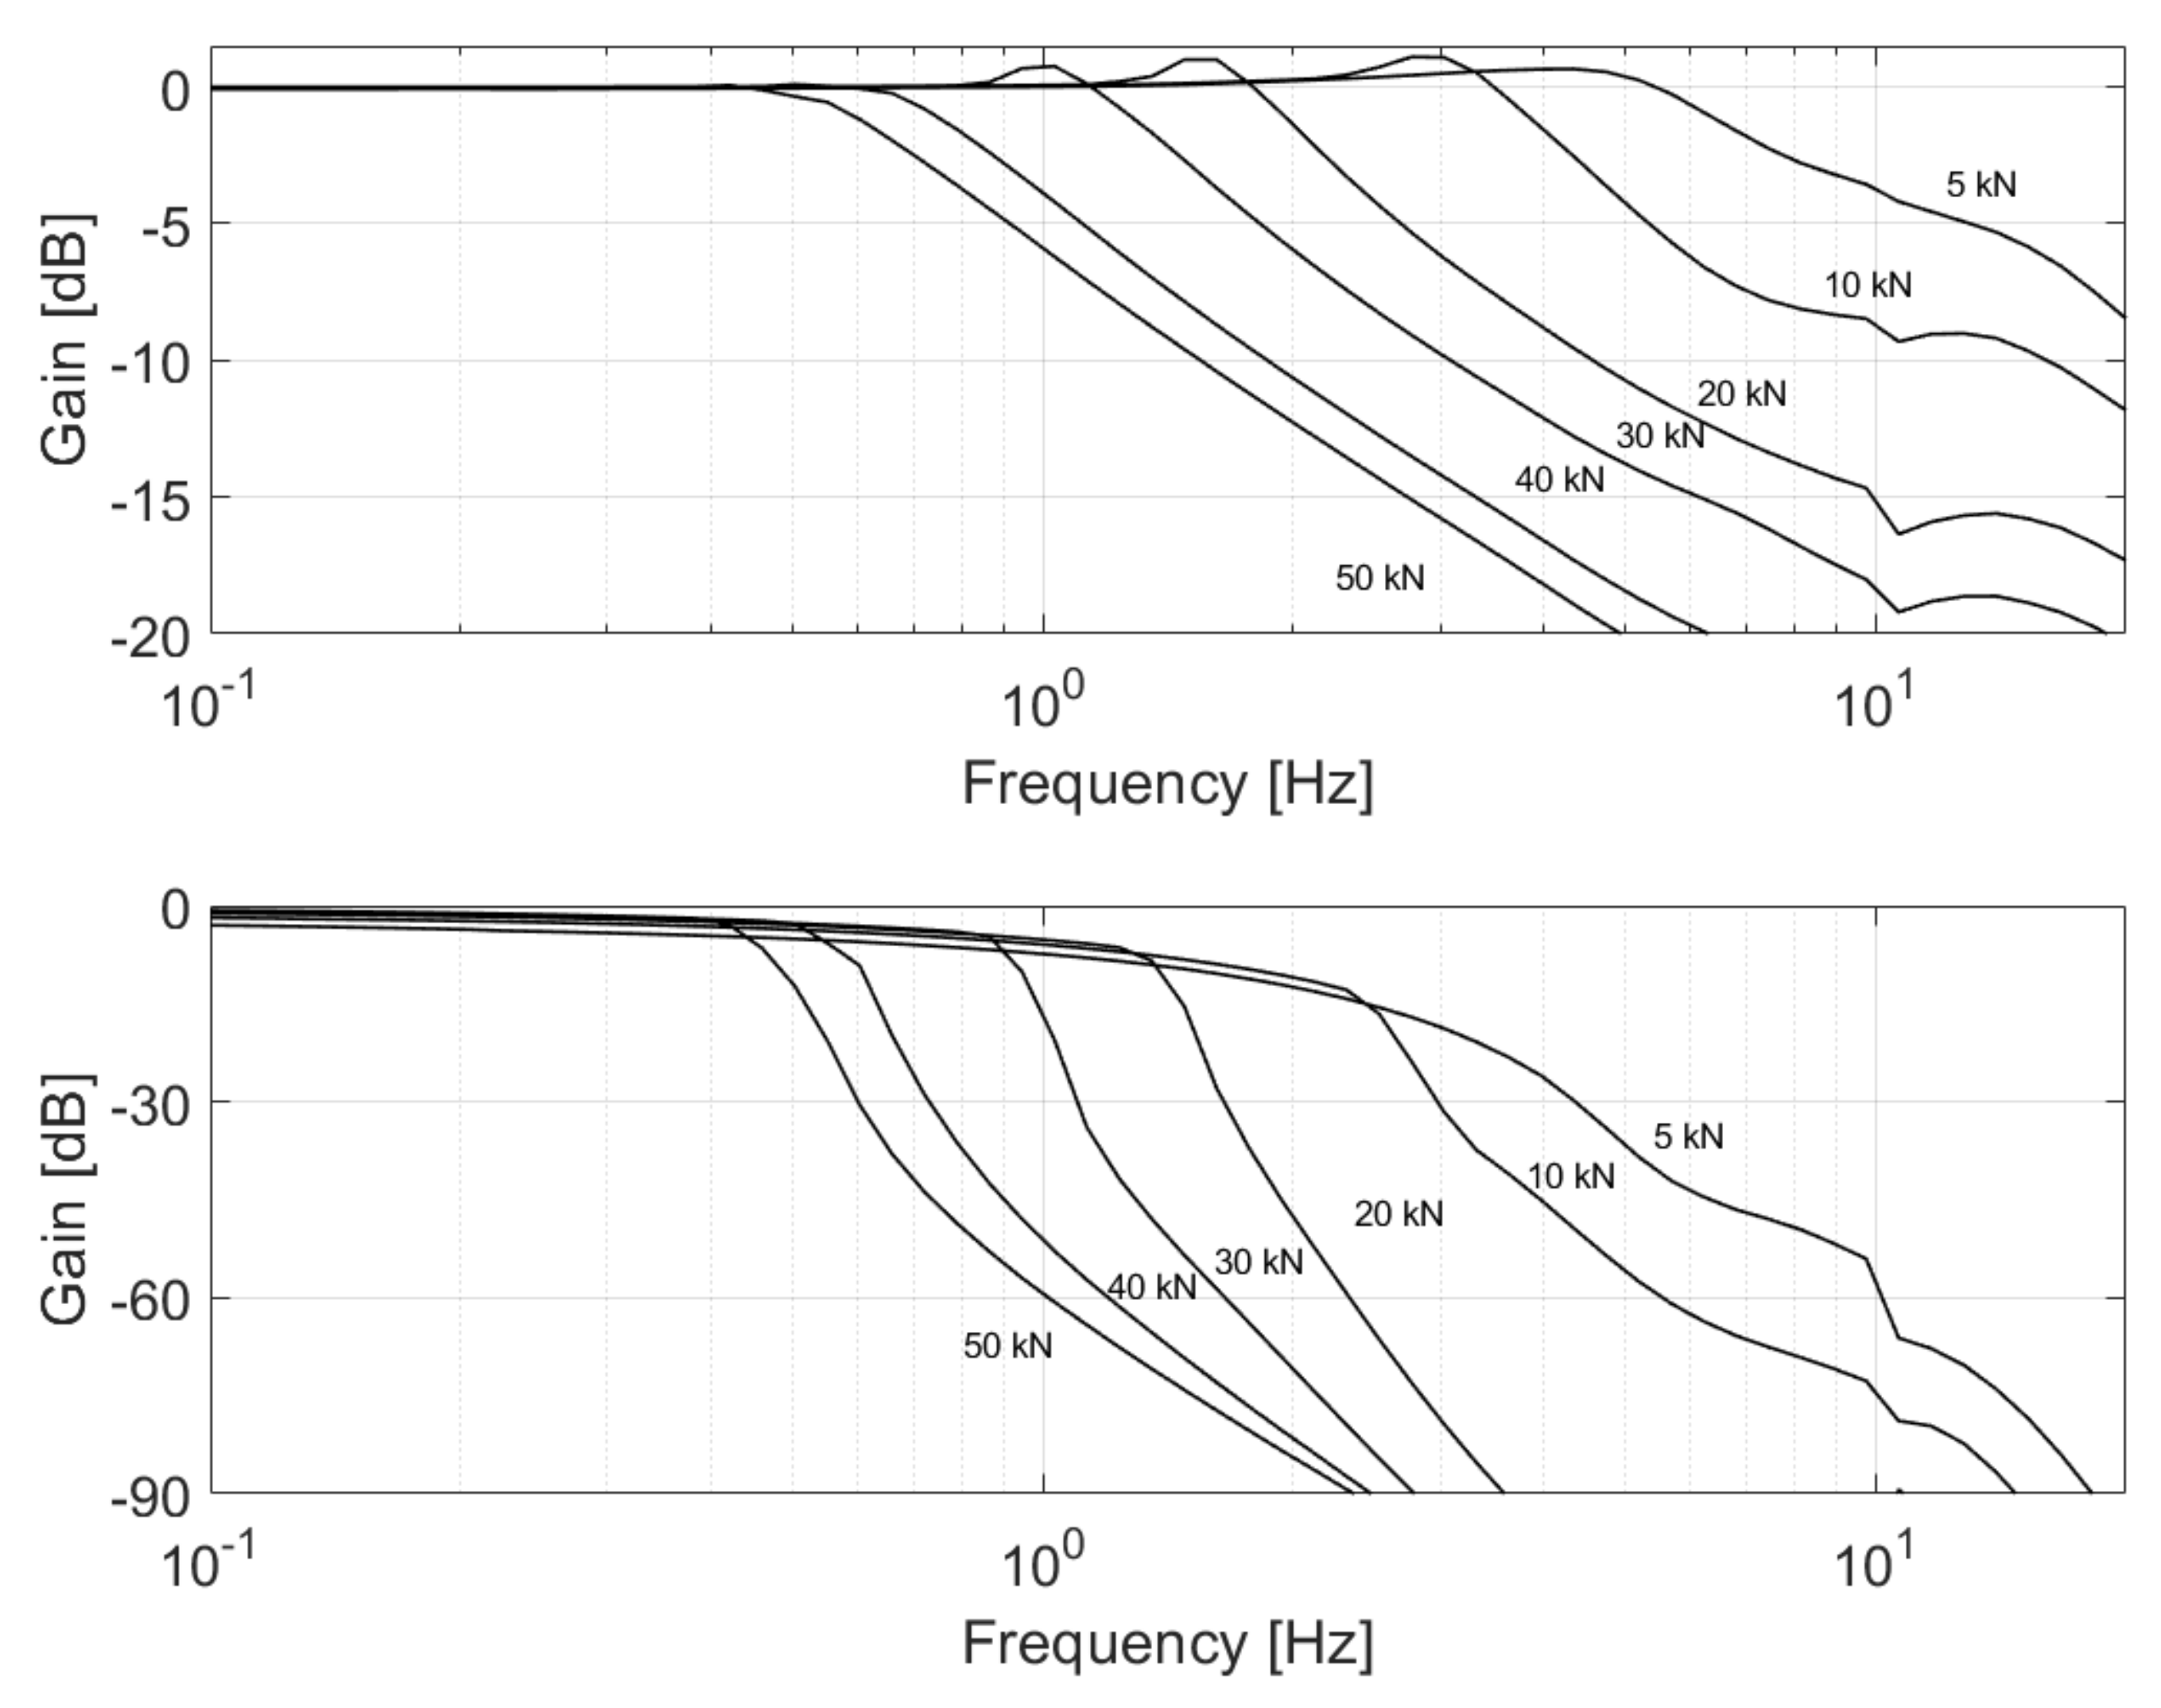
3.1. Control Stability and Performances

The only purpose of the position control loop is to manage the moving platform at the start and at the end of each test, conceding priority to the force control loop during the landing test procedure. During these phases, the system is commanded through slow position ramps, with the sole purpose of limiting the descent speed of the moving platform, thus removing the need for strict requirements over its dynamic performance. The force control loop is critical to the system behavior and is thus studied in detail. The selected gains of the force control loop provide sufficient stability margins. As depicted in Figure 10, the gain margin G m can be estimated as 25.6 dB, while the phase margin Φ m is equal to 82.7°, which are well above the usual requirements of 6 dB and 60°, respectively.
The closed loop response of the force control system is depicted in Figure 11 as a function of the command amplitude. The bandwidth, defined as the frequency associated with a closed loop gain equal to −3 dB, is heavily dependent on the amplitude of the force command imposed on the system, reaching 8.9 Hz for a ±5 kN sinusoidal set while falling below 1 Hz for command amplitudes higher than 40 kN. The system exhibits the tendency to slightly overshoot within frequency ranges dependent on the command itself. However, these peaks are deemed acceptable since they are modest in value, lower than 1 dB, and mostly affect the low-amplitude commands, tending to disappear as the command amplitude rises.
To better highlight the test bench capabilities, the maximum amplitude of the force exerted by the hydraulic actuator was compared with the amplitude of the sinusoidal load acting on the landing gear leg due to runway irregularities with varying frequency of occurrence and different amplitudes X0 in Figure 12. Since the frequency of the dynamic load due to the sinusoidal runway irregularities depends on the aircraft speed along the runway, the test bench must be able to provide a force at least equal to the required one for the entire frequency range representative of the aircraft operating conditions. For example, to reproduce the landing of an aircraft approaching the runway with an expected horizontal speed of 60 m/s in the presence of periodical irregularities with 10 m pitch and given amplitude, the test rig must be able to generate, on the landing gear, a sinusoidal force at least equal to the required one for the whole frequency range up to 6 Hz. The most critical conditions occur in correspondence of the first resonant frequency of the landing gear leg, which occurs in the proximity of 2.25 Hz. As depicted in Figure 12, the test bench is expected to reproduce a maximum amplitude of periodical runway irregularities equal or lower than 6 mm. Higher amplitude irregularities can still be reproduced, provided that the ratio between the aircraft speed and the waving pitch causes force oscillations at lower frequencies. For example, irregularities with 20 mm amplitudes can be successfully replicated if their frequency drops below 1.67 Hz, which corresponds to a waving pitch of 35.9 m for an aircraft approaching the runway with a horizontal speed of 60 m/s. Figure 13 details the operating envelope of the test rig, depicting for several values of runway waving amplitude X 0 and the minimum pitch L that allows its representation on the iron bird.
Such an envelope means that the test bench is capable of describing runways with an International Roughness Index (IRI) higher than 2 mm/m, which is usually considered the threshold value for pavements in good conditions. Moreover, the test bench is also able to reproduce, in most instances, the effects of runways with IRI higher than 3.5 mm/m, which is conventionally assumed as the threshold value for failed pavements [20].

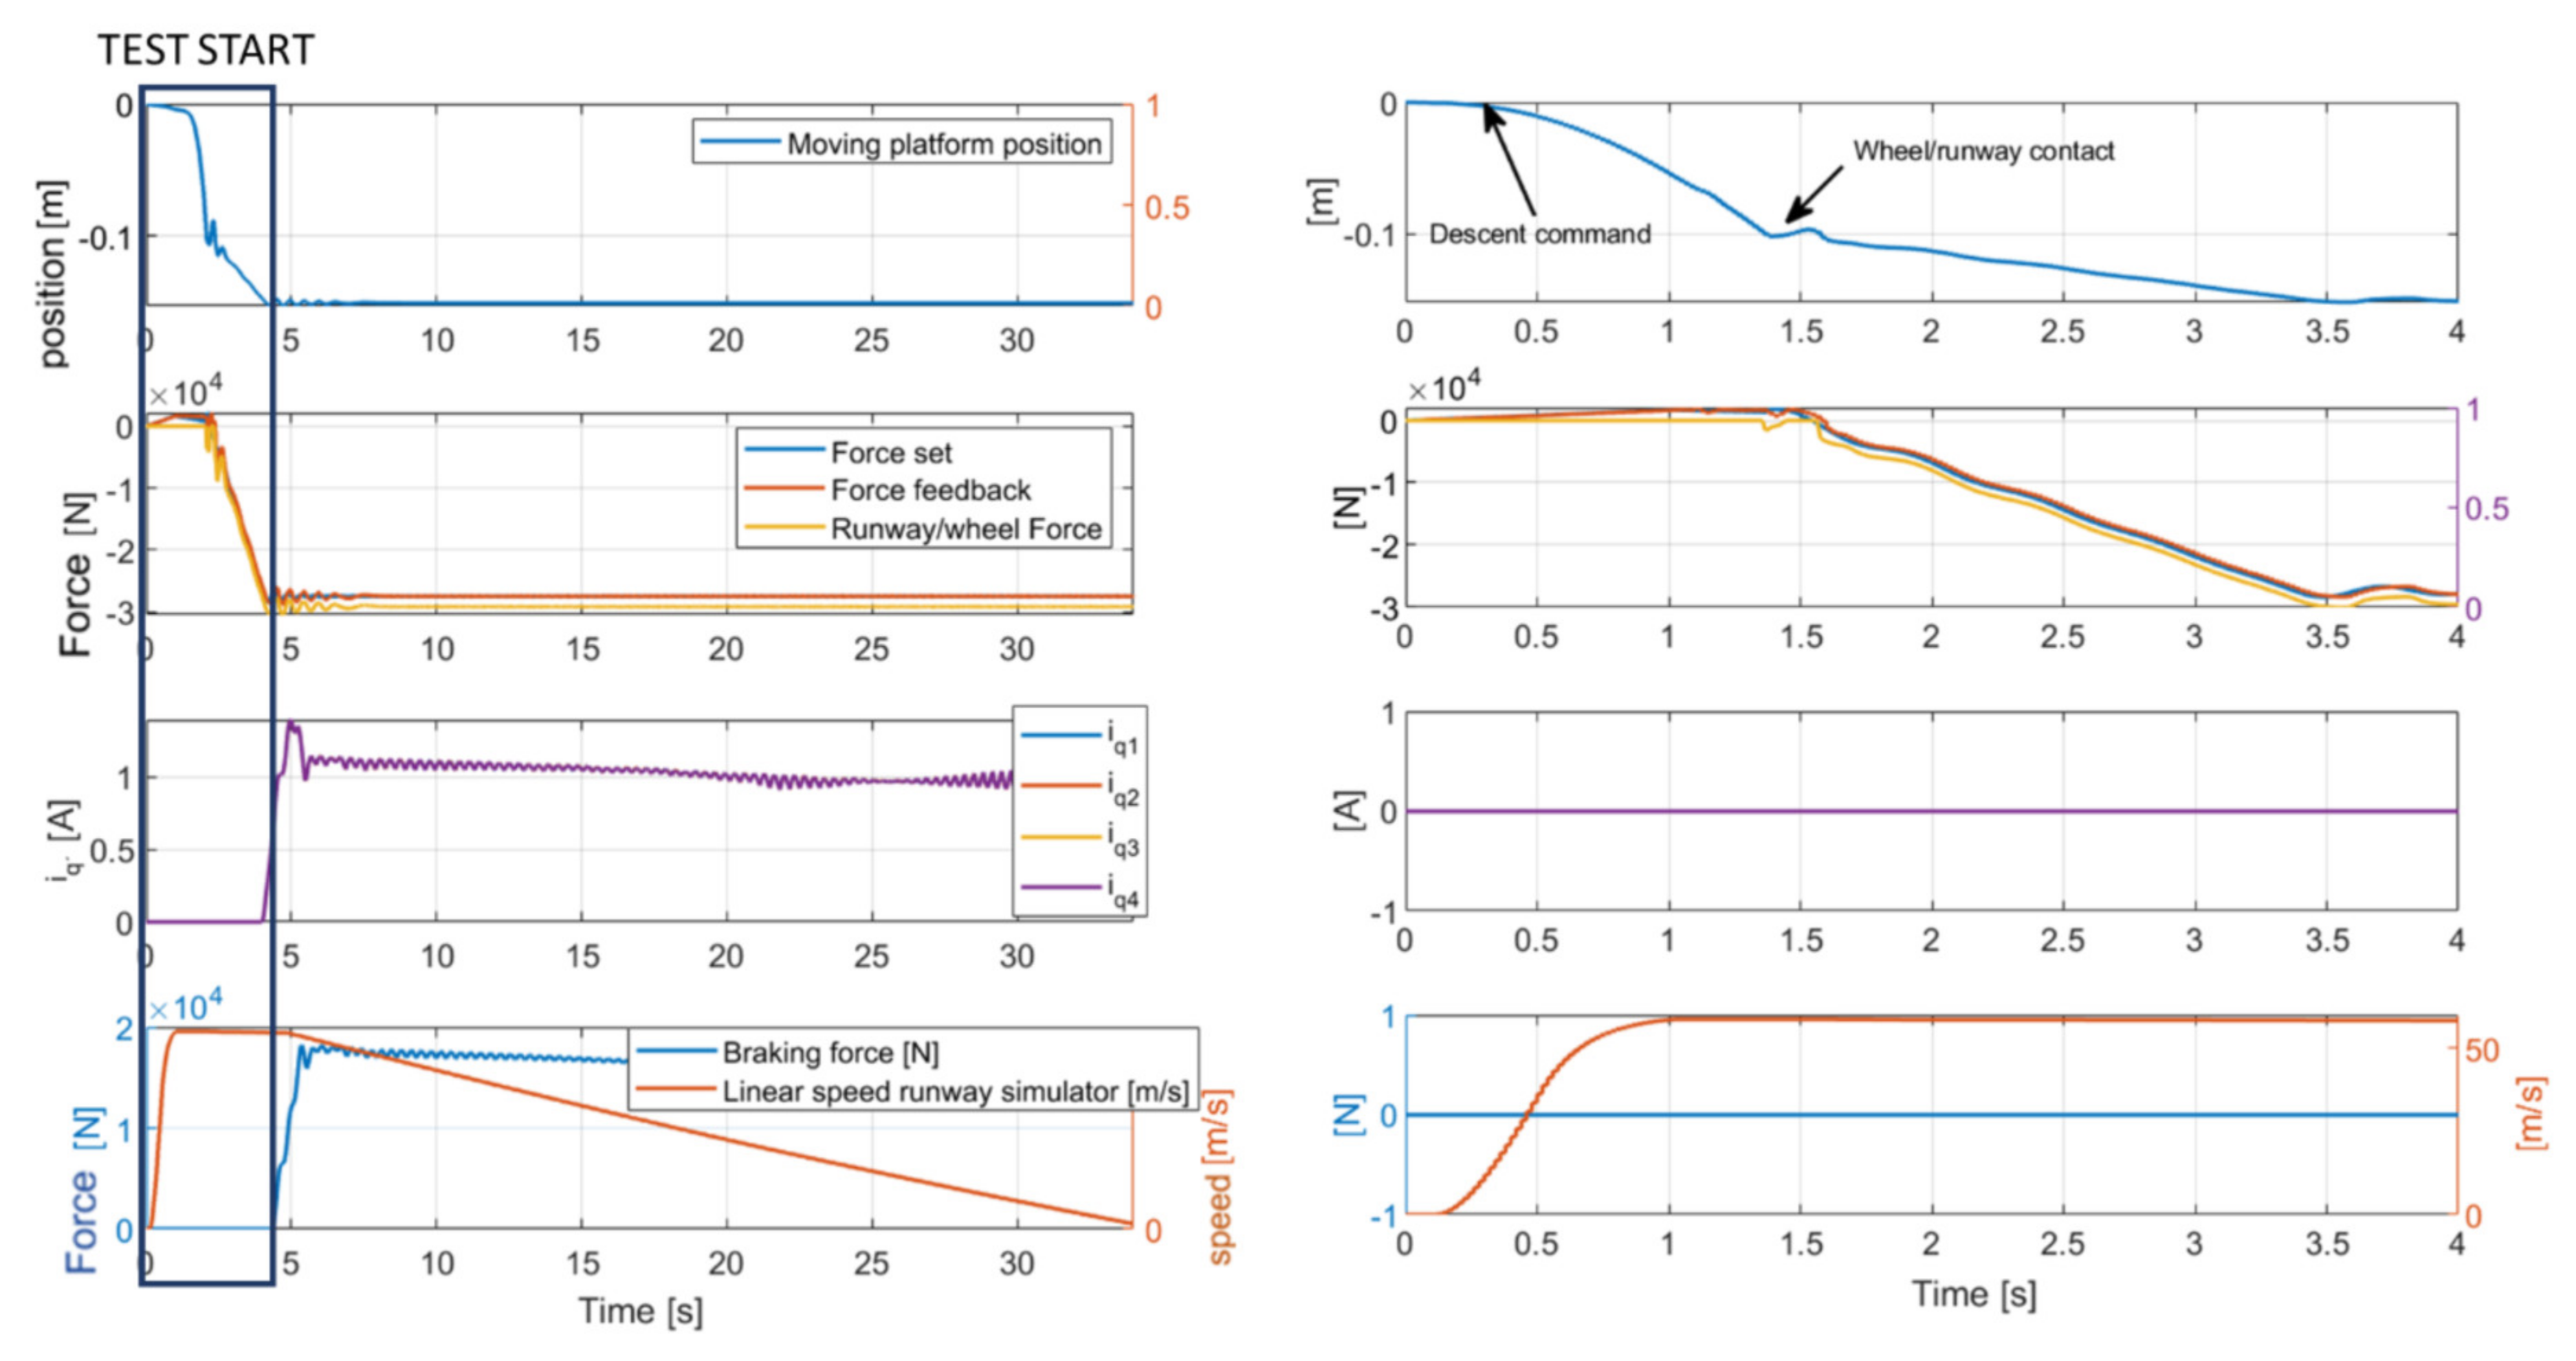
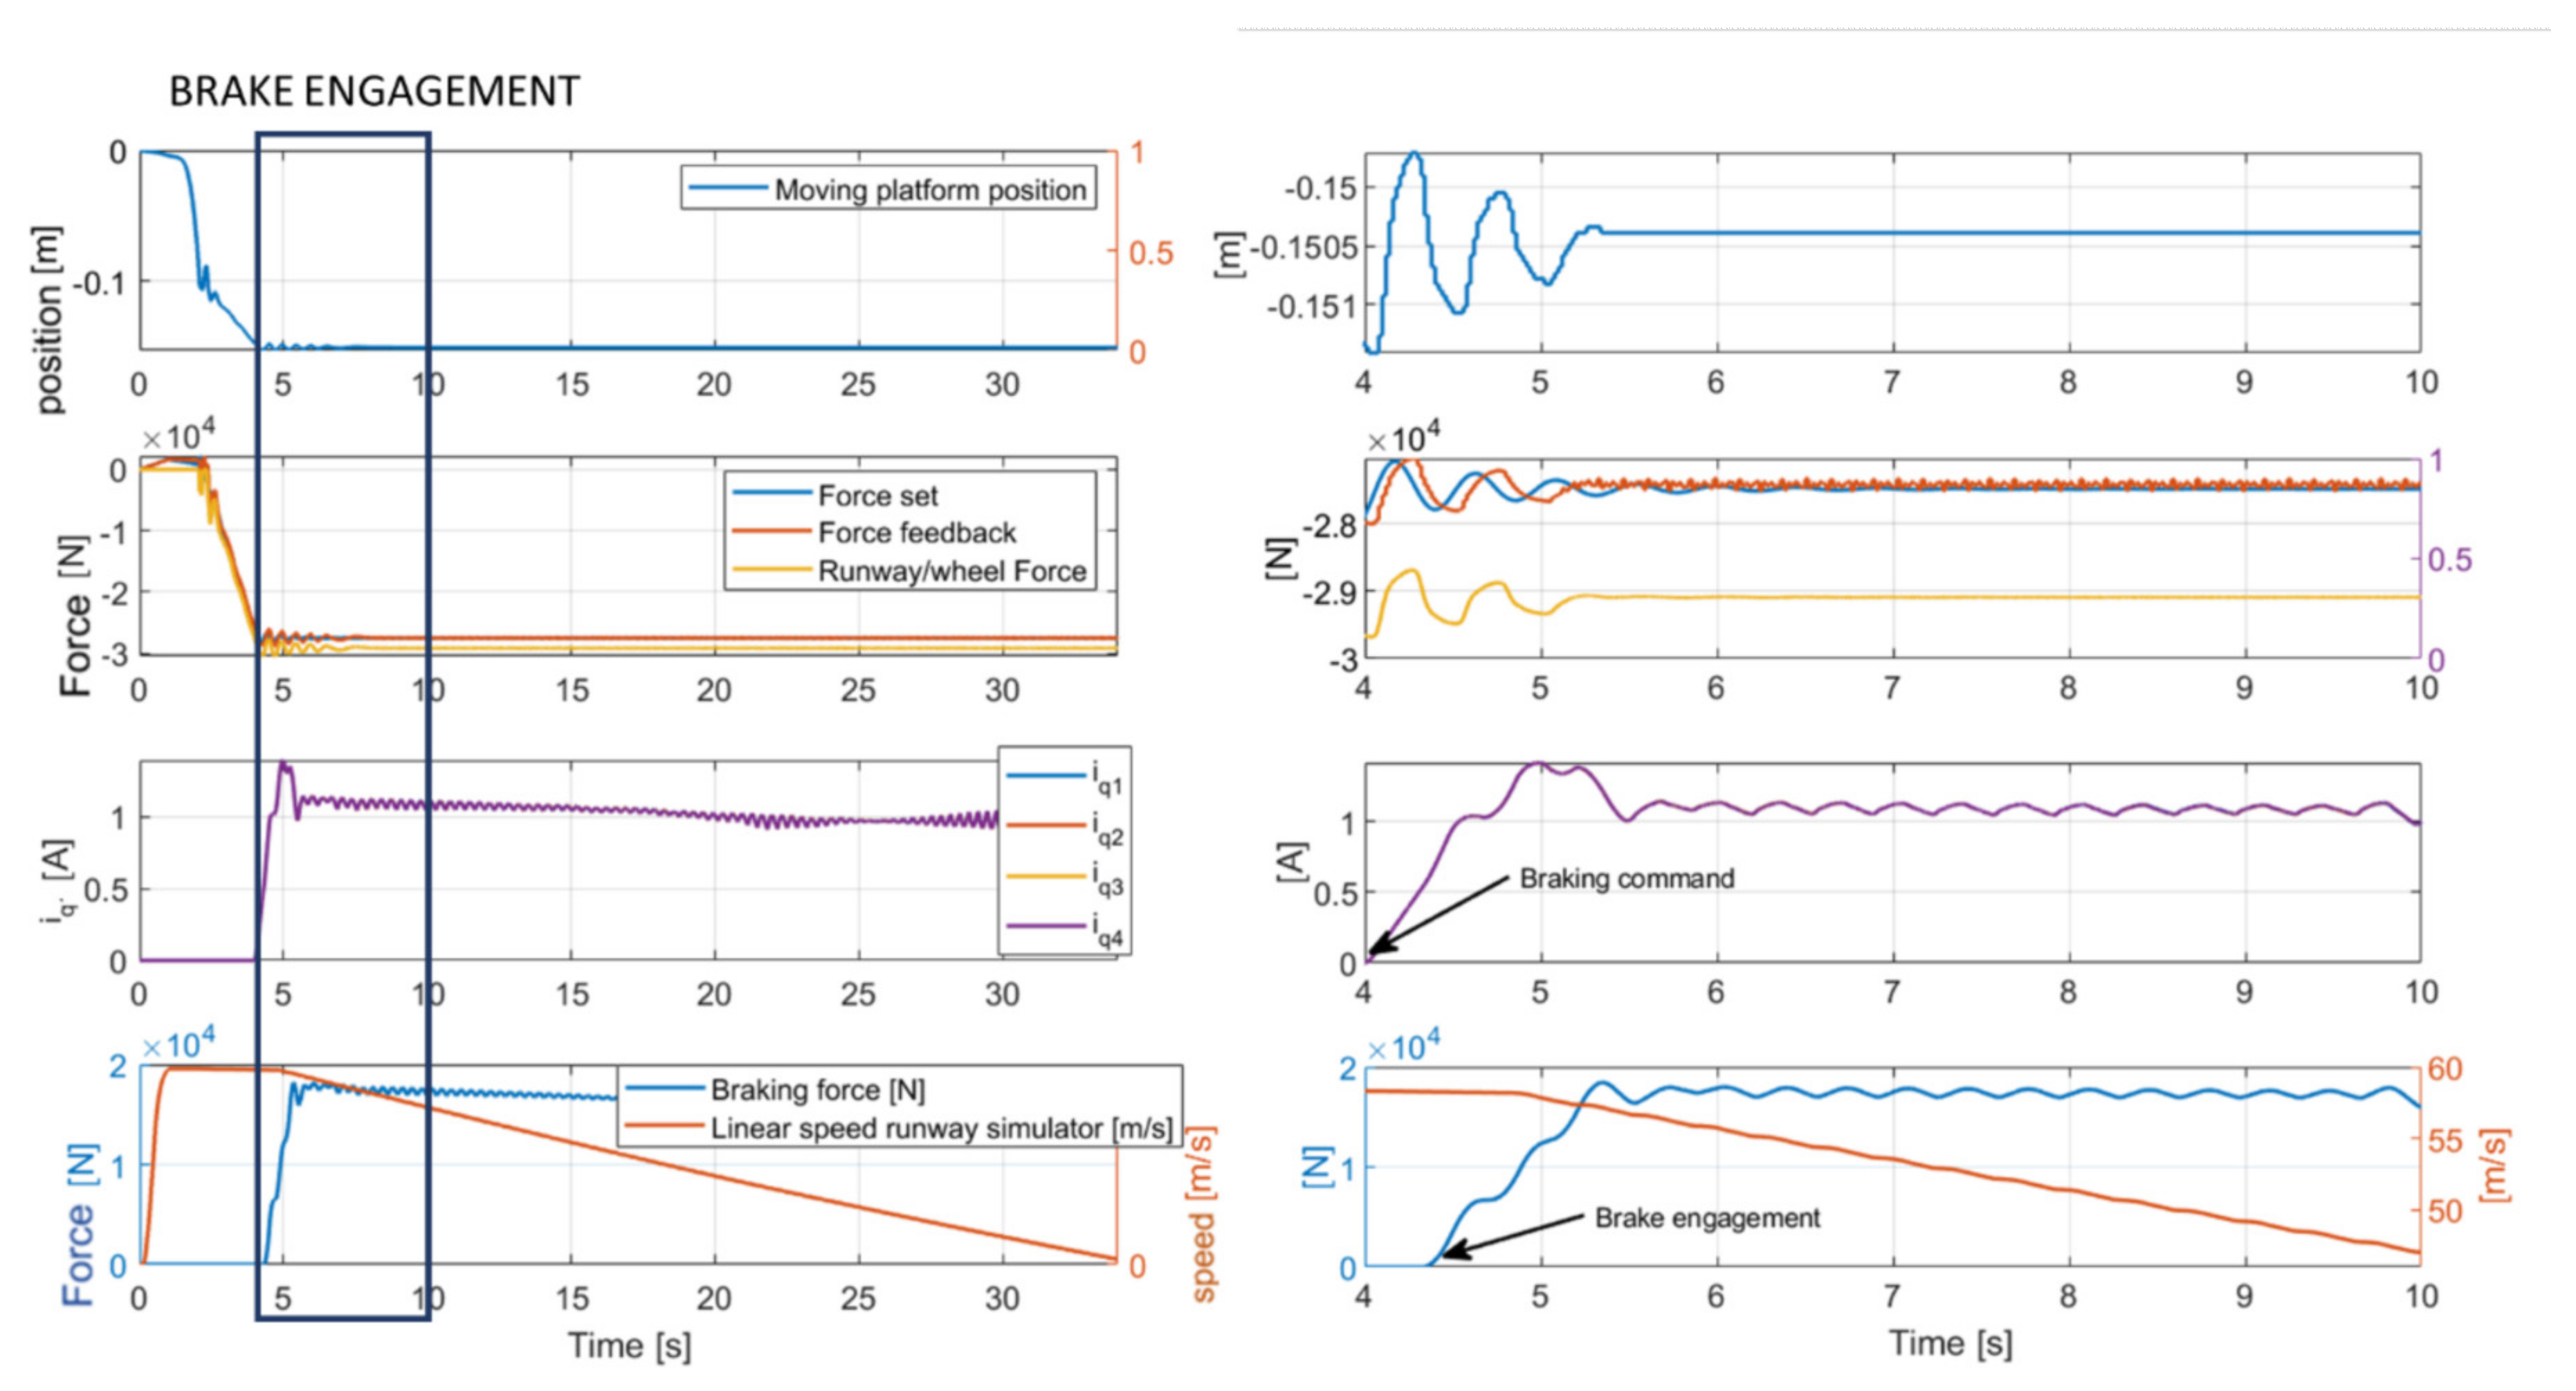
3.2. Landing Test Simulation

To best demonstrate the expected test bench behavior and to study its projected performances in the time domain, several simulations mirroring the test procedures defined for the physical test rig were performed, starting with the representation of landing conditions on a dry and perfectly plane runway. The simulation considered an aircraft of total mass at landing around 6 tons, approaching the runway with a relative horizontal speed of 55 m/s, which are the most probable landing conditions for the considered vehicle.
As depicted in Figure 14, the test begins by supplying a positive force command to the force control loop and a set signal equal to zero to the position control loop, both of which are needed to balance the combined weight of the landing gear leg, the hydraulic actuator rod, and the moving platform itself. At the same time, the runway simulator is accelerated through a dedicated electric motor, until its tip speed reaches the value coherent with the desired horizontal speed at landing. Please be mindful that this particular phase is expected to require a few minutes due to the high resistance opposed by the inertia disks and was artificially accelerated in the simulations. Once the descent command is provided, the real-time aircraft model is activated and begins to provide the force set as defined in Section 2, causing the slow descent of the moving platform. After contact is made between the wheel and the runway simulator, the position set is quickly brought to a value to negate the effects of the position control loop over the force regulation, thus allowing the system test rig to apply the load calculated by the real-time aircraft model. In response to a dedicated command provided by the iron bird control unit, the electromechanical brakes are engaged and start decelerating the runway simulator. The dynamics of this process is depicted in Figure 15, where the behavior of the quadrature currents i q 1 , i q 2 , i q 3 , i q 4 of the four electric motors acting on the E-Brake system can be observed. The delay between the braking command and the effective brake engagement is due to the dynamics of the electro-mechanical actuators and the need to cover the initial gap separating the brake’s pads from the brake’s disks. The resultant braking force is then modulated by the anti-skid system to avoid the wheel blockage until the runway simulator is brought to a standstill.

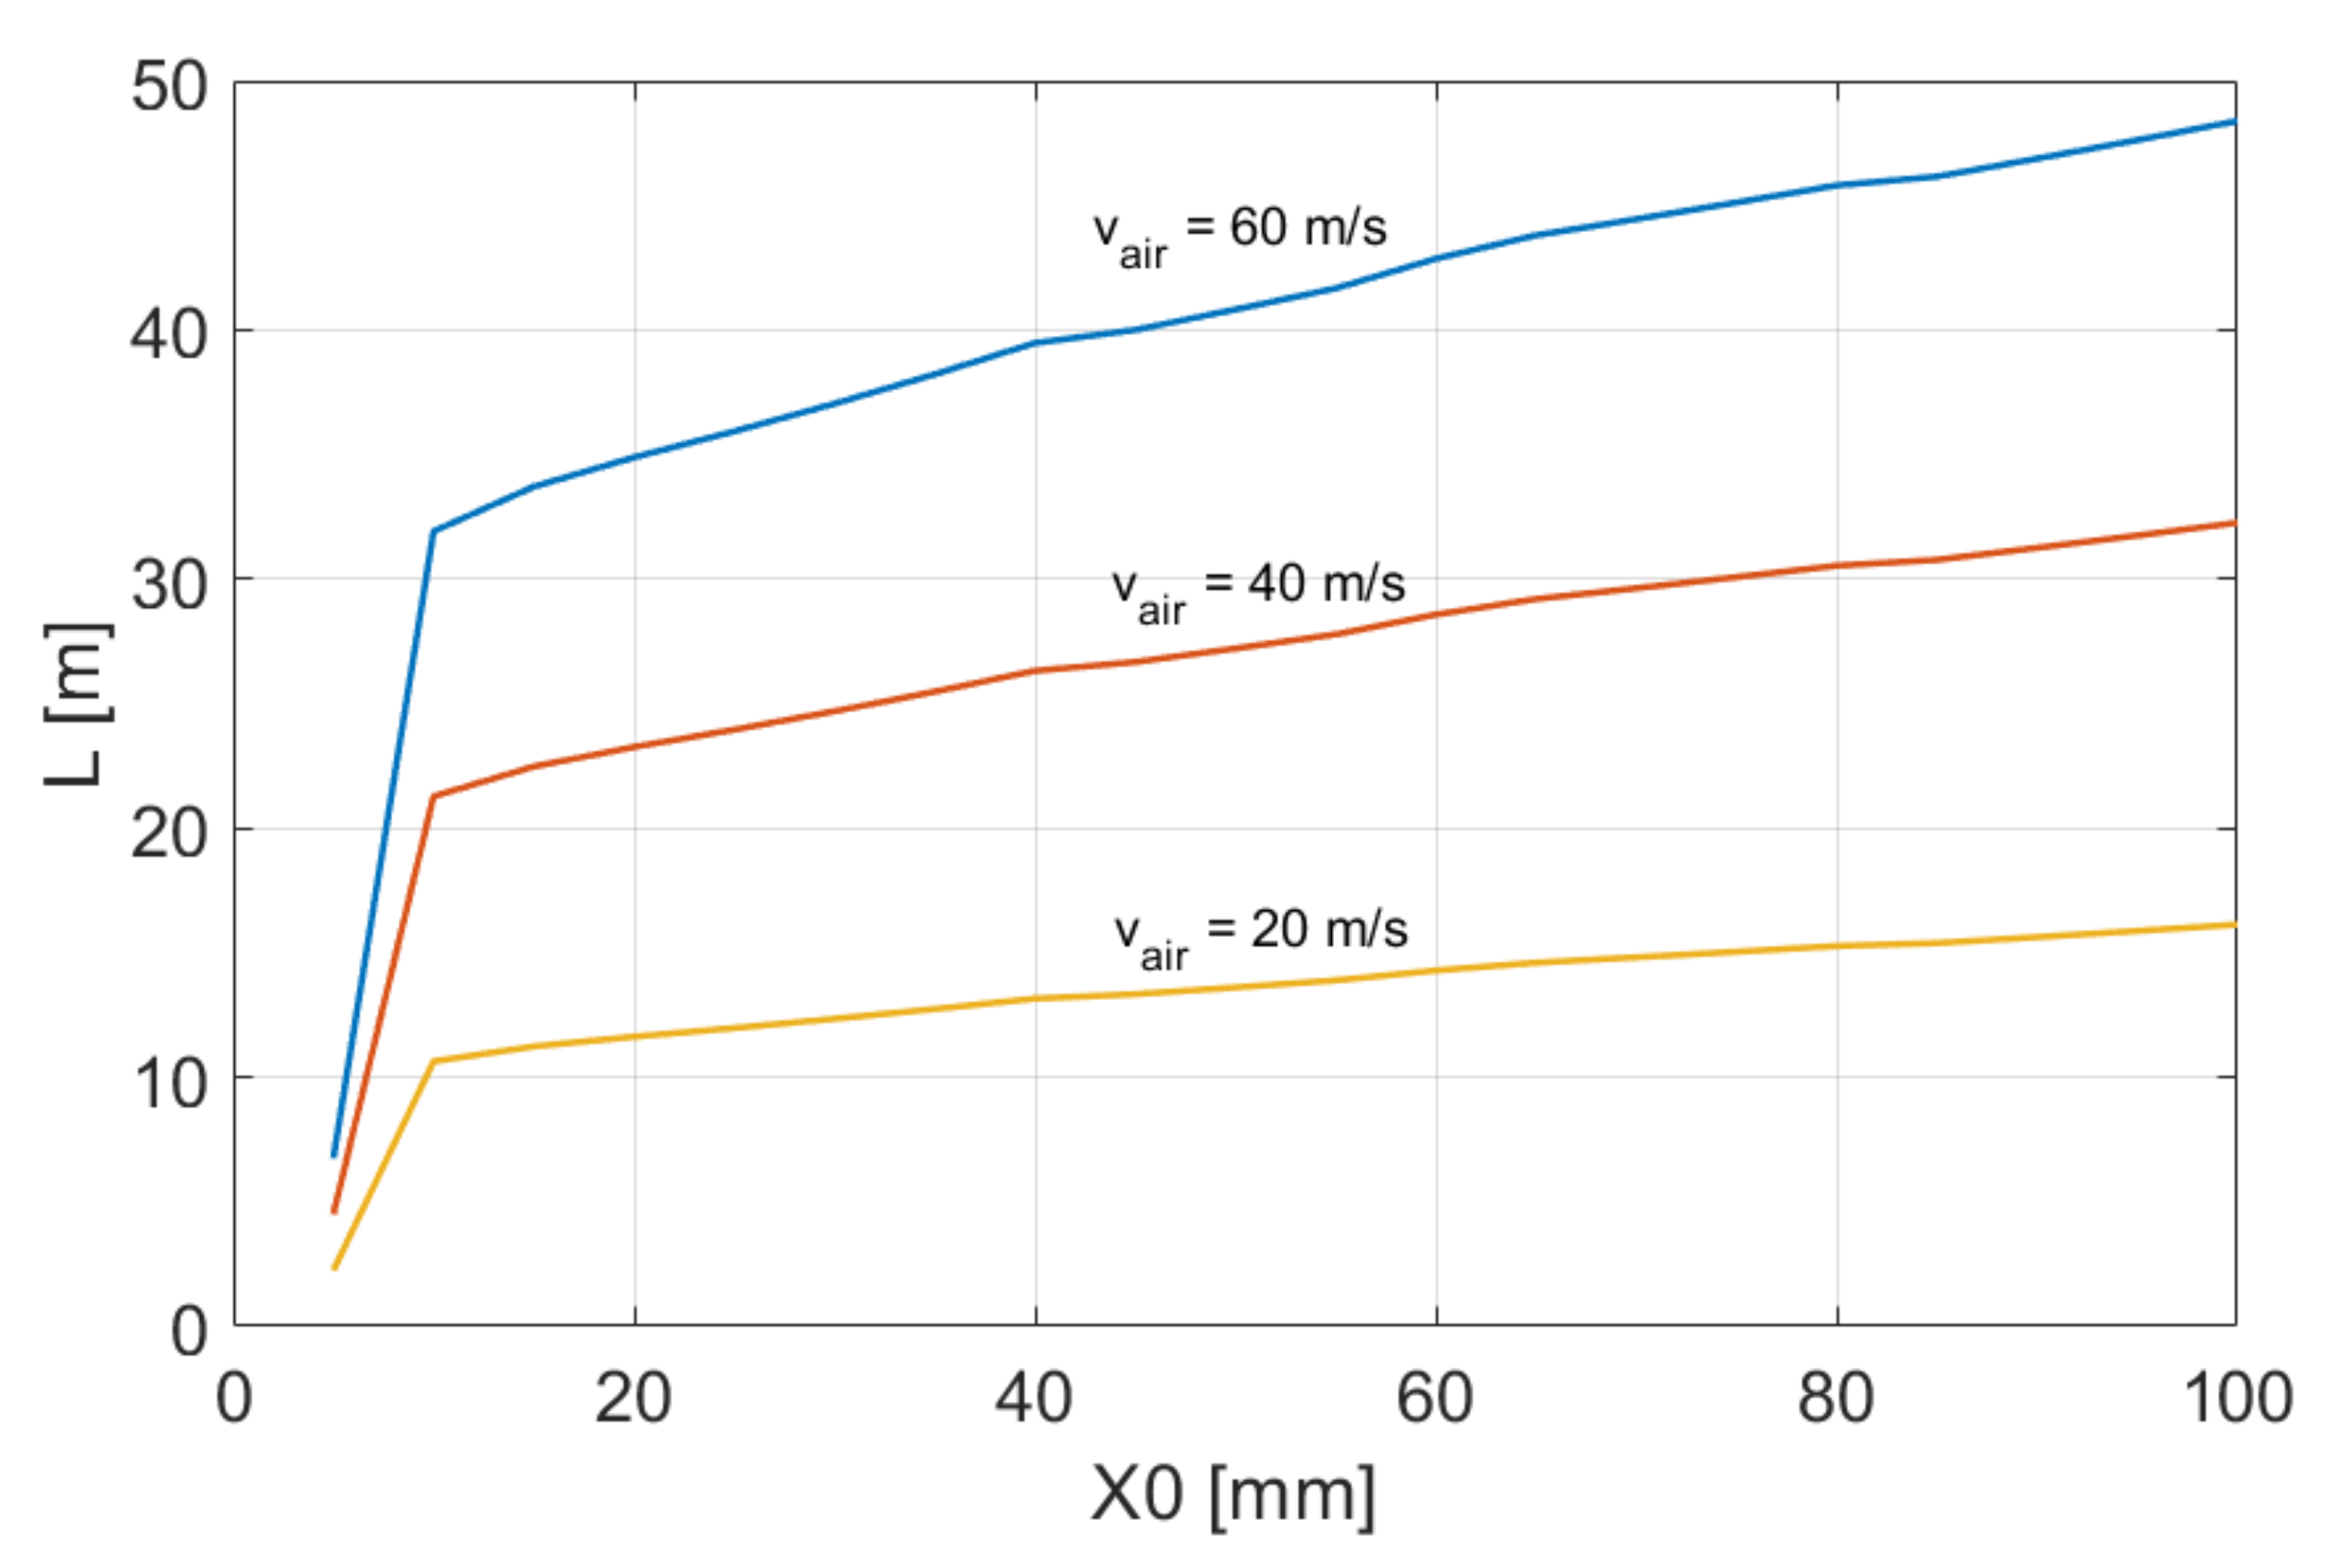
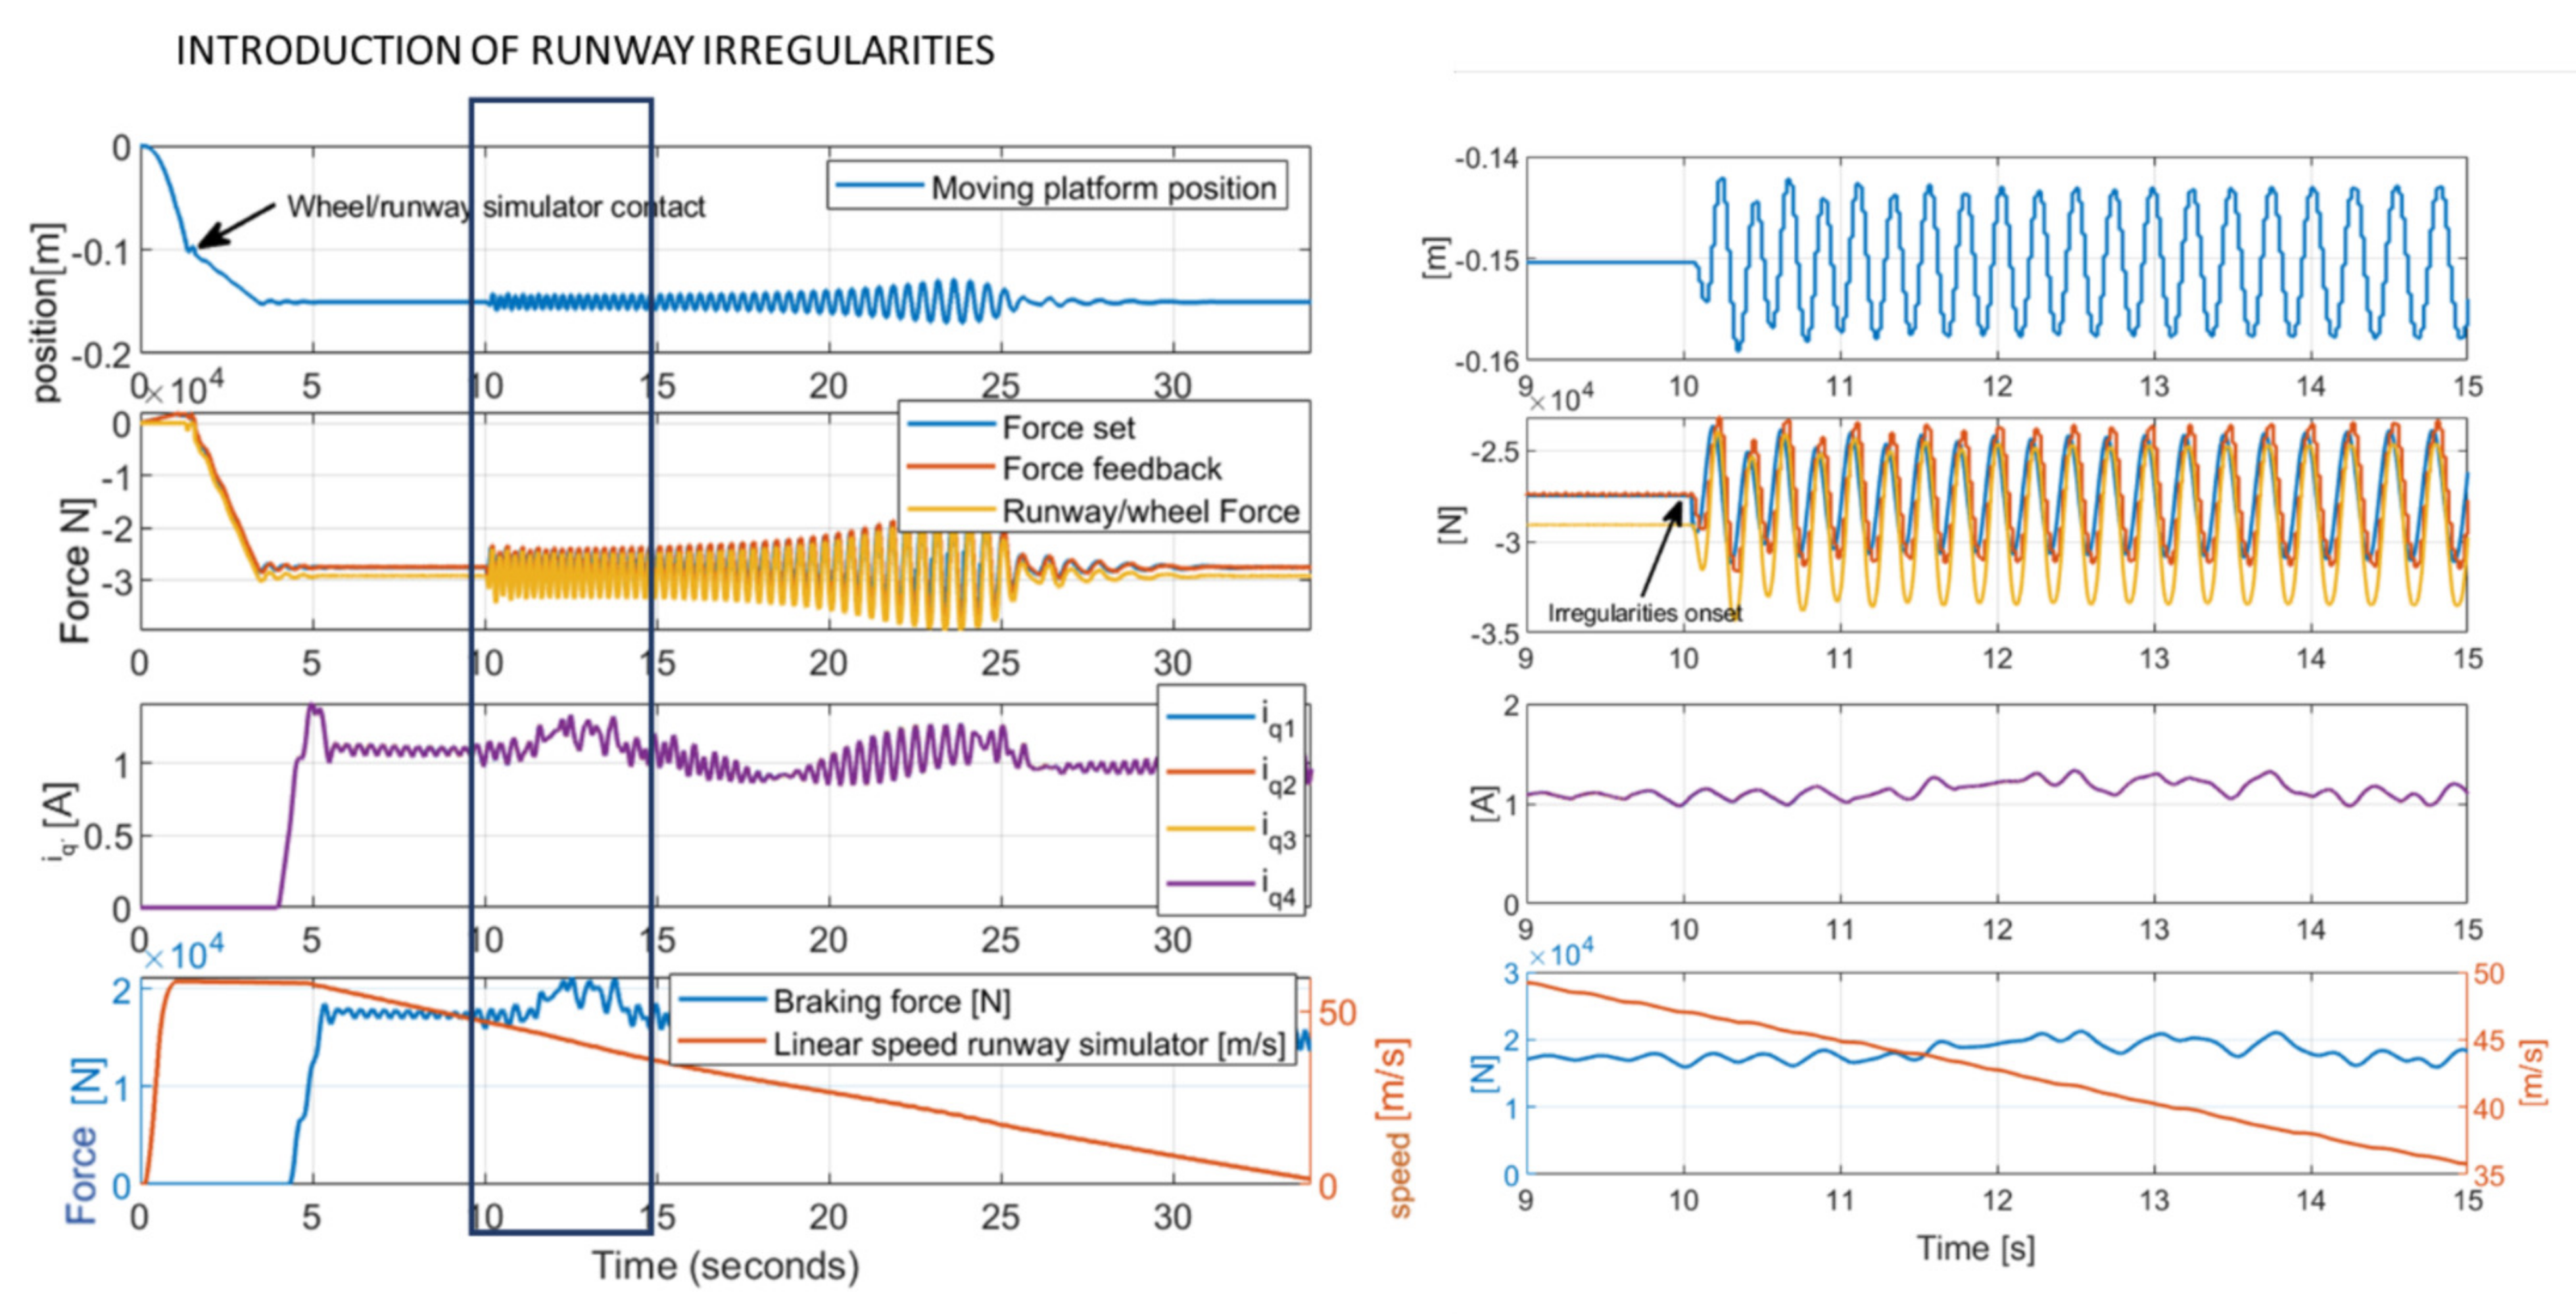
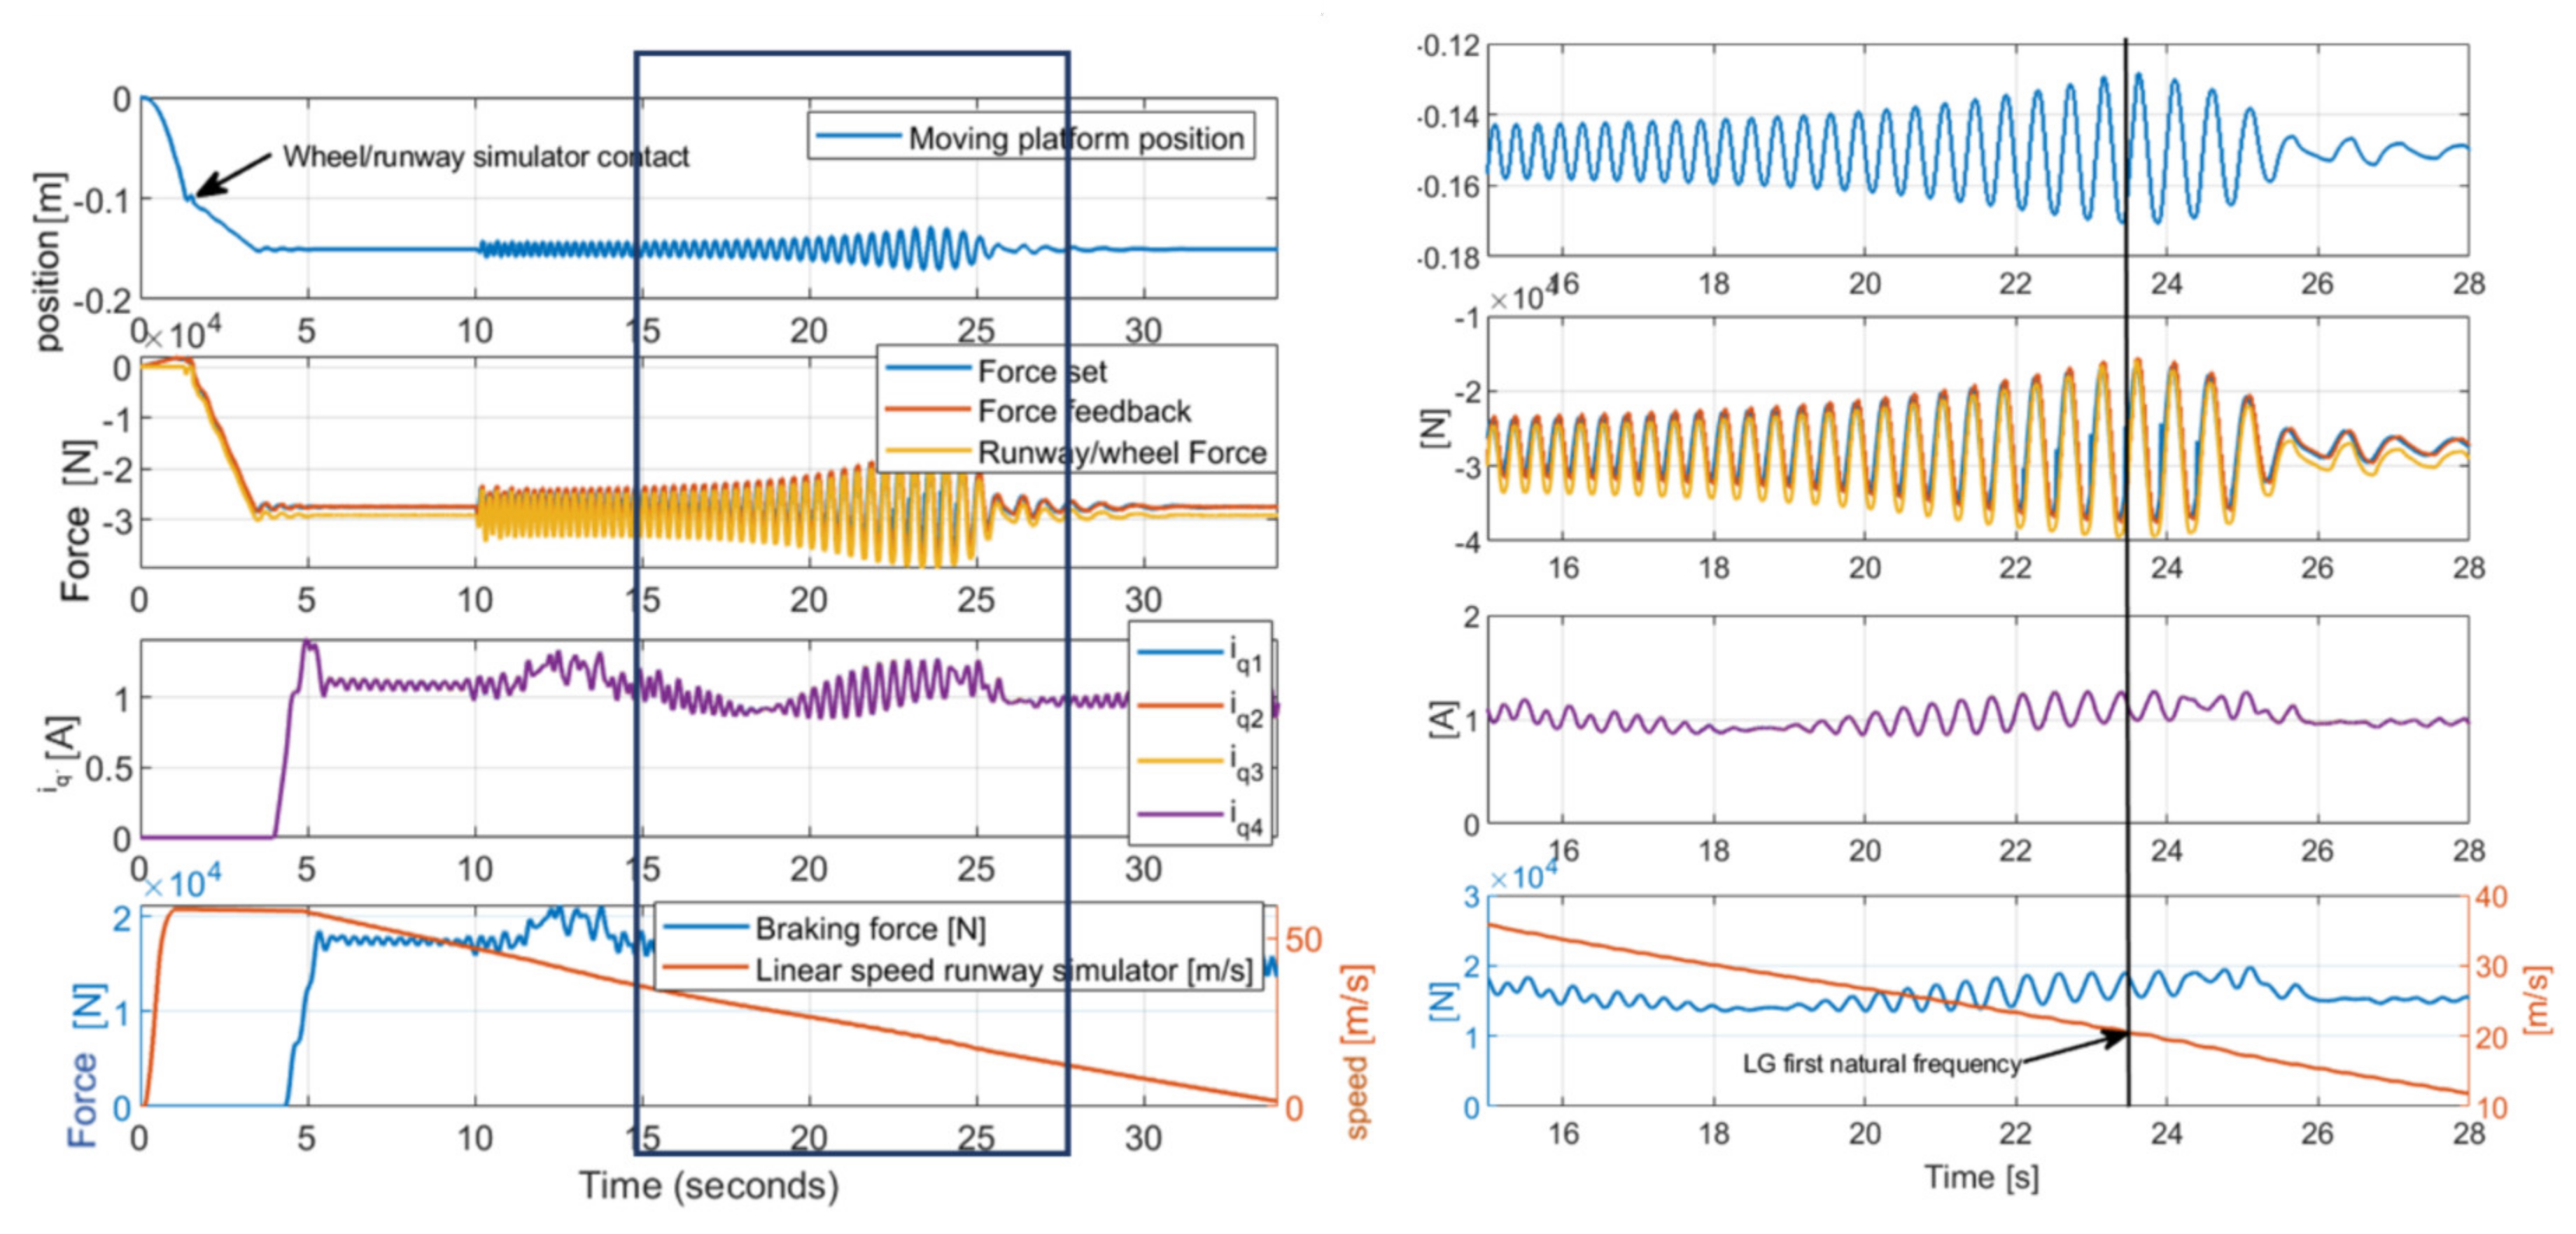
3.3. Simulation of a Landing Test in Presence of Runway Irregularities
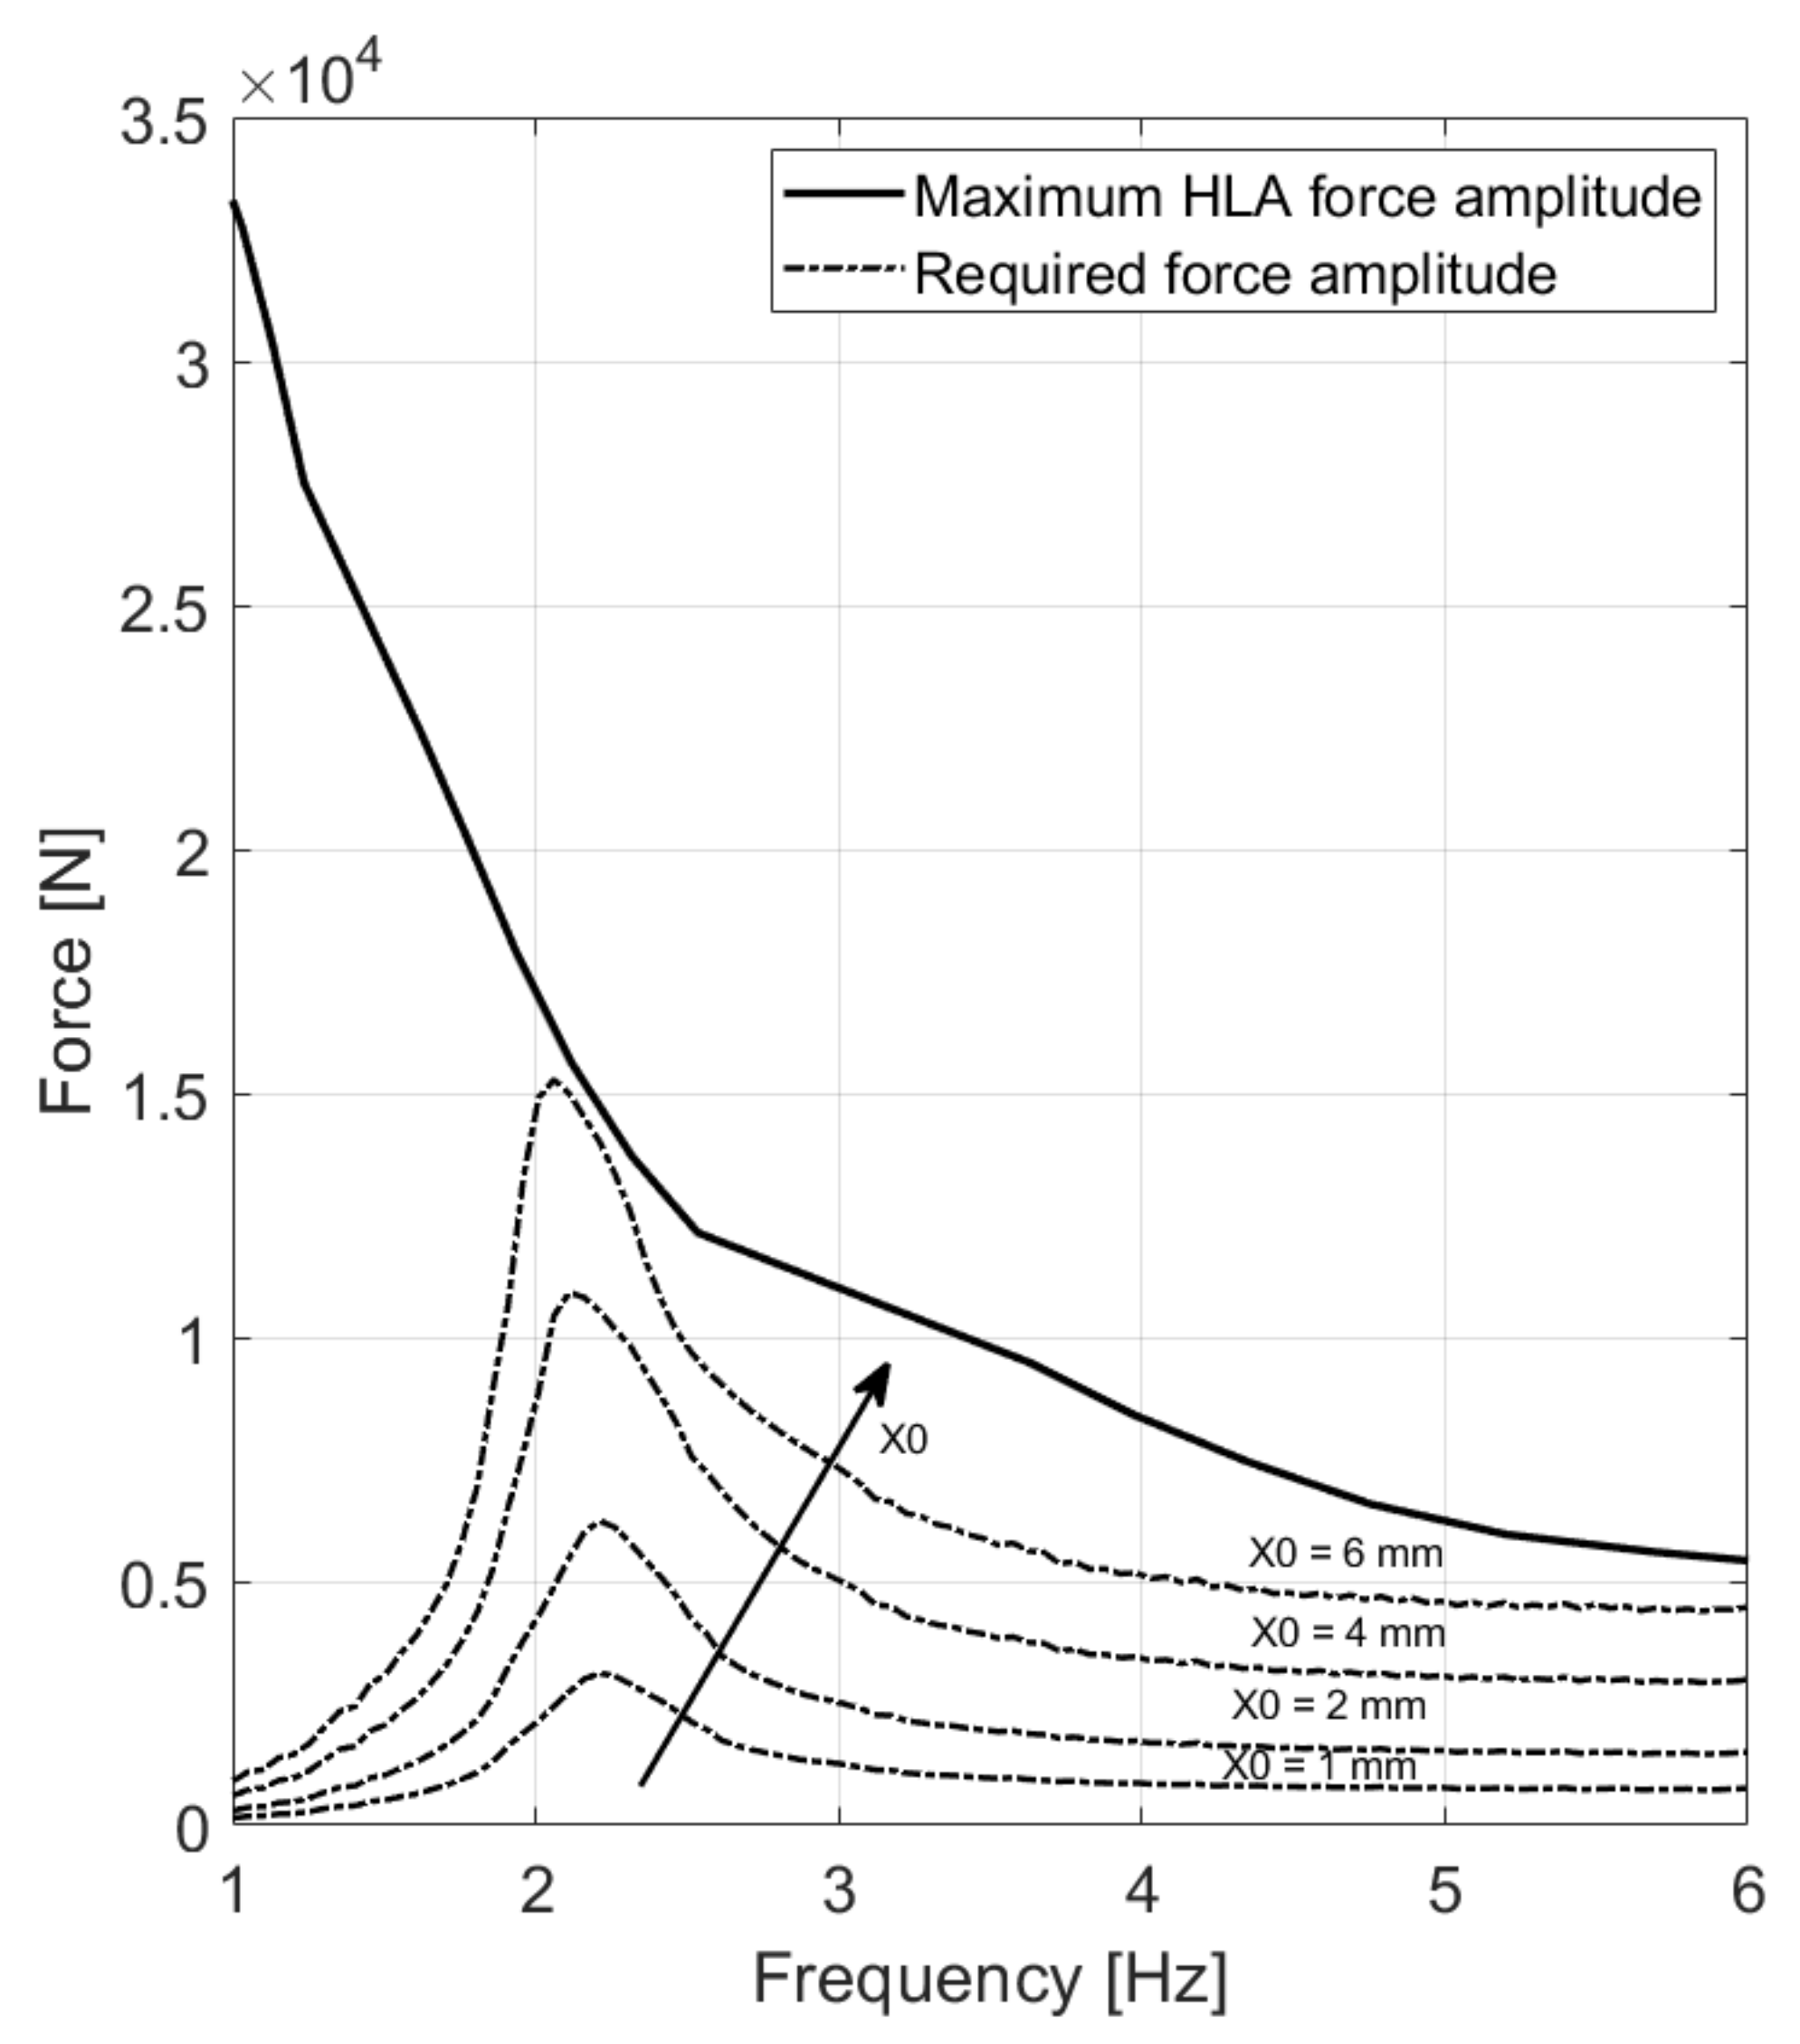
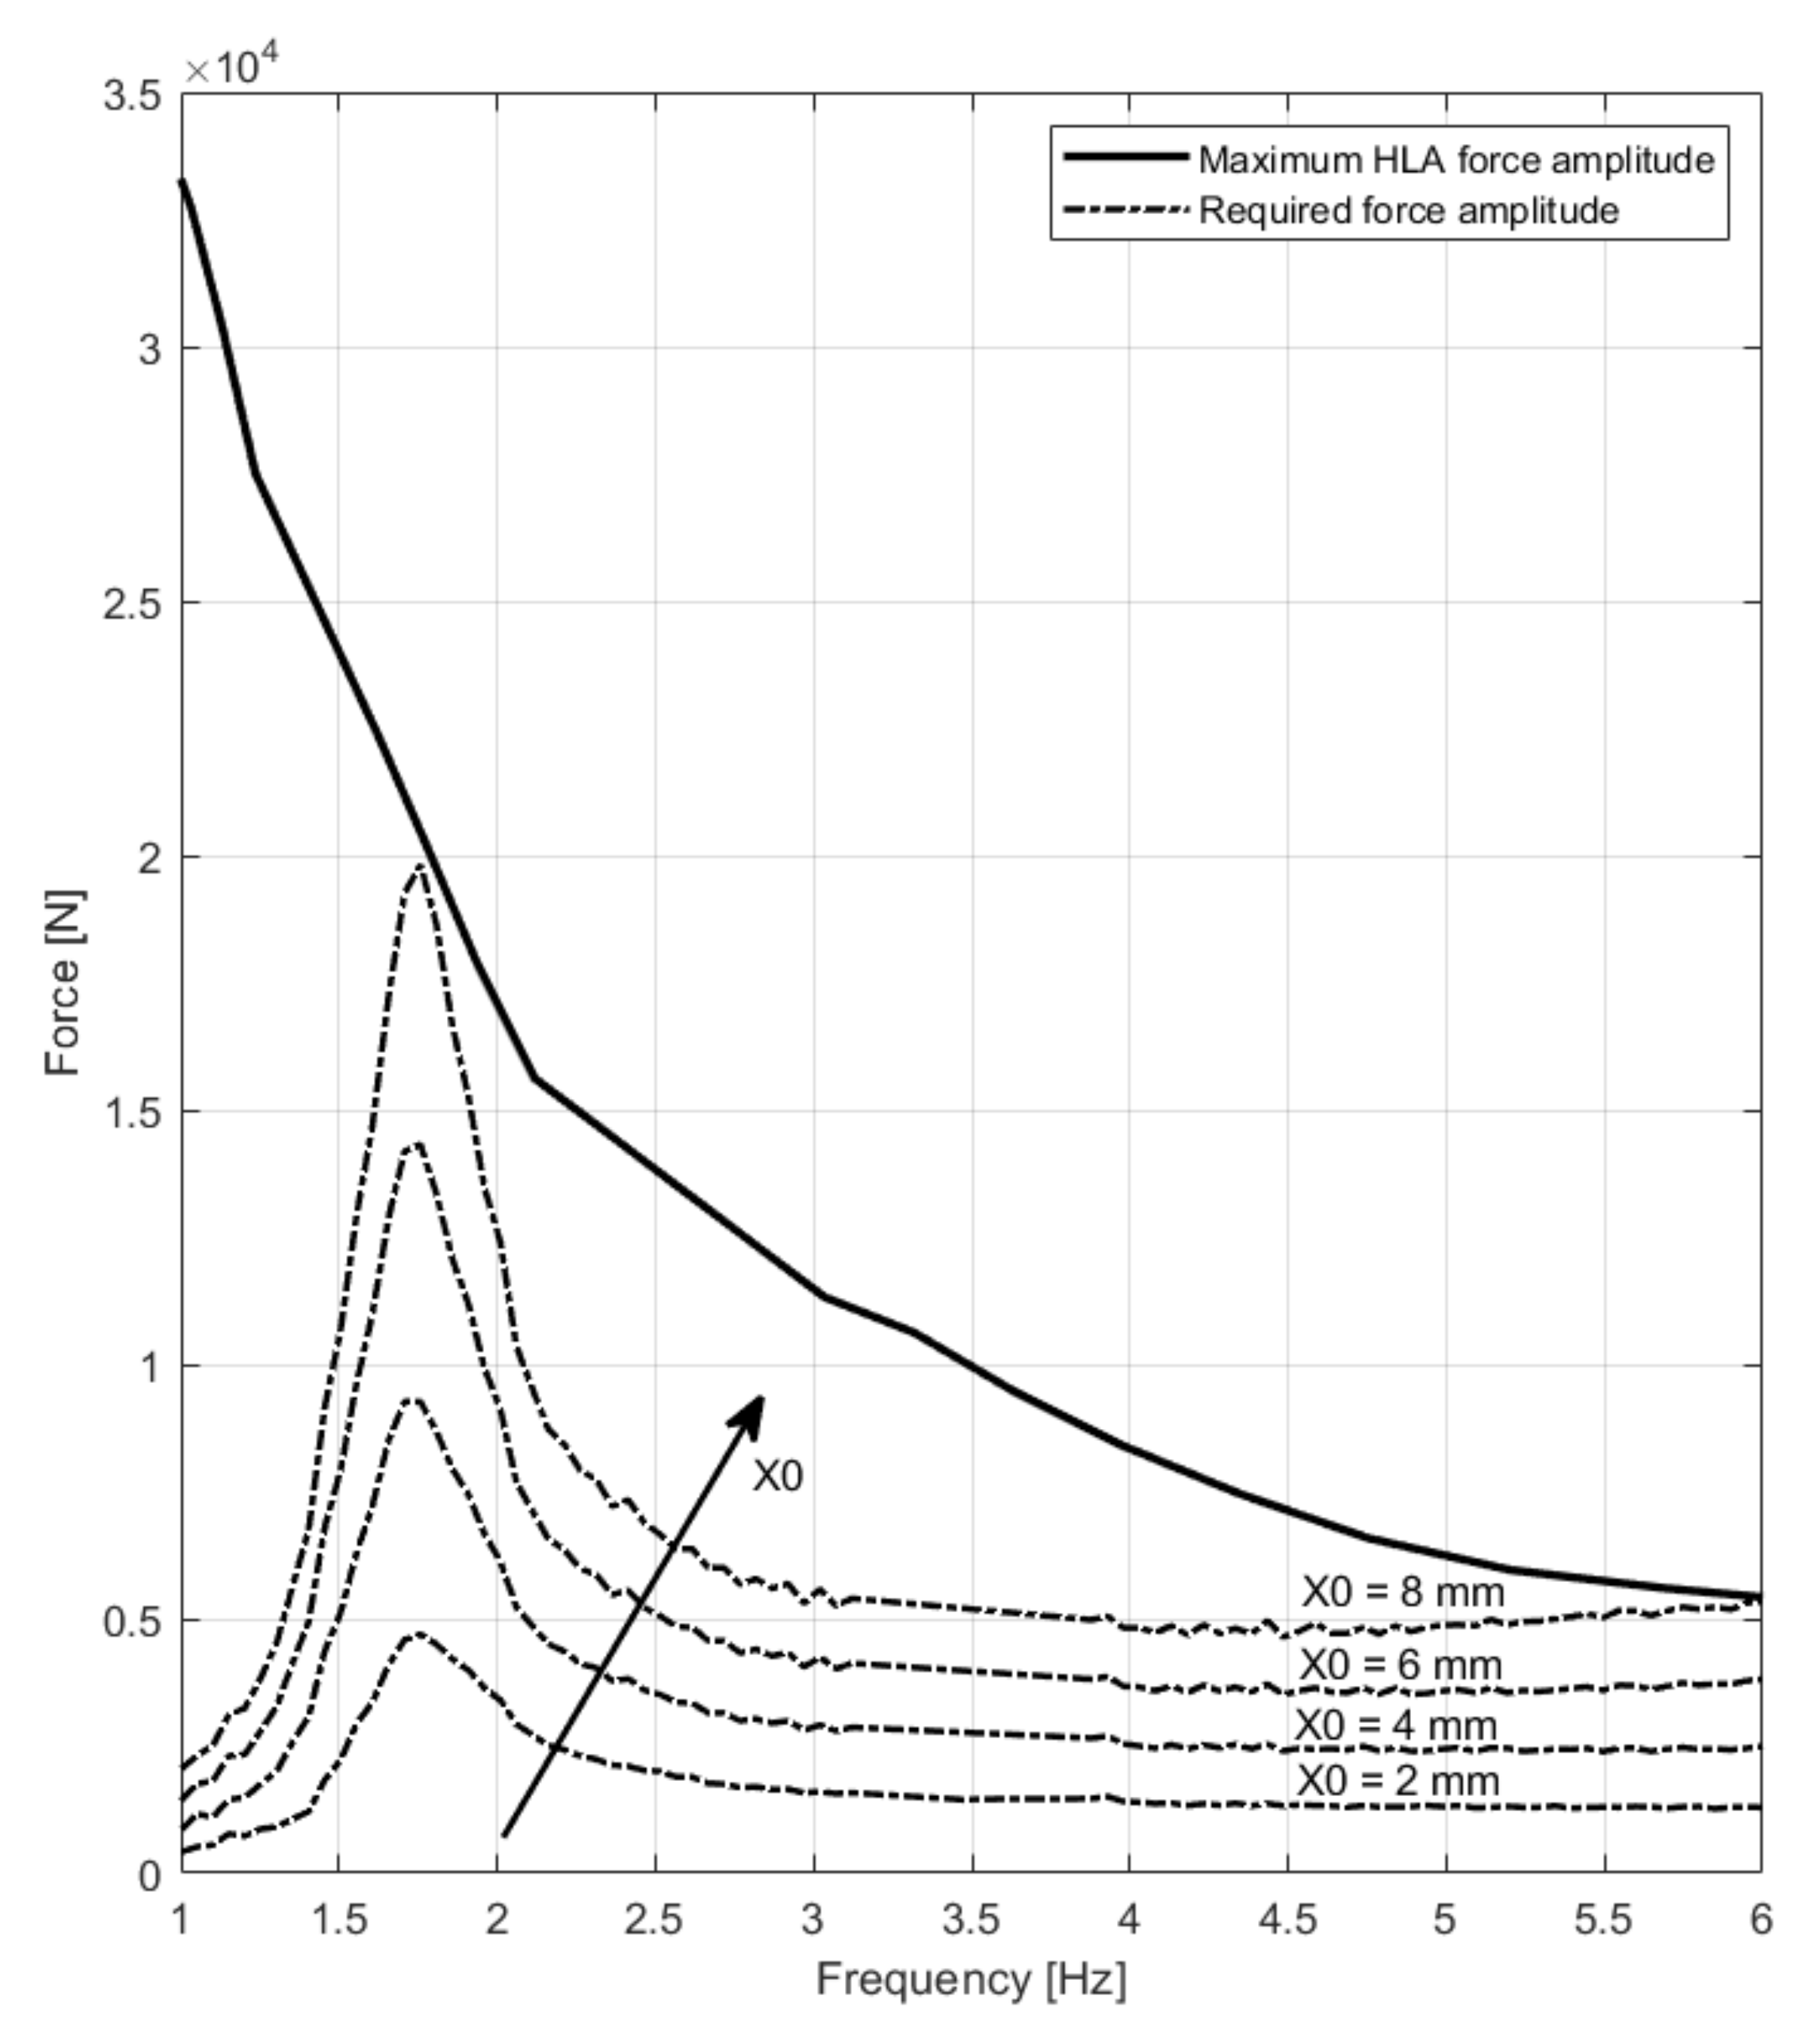
To address the test rig capability of representing the effects of periodical runway irregularities on the landing gear system within the time domain, the same landing test simulations performed for ideal runway conditions were repeated in the presence of sinusoidal runway irregularities. The same initial conditions such as the aircraft mass at landing and the horizontal speed at touchdown were applied. Results from a simulation performed considering periodical irregularities of amplitude equal to ±5 mm and 10 m pitch are presented in Figure 16 and Figure 17. In these simulations, the aircraft approached the runway with a 60 m/s horizontal speed, and the simulation runway irregularities were added at a pre-defined time instant to highlight their effects on the test rig behavior. As shown in Figure 16, the force exerted by the HLA closely followed the force command provided by the real-time model of the aircraft from the onset of the runway irregularities onward. As the test progresses, the braking action decelerates the runway simulator, where tip speed is continuously monitored by the real-time model of the aircraft. As the simulated aircraft slows down, the frequency of the dynamic force representative of the effects of the runway irregularities decreases, falling in the proximity of the first resonant frequency of the landing gear leg; for the considered simulation, this situation is expected to occur when the tip speed of the runway simulator approaches the 22 m/s mark. Depicted in Figure 17, the test rig behavior confirms the expectations, being able to replicate the force command with minimal delay and no overshoots.

3.4. Scalability

Although the test bench was designed for a well-determined platform, it is desirable to verify its scalability to different aircraft configurations or operating conditions. This objective serves multiple purposes. For once, the aircraft mass at landing is significantly affected by the amount of remaining fuel, embarked passengers, or unused military equipment, leading to more representative test campaigns, thus more effectively supporting the definition of prognostic routines for the employed components.
Moreover, the development of a scalable test rig can reduce the cost of testing and certification of future platforms. Finally, although not foreseen within the boundaries of this research program, a scalable test-bench could represent the aircraft behavior and thus the landing gear and E-Brake system operations during challenging conditions such as crosswind landing. Additional inertia disks required to represent the increased weight of the aircraft can be easily mounted on the runway simulator, provided that the mechanical components of the structure are properly sized. The hydraulic system is, on the other hand, capable of sustaining a modest increase in the aircraft mass, and thus the load, without significant loss in performance or in functionality. For the executive transport aircraft under consideration, an additional mass up to 15% of the previously considered value is considered compatible with an emergency landing executed close to take-off. As depicted in Figure 18, the test rig is able to reproduce the effects of runway irregularities, even in the presence of this additional mass.

4. Discussion and Conclusions

The E-LISA iron bird has been designed with the double purpose of fulfilling the certification procedures for a new, fully electrical landing gear system and act as a technological demonstrator for prognostic techniques developed for a few key components. As such, the need to closely reproduce a wide array of possible operating conditions including the presence of runway irregularities was assessed as a necessary feature. These requirements had a direct effect on the test bench architecture and on the definition of its control system, which involves a real-time simulation model of the aircraft to continuously compute the force command used by the test rig to reproduce a realistic loading pattern on the landing gear under analysis. The definition of a novel control scheme, based on the combination of a simple position control loop with an advanced force control loop was also required. To support the design of the iron bird and contribute to the definition of its control laws, a high-fidelity model of the system was prepared according to well established equations. Simulation results showed that the iron bird control system was stable, and that its expected performances allowed for the representation of the effects of runway irregularities on the test-article, although with some limitation. The test bench, in particular, is expected to be able to successfully replicate the effects of periodical runway irregularities with an amplitude equal or lower to 6 mm independently from the aircraft horizontal speed during landing and taxing. Moreover, the system has proven a certain degree of scalability; simulation results suggests that the system can successfully replicate the loading conditions on the landing gear leg considering a 30% increase in aircraft weight, even in the presence of runway irregularities. Further work is required to properly characterize the test rig capability to simulate localized runway defects of different severity and irregular geometry such as cracks and lobes. Once the test bench is built, further work will be directed at the proper identification of the dynamic parameters of the simulation model, the validation of the proposed control scheme, and the experimental verification of the iron bird performance.

Author Contributions

Conceptualization, A.D.M., G.J., and M.S.; methodology, A.D.M., G.J., and M.S.; software, A.D.M.; validation, A.D.M.; formal analysis, A.D.M. and G.J.; investigation, A.D.M. and G.J.; resources, A.D.M., G.J., and M.S.; data curation, A.D.M.; writing—original draft preparation, A.D.M.; writing—review and editing, G.J. and M.S.; visualization, A.D.M.; supervision, M.S.; project administration, G.J. and M.S.; funding acquisition, G.J. and M.S. All authors have read and agreed to the published version of the manuscript.

Funding

The research work presented in this paper was performed within the E-LISA project, which has received funding from the Clean Sky 2 Joint Undertaking under the European Union’s Horizon 2020 Research and Innovation Program under grant agreement number 887222.

Conflicts of Interest

The authors declare no conflict of interest. The funders had no role in the design of the study; in the collection, analyses, or interpretation of data; in the writing of the manuscript, or in the decision to publish the results.

References

  1. Schmidt, R.K.; Eng, P. An Integrated Modular Test Rig for Landing Gear Fatigue and Strength Testing. In Proceedings of the ICAS2002 CONGRESS, Toronto, ON, Canada, 8–13 September 2002; pp. 1–6. [Google Scholar]
  2. Han, J.; Lee, Y.-S.; Ahn, O.-S. Design & Fabrication for Small Aircraft Landing Gear Drop Test Rig System. J. Korean Soc. Aeronaut. Sp. Sci. 2008, 36, 1121–1125. [Google Scholar] [CrossRef] [Green Version]
  3. Jacazio, G.; Balossini, G. A Mechatronic Active Force Control System. In Proceedings of the ASME 2009 International Design Engineering Technical Conferences & Computers and Information in Engineering Conference, San Diego, CA, USA, 30 August 30–2 September 2009; pp. 1–8. [Google Scholar]
  4. Dravico, L.; Tanelli, M.; Savaresia, S.M. Experimental validation of landing-gear dynamics for anti-skid control design. In Proceedings of the 2018 European Control Conference ECC, Limassol, Cyprus, 12–15 June 2018; pp. 2751–2756. [Google Scholar] [CrossRef]
  5. Byington, C.S.; Watson, M.; Edwards, D. Data-driven neural network methodology to remaining life predictions for aircraft actuator components. In Proceedings of the IEEE Aerospace Conference Proceedings, Big Sky, MT, USA, 6–13 March 2004. [Google Scholar]
  6. Ramesh, G.; Garza, P.; Perinpanayagam, S. Digital simulation and identification of faults with neural network reasoners in brushed actuators employed in an e-brake system. Appl. Sci. 2021, 11, 9171. [Google Scholar] [CrossRef]
  7. Oikonomou, A.; Eleftheroglou, N.; Freeman, F.; Loutas, T.; Zarouchas, D. Remaining Useful Life Prognosis of Aircraft Brakes. Int. J. Progn. Health Manag. 2022, 13, 1–11. [Google Scholar]
  8. Autin, S.; De Martin, A.; Jacazio, G.; Socheleau, J.; Vachtsevanos, G.J. Results of a feasibility study of a Prognostic System for Electro-Hydraulic Flight Control Actuators. Int. J. Progn. Health Manag. 2021, 12, 1–18. [Google Scholar] [CrossRef]
  9. Wesołowski, M.; Blacha, K. Evaluation of airfield pavement micro and macrotexture in the light of skid resistance (friction coefficient) measurements. MATEC Web Conf. 2019, 262, 05017. [Google Scholar] [CrossRef]
  10. Wesołowski, M.; Blacha, K.; Pietruszewski, P.; Iwanowski, P. Analysis of the Actual Contact Surface of Selected Aircraft Tires with the Airport Pavement as a Function of Pressure and Vertical Load. Coatings 2020, 10, 591. [Google Scholar] [CrossRef]
  11. Zieja, M.; Wesołowski, M.; Blacha, K.; Iwanowski, P. Analysis of the anti-skid properties of new airfield pavements in aspect of applicable requirements. Coatings 2021, 11, 778. [Google Scholar] [CrossRef]
  12. Jacazio, G.; Balossini, G. A high performance force control system for dynamic loading and fast moving actuators. In Proceedings of the Power Transmission and Motion Control, University of Bath, Bath, UK, 7–9 September 2005. [Google Scholar]
  13. Jacazio, G.; Balossini, G. Real-time loading actuator control for an advanced aerospace test rig. Proc. Inst. Mech. Eng. Part I J. Syst. Control Eng. 2007, 221, 199–210. [Google Scholar] [CrossRef]
  14. Chiavaroli, P.; De Martin, A.; Evangelista, G.; Jacazio, G.; Sorli, M. Real Time Loading Test Rig for Flight Control Actuators Under PHM Experimentation. In Proceedings of the ASME International Mechanical Engineering Congress and Exposition, Proceedings (IMECE), Pittsburgh, PA, USA, 9–15 November 2018; Volume 1, p. V001T03A032. [Google Scholar]
  15. De Martin, A.; Dellacasa, A.; Jacazio, G.; Sorli, M. High-Fidelity Model of Electro-Hydraulic Actuators for Primary Flight Control Systems. In Proceedings of the 2018 Bath/ASME Symposium on Fluid Power and Motion Control FPMC2018, Bath, UK, 12–14 September 2018; p. V001T01A058. [Google Scholar]
  16. Carbone, G.; Putignano, C. A novel methodology to predict sliding and rolling friction of viscoelastic materials: Theory and experiments. J. Mech. Phys. Solids 2013, 61, 1822–1834. [Google Scholar] [CrossRef]
  17. Burckhardt, M. Fahrwerktechnik: Radschlupf-Regelsysteme; Vogel Verlag: Würzbg, Germany, 1993. [Google Scholar]
  18. De Martin, A.; Jacazio, G.; Vachtsevanos, G. Windings Fault Detection and Prognosis in Electro-Mechanical Flight Control Actuators Operating in Active-Active Configuration. Int. J. Progn. Health Manag. 2017, 8. [Google Scholar] [CrossRef]
  19. Mohan, N.; Undeland, T.M.; Robbins, W.P. Power Electronics, 3rd ed.; John Wiley and Sons, Inc.: Hoboken, NJ, USA, 2005. [Google Scholar]
  20. Di Mascio, P.; Ragnoli, A.; Portas, S.; Santoni, M.; Sever, D.; Doler, D.; Kovačič, B. Monitor activity for the implementation of a pavement—Management system at cagliari airport. Appl. Sci. 2021, 11, 8697. [Google Scholar] [CrossRef]
Figure 1. Iron bird schematics.
Aerospace 09 00114 g001
Figure 2. Iron bird control structure.
Aerospace 09 00114 g002
Figure 3. Schematics of the test rig control system.
Aerospace 09 00114 g003
Figure 4. Control law of the modulating control loop.
Aerospace 09 00114 g004
Figure 5. Control law of the force control loop.
Aerospace 09 00114 g005
Figure 6. Two-dimensional model of the aircraft dynamics.
Aerospace 09 00114 g006
Figure 7. Schematics of the test rig assembly model.
Aerospace 09 00114 g007
Figure 8. Free-body diagram of the wheel–runway simulator interaction.
Aerospace 09 00114 g008
Figure 9. Schematics of the E-Brake system.
Aerospace 09 00114 g009
Figure 10. Open loop frequency response of the force control system.
Aerospace 09 00114 g010
Figure 11. Close loop frequency response for the force control system—mean value of 0 kN.
Aerospace 09 00114 g011
Figure 12. Verification of the test bench capability to reproduce periodical runway irregularities.
Aerospace 09 00114 g012
Figure 13. Test bench capability to reproduce periodical runway irregularities: minimum pitch (L) vs. waving amplitude (X0).
Aerospace 09 00114 g013
Figure 14. Landing test simulation: moving platform descent and wheel/runway simulator touchdown.
Aerospace 09 00114 g014
Figure 15. Landing test simulation: brake engagement and aircraft deceleration.
Aerospace 09 00114 g015
Figure 16. Landing test simulation: introduction of periodical runway irregularities (amplitude 5 mm, pitch 10 m).
Aerospace 09 00114 g016
Figure 17. Landing test simulation: dynamic load close to the first LG resonance due to periodical runway irregularities (amplitude 5 mm, pitch 10 m).
Aerospace 09 00114 g017
Figure 18. Verification of the test bench capability to reproduce periodical runway irregularities with increased aircraft weight (15% increase).
Aerospace 09 00114 g018
Publisher’s Note: MDPI stays neutral with regard to jurisdictional claims in published maps and institutional affiliations.

