Article

Electro-Thermal Parameters of Graphene Nano-Platelets Films for De-Icing Applications

1
Department of Electrical and Information Engineering, University of Cassino and Southern Lazio, 03043 Cassino, Italy
2
Laboratory of Electronics and Microelectronics, University of Monastir, Monastir 5060, Tunisia
3
Department of Civil and Mechanical Engineering, University of Cassino and Southern Lazio, 03043 Cassino, Italy
4
Nanesa S.r.l., 52100 Arezzo, Italy
*
Author to whom correspondence should be addressed.
Aerospace 2022, 9(2), 107; https://doi.org/10.3390/aerospace9020107
Submission received: 15 January 2022 / Revised: 10 February 2022 / Accepted: 14 February 2022 / Published: 16 February 2022

Abstract

:
This paper provides a study of some relevant electro-thermal properties of commercial films made by pressed graphene nano-platelets (GNPs), in view of their use as heating elements in innovative de-icing systems for aerospace applications. The equivalent electrical resistivity and thermal emissivity were studied, by means of models and experimental characterization. Macroscopic strips with a length on the order of tens of centimeters were analyzed, either made by pure GNPs or by composite mixtures of GNPs and a small percentage of polymeric binders. Analytical models are derived and experimentally validated. The thermal response of these graphene films when acting as a heating element is studied and discussed.

1. Introduction

Developing efficient and cost-effective de-icing systems is a major challenge in several industrial applications, not only related to aerospace [1], but also, for instance, in fields such as energy production [2] or energy distribution [3]. To this purpose, many techniques have been proposed and implemented over the years, based on three main approaches, involving mechanical, chemical and thermal methods and implementing either active or passive mitigation techniques [1,4]. By comparing these approaches, it turns out that de-icing based on Joule heating in electrical conductors conjugates a higher energy efficiency with easier system controllability, compared to the other existing techniques [5,6]. However, a major critical point in view of implementing such an electro-thermal technique is the proper choice of the heating element. Indeed, the use of heaters made by conventional conductors, such as copper and aluminum, holds some disadvantages, such as excessive weight or limited capability of handling the electrical current density required for efficient local heating.
To overcome these limits, recently, attention has been paid to the possibility of realizing the heaters by means of lightweight composite materials, such as those based on graphene-related materials [6,7]. Indeed, such materials are demonstrated to provide outstanding thermal and electrical behavior, as well as superior mechanical features, such as lightness [8,9]. However, the materials that can be strictly denoted as graphene or graphene-related are of a limited interest for industrial applications, given the well-known issues related to their fabrication and integration costs. Therefore, recently, attention has been paid to the so-called commercial graphene materials, which, strictly speaking, are more correctly classified as graphitic rather than graphene materials. Although their performance is not so outstanding as the real graphene, they can, however, realize a satisfactory compromise between the need for improving the performance and the need to use an industrially appealing material [10]. Materials based on graphene nanoplatelets (GNPs) are among the most promising candidates to meet the above trade-off. Indeed, GNPs are irregular flakes of few-layers graphene [11,12] that can be produced in several ways, including high-yield industrially scalable techniques such as microwave irradiation (e.g., [10,13]). Starting from GNPs, industrial materials suitable for applications such as those discussed in this paper are proposed in the form of composites.
Industrial nanocomposites made by macroscopic polymeric matrices embedding nanofillers such as GNPs, as well as carbon nanotubes, have been investigated over the last few years [14,15,16], highlighting their potential performance, but also their current limits. Indeed, the electrical, thermal and mechanical properties of nanocomposites with a small percentage of carbon nanofillers have been extensively studied [17,18,19]. Their electrical conductivity is high enough to provide good electromagnetic properties, such as shielding effectiveness [20,21], but is too low for them to be efficiently used as heaters for de-icing applications.
Recently, industrial composites with a high percentage of GNPs (up to 100%) have been investigated by the authors [22,23], in view of their possible use as heating elements of a de-icing system. To this purpose, a thorough study of the behavior of the main electro-thermal parameters is needed, since, for this class of composites, few works are so far available; a study is carried out, for instance, in [24], but it is only related to electrical conductivity.
The materials analyzed in this paper are macroscopic strips, industrially fabricated by assembling GNPs produced from expandable graphite. Strictly speaking, this material should be classified as graphite micro-platelets, but, for the sake of simplicity, we will, hereafter, refer to them as industrial graphene strips or films, with the meaning so far discussed. The strips analyzed are designated to become heating elements embedded in a glass-fibre reinforced material, in the typical multilayer structure of an airwing. In view of these applications, it is essential to investigate their electrical and thermal properties.
In this paper, we investigate the electrical resistivity and the thermal emissivity. The first parameter is, of course, essential to correctly manage the Joule effect, responsible for de-icing and anti-icing capability. The second one is fundamental to properly include radiative exchange with the surrounding environment.
This paper follows previous works done by the authors (see [22,23]). Compared to such references, here, a more accurate analysis of the electrical resistivity behavior is provided, including a new material, assessing a sensitivity analysis on the effect of strip lengths, and proposing a physically meaningful method to explain the obtained negative derivative of the resistivity with respect to temperature.
Furthermore, a new experimental setup is presented that is specifically intended to discuss and assess the Joule heating capability with respect to the power density targets for de-icing and anti-icing applications. This new setup provides much more controllable and stable conditions, so that a transient thermal analysis can be performed.
Finally, another novel contribution is a detailed description of a methodology proposed for deriving the thermal emissivity, by exploiting the feature of the set-up realized for the Joule heating assessment.
The paper is organized as follows: in Section 2, the fabrication of the graphene films is discussed, as well as the set-ups and methods proposed both for the characterization of the electrical resistivity and for the heating element. In Section 3, the results are presented and discussed, and an interpretation is given to the behavior of the resistivity vs. temperature.

2. Materials and Methods

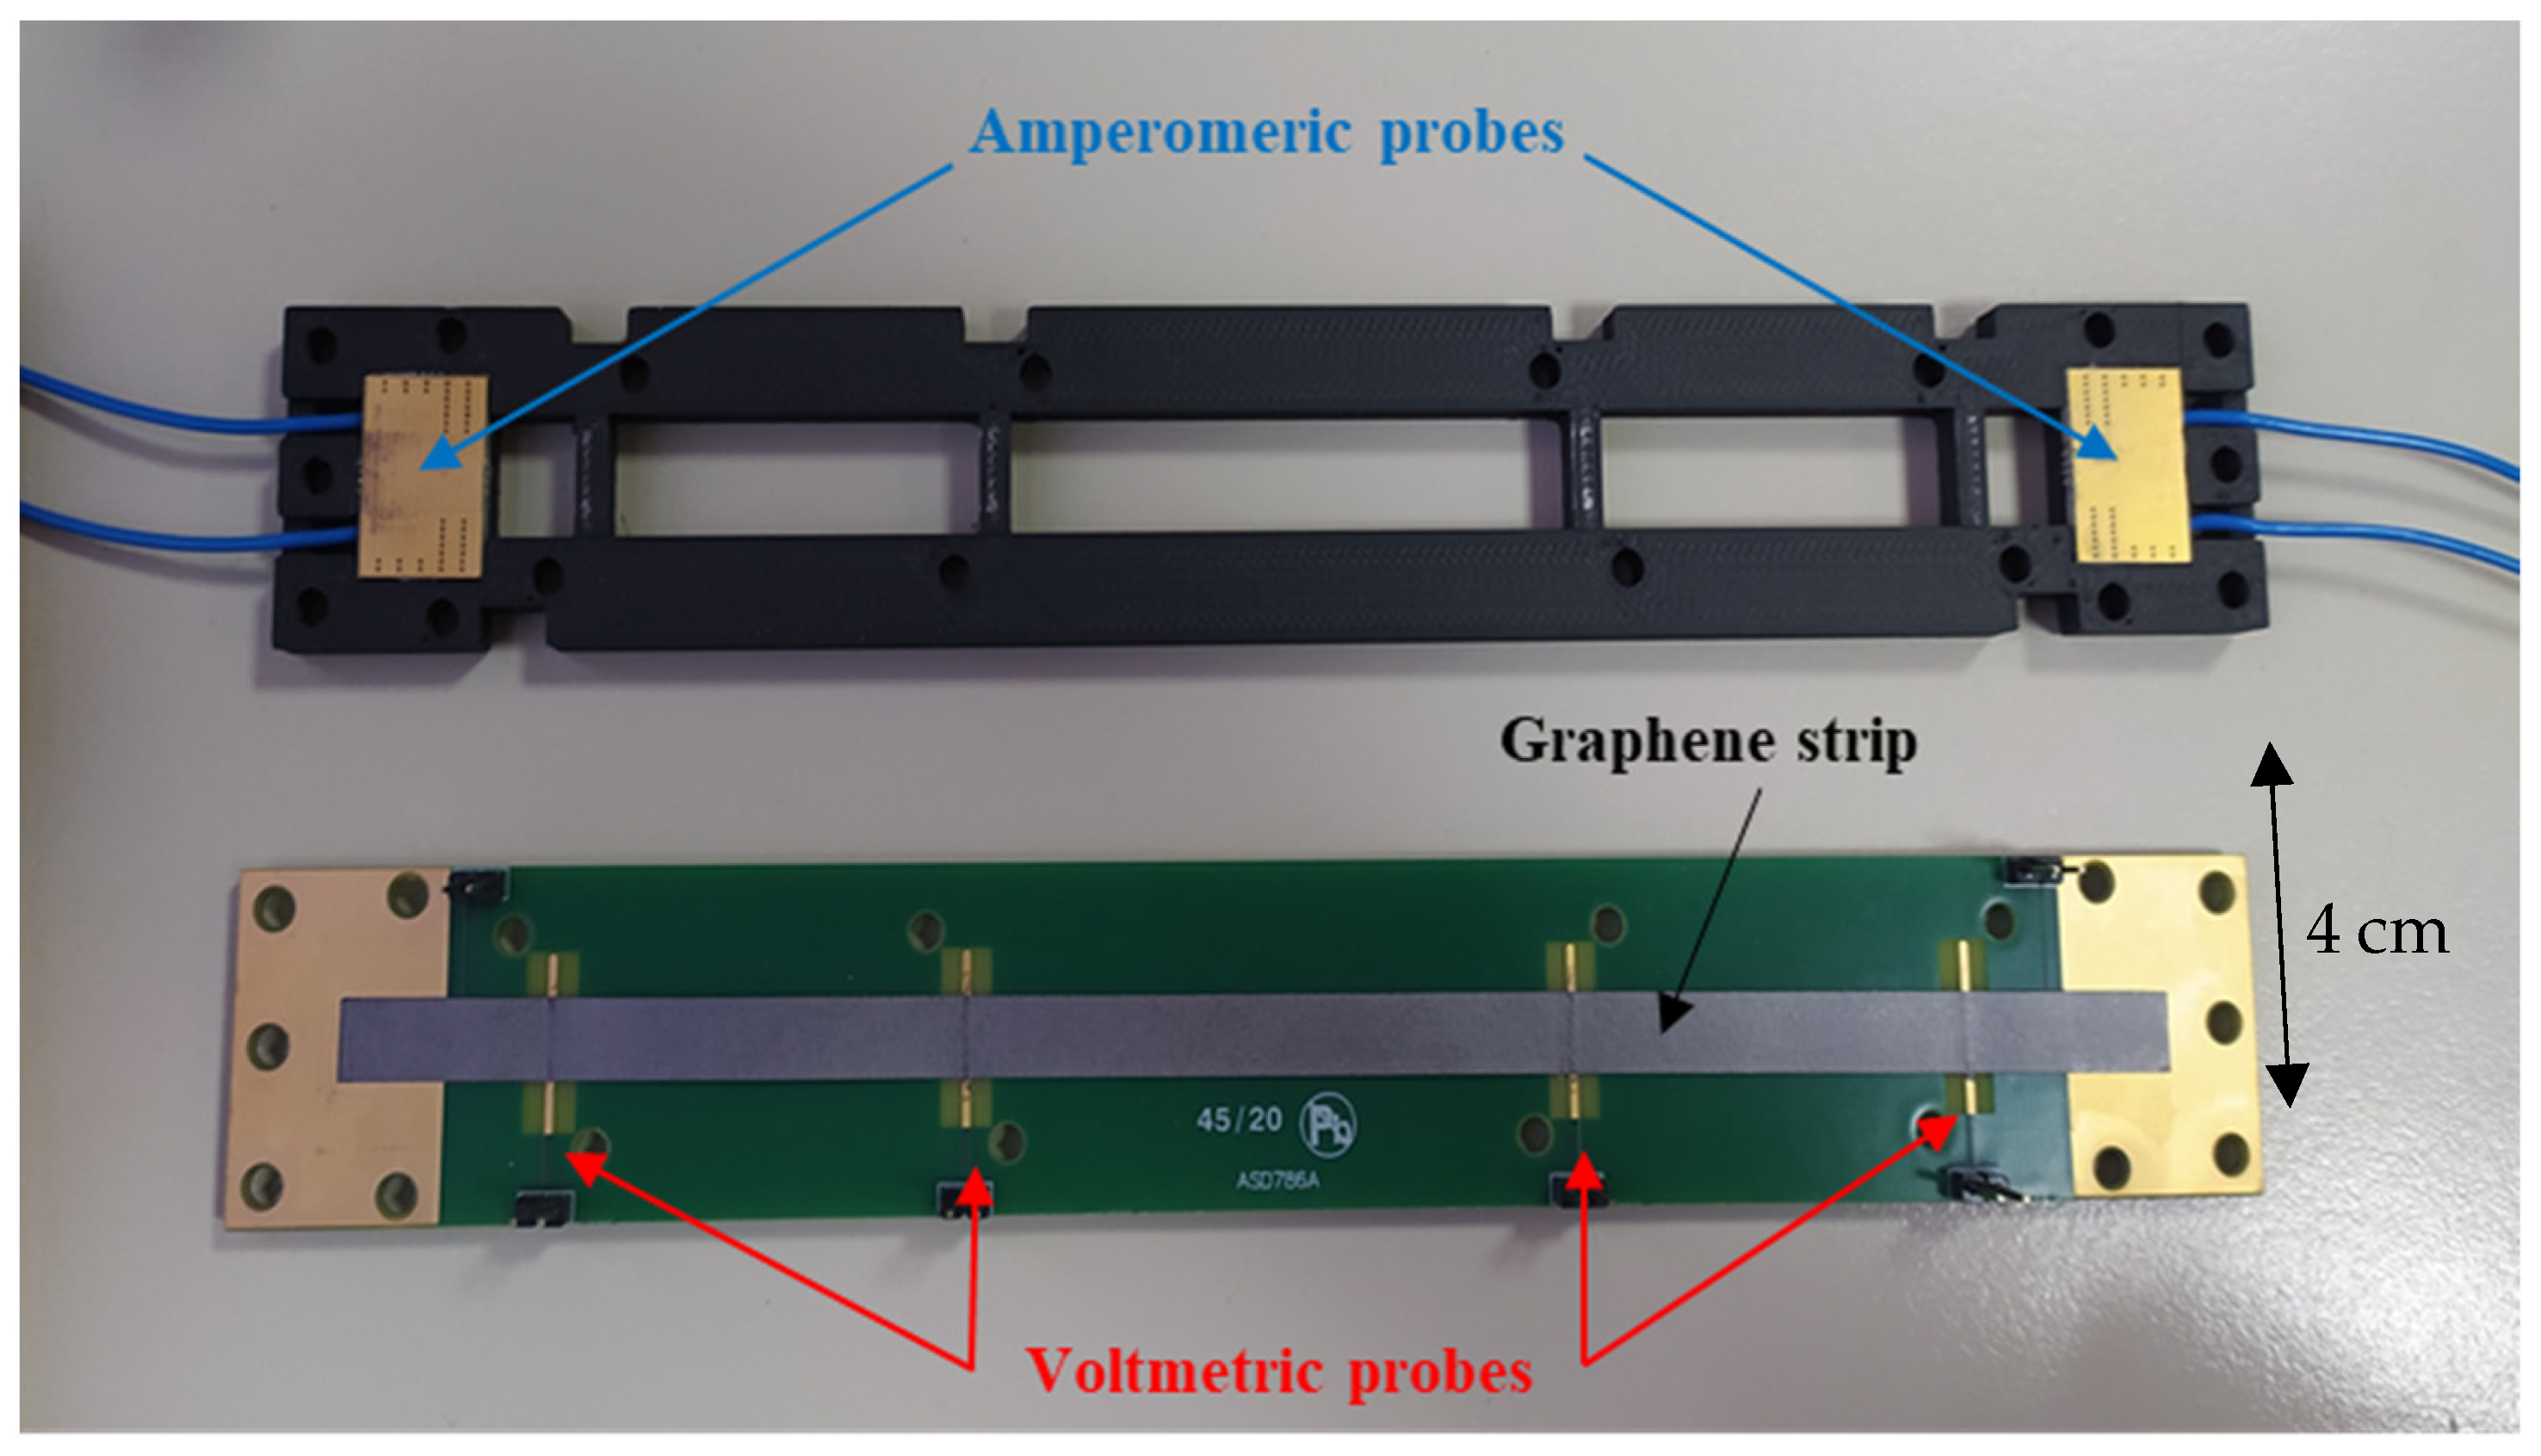
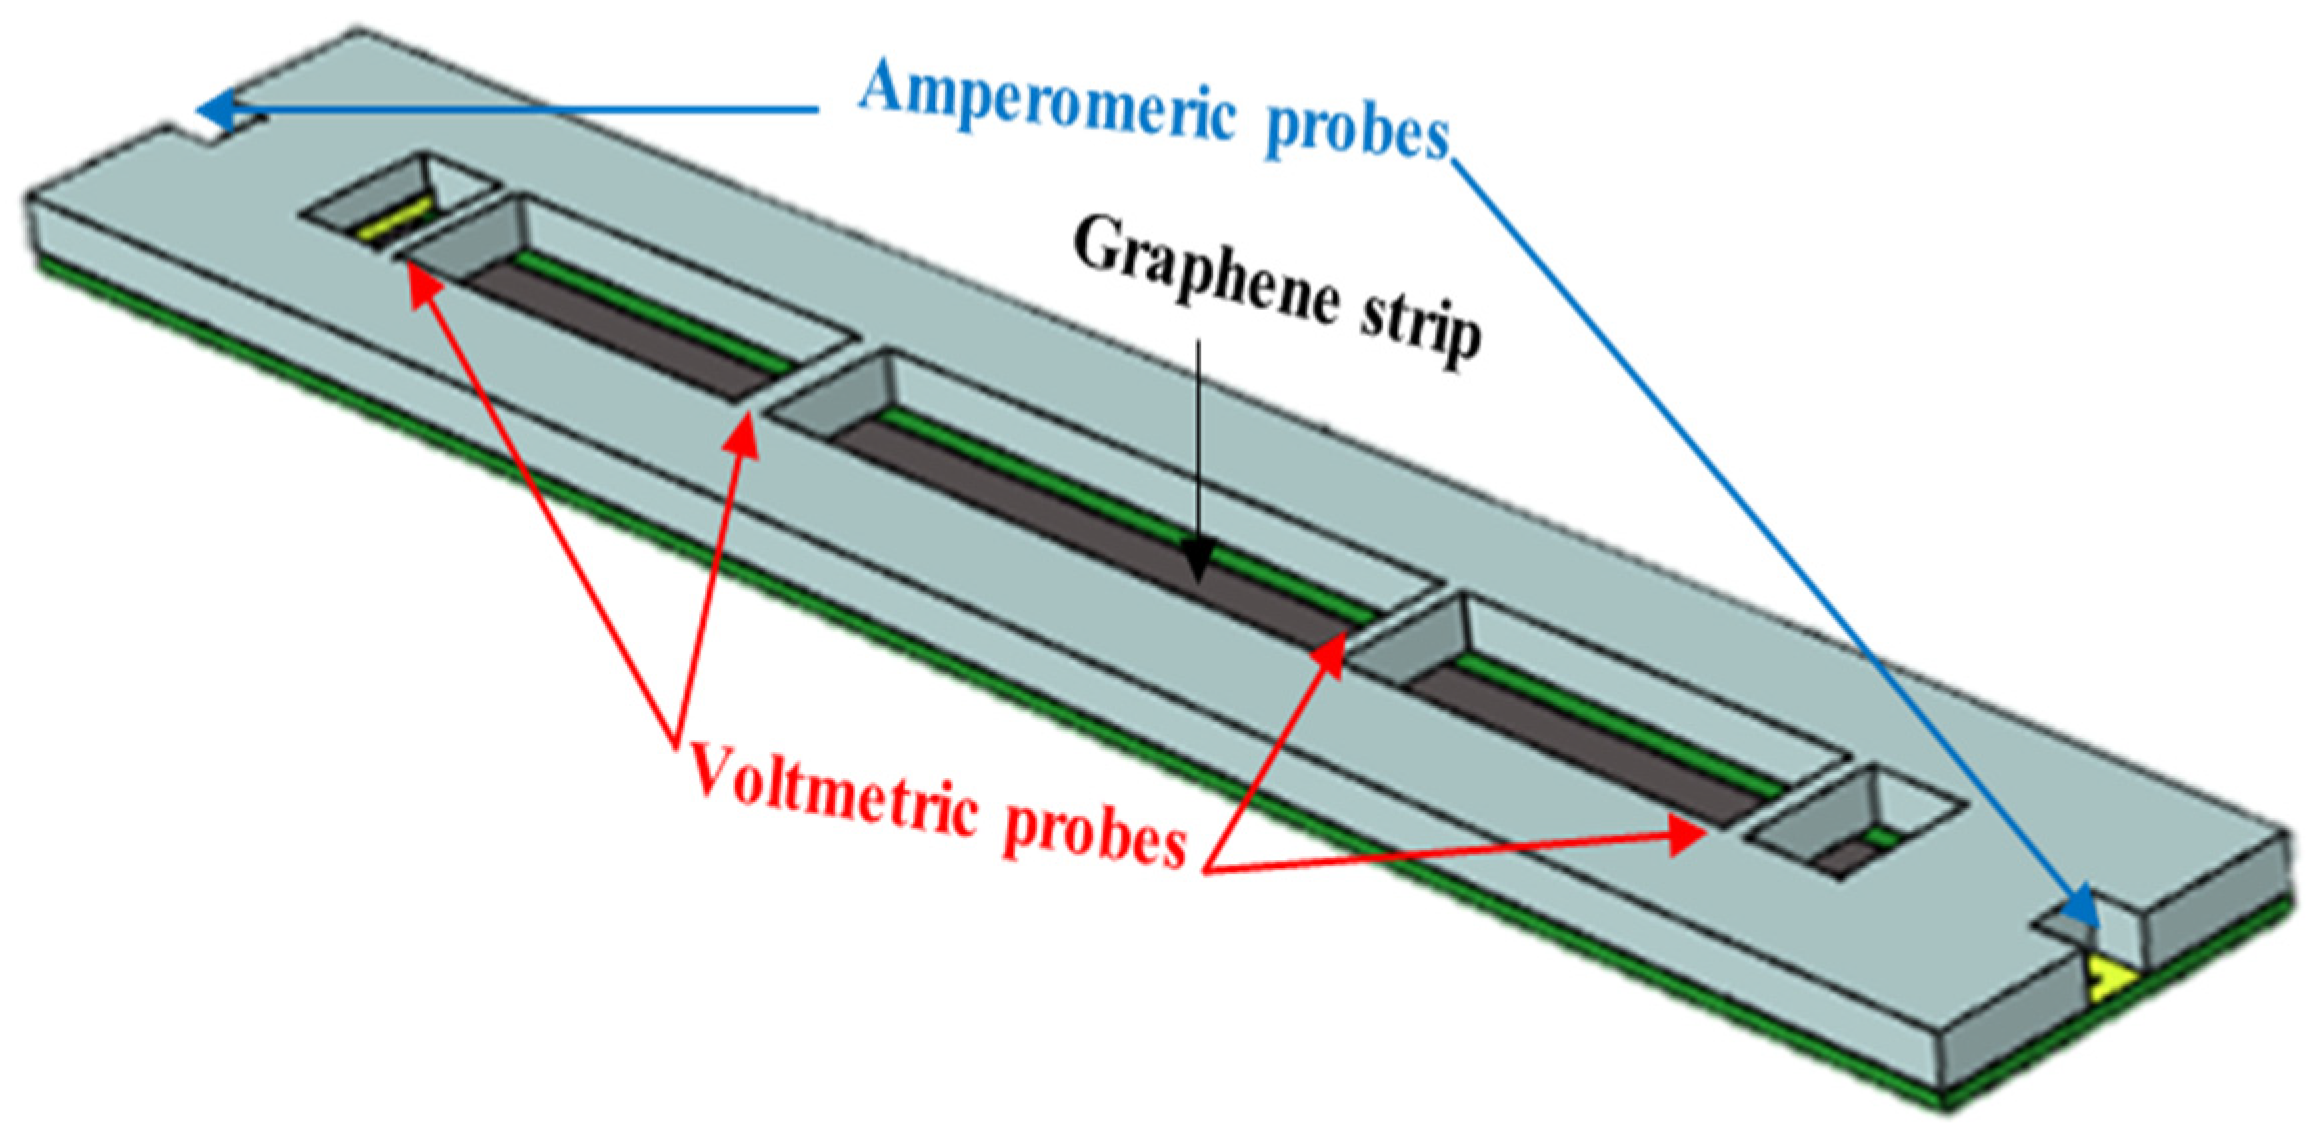
2.1. Material Fabrication and Text-Fixture for Electrical Resistivity Characterization

The heating element studied in this paper is made from graphene strips connected to external electrodes, through which a controlled flow of current is injected. In view of characterizing its electrical resistivity, these films are put into the text-fixture reported in Figure 1. The graphene film is on a dielectric substrate and on copper electrodes at its end, which are connected to the amperometric circuit. For the purpose of characterization, the text fixture is made by two parts that are connected; the top frame in Figure 1 is placed on the bottom part, so that the film ends are sandwiched between two conducting plates (electrodes). Such a frame would not be strictly needed when realizing the heater.
The films of industrial graphene analysed in this paper are strips of a lateral dimension of 1 cm, lengths between 10 and 18 cm, and thicknesses ranging from 55 to 75 µm. These films are realized by Nanesa [25], through the following industrial process:
(i)
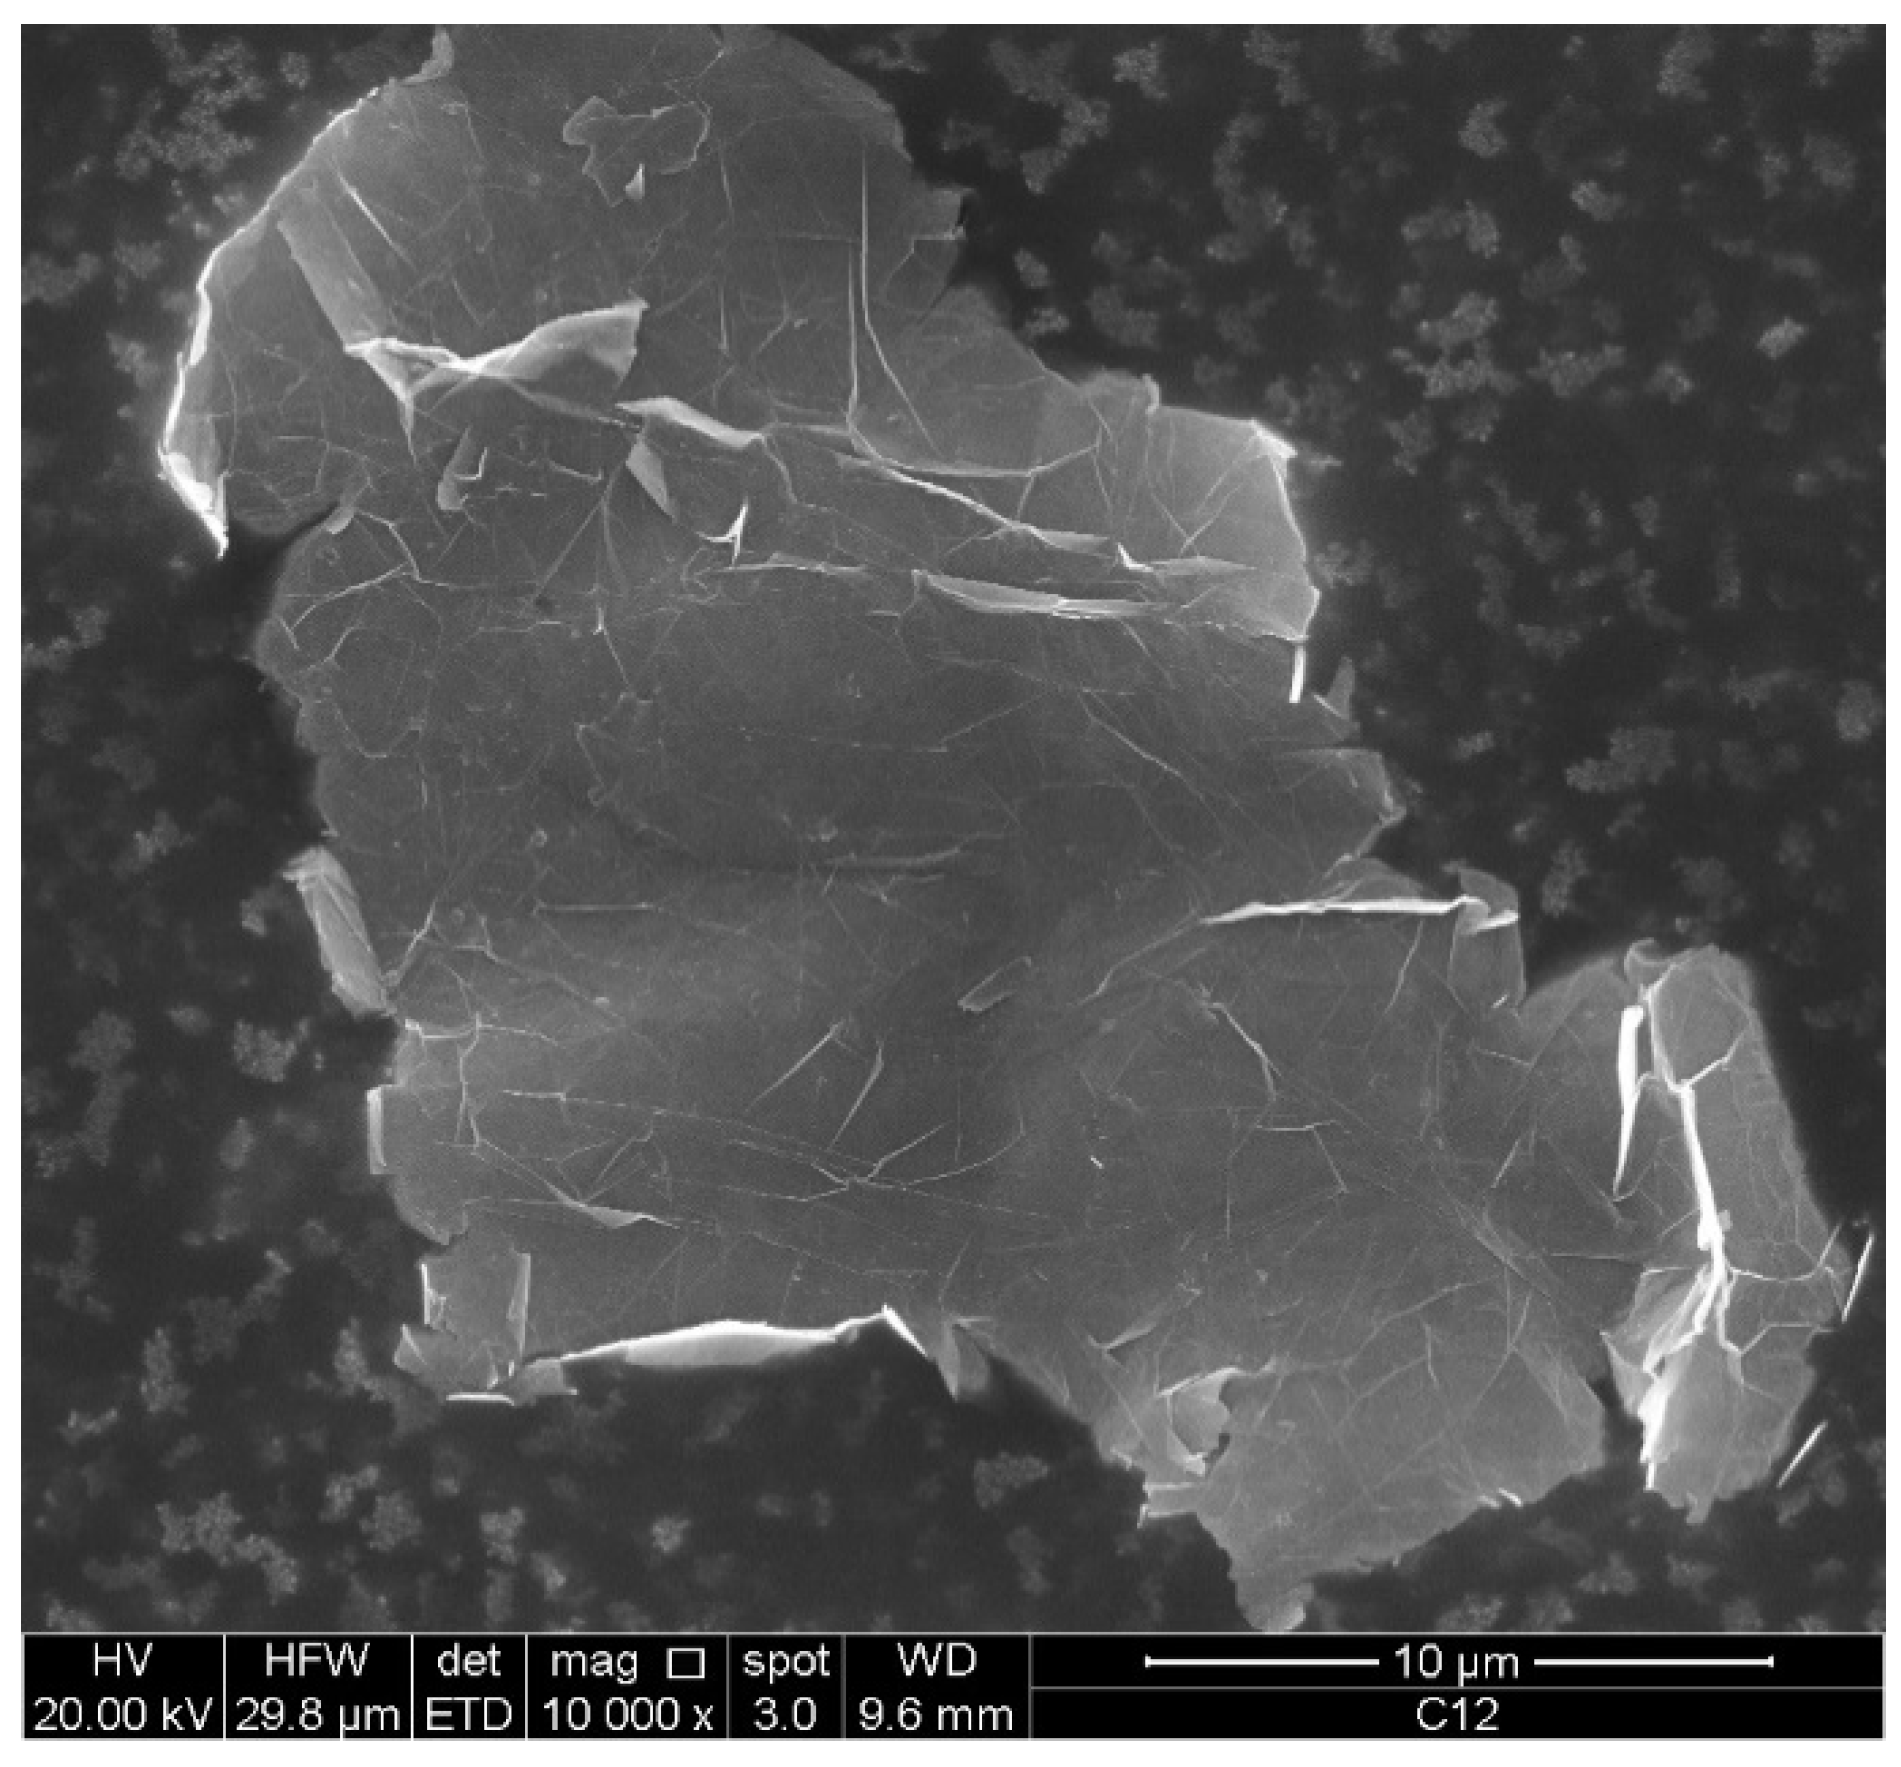
Graphene nano platelets (GNPs) are synthesized from a low-cost graphitic precursor (intercalated expandable graphite), through a process of thermal expansion followed by liquid exfoliation.
(ii)
A mixture is obtained by dispersion of GNPs in a solvent (acetone) or aqueous solution, with magnetic stirring and a final sonication phase. In case of inclusion of any polymeric binder, this is added during sonication phase. From a mechanical point of view, the binders that are found to be suitable to the purposes of this work are polyurethane (used here) or epoxy.
(iii)
the strips are then obtained by spraying the mixture at a controlled pressure, by using a semiautomatic 3-axes pantograph (Computer Numeric Control plotter EXTREMA, model Basic);
(iv)
a final step of calendering (optionally joined to annealing) is applied, to compact the strip and provide optimized thickness/alignment ratio.
It is known that size and thickness of the GNPs exert significant influence on the physical properties of the final composite material. The effect of GNP thickness has been, for instance, discussed in [26], showing that thinner GNPs are recommended for improving global mechanical and thermal performance. The impact of size/thickness aspect ratio on the electrical conduction has been, instead, analysed in [27], showing that the percolation threshold in the composite increased with increasing values of aspect ratio. Finally, in [28] the electrical conductivity of the composite was demonstrated to improve as the GNP size and surface area increased. Therefore, in order to ensure stability to the behaviour of the GNP films, it is important to assess a fabrication process that is able to control the GNP dimensions. The GNPs produced by the above-mentioned process exhibit an average particle size of 30 µm, with a standard deviation of 5µm (Figure 2), and an average thickness around 12 nm, with a standard deviation of 3 nm.
Table 1 summarizes the characteristics of the industrial graphene samples analysed in this paper.

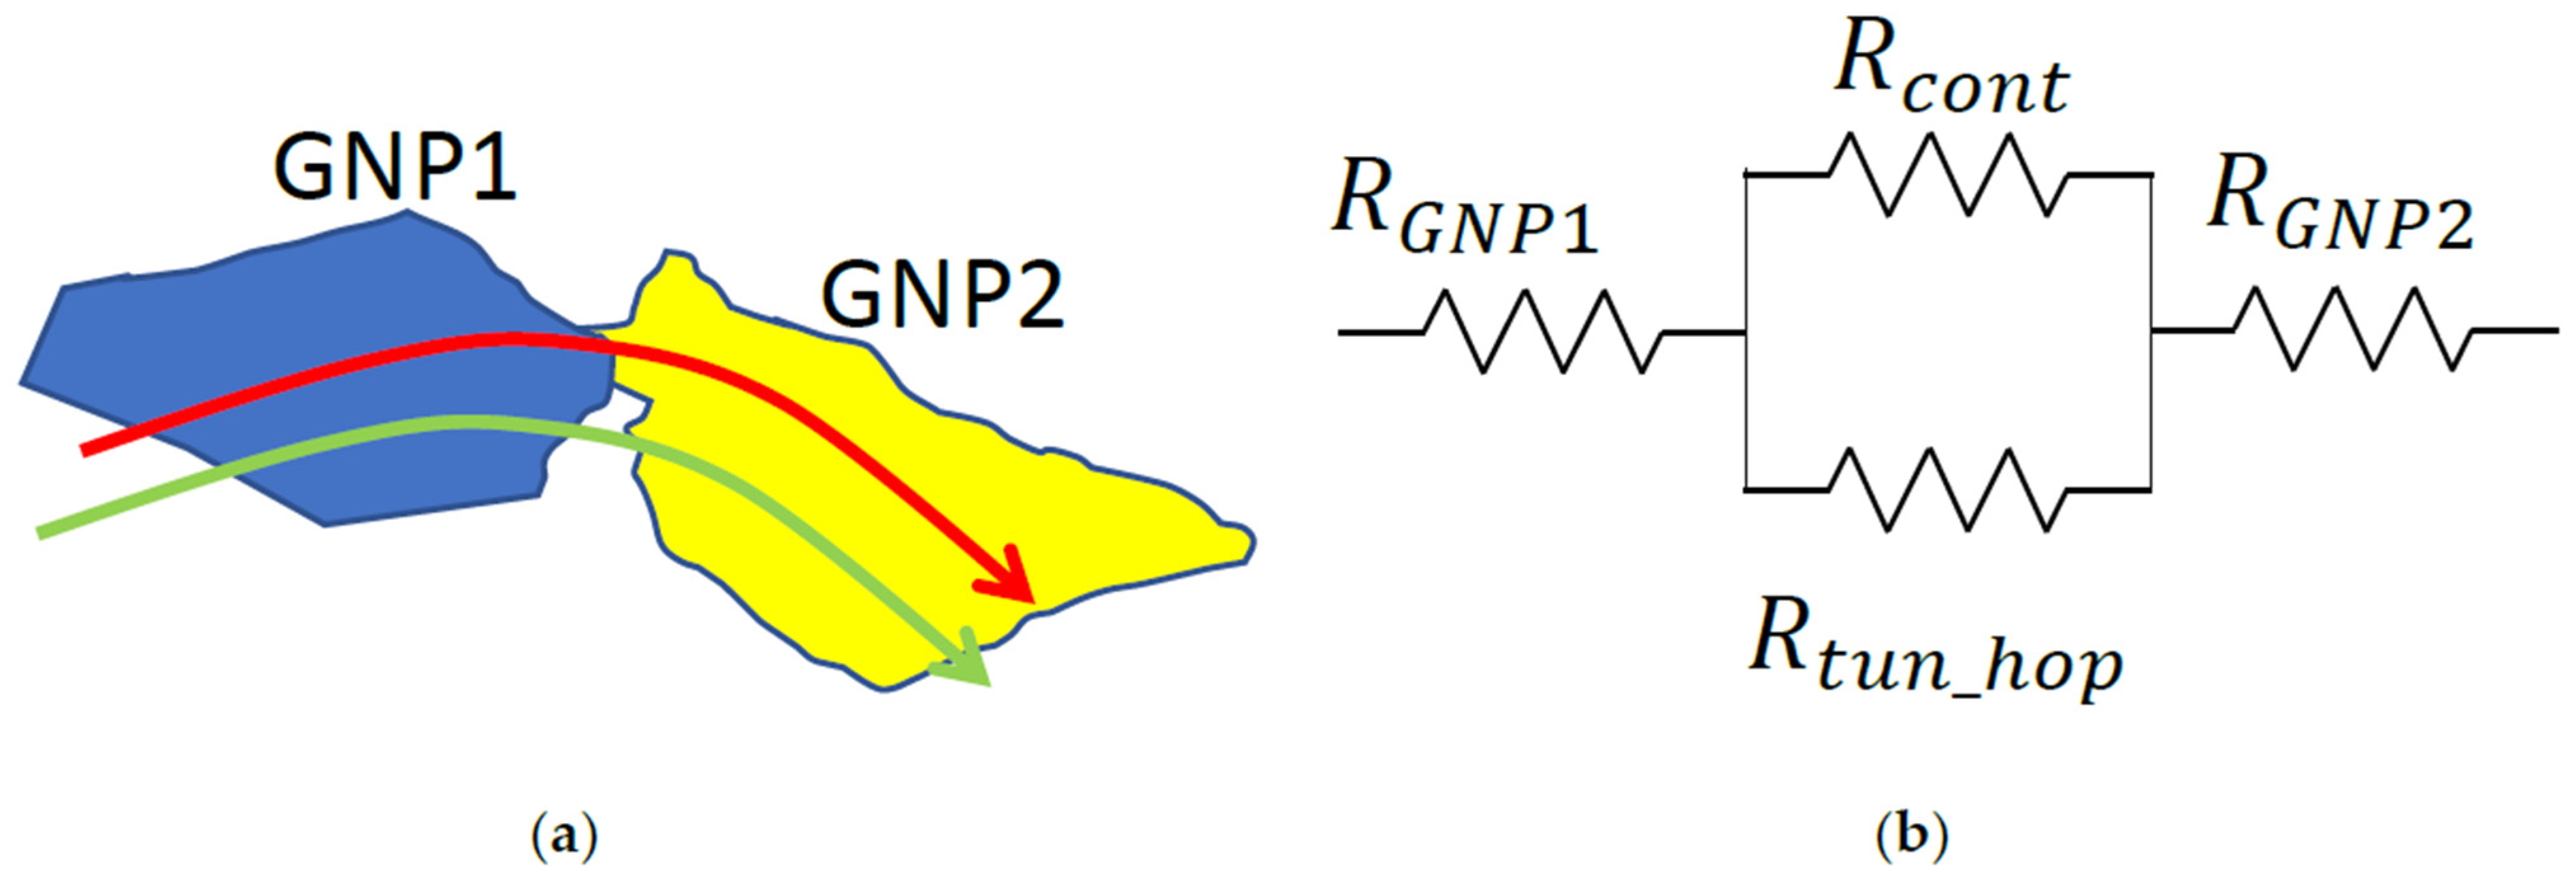
2.2. Electrical Resistivity Characterization and Modelling

A model of the electrical resistivity versus temperature was here derived, by using the results of experimental characterizations and numerical simulations. The first ones consisted in measuring the DC electrical resistance at various values of temperature, while the text-fixture was undergoing a controlled thermal cycle inside a climatic chamber. Specifically, the temperature range (40 °C, +60 °C) was investigated. As shown in Figure 1, the text-fixture was designed so that the resistance could be measured by using a 2-probe technique (when the voltage probes were placed on the amperometric electrodes) or a 4-probe one (when using the voltage electrodes). Note that the voltage probe pair can be placed at different lengths, in order to estimate and remove the effect of contact resistance, which can be an issue when dealing with carbon interconnects/conventional electrodes interfaces [29]. The experimental characterization carried out here was performed with current levels up to 10 mA, which has been verified to be too low for inducing a significant Joule heating in the considered strips and, thus, temperature can be only varied externally, by controlling the climatic chamber environmental conditions.
For each temperature value T, the measured value of the electrical resistance R m ( T ) was used to provide a first estimation of the equivalent electrical resistivity, as follows:
ρ m ( T ) = R m ( T ) · w · t L v  
being L v the distance between the voltage probe pair, and w and t the nominal width and thickness of the graphene strip. However, a more accurate estimation of such a parameter is obtained by using the numerical result of a full 3D numerical electro-thermal model implemented in COMSOL Multiphysics [30], whose CAD is reported in Figure 3.
The equivalent electrical resistivity of the strip, ρ e q ( T i ) , is among the inputs of the numerical model; hence, its evaluation follows from the solution of an inverse problem. Indeed, starting from the value (1), which is assumed as the initial guest, the numerical model is used to calculate the values of resistance obtained by letting the film resistivity vary in a suitable neighborhood of the initial guess. By indicating with R s ( ρ e q , k , T i ) the simulated resistance corresponding to the k-th value of such a range, the equivalent electrical resistivity is assigned the value minimizing the mean square error between R m and R s :
M S E ( ρ e q , n ) = k = 1 n ( R m ( T i ) R s ( ρ e q , k , T i ) ) 2
The equivalent resistivity is then recast in analytical form, by using the popular linear model that can be used in many cases also for nanoscale materials such as those derived from conventional conductors [31], and those based on graphene conductors [13,32]:
ρ e q ( T ) = ρ 0 ( 1 + α ( T T 0 ) )
being T 0 a reference temperature, ρ 0 = ρ e q at T 0 , and α the so-called temperature coefficient of the resistance (TCR).
The experiments have been carried out by using the climatic chamber ACS DY110, the DC power supply QJE QJ-3005 to impose the current, and two 6 ½ digits multimeters to read the current (Agilent 34401A, Santa Clara, CA, USA) and the voltage values (Keithley 2700, Cleveland, OH, USA).

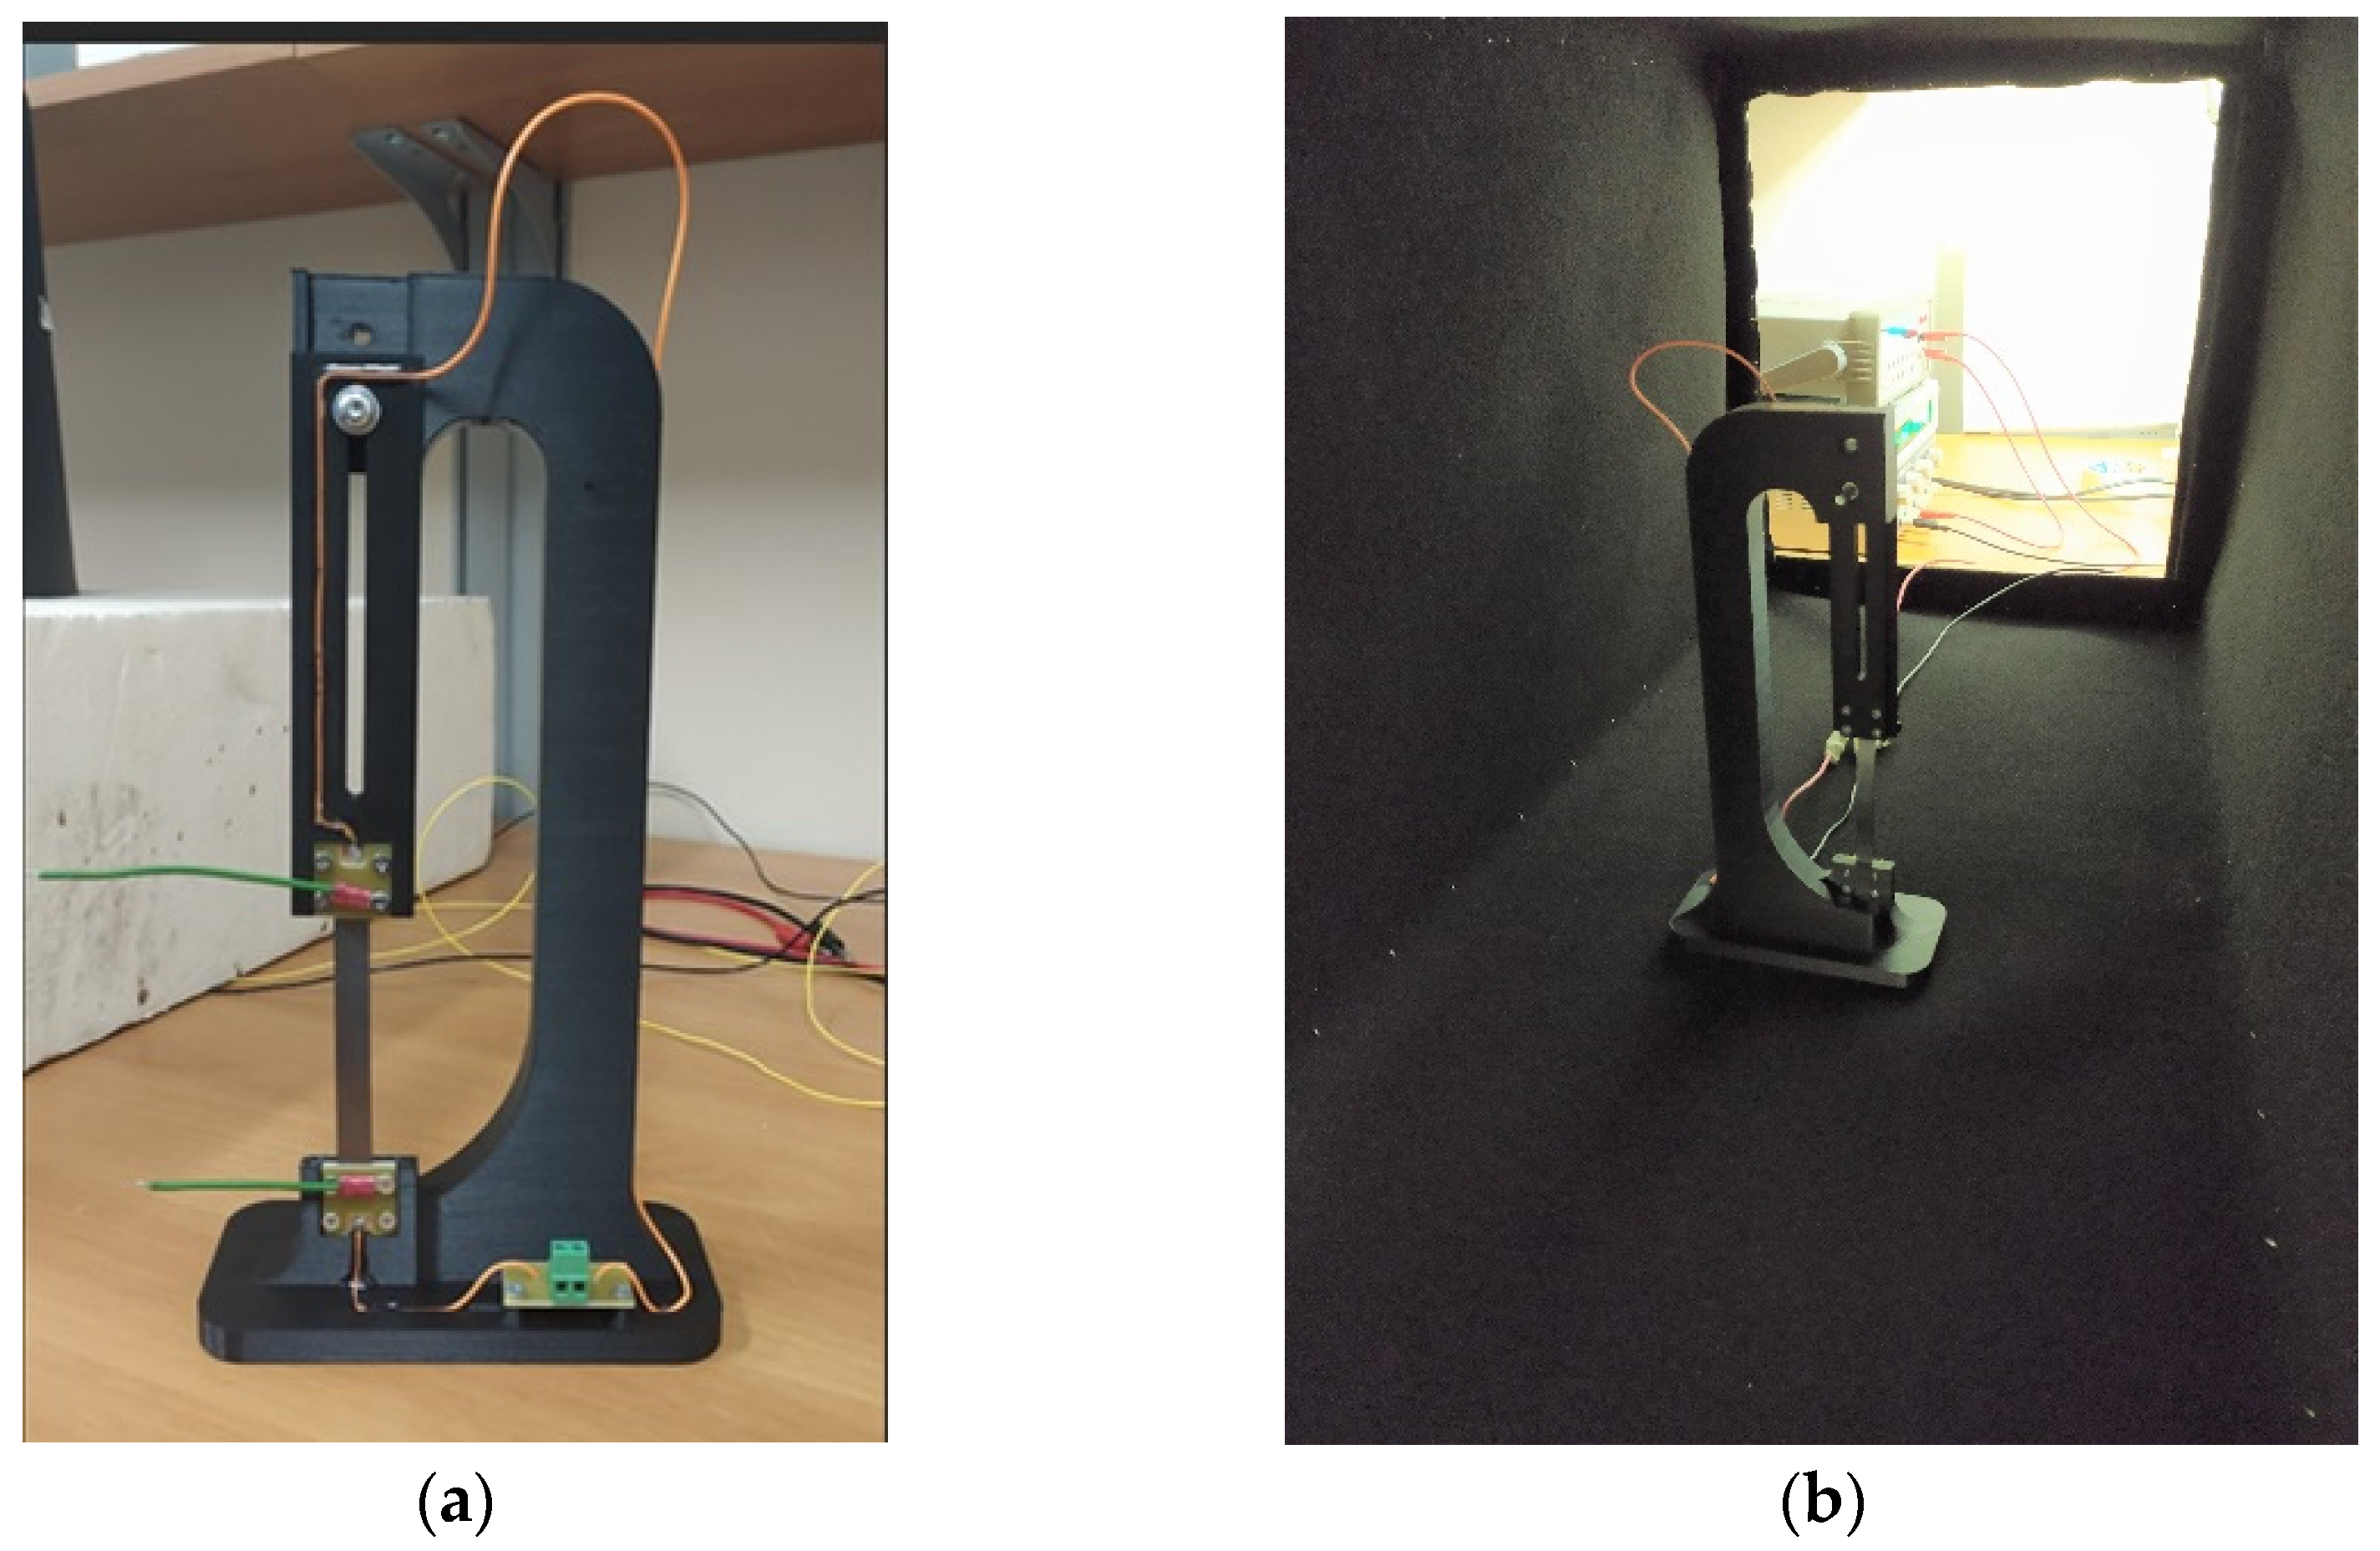
2.3. Thermal Emissivity Characterization and Modelling, Joule Heating Set-Up

The thermal emissivity parameter was here estimated starting from the experimental results obtained with the set-up to be used for demonstrating the capability of the graphene strip as a heating element. To this end, a new text-fixture has been fabricated, reported in Figure 4a, made by a plastic support to which the graphene film was vertically connected at two terminal electrodes. The support with the film was then placed inside a hollow black body (cavity), closed by a wall with a thermal InfraRed (IR) camera; see Figure 4b. This allowed us to insulate the region of the experiment from the outside environment, thus, obtaining a controlled cavity for the experiment. The temperature of the inner walls of the cavity and of the industrial graphene strip was measured not only by the IR camera, but also by two additional thermocouples, one of which was placed on the strip (contact probe) and the other on the inner walls of the cavity. In this way, it is possible to verify the temperature uniformity.
In this set-up, the graphene strip was working as a heating element, with the heat self-produced by the Joule effect. Preliminary tests have shown that the current level must be increased to at least 0.7 A in order to have a significant effect: with such a current, the steady state temperature has been found to be at least +10 °C with respect to the baseline temperature recorded at the beginning. In the following experiment, we have used a current level of 1 A.
As already pointed out, this set-up can be used to estimate the thermal emissivity: to this end, the following model is adopted for estimating such a parameter, see [33]:
ε m = ε I R T I R 4 T r 4 T G 4 T r 4
where T r , T I R , and T G are, respectively, the temperature values measured inside the cavity, by the IR camera and by the contact thermocouple on the graphene strip, whereas ε I R is the reference emissivity value set on the camera, and, finally, ε m is the measured emissivity. Note that Equation (4) came from a radiative heat transfer balance on the strip surface. An additional equation can be written by equating the heat flow between the graphene surface and the IR camera with the one between the graphene and the cavity walls:
σ . ε m A G ( T G 4 T r 4 ) = σ   ( T G 4 T c a v 4 ) 1 ε G ε G A G + 1 F G c a v A G + 1 ε c a v ε c a v A c a v
where σ = 5.67 · 10 8   W / m 2   K 4 is the Stefan–Boltzmann constant, T c a v is the temperature of the cavity walls measured by the second thermocouple, ε c a v is the emissivity of the material adopted for the cavity walls (in our case, ε c a v = 0.98 ), A G and A c a v are the surface areas of the graphene strip and the cavity inner wall facing the strip, and, finally, F G c a v is the view factor between the graphene strip surface and the cavity, which can be here assumed to be 1. The solution of the equation system (4) and (5) provide the values of T r and of the emissivity ε m .
From the practical point of view, the method proceeds as follows: the strip is fed by a controlled current of 1A, which starts producing heat by the Joule effect, until the steady-state condition is reached. At that time, all the temperature values in (4) are measured and a thermal image of the strip is taken by the IR camera (see, for instance, Section 3). The emissivity is identified through an iterative process of minimization of the difference between the temperature values T I R , and T G . Indeed, T I R can be changed by changing the reference value ε I R , that in turns controls the estimated radiative heat flow coming from the strip surface.
The same set-up is used to study the Joule heating effect and so the characteristics of the graphene heater. To this end, currents of the same order of magnitude are used (about 1 A) and the thermocamera is used to provide the meaurement of the spatial distribution of the remperature over the whole text-fixture, both during the thermal transient and at the finale steady-state condition. This fixed current level of 1 A corresponds to a variable value of the electrical power, as the equivalent resistance of the strip varies as an effect of temperature rise. In the experiment carried out here and described in the next Section, the baseline temperature was T = 26.8 °C (see Section 3.2): the electrical power adsorbed at such a temperature was 1.05 W.
In these experiments, a Fluke Ti480 PRO thermocamera has been used, together with 3 calibrated K-type thermocouples. The current is provided by the DC power supply QJE QJ-3005, and monitored by a multimeter Agilent 34401A.

3. Results and Discussion

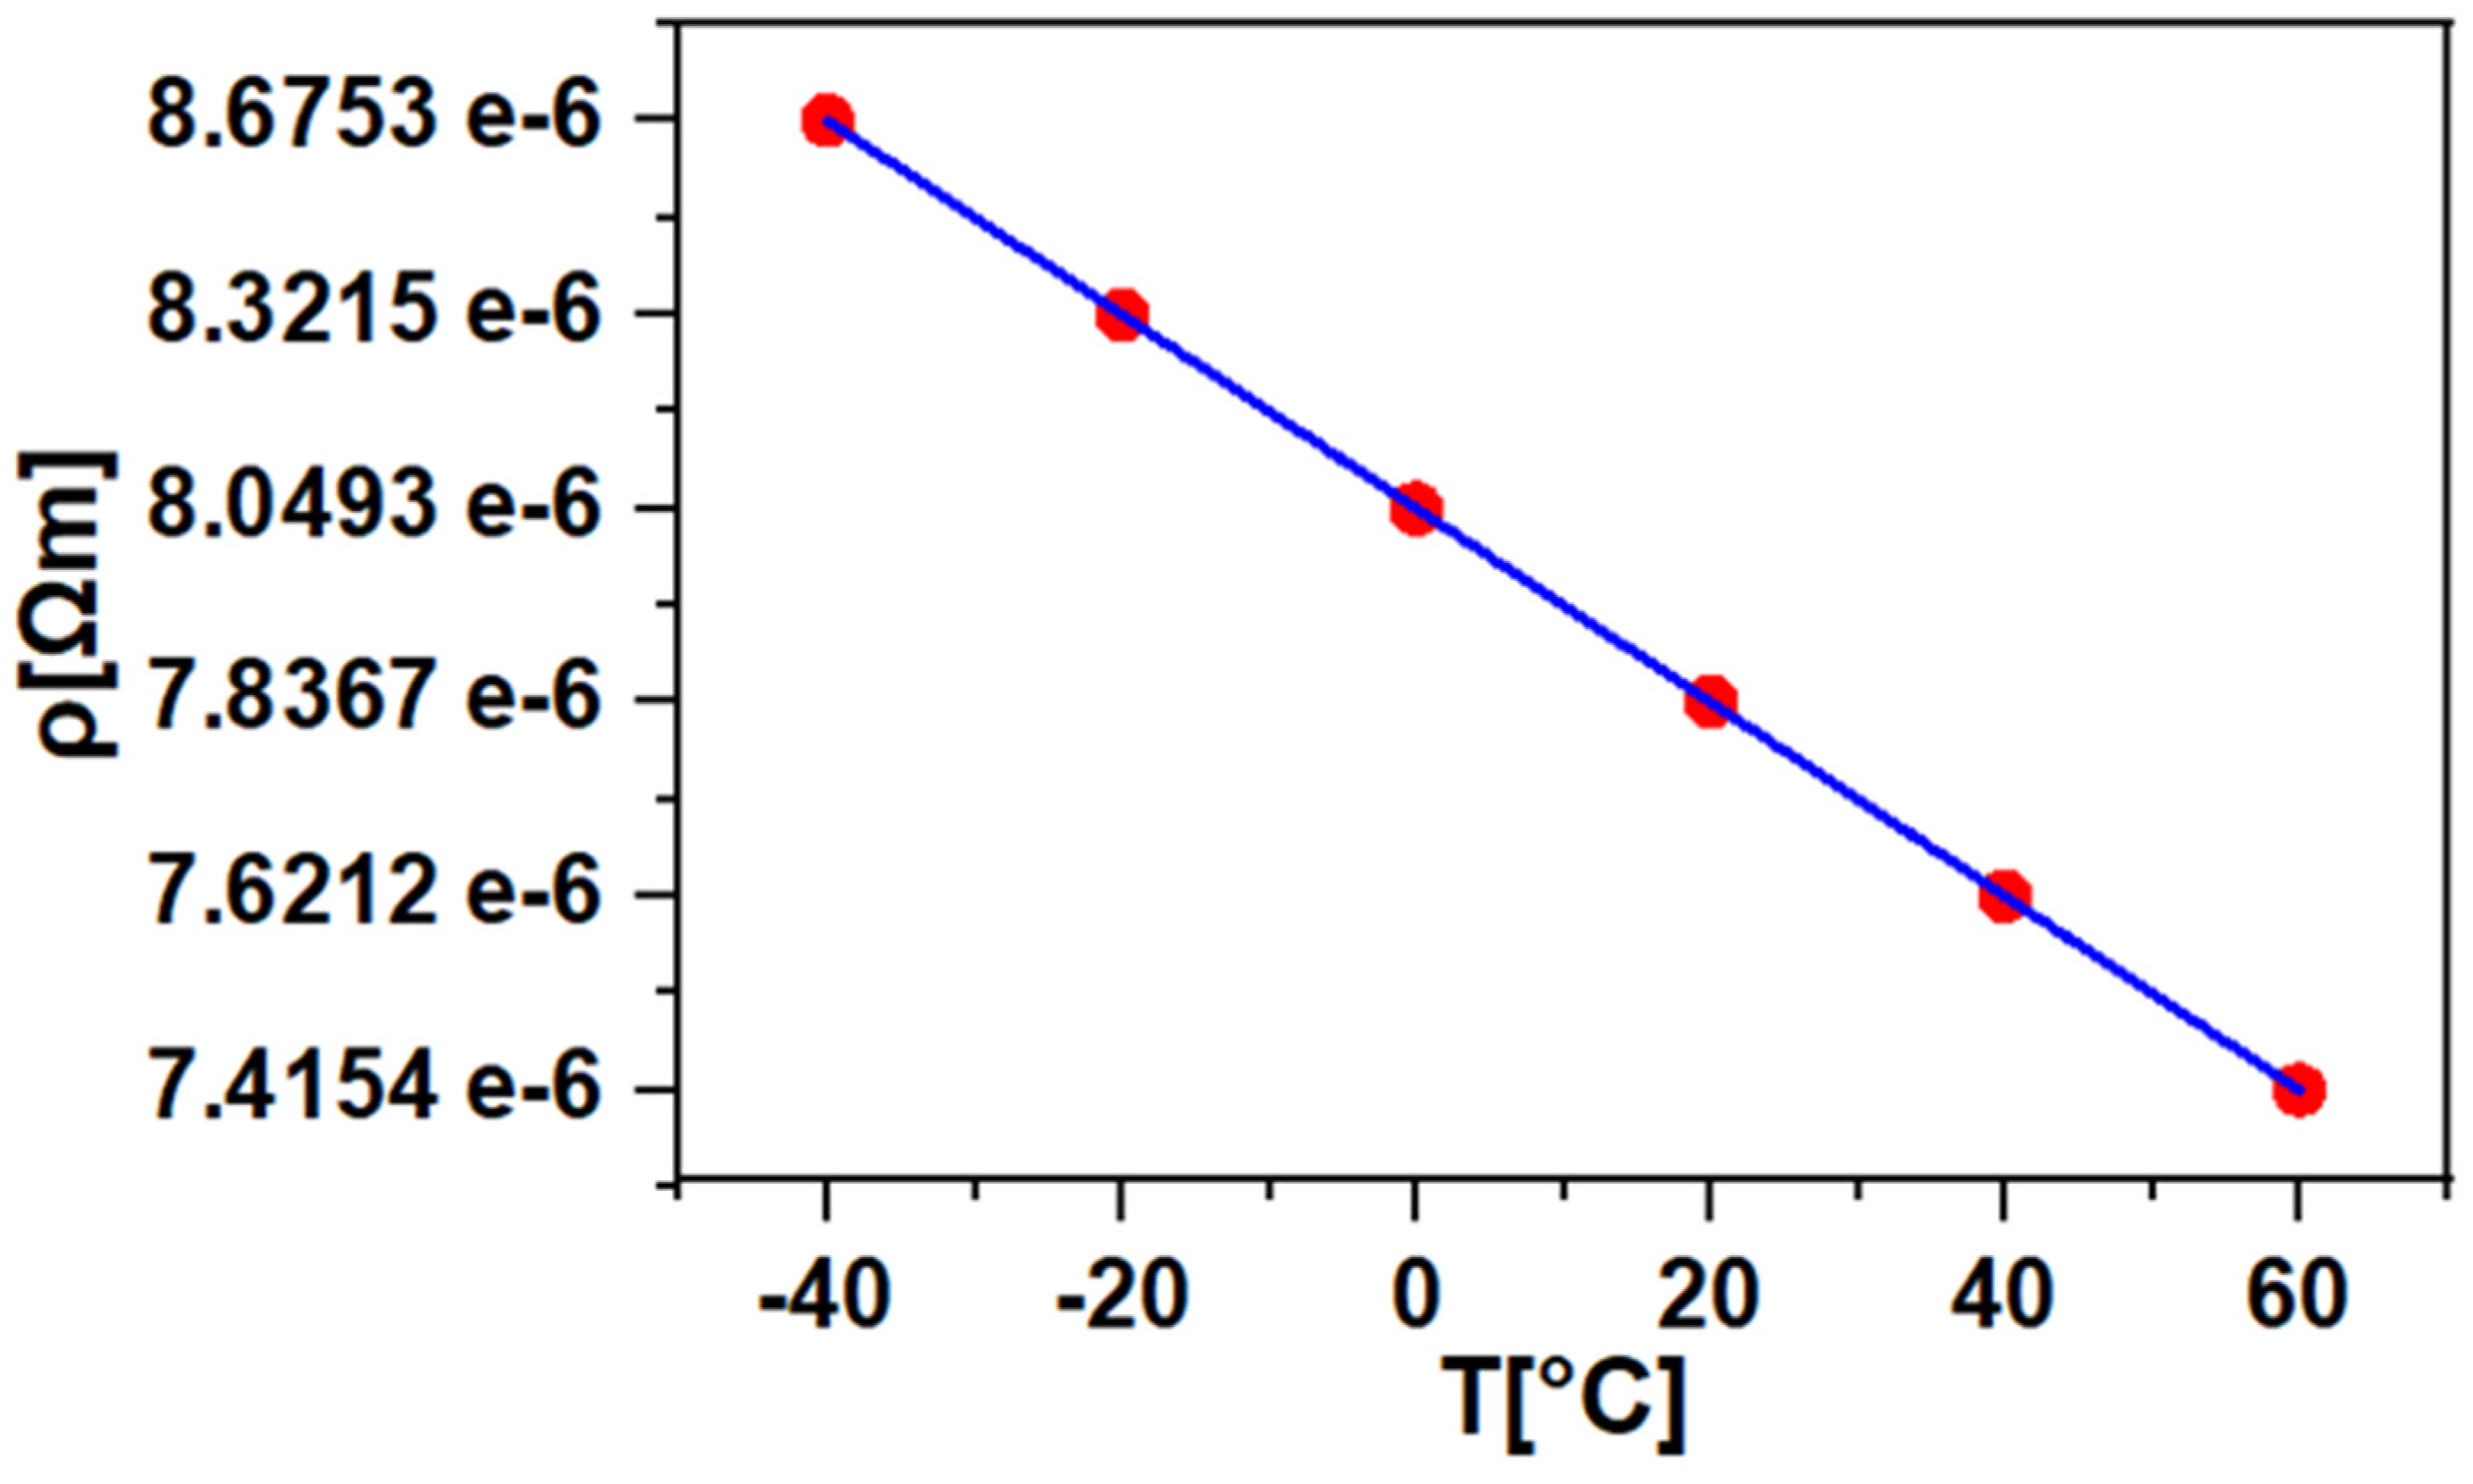
3.1. Electrical Resistivity Evaluation

The set-up and methods described in Section 2.2 have been used to retrieve the equivalent electrical resistivity of the three kinds of graphene strips under investigation (as listed in Table 1).
A preliminary characterization has been carried out to demonstrate the linearity of the V-I characteristic in the considered range of current values (up to 1 A). The parasitic effects of the setup, including any contact resistance, have been successfully removed by following the same as done in [22], namely by means of a proper preliminary calibration and by using the 4-probe technique.
For the G-paper strip, Figure 5 shows the equivalent electrical resistivity vs. temperature, obtained by using the methods described in Section 2.2. Here, the red dots are the values identified by the optimization of the numerical solution, whereas the blue line is the result of a linear fitting of such values, according to (3). The fitting coefficients are reported in Table 2, along with an estimation of the uncertainty.
Indeed, as already announced, a linear fitting matches the behavior of the resistivity of such materials very well. This result is in good agreement with that found in [22,23], despite the different dimensions of the strips (especially the reduced variability of the thickness), which demonstrates the robustness of the result. A similar behavior has been found for the other two materials, whose results are listed in Table 2. For the composite mixtures G-Preg, the results are slightly different from those reported in [22,23], since a different annealing has been used here.
An assessment of the result has been carried out here by checking its sensitivity to the strip length, and specifically to L v , the distance between the voltage probe pair (see Figure 1). The result of such an assessment is reported in Table 3, with reference to a strip of G-preg 95/5 of surface dimensions 11 × 180 mm, at T = 20 °C. As it can been seen from the results, the proposed method provides a resistivity value that is independent from the strip length, with an error that is about 2% at maximum, for shorter lengths (for which it is expected that the contact resistance may start having a role).
The results of the electro-thermal characterization of the electrical resistivity confirm what has been already found in the previous papers of [22,23]: these graphene films behave as negative temperature coefficient (NTC) materials. This nice and desirable behavior can be extremely useful in easing the control of the final heater system, since it helps stability, as, for instance, pointed out in applications such thermoelectrical sensors [34].
Note that the electrical performance of the industrial graphene is far from those exhibited by conventional conductors such as copper, see Table 2. However, although the resistivity is much higher, one of the main reasons for proposing graphene instead of copper is the possibility of reducing the weight, which is a crucial constraint in aeronautical applications. Indeed, copper density is about 9 g/cm3, whereas that for the strips analysed here is in the range 0.0020–0.045 g/cm3. Therefore, given the same dimensions, a copper strip weight will be about 2100 or 2500 times larger than the graphene strips.
To gain more insight into this phenomenon, we propose here a simple model that can be represented as in Figure 6.
The electrical conduction between two adjacent GNPs in the strip may be modelled as the series of the conduction phenomena in the single GNPs (corresponding to the resistances R G N P in Figure 6b, and the phenomena at interface, which, in turn, can be associated to the contact and to tunneling and hopping mechanisms. The first is schematically represented as the red path in Figure 6a, corresponding to the resistor R c o n t in Figure 6b, whereas the second is described by the green path in Figure 6a, corresponding to R c o n t in Figure 6b.
The equivalent resistance R G N P , that can be approximately modeled as the resistance of a graphene ribbon [29,35]:
R G N P ( T ) = r 0 l m f p ( T ) M ( T ) l e n G N P
where r 0 is a constant value related to the quantum resistance, l m f p ( T ) is the mean free path, M ( T ) is the equivalent number of conducting channels [36], and l e n G N P is the average length of the GNP. As pointed out in [36,37], these parameters display different behavior with respect to the temperature: l m f p decreases as T 2 , whereas M increases linearly with T . The interface resistances can be modelled as [37]
R c o n t ( T ) = r 0 + R P ( T ) M ( T )   ,
with R P ( T ) linearly increasing with T, whereas the tunneling and hopping term can be demonstrated to depend on T as it follows, see [38]:
R t u n _ h o p ( T ) = K T 4   ,
where K is a quantum term not depending on T.
By analyzing the expressions (6)–(8) and the dependence of their parameters from temperature, it is easy to realize that there can be operating conditions for which the counteracting behavior of these parameters may lead the equivalent resistance of the circuit in Figure 6b to become a decreasing function of the temperature.

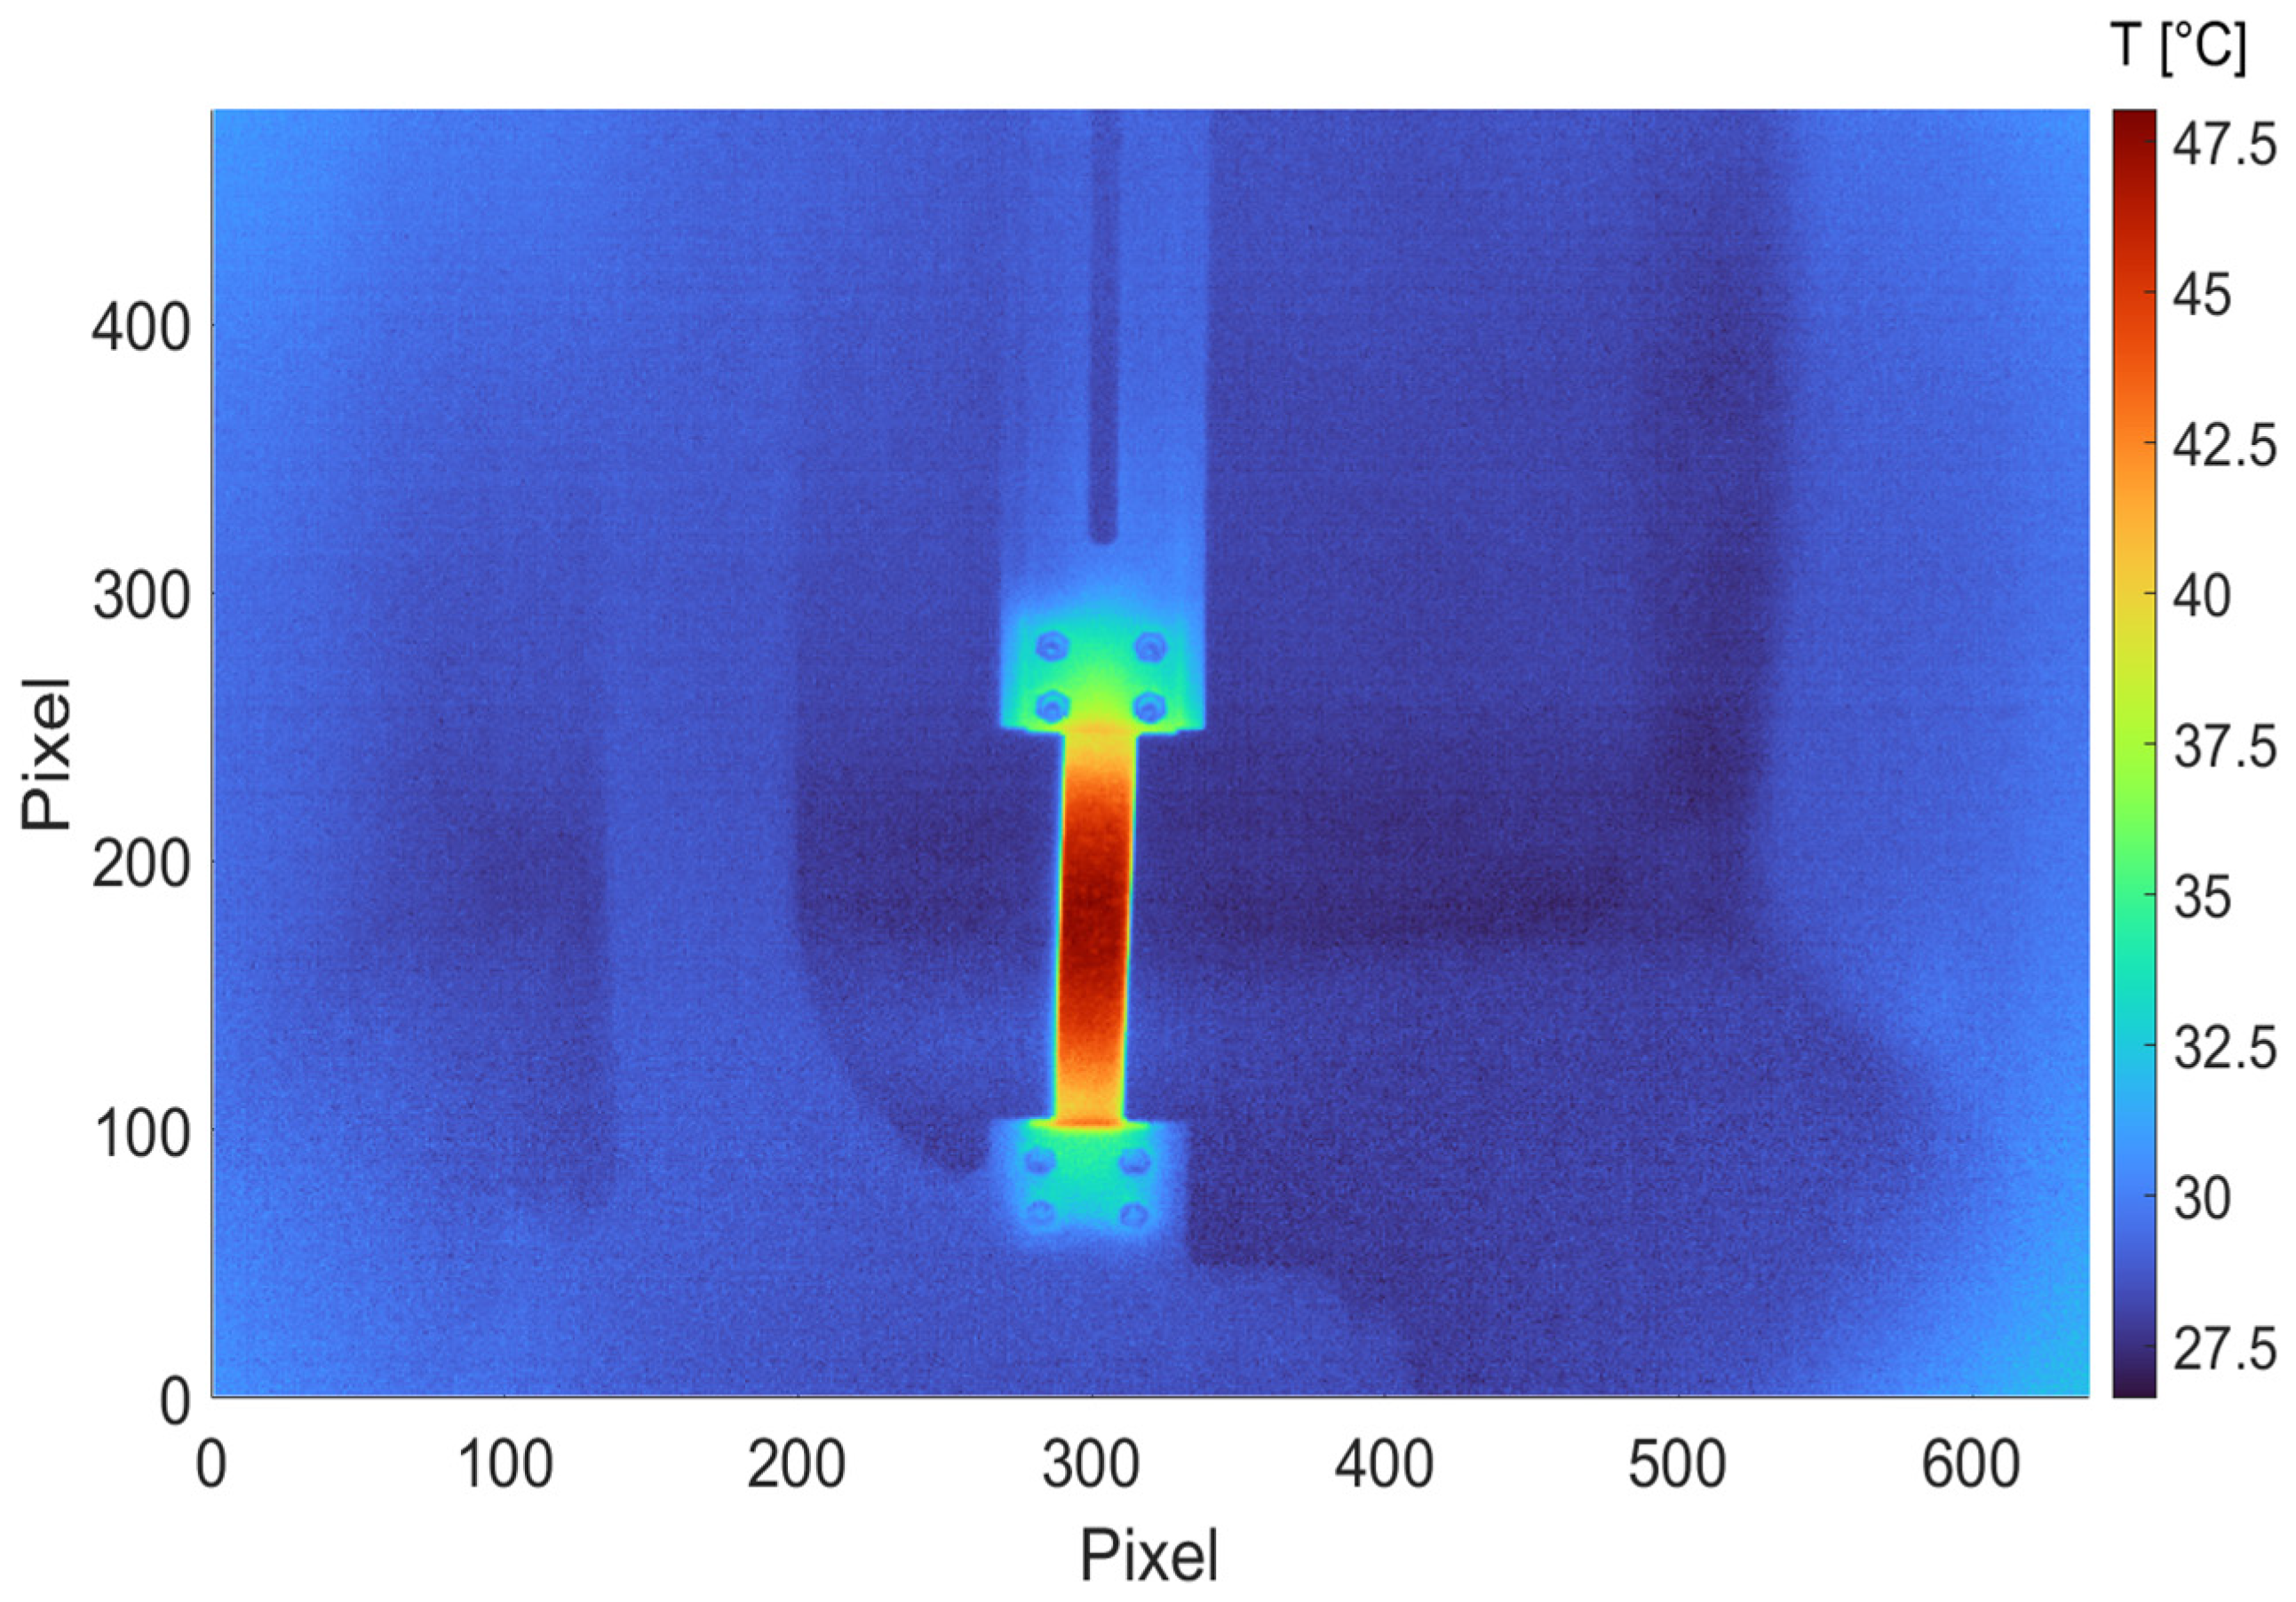
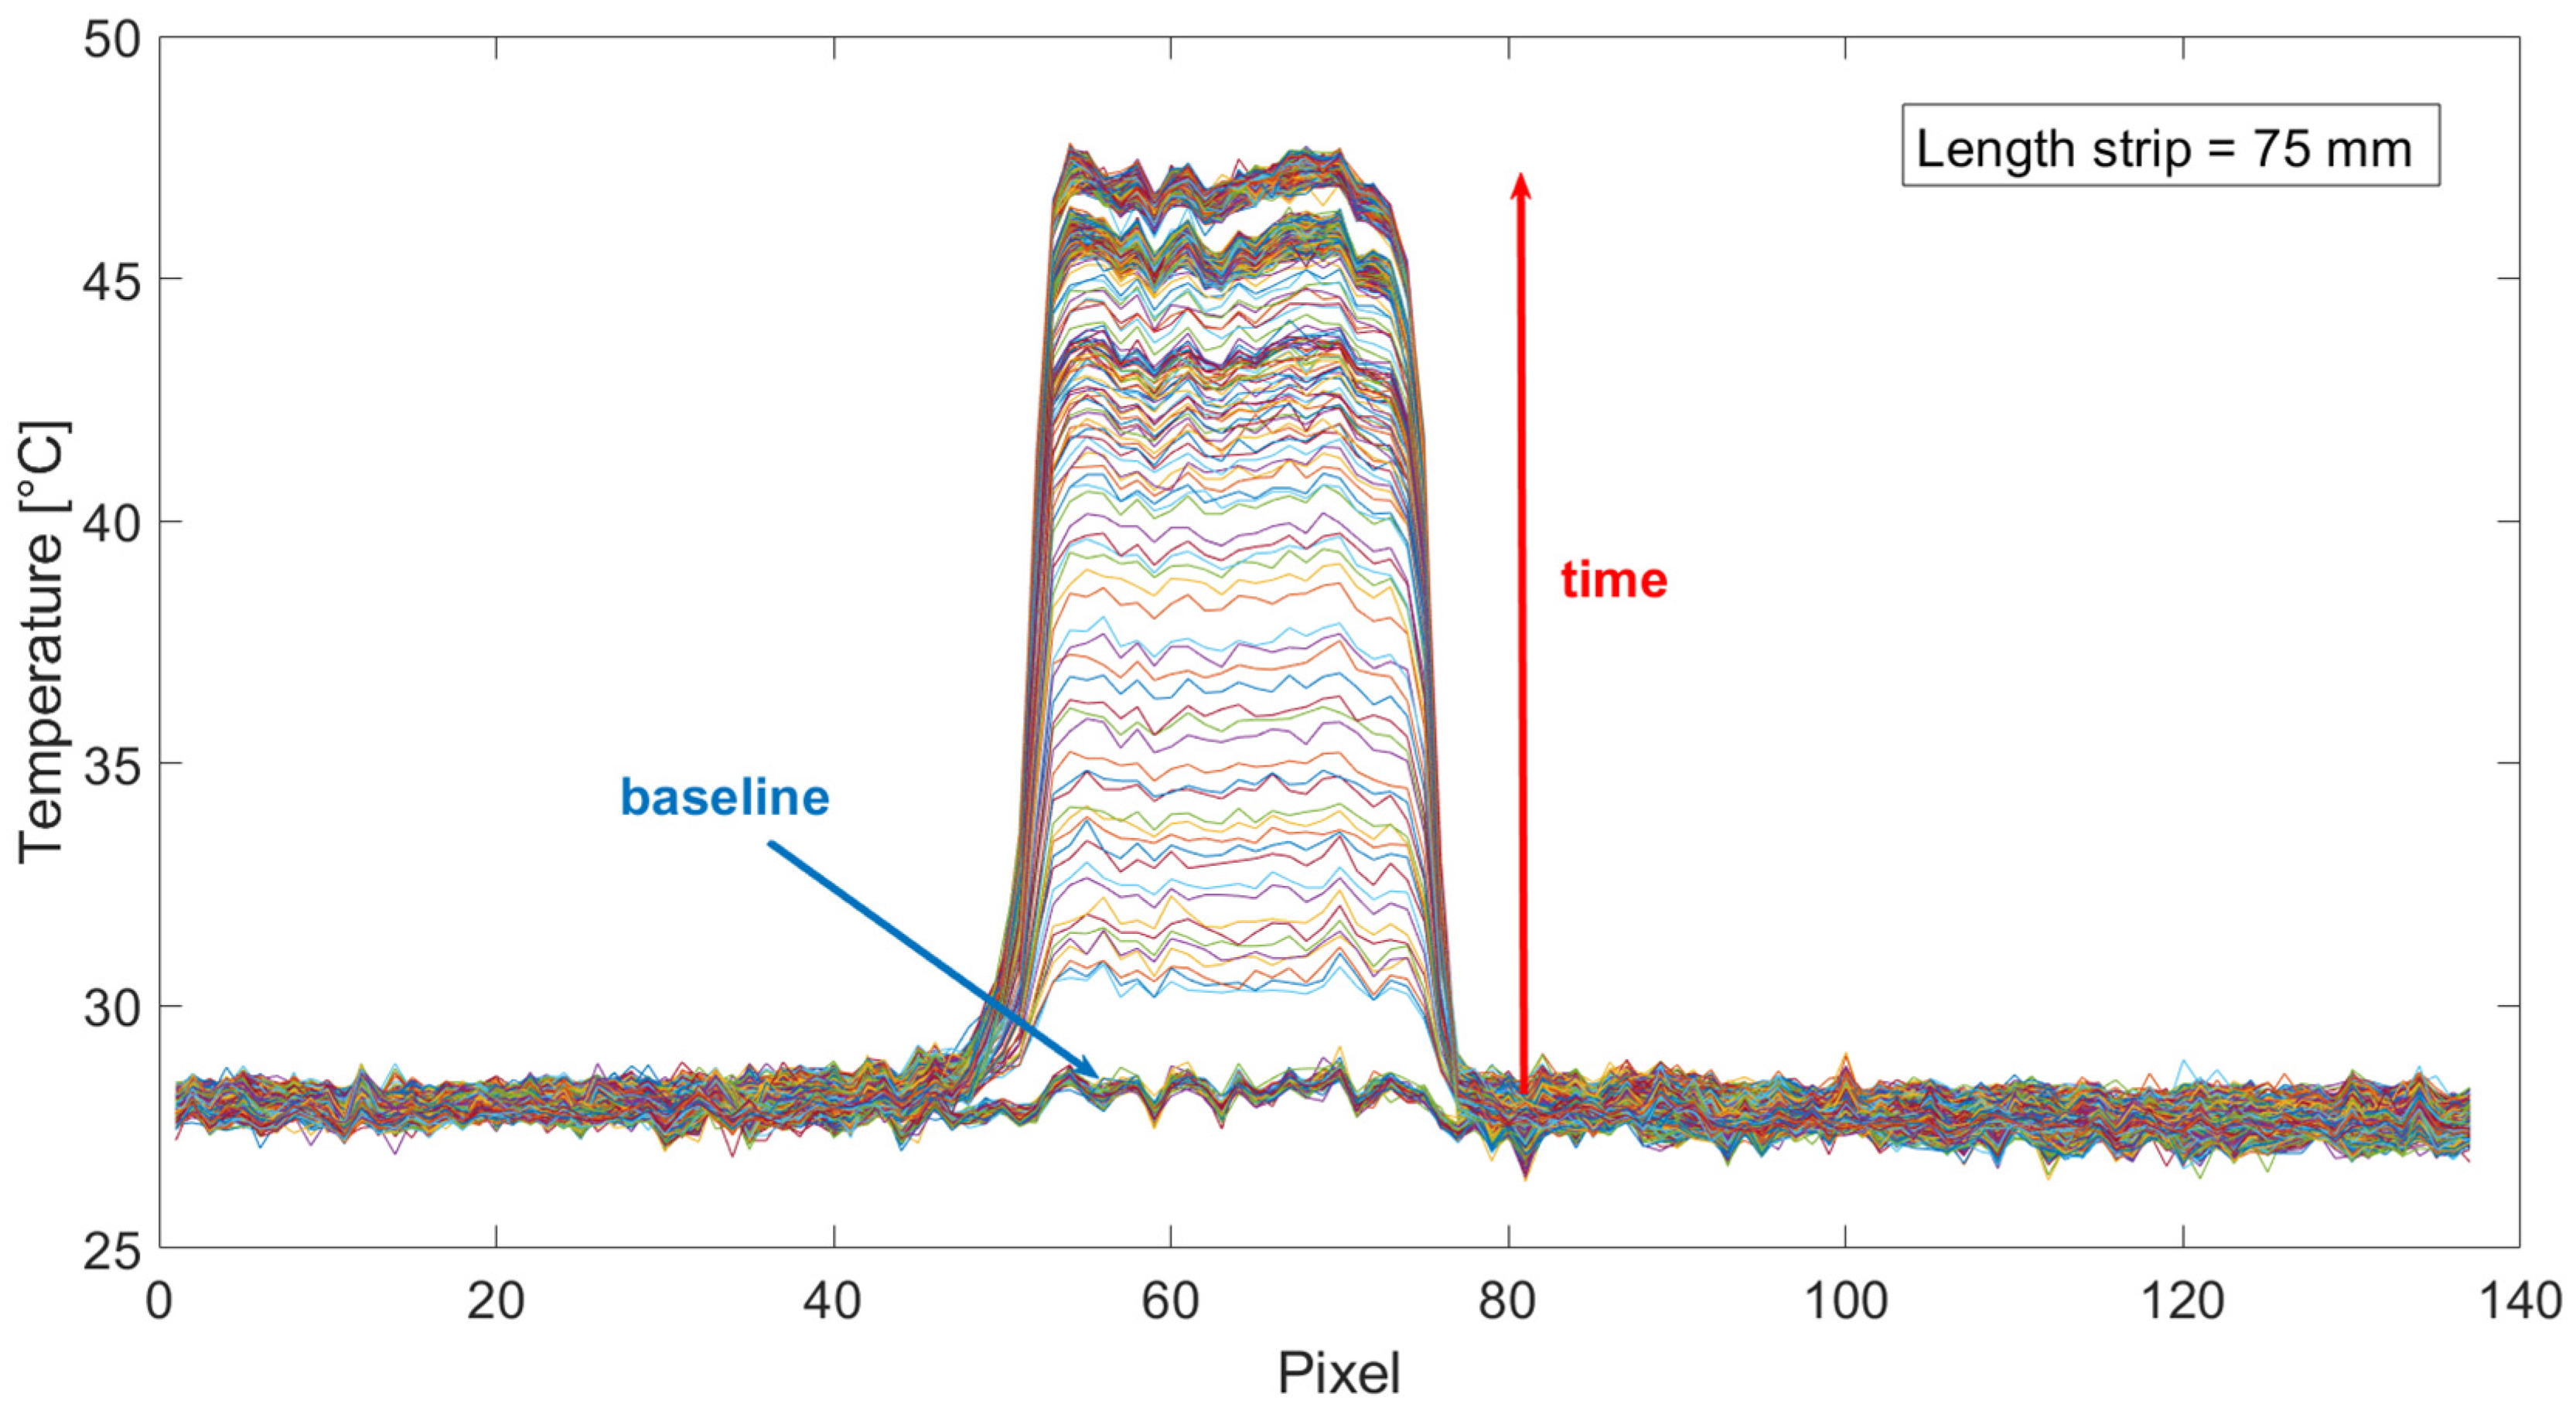
3.2. Thermal Emissivity Evaluation and Joule Heating Capability

Starting from the set-up and methods reported in Section 2.3, the graphene strips have been used as heating element. A G-paper film has been used, with dimensions of 11 × 75 mm, with an imposed current of 1.05 A. The steady-state distribution of the temperature is given in Figure 7 (1 pixel corresponds to about 1.5 mm).
These experiments allow us to estimate the thermal emissivity, by means of the method previously described, and by using (4). The results are summarized in Table 4, and are coherent with those reported in [14]. Note that the emissivity of the binder (polyurethane) can be assumed equal to 0.90, hence by increasing the percentage of binder, the emissivity is expected to increase, as coherently reported in Table 4.
In Figure 8 the temperature distribution calculated along the middle line of the strip is plotted for each time instant. The thermal transient duration is about 2 min, hence the graphene heater is characterized by a fast responsitivity, if compared to conventional conductors.
Let us now discuss the Joule heating capability in view of the use of such strips as heating elements. Standard requirements for the heat flux needed for de-icing and anti-icing are falling in the range of tens of kW/m2, depending on the specific systems and conditions [39]. For our purposes, the project targets are 50 W/m2 and 25 W/m2 for de-icing and anti-icing, respectively. As mentioned, the power dissipated by the strip is about 1.05 W, that provide an average value of the power density of 95.8 kW/m2 (assuming a uniform distribution of the temperature along the whole strip). This value would be enough both for de-icing and anti-icing applications. However, it can be observed from Figure 6 that the graphene heater is characterized by an almost flat distribution of the temperature on almost the entire strip, except for two regions of few mm in touch with the electrodes. Considering this behavior, if we refer to this inner zone, the power density can be estimated as equal to 213 kW/m2, thus, providing an excellent performance.
Note that in real de-icing and anti-icing applications, these values of power intensity must be imposed in continuous mode with no failure for hot-spots over the whole heating surface. Therefore, the uniform distribution of temperature in the inner part of the strip and the absence of hot spots (Figure 7) is a highly desirable feature for a heater. Note that this behavior is observed not only at steady state but also at each time instant during the transient (see the flat areas in Figure 8). Similar behavior is observed for the other two graphene films.

4. Conclusions

This paper has studied commercial graphene-based macroscopic strips, in view of their potential use as heating elements in de-icing systems. Set-ups and methods have been proposed to identify two parameters of major interest for such an application: the electrical resistivity and the thermal emissivity. The electrical resistivity is found to fall in the range (8–40) µΩm at room temperature, with a negative coefficient of temperature, whereas the thermal emissivity values ranged from 0.5 to 0.8, at room temperature. The thermal response of these graphene films is characterized by short transients, compared to conventional conductors, and by a highly desirable flatness and uniformity of the temperature distribution over the strip, not only at steady-state but also during the thermal transient.
As for the Joule heating capability, the analyzed strips were demonstrated to provide under a current of 1A an average power density of 95.8 kW/m2, matching the targets requested for de-icing and anti-icing applications.
Future works will be devoted to complete the analysis of parameters by estimating also the thermal conductivity, and carrying on a systematic study of the characteristics of the thermal response of the heating elements.
In addition, work is in progress to assess the mechanical performance of the strips studied in this paper, when considering them in a realistic assembly, where they will be enveloped in a glass-fibre reinforced material. In order to enhance the mechanical performance of such multi-layered structures, different methodologies are under examination, and will be discussed in future works.

Author Contributions

Conceptualization, A.M.; methodology, A.M., G.G., F.B., F.C., S.C.; investigation, K.L., S.S., G.T.; writing, K.L. and A.M. All authors have read and agreed to the published version of the manuscript.

Funding

This research was partially funded by EU Commission program H2020, Graphene Flagship Graphene, Core3/H2020-SGA-FET-GRAPHENE-2019, Project SH10 GICE “Graphene-Based, Thermoelectric Ice Protection System,” grant # 881603, and by Regione Lazio, Italy, under the program POR FESR LAZIO 2014–2020, Project AIRETEC, grant #A0320-2019-28139.

Institutional Review Board Statement

Not applicable.

Informed Consent Statement

Not applicable.

Data Availability Statement

Not applicable.

Conflicts of Interest

The authors declare no conflict of interest.

References

  1. Yamazaki, M.; Jemcov, A.; Sakaue, H. A Review on the Current Status of Icing Physics and Mitigation in Aviation. Aerospace 2021, 8, 188. [Google Scholar] [CrossRef]
  2. Wang, Z. Recent Progress on Ultrasonic De-Icing Technique Used for Wind Power Generation, High-Voltage Transmission Line and Aircraft. Energy Build. 2017, 140, 42–49. [Google Scholar] [CrossRef]
  3. Fakorede, O.; Feger, Z.; Ibrahim, H.; Ilinca, A.; Perron, J.; Masson, C. Ice Protection Systems for Wind Turbines in Cold Climate: Characteristics, Comparisons and Analysis. Renew. Sustain. Energy Rev. 2016, 65, 662–675. [Google Scholar] [CrossRef]
  4. Thomas, S.K.; Cassoni, R.P.; Macarthur, C.D. Aircraft anti-icing and de-icing techniques and modeling. J. Aircr. 1996, 33, 841–854. [Google Scholar] [CrossRef]
  5. Botura, G.; Sweet, D.; Flosdorf, D. Development and Demonstration of Low Power Electrothermal De-icing System. In Proceedings of the 43rd AIAA Aerospace Sciences Meeting and Exhibit, Reno, NV, USA, 10–13 January 2005. [Google Scholar]
  6. Karim, N.; Zhang, M.; Afroj, S.; Koncherry, V.; Potluri, P.; Novoselov, K.S. Graphene-based surface heater for de-icing applications. RSC Adv. 2018, 8, 16815–16823. [Google Scholar] [CrossRef] [Green Version]
  7. Redondo, O.; Prolongo, S.G.; Campo, M.; Sbarufatti, C.; Giglio, M. Anti-icing and de-icing coatings based Joule’s heating of graphene nanoplatelets. Compos. Sci. Technol. 2018, 164, 65–73. [Google Scholar] [CrossRef]
  8. Sahu, D.; Sutar, H.; Senapati, P.; Murmu, R.; Roy, D. Graphene, Graphene-Derivatives and Composites: Fundamentals, Synthesis Approaches to Applications. J. Compos. Sci. 2021, 5, 181. [Google Scholar] [CrossRef]
  9. Jia, X.; Campos-Delgado, J.; Terrones, M.; Meunier, V.; Dresselhaus, M.S. Graphene edges: A review of their fabrication and characterization. Nanoscale 2011, 3, 86–95. [Google Scholar] [CrossRef]
  10. Kovtun, A.; Treossi, E.; Mirotta, N.; Scidà, A.; Liscio, A.; Christian, M.; Valorosi, F.; Boschi, A.; Young, R.J.; Galiotis, C.; et al. Benchmarking of graphene-based materials: Real commercial products versus ideal graphene. 2D Mater. 2019, 6, 025006. [Google Scholar] [CrossRef]
  11. Cataldi, P.; Athanassiou, A.; Bayer, I.S. Graphene Nanoplatelets-Based Advanced Materials and Recent Progress in Sustainable Applications. Appl. Sci. 2018, 8, 1438. [Google Scholar] [CrossRef] [Green Version]
  12. Jiménez-Suárez, A.; Prolongo, S.G. Graphene Nanoplatelets. Appl. Sci. 2020, 10, 1753. [Google Scholar] [CrossRef] [Green Version]
  13. Maffucci, A.; Micciulla, F.; Cataldo, A.; Miano, G.; Bellucci, S. Bottom-up Realization and Electrical Characterization of a Graphene-Based Device. Nanotechnology 2016, 27, 095204. [Google Scholar] [CrossRef] [PubMed]
  14. Vertuccio, L.; De Santis, F.; Pantani, R.; Lafdi, K.; Guadagno, L. Effective de-icing skin using graphene-based flexible heater. Compos. Part B Eng. 2019, 162, 600–610. [Google Scholar] [CrossRef]
  15. Vertuccio, L.; Foglia, F.; Pantani, R.; Romero-Sánchez, M.; Calderón, B.; Guadagno, L. Carbon nanotubes and expanded graphite based bulk nanocomposites for de-icing applications. Compos. Part B Eng. 2021, 207, 108583. [Google Scholar] [CrossRef]
  16. Prolongo, S.G.; Moriche, R.; Del Rosario, G.; Jiménez-Suárez, A.; Prolongo, M.G.; Ureña, A. Joule Effect Self-Heating of Epoxy Composites Reinforced with Graphitic Nanofillers. J. Polym. Res. 2016, 23, 189. [Google Scholar] [CrossRef] [Green Version]
  17. Mohiuddin, M.; Hoa, S.V. Temperature-dependent electrical conductivity of CNT–PEEK composites. Compos. Sci. Technol. 2011, 72, 21–27. [Google Scholar] [CrossRef]
  18. Han, S.; Chand, A.R.; Araby, S.; Cai, R.; Chen, S.; Kang, H.; Cheng, R.; Meng, Q. Thermally and electrically conductive multifunctional sensor based on epoxy/graphene composite. Nanotechnology 2019, 31, 075702. [Google Scholar] [CrossRef] [PubMed]
  19. Kargar, F.; Barani, Z.; Balinskiy, M.; Magana, A.S.; Lewis, J.S.; Balandin, A.A. Dual-Functional Graphene Composites for Electromagnetic Shielding and Thermal Management. Adv. Electron. Mater. 2019, 5, 1800558. [Google Scholar] [CrossRef] [Green Version]
  20. Ayub, S.; Guan, B.H.; Ahmad, F.; Oluwatobi, Y.A.; Nisa, Z.U.; Javed, M.F.; Mosavi, A. Graphene and iron reinforced polymer composite electromagnetic shielding applications: A review. Polymers 2021, 13, 2580. [Google Scholar] [CrossRef] [PubMed]
  21. Jen, Y.M.; Huang, J.C. Synergistic Effect on the Thermomechanical and Electrical Properties of Epoxy Composites with the Enhancement of Carbon Nanotubes and Graphene Nano Platelets. Materials 2019, 12, 255. [Google Scholar] [CrossRef] [Green Version]
  22. Sibilia, S.; Bertocchi, F.; Chiodini, S.; Cristiano, F.; Ferrigno, L.; Giovinco, G.; Maffucci, A. Temperature-dependent electrical resistivity of macroscopic graphene nanoplatelet strips. Nanotechnology 2021, 32, 275701. [Google Scholar] [CrossRef] [PubMed]
  23. Maffucci, A.; Bertocchi, F.; Chiodini, S.; Cristiano, F.; Ferrigno, L.; Giovinco, G.; Trezza, G. Electrothermal Parameters of Graphene Nanoplatelets Films. In Proceedings of the IEEE 21st International Conference on Nanotechnology (IEEE NANO), Montreal, QC, Canada, 28–30 July 2021; pp. 323–326. [Google Scholar]
  24. Wu, H.; Drzal, L.T. Graphene nanoplatelet paper as a light-weight composite with excellent electrical and thermal conductivity and good gas barrier properties. Carbon 2012, 50, 1135–1145. [Google Scholar] [CrossRef]
  25. NANESA. Available online: http://www.nanesa.com/en-US/Graphene (accessed on 10 January 2022).
  26. Sutar, H.; Mishra, B.; Senapati, P.; Murmu, R.; Sahu, D. Mechanical, Thermal, and Morphological Properties of Graphene Nanoplatelet-Reinforced Polypropylene Nanocomposites: Effects of Nanofiller Thickness. J. Compos. Sci. 2021, 5, 24. [Google Scholar] [CrossRef]
  27. Fang, C.; Zhang, J.; Chen, X.; Weng, G.J. Calculating the Electrical Conductivity of Graphene Nanoplatelet Polymer Composites by a Monte Carlo Method. Nanomaterials 2020, 10, 1129. [Google Scholar] [CrossRef]
  28. Ravindran, A.R.; Feng, C.; Huang, S.; Wang, Y.; Zhao, Z.; Yang, J. Effects of Graphene Nanoplatelet Size and Surface Area on the AC Electrical Conductivity and Dielectric Constant of Epoxy Nanocomposites. Polymers 2018, 10, 477. [Google Scholar] [CrossRef] [Green Version]
  29. Todri-Sanial, A.; Dijon, J.; Maffucci, A. Carbon Nanotubes for Interconnects: Process, Design and Applications; Springer: Dordrecht, The Netherlands, 2016. [Google Scholar]
  30. COMSOL. Available online: https://www.comsol.com/comsol-multiphysics (accessed on 12 December 2021).
  31. Steinhögl, W.; Schindler, G.; Steinlesberger, G.; Traving, M.; Engelhardt, M. Comprehensive study of the resistivity of copper wires with lateral dimensions of 100 nm and smaller. J. Appl. Phys. 2005, 97, 023706. [Google Scholar] [CrossRef]
  32. Chiariello, A.G.; Maffucci, A.; Miano, G. Size and Temperature Effects on the Resistance of Copper and Carbon Nanotubes Nano-interconnects. In Proceedings of the 19th IEEE Topical Meeting EPEPS 2010, Austin, TX, USA, 25–27 October 2010; pp. 97–100. [Google Scholar]
  33. Arpino, F.; Buonanno, G.; Giovinco, G. Thermal conductance measurement of windows: An innovative radiative method. Experim. Therm. Fluid Sci. 2008, 32, 1731–1739. [Google Scholar] [CrossRef]
  34. Koskinen, T.; Juntunen, T.; Tittonen, I. Large-Area Thermal Distribution Sensor Based on Multilayer Graphene Ink. Sensors 2020, 20, 5188. [Google Scholar] [CrossRef] [PubMed]
  35. Forestiere, C.; Maffucci, A.; Miano, G. Hydrodynamic model for the signal propagation along carbon nanotubes. J. Nanophotonics 2010, 4, 041695. [Google Scholar]
  36. Maffucci, A.; Miano, G. Number of Conducting Channels for Armchair and Zig-Zag Graphene Nanoribbon Interconnects. IEEE Trans. Nanotechnol. 2013, 12, 817–823. [Google Scholar] [CrossRef]
  37. Maffucci, A.; Micciulla, F.; Cataldo, A.; Miano, G.; Bellucci, S. Modeling, Fabrication, and Characterization of Large Carbon Nanotube Interconnects with Negative Temperature Coefficient of the Resistance. IEEE Trans. Compon. Packag. Manuf. 2017, 7, 485–493. [Google Scholar] [CrossRef]
  38. Zhao, S.; Lou, D.; Zhan, P.; Li, G.; Dai, K.; Guo, J.; Zheng, G.; Liu, C.; Shena, C.; Guo, Z. Heating-induced negative temperature coefficient effect in conductive graphene/polymer ternary nanocomposites with a segregated and double-percolated structure. J. Mater. Chem. C 2017, 32, 8233–8242. [Google Scholar] [CrossRef]
  39. Hann, R.; Enache, A.; Nielsen, M.C.; Stovner, B.N.; van Beeck, J.; Johansen, T.A.; Borup, K.T. Experimental Heat Loads for Electrothermal Anti-Icing and De-Icing on UAVs. Aerospace 2021, 8, 83. [Google Scholar] [CrossRef]
Figure 1. The text-fixture realized for the electro-thermal characterization, with a 2- or 4-probe measurement of the electrical resistance.
Aerospace 09 00107 g001
Figure 2. A single GNP in a Scanning Electron Microscope picture.
Aerospace 09 00107 g002
Figure 3. CAD model of the text-fixture adopted for the electro-thermal numerical simulation.
Aerospace 09 00107 g003
Figure 4. Set-up for the Joule heating test and the emissivity characterization: (a) the heating element is fixed vertically to a plastic support, and connected to two electrodes; (b) the support is placed inside a hollow black body, closed by a wall with an IR camera (not shown here). Two additional thermocouples are placed inside, to control the temperature of the box and on the graphene strip.
Aerospace 09 00107 g004
Figure 5. Equivalent resistivity vs. temperature for the pure graphene strip (G-paper): values identified from the experimental data (red dots), and linear fitting according to (3), whose coefficients are given in Table 2 (blue line).
Aerospace 09 00107 g005
Figure 6. Interpretation of the NTC behavior of the graphene strips: (a) two adjacent GNPs in the strip, with two possible conduction mechanisms: contact (red arrow) or tunneling and hopping (green arrow); (b) equivalent circuital description.
Aerospace 09 00107 g006
Figure 7. Temperature distribution over the graphene strip at steady-state (G-paper film fed by a current of 1.05 A). 1 pixel corresponds to about 1.5 mm.
Aerospace 09 00107 g007
Figure 8. Temperature distribution calculated along the middle line of the strip, for each time instant from the beginning (baseline), to the steady state, reached after about 2 m (1 pixel corresponds to about 1.5 mm).
Aerospace 09 00107 g008
Table 1. Characteristics of the graphene strips analyzed in this paper.
Material%GNPsBinderThickness (µm)Length (cm)Width (mm)
G-paper100none757–187–11
G-PREG (95/5)95Polyurethane 5%757–187–11
G-PREG (80/20)80Polyurethane 20%757–187–11
Table 2. Fitting coefficients for model (3), for the three graphene materials films and for copper.
Material ρ 0   ( µ m ) α (1/°C) u   ( ρ ) / ρ   ( % )
Cu1.68 × 10−23.90 × 10⁻³-
G-paper7.86−1.55 × 10−32.1
G-PREG (95/5)19.32−1.31 × 10−32.0
G-PREG (80/20)41.57−0.84 × 10−32.0
Table 3. Assessment of the results with respect to the strip length.
Lv (mm)Rm (Ω)Rs (Ω) ρ e q ( µ m ) Err%
1403.3633.32519.821.14
1002.3902.37219.720.76
601.4371.41519.771.57
400.9580.93819.762.10
Table 4. Thermal emissivity computed for the three graphene films (combined standard uncertainty is 0.01).
G-PaperG-Preg (95/5)G-Preg (80/20)
Emissivity0.500.560.81
Publisher’s Note: MDPI stays neutral with regard to jurisdictional claims in published maps and institutional affiliations.

