Article

Key Parameters of a Design for a Novel Reflux Subsonic Low-Density Dust Wind Tunnel

1
School of Aeronautic Science and Engineering, Beihang University, Beijing 100191, China
2
Beijing Spacecrafts, Beijing 100190, China
*
Authors to whom correspondence should be addressed.
These authors contributed equally to this work.
Aerospace 2022, 9(11), 662; https://doi.org/10.3390/aerospace9110662
Submission received: 31 August 2022 / Revised: 24 October 2022 / Accepted: 25 October 2022 / Published: 27 October 2022

Abstract

:
The dust storm on the surface of Mars is a severe threat to Mars exploration missions. Taking adequate measures to avoid the impact of the harsh wind-blown dust environment is indispensable. Ground simulation of the Martian high-speed windblown dust environment is helpful for analysis of the environmental effects and evaluations of the suitability of the components and materials. In this paper, a novel reflux subsonic low-density dust wind tunnel is presented to simulate the high-speed windblown dust environment of the Martian atmosphere with a velocity of more than 100 m/s. The sand and dust are fed into the wind tunnel through the ejector assembly together with the compressed gas, resulting in high uniformity of particles in the test section. The construction design of the Mars wind tunnel is introduced. The key parameters, which are the nozzle parameters and the contraction curve, are discussed in detail. The convergent nozzle is most suitable for the ejector assembly. Moreover, the bicubic curve is selected as the contraction curve. The gas-particle two-phase computational fluid dynamic (CFD) simulations demonstrate the rationality of the wind tunnel design.

1. Introduction

Humans are able to conduct close exploration of the Martian surface with the help of Mars rovers and helicopters. As of October 2022, the Mars rovers still in operation include NASA’s Curiosity rover [1], Insight rover [2], and Perseverance rover [3,4], as well as China’s Zhurong rover [5]. Future Mars exploration will focus on more challenging missions, such as the Mars sample return [6] and the human mission [7,8,9,10].
The surface of Mars is covered with dust and sand [11]. These particles with different sizes, under the influence of Aeolian transport [12] and atmosphere activities, could saltate [13] and suspend in the atmosphere. The dust in the atmosphere is usually suspended in the form of dust aerosol for a long time and migrates with the wind [14]. The sand and dust are serious threats to Mars exploration activities. The sharp edges of the particles would wear the outer surface of a mechanical structure, resulting in damage or failure [15,16]. Dust accumulation on the solar panels reduces energy conversion efficiency and even causes the solar panels to be unable to function [17]. The transport of sand on the surface of Mars has received extensive attention and research [18,19,20,21,22]. This is helpful for analyzing the geological phenomena [18] of Mars and revealing the geomorphic characteristics [20] and climate evolution of Mars [22]. Additionally, sand/dust prevention is another research hotspot. An extensive amount of research focuses on the existing methods of sand/dust prevention and removal [23,24]. Many studies also exist on the mechanism of dust adsorption [13,25,26].
Although most of the observed wind speed near the Martian surface does not exceed 30 m/s [27,28,29], there are observation data demonstrating that the moving speed of dust storms can be much higher [30]. Mariner 9 data indicate that dust storms move at velocities in excess of 200 km/h (56 m/s) with gusts of 500~600 km/h (nearly 170 m/s) [31]. Therefore, it is necessary to consider the possible impact of the high-speed dust storms and take essential countermeasures when conducting Mars exploration missions or future concept designs [32,33].
The dust wind tunnel is an important means of studying atmospheric and dust activities. The Mars wind tunnel provides a simulated environment similar to the real environment, in which to study the Martian atmosphere and provide ground test support for Mars exploration. The most famous and most powerful dust wind tunnel is the Mars Surface Wind Tunnel (MARSWIT) facility at NASA Ames Research Center [34,35]. It is an open-circuit wind tunnel powered by a high-pressure nozzle ejector system. The main test section is 1.2 m × 0.9 m. The internal gas pressure can be reduced to about 380 Pa. CO2 is selected as the medium gas. Although the simulated wind speed in the MARSWIT can be controlled within the range of 20~180 m/s, due to the open circuit construction, the simulated wind speed and the simulated gas pressure are inversely correlated. A hopper, through which the basaltic dust is fed into the MARSWIT, is located upstream of the test section entrance [36,37]. This sand feeding method may cause the spatial distribution of sand concentration to be uneven in the test section. Another famous Mars simulation wind tunnel is the Aarhus Wind Tunnel Simulator II (AWTSII) [38,39], which is an improvement of the ATWS [40]. The AWTSII is a closed-return wind tunnel with a 2 m × 1 m test section. Two fans drive the gas to circulate in the wind tunnel. The simulated pressure can be controlled within the range of 600~1000 Pa. The minimum simulated temperature can reach −120 °C. The facility is equipped with an aerosol injection system, allowing for the suspension of particulates (dust and sand) in the wind flow. This wind tunnel is capable of reproducing a wide range of environmental temperatures, pressures, humidities, and airflow conditions in a system large enough to allow high degrees of stability, uniformity, and control. However, due to the fan-drive mode, the simulated wind speed can only reach about 20 m/s. Furthermore, this close-return construction would lead to dust deposition, and it is difficult to maintain the concentration of the dust for a long time.
In this paper, a novel reflux subsonic low-density wind tunnel is presented to simulate the dust storm environment of the Martian atmosphere with a gas speed exceeding 100 m/s. This Mars wind tunnel refers to the construction of the AWTSII and the driving mode of MARSWIT. The purpose of this wind tunnel is to simulate the high-speed windblown sand environment, and to provide a stable high-speed blowing test environment for test pieces. The wind tunnel is housed inside a vacuum chamber. Gas can circulate in the chamber. Moreover, the wind tunnel is driven by a high-pressure gas source. The particles and gas are blown into the wind tunnel through the ejector assembly simultaneously. The low pressure inside the wind tunnel is maintained using the vacuum pump assembly.
This paper is organized as follows: In Section 2, the system design and structural parameters are provided. Section 3 discusses the detailed parameters of the wind tunnel, including the selection of the nozzles and the contraction curve. Numerical simulation of the gas-solid two-phase flow is carried out in Section 4. Section 5 outlines the conclusions.

2. System Design

The determination of the structural parameters of the wind tunnel depends on the test conditions. Unlike the common dust wind tunnel, this wind tunnel is designed to simulate the high-speed sandstorm weather on Mars. The main simulated environmental parameters are shown in Table 1 [41]. Carbon dioxide (CO2) is selected as the gas medium of the wind tunnel, as the atmosphere is primarily composed of CO2 (about 95%) [42]. Although there are other gas components in the Martian atmosphere, it is believed that this approximation will not have any adverse effects on the windblown sand simulation. The simulated gas pressure and temperature are based on the Martian climate, while the simulated wind pressure is designed to reach 170 m/s.
Due to the low pressure of the simulated environment, we design the wind tunnel driven by a pressure gradient rather than a conventional fan. The gas holder provides high-pressure gas, while the vacuum pump assembly is used to reduce the gas pressure in the wind tunnel. The ejector assembly is used to provide a relatively uniform gas flow. To save gas consumption, we design the wind tunnel as a semi-open-loop layout. Sand distribution in the wind tunnel is the key index to evaluate the wind tunnel, so we introduce a Venturi feeder to control the sand feeding rate. The sand is fed into the Venturi feeder and ejected into the wind tunnel through the ejector assembly, and circulates in the wind tunnel. A part of the sand is pumped out of the wind tunnel. The wind speed in the test section is determined partly by the mass flow of the compressed gas but is also related to the ejection effect of the ejector assembly. For the sake of the safety of the vacuum pump assembly, a sand separator (cyclone separator) is utilized to collect the excess sand. The cyclone separator is a separation device that uses the principle of inertia to remove particulate matter from flue gases. It is specially designed for the Mars wind tunnel. Furthermore, heat sinks cover the inner wall of the wind tunnel and are designed to cool down the temperature.
Based on the discussion above, the construction of the Mars wind tunnel is designed as shown in Figure 1. Compressed gas is discharged from the gas holder and flows through the Venturi feeder. Then, the compressed gas mixes with the sand and flows into the vacuum chamber. The vacuum chamber, in which the main structure of the wind tunnel is located, is 5 m long and 1.8 m in diameter, and is vacuumized by the vacuum pump assembly. The compressed gas carrying sand is ejected into the settling chamber by the ejector assembly. After being ‘straightened’, the gas stream enters the contraction to accelerate and then flows into the test section (0.4 mW × 0.4 mH × 0.6 mL). Finally, the gas stream decelerated by the diffuser is directed back to the front of the wind tunnel by the secondary ejector assembly. Another portion of the gas is extracted by the vacuum pump assembly.
Owing to the semi-open-loop layout, part of the gas flow discharged from the test section will return to the upstream of the wind tunnel and participate in the ejection. Thus, the gas consumption of this Mars wind tunnel could be relatively small compared with that of the open-loop wind tunnel. Here is a rough estimate to compare the gas consumption: Suppose that the mass flow rate of the test section is m t e s t . For an open-loop wind tunnel, the gas supplement system is required to supply the gas with a mass flow rate of at least m t e s t . However, for a semi-open-loop wind tunnel, the gas supply for the test section consists of two parts. The first part is the compressed gas ejected by the ejector assembly (mass flow rate is m c o m p r e s s ). The other part is the gas that flows out of the test section, then returns to the upstream of the wind tunnel and is accelerated by the compressed gas flow (mass flow rate is m r e t u r n ). Therefore, to provide gas with a mass flow rate of m t e s t for the test section, the required mass flow rate of the compressed gas is m c o m p r e s s = m t e s t m r e t u r n .
The vacuum chamber, which provides a vacuum environment and circulates the gas flow, saves the floor space of the whole system. Furthermore, the pressure gradient drive mode helps to simulate a fairly wider wind speed range. Finally, the ejector-feed-sand mode helps to improve the uniformity of the sand.

3. Detailed Parameters Discussion

Essential computation of the structure is the basis of the preliminary design of the wind tunnel, which will not be discussed in this paper. We focus on the nozzle parameters and the contraction curve, which are important in improving the flow field quality of the test section.

3.1. Nozzle Parameters

The choice of the nozzle is directly related to the effect of injection and the quality of the flow field.
Many relevant studies were carried out in the China Aerodynamics Research and Development Centre [43,44,45]. In this paper, three different nozzles are selected to make a comparison of their ejection effects. These three alternative nozzles are provided considering the simulated environment and the wind tunnel structure. The parameters of the three nozzles are shown in Table 2.
To select the nozzle with the best ejection effect for this wind tunnel, a series of computational fluid dynamics (CFD) calculations are conducted. A group of nozzle inlet pressure is selected, and the static pressure at the outlet of the nozzle is set as 900 Pa.
It should be mentioned that although the nozzles are used to spray the two-phase flows composed of particles and compressed gases, only the single-phase flow simulations are carried out to evaluate the nozzles. The first reason for this is that particle concentration is a variable that varies with working conditions. The other reason is that the mass flow of the particles is relatively small compared with the mass flow of the compressed gas. Therefore, the single-phase flow comparison is an unavoidable trade-off but provides valuable guidance.
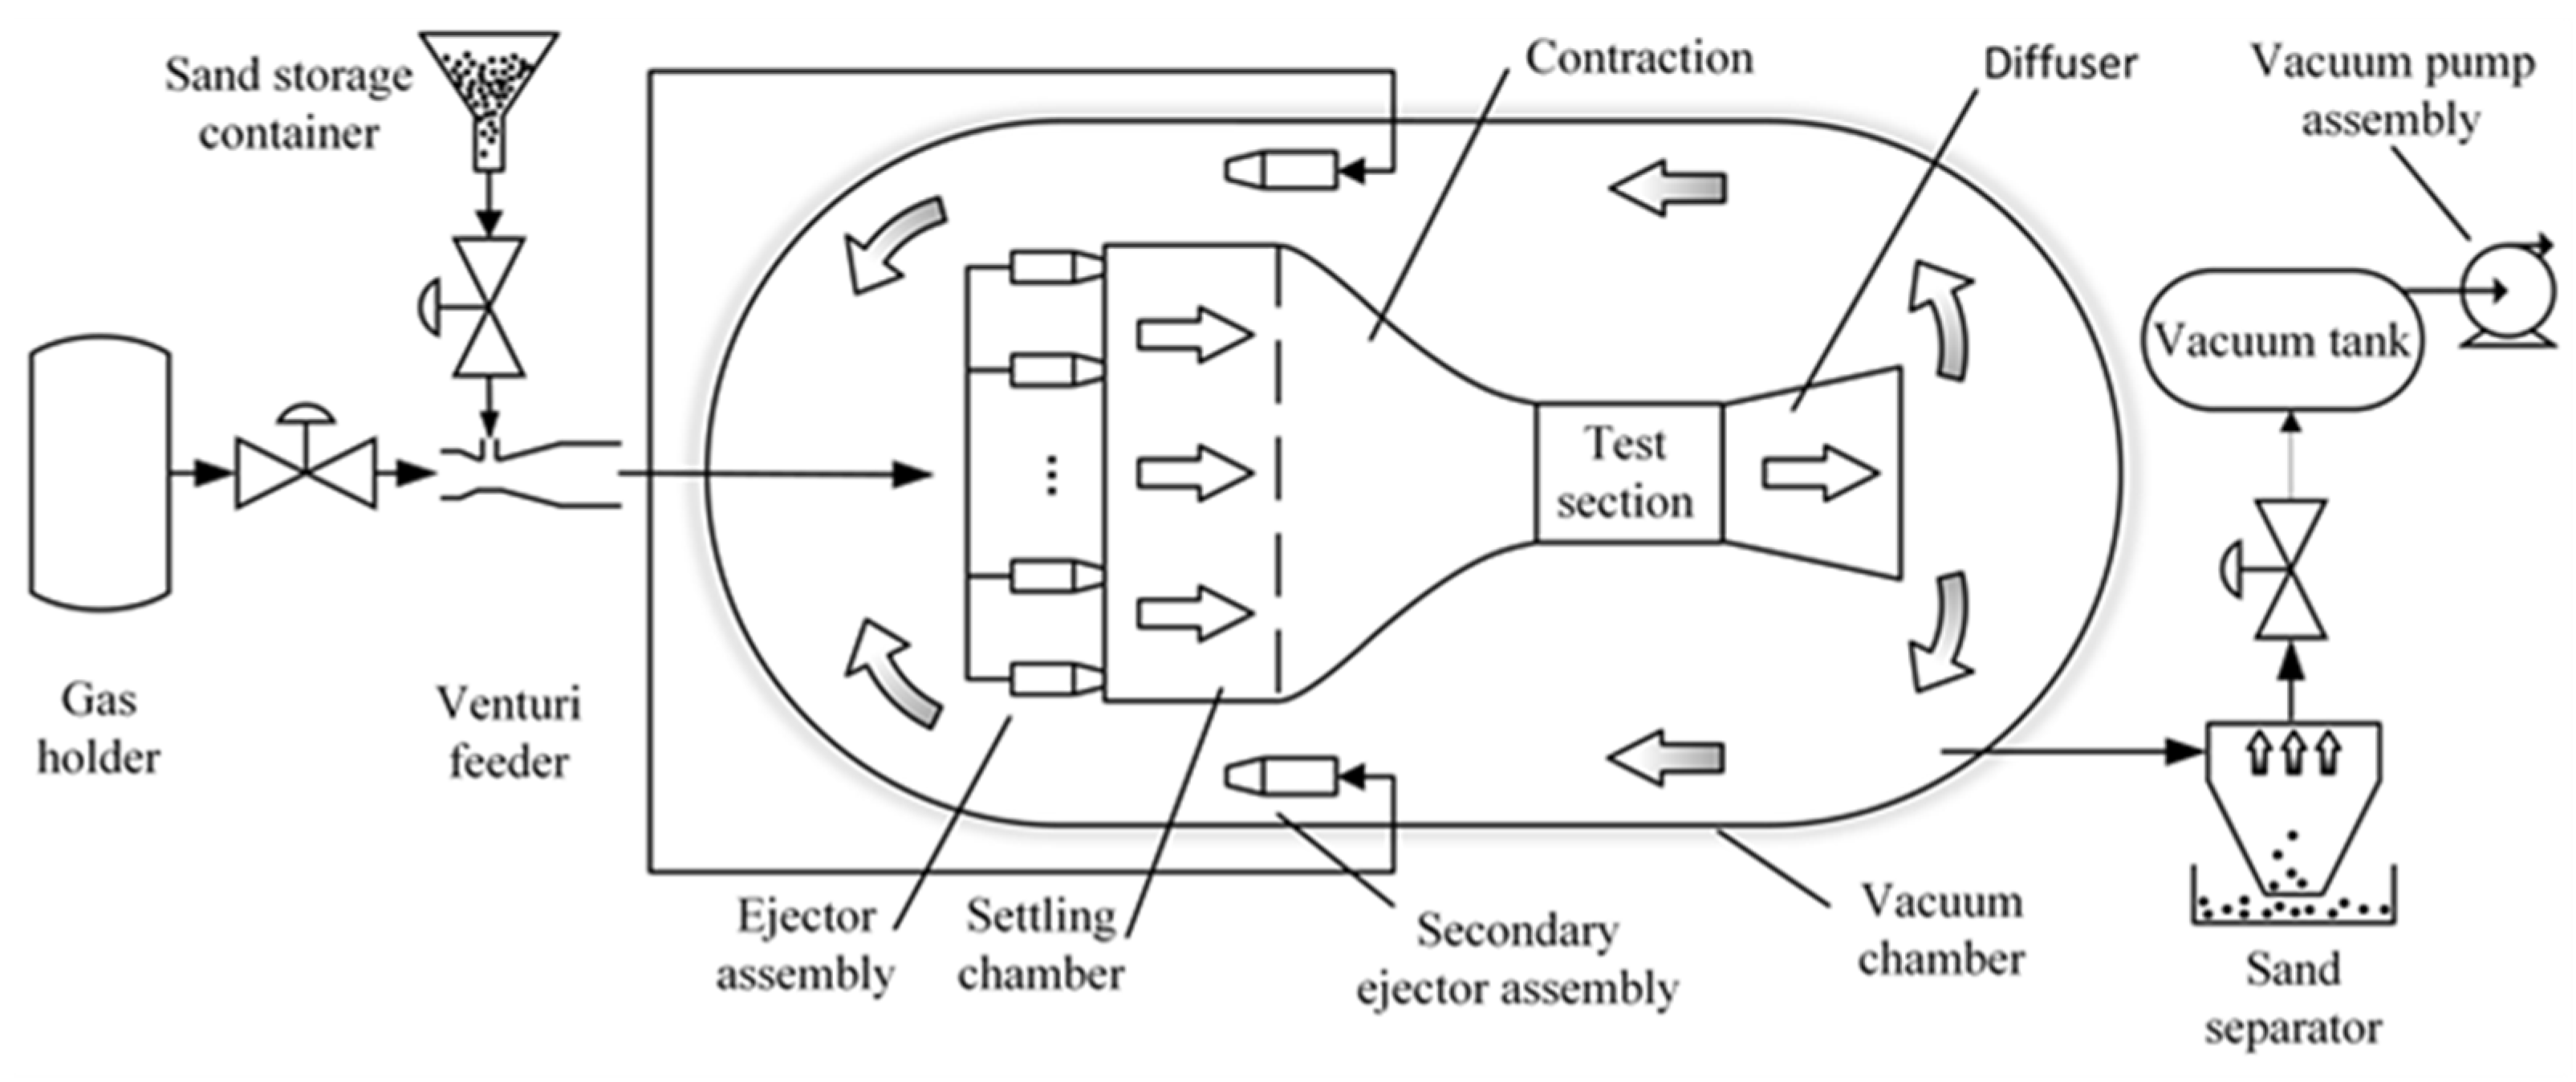
The area enclosing the nozzle and its external cylinder is set as the flow field. The 3D structured grid is generated. The grid near the nozzle wall is processed to increase the density. The grid-independence analysis is carried out, and the total numbers of grid cells reach to 3,710,000, 4,990,000, and 5,410,000 for the 1#, 2#, and 3# nozzle, respectively. The realizable k-epsilon viscous model is employed. The inlet of the nozzle is set as the pressure-inlet, and the pressures are set to 0.01 MPa, 0.05 MPa, and 0.1 MPa. The bottom surface of the cylinder, except the nozzle, is set as the pressure-inlet with the pressure of 900 Pa, and the other bottom surface is set as the pressure-outlet with the pressure of 900 Pa. The solver is set as the pressure-based Navier-Stokes solution algorithm. The solver is selected as the pressure-based coupled-implicit Solver.
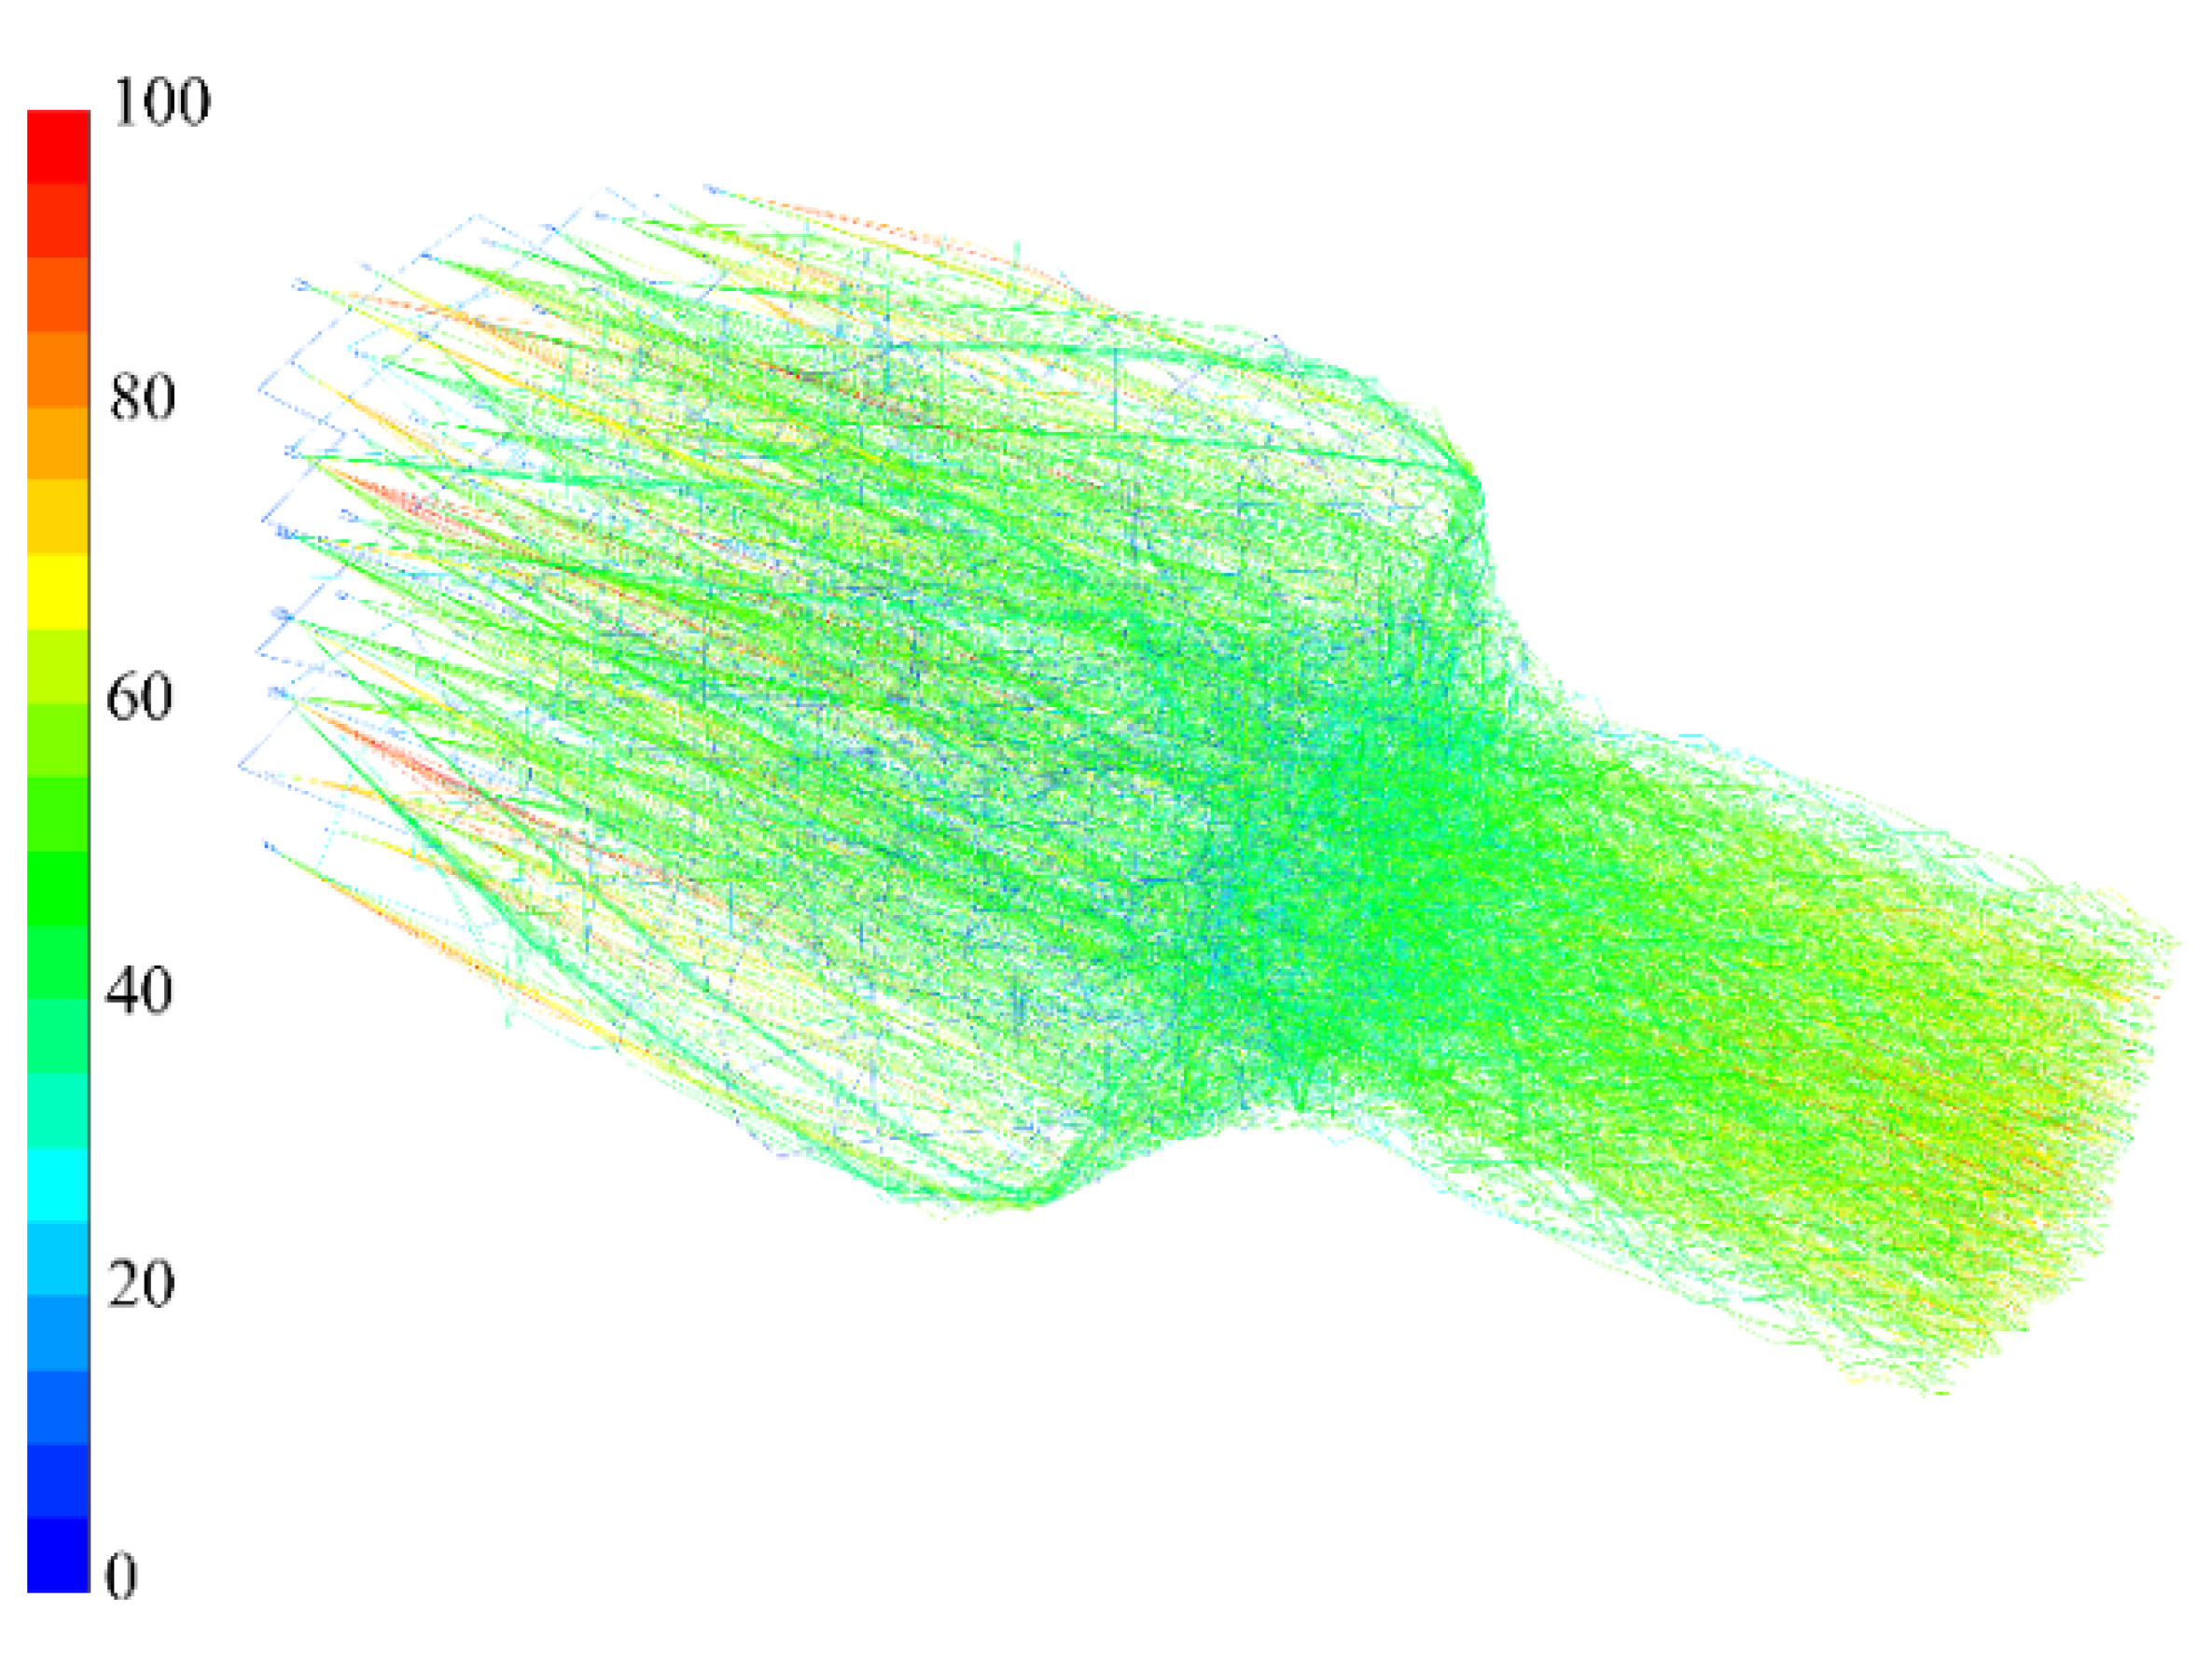
The velocity distributions of the three different nozzles are shown in Figure 2, Figure 3 and 
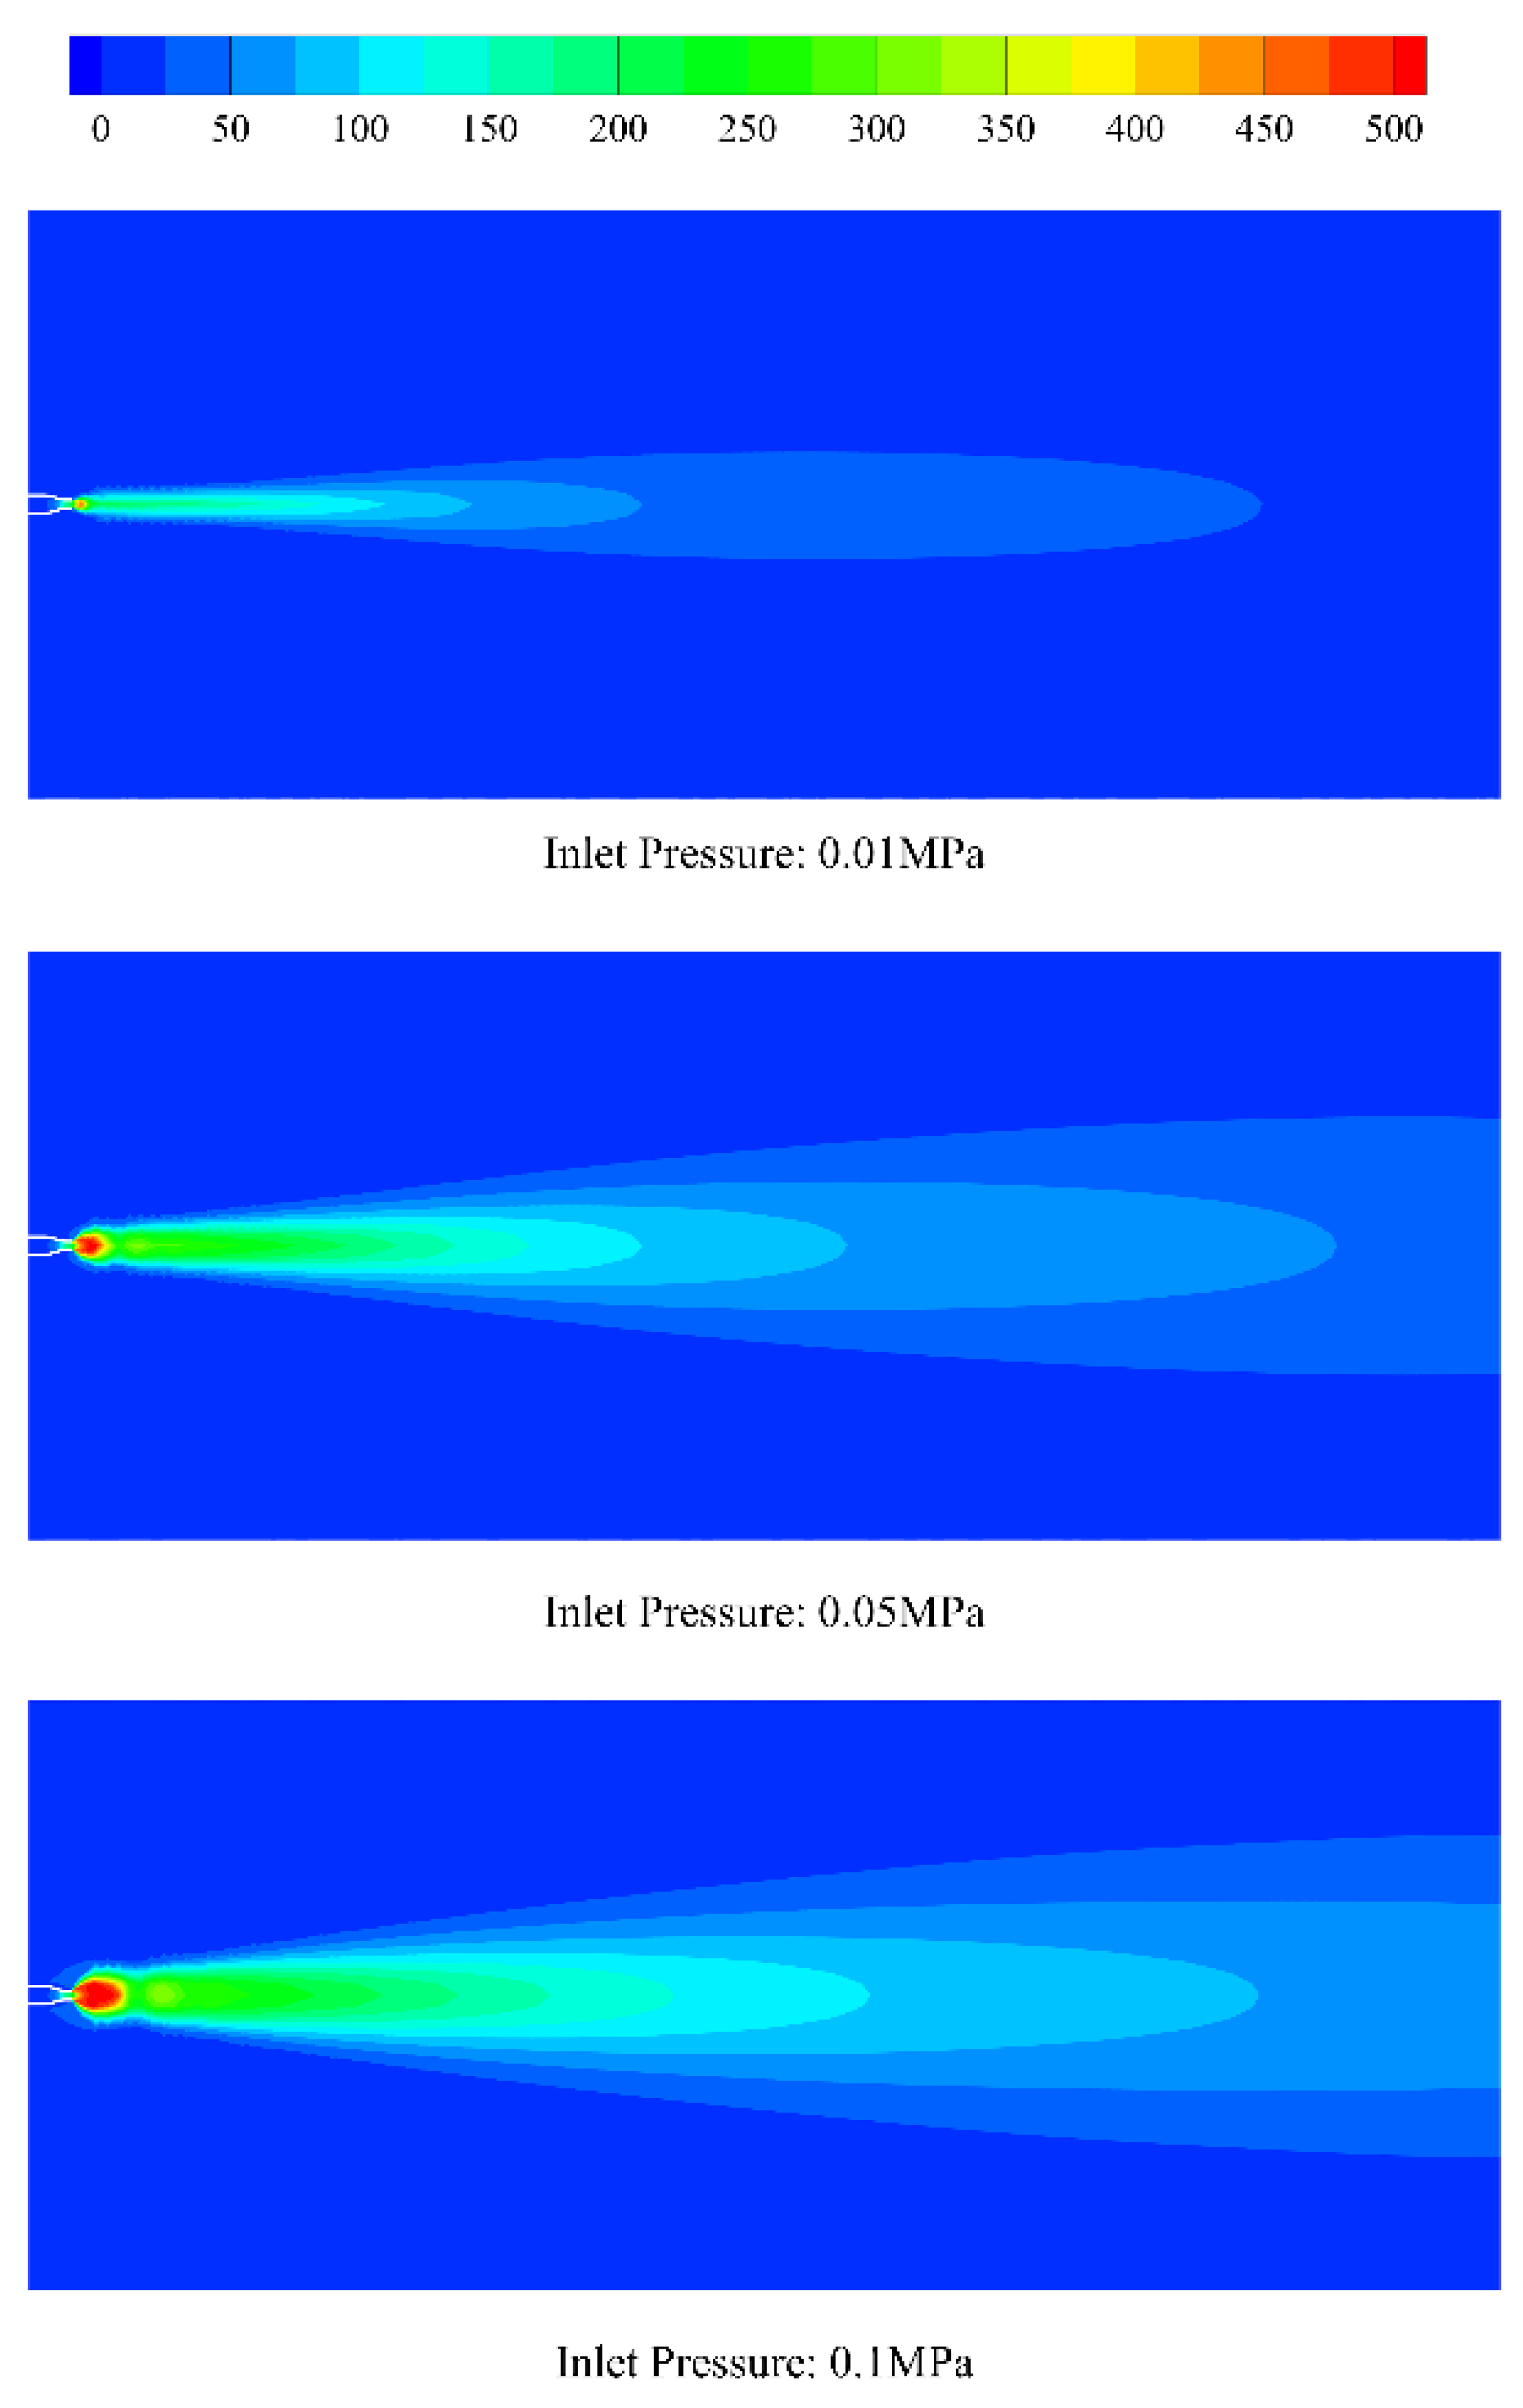
Figure 4. As can be observed from the figures, the gas flows are under supercritical conditions. After exiting the nozzle, the supersonic gas continues to expand and eventually becomes a subsonic gas flow after acceleration and deceleration. Comparing the two convergent nozzles as shown in Figure 2 and 
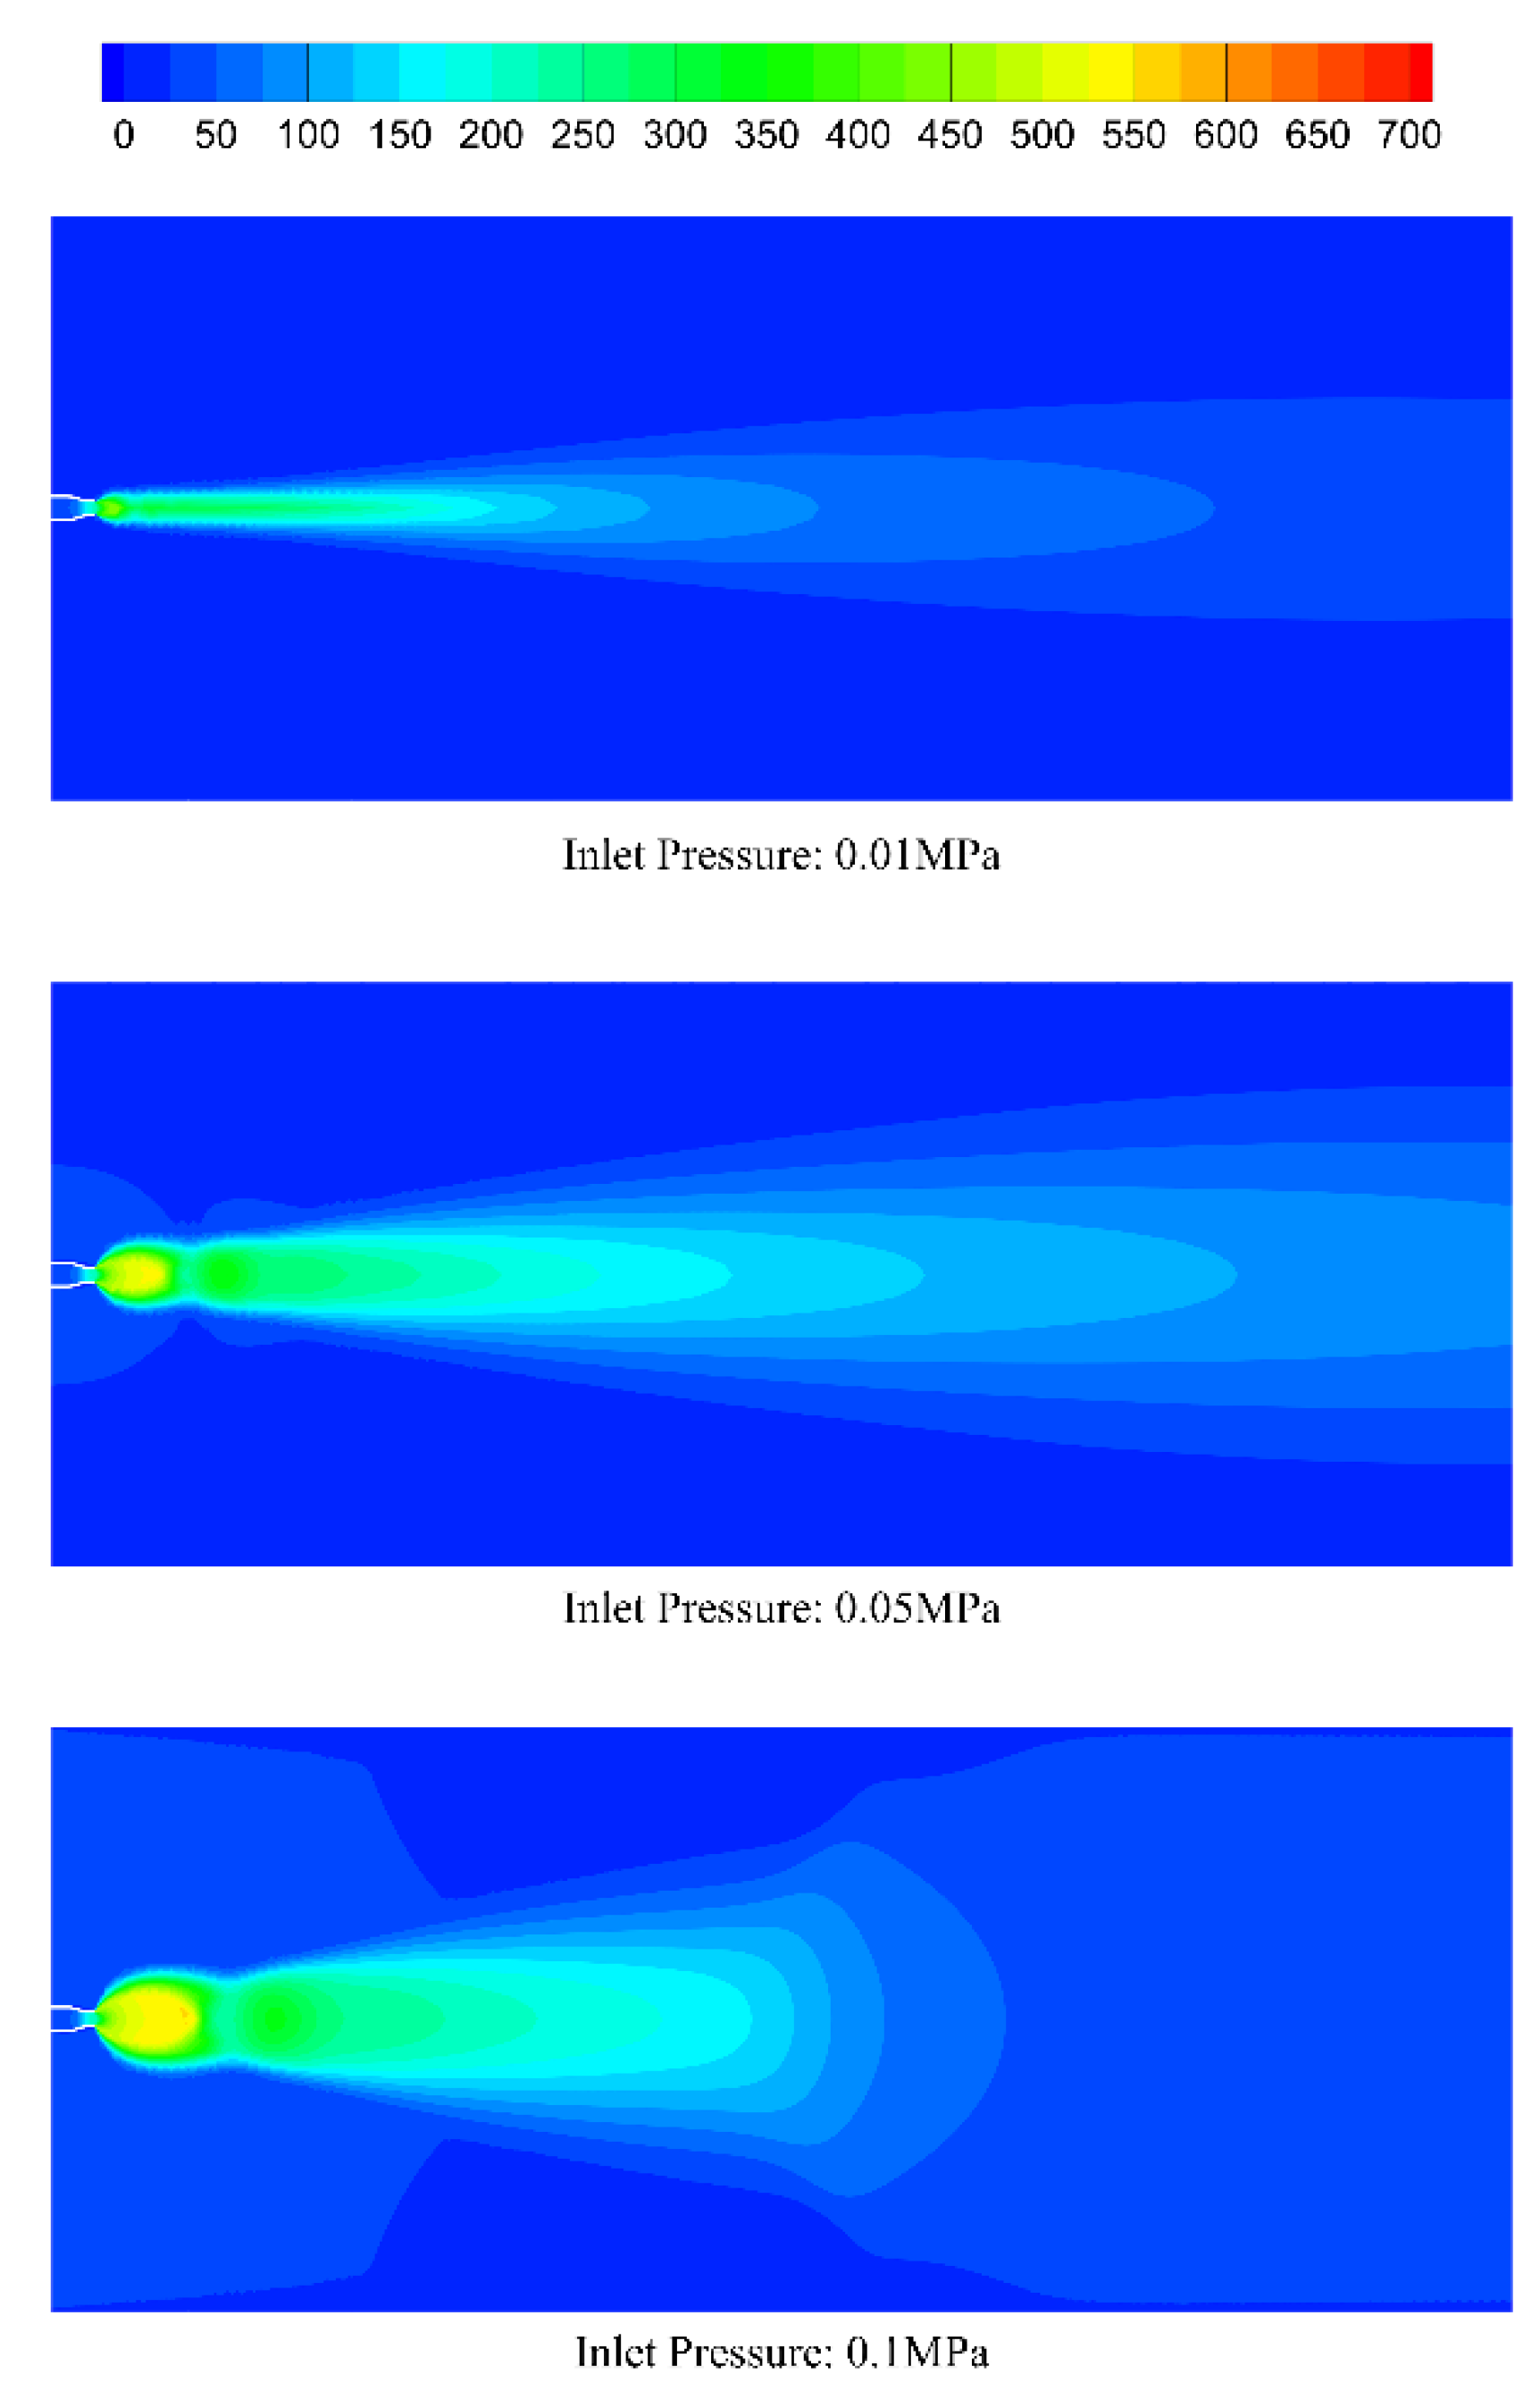
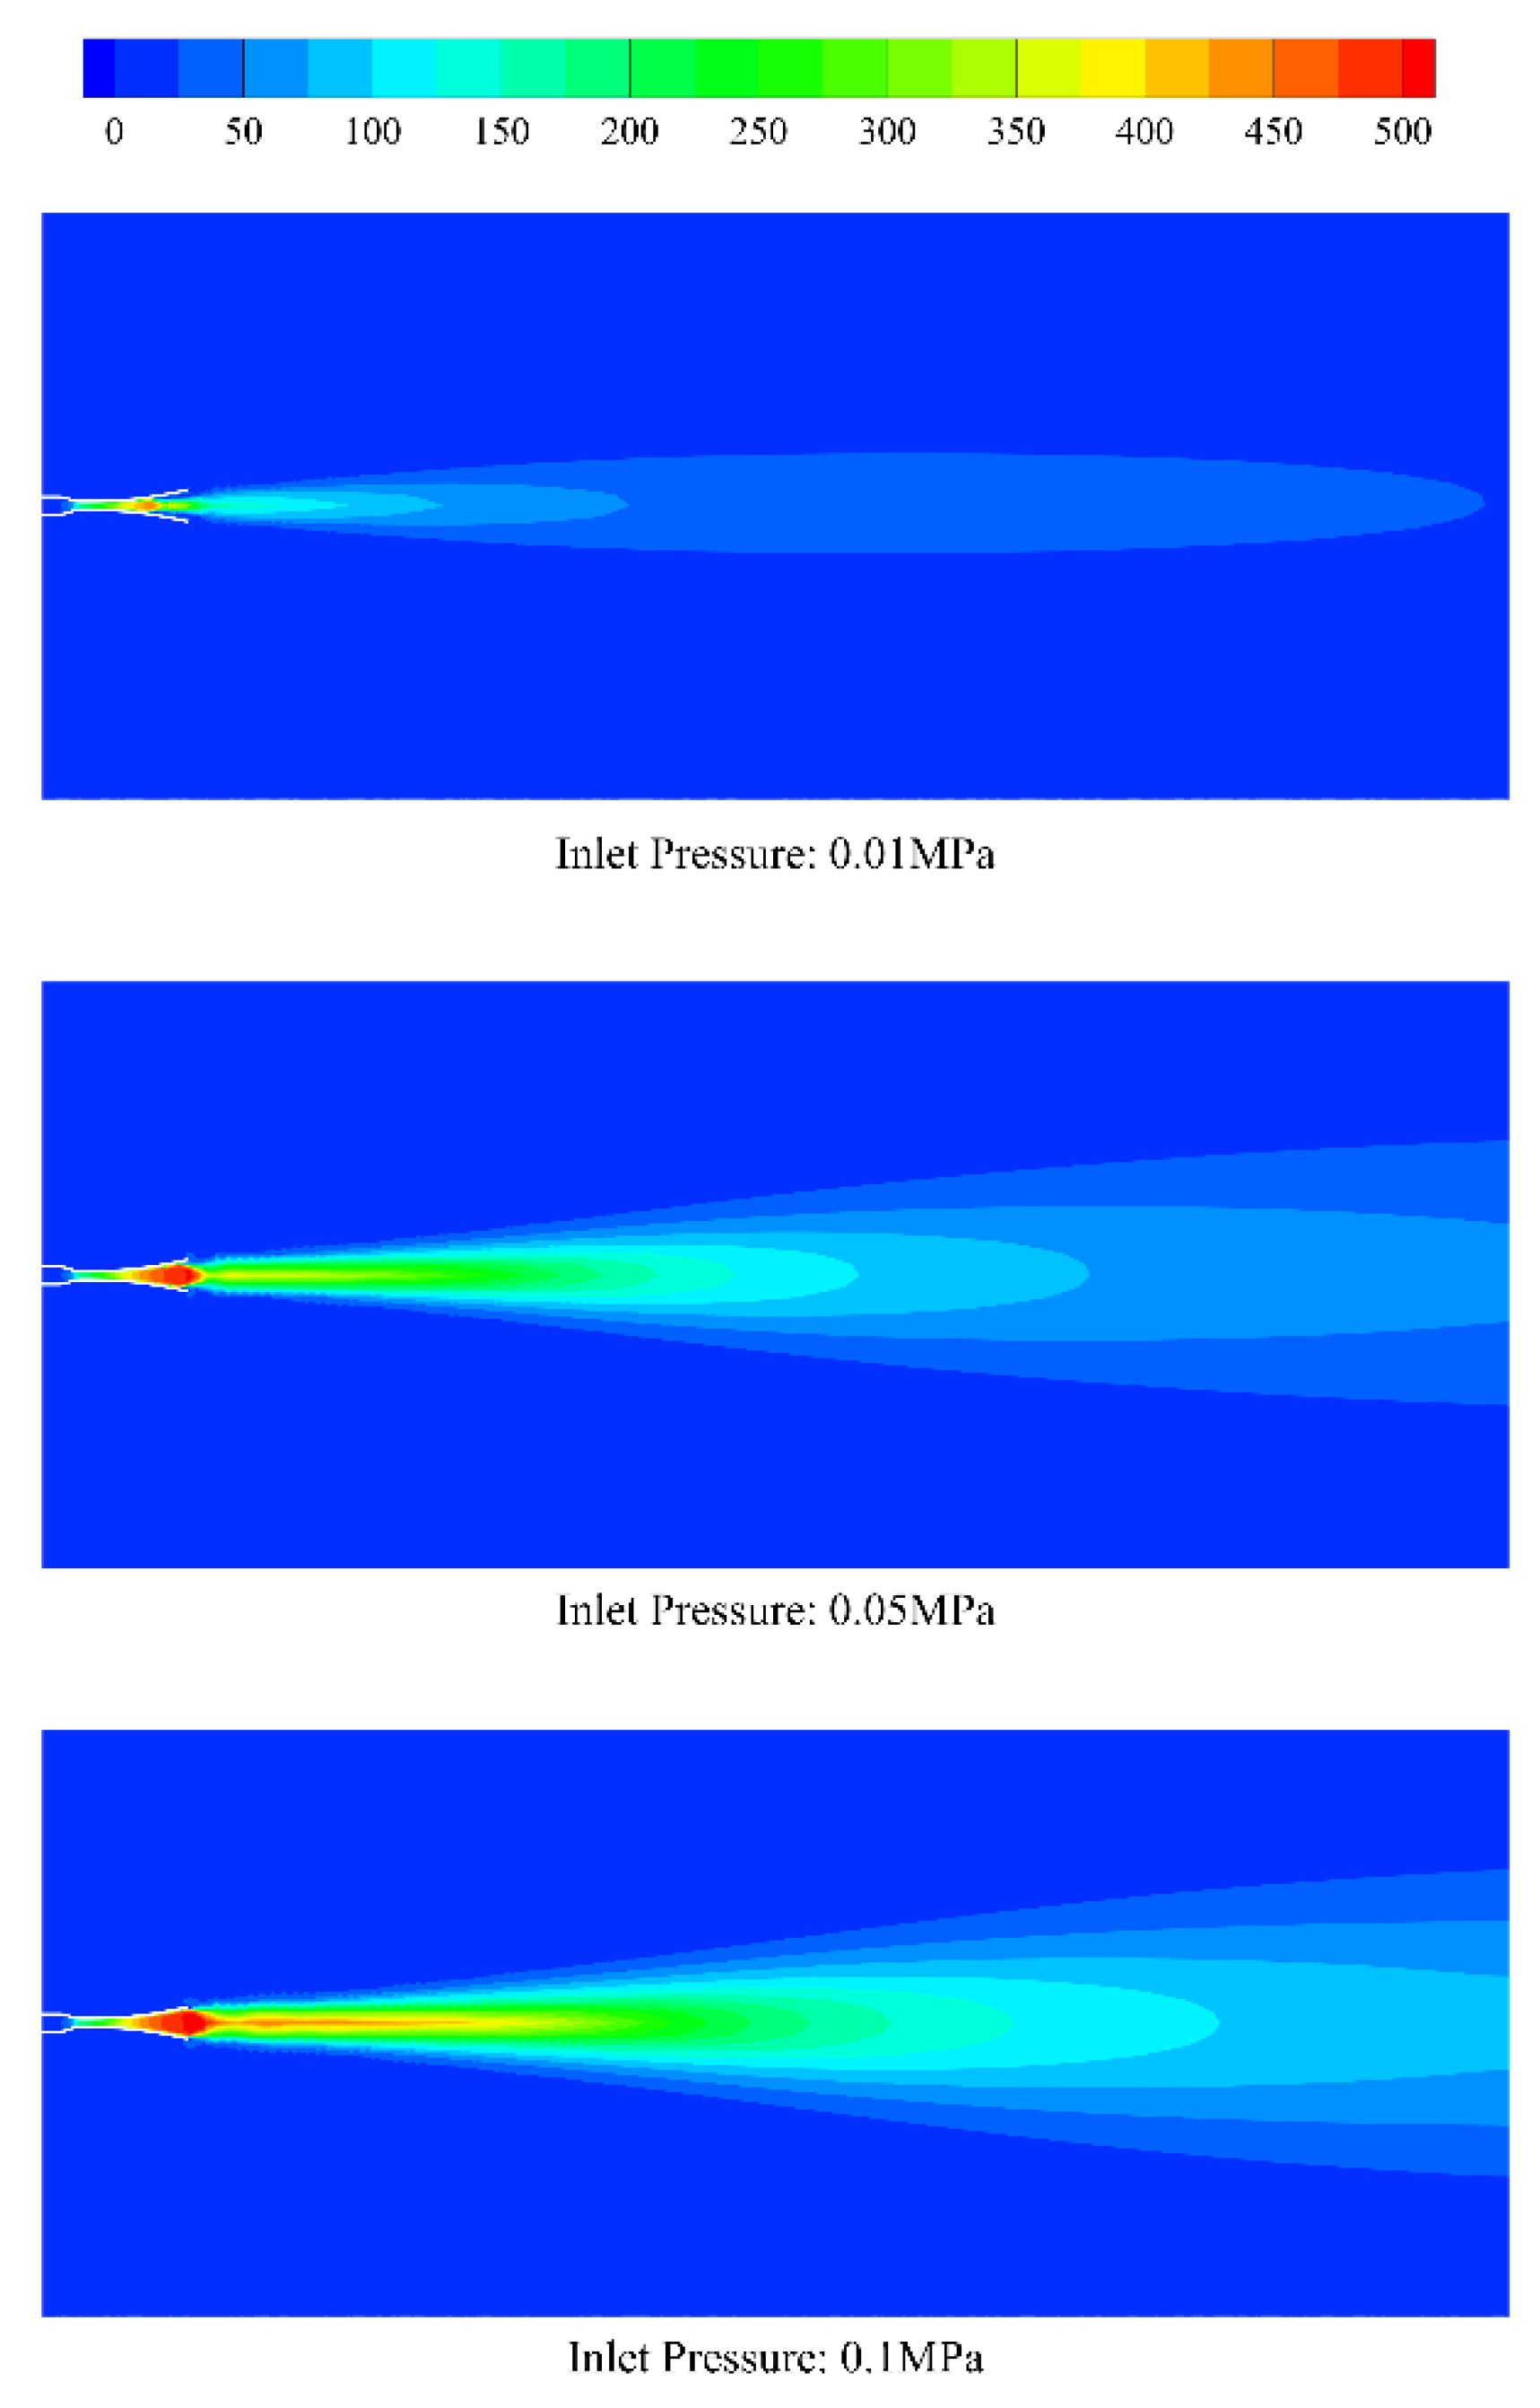
Figure 3, the increase of the outlet aperture increases the mass flow of the ejected air and the expansion area. This results in more adequate mixing of the gas. Moreover, the axial attenuation of the gas flow is faster for the nozzle with a larger outlet aperture. In contrast, as shown in Figure 4, the gas flow from the Laval nozzle is more stable, and the axial velocity gradient of gas flow is relatively small. Thus, it implies a longer settling chamber.
Next, we compare the ejection characteristics of the three different ejector nozzles. The detailed data are shown in Table 3.
Compared with the other two nozzles, the Laval nozzle has the largest ejection coefficient under supercritical conditions. Since the gas has accelerated to the sound velocity before reaching the outlet of the nozzle, the mass flow rate of the nozzle is directly limited by the size of the cross-sectional area of the outlet. For the convergent nozzle, the increase of the throat area is helpful for increasing the ejected gas flow rate but reduces the ejection coefficient.
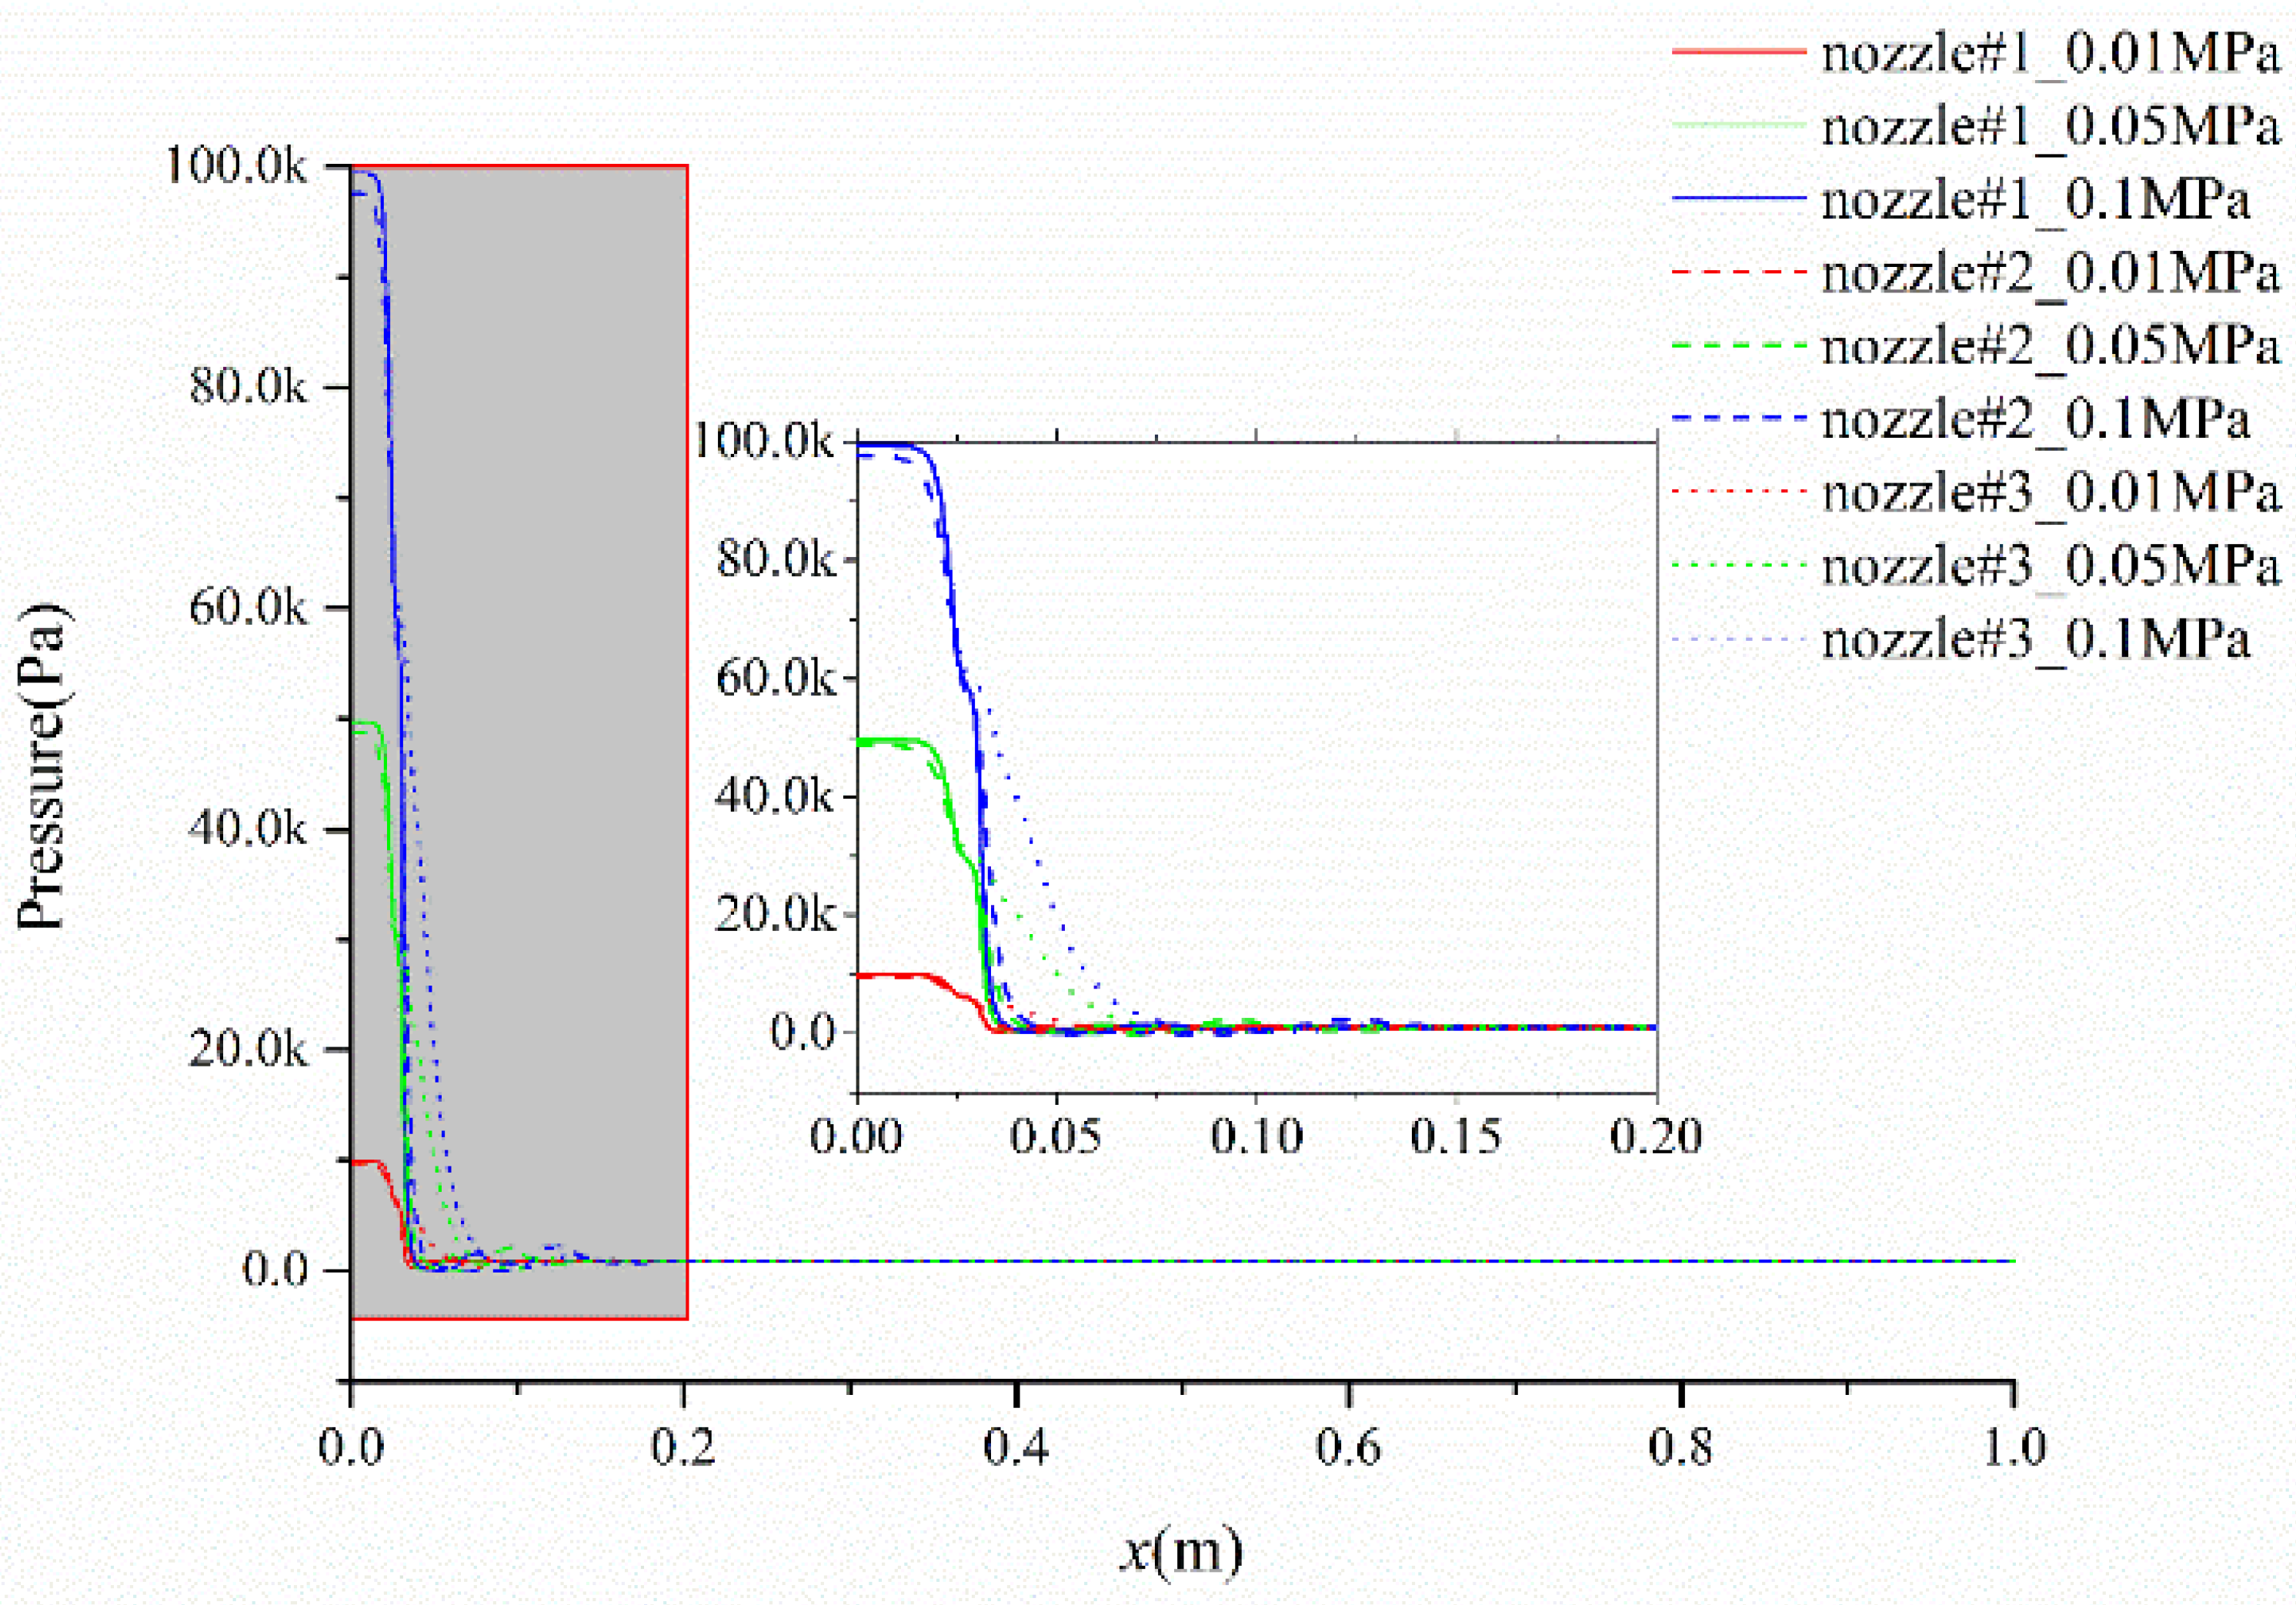
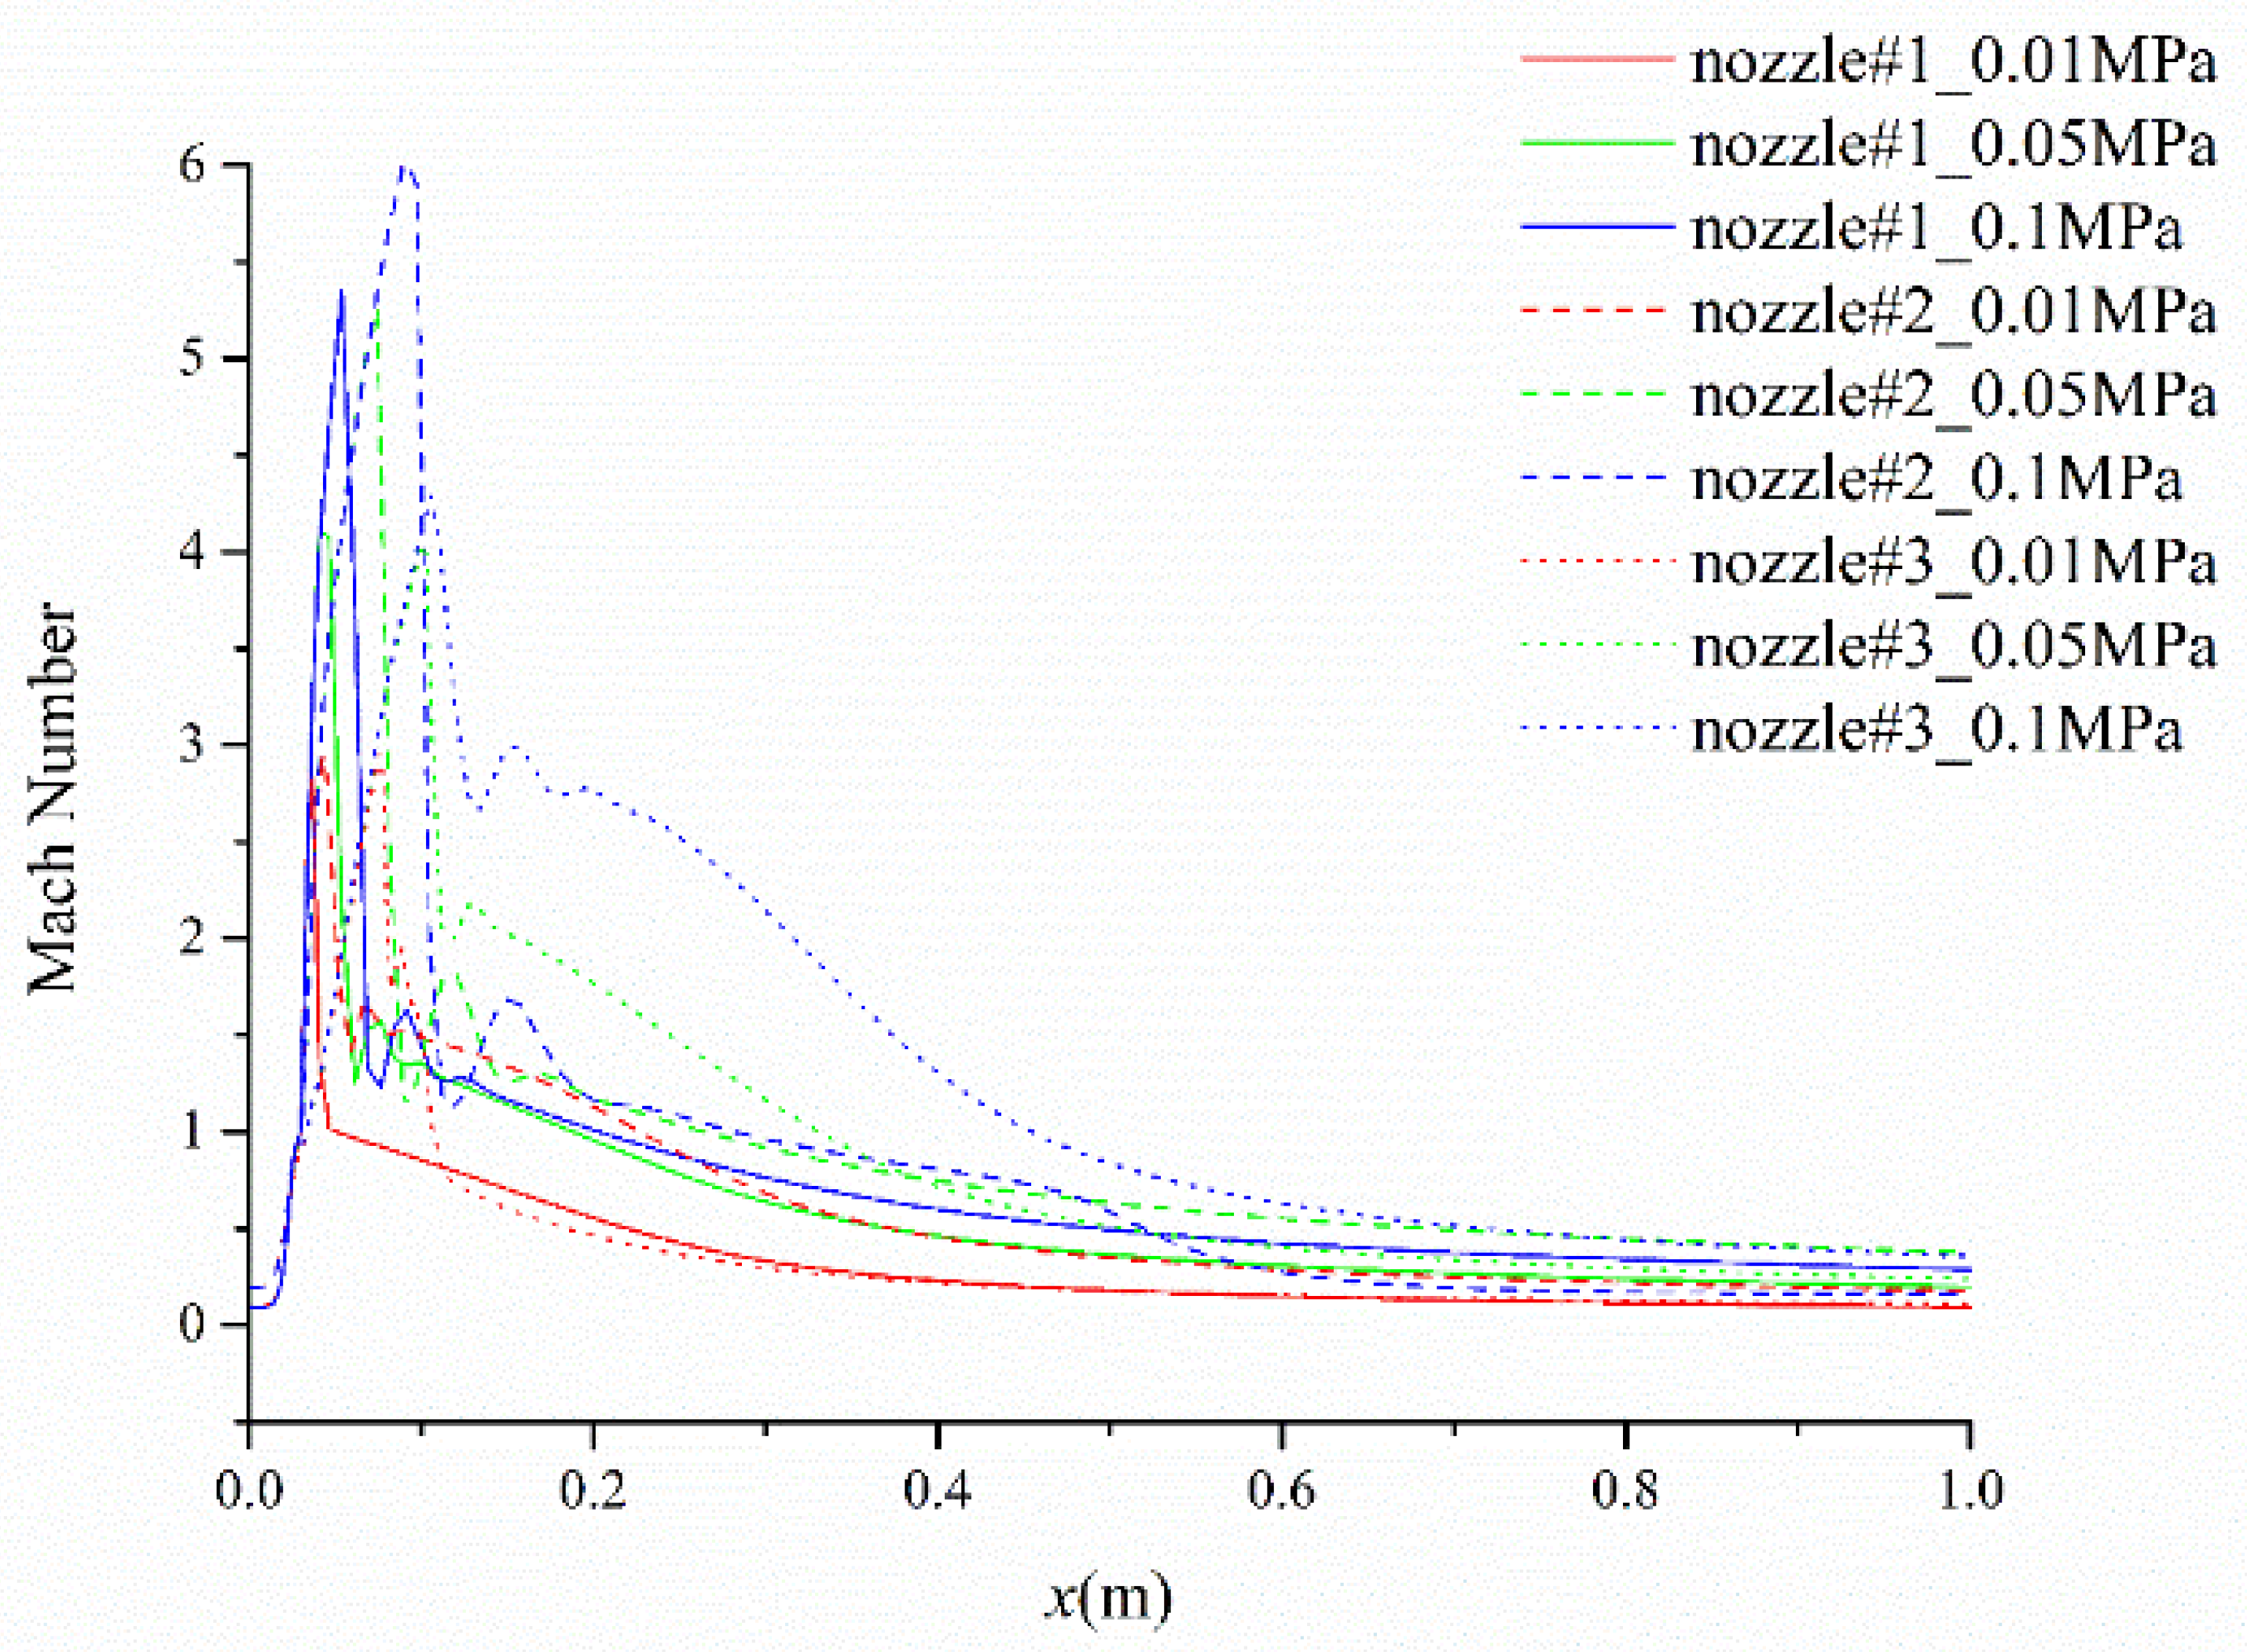
To demonstrate the stability of the gas flow ejected by the three nozzles, (1) the static pressure distribution and (2) the Mach numbers along the nozzle outlet axis are plotted as shown in Figure 5 and Figure 6.
For the convergent nozzles, the static pressure changes are similar, and both reach a relatively stable value at x = 0.05 m. Due to the high upstream pressure, the gas flow reaches the sound speed at the throat of the nozzles, and then forms the supersonic flow. Combined with the velocity distribution shown in Figure 2, Figure 3 and Figure 4, it can be found that the supersonic flow is decelerated by the shock waves at the outlet of the nozzle. For the Laval nozzle, the change of the ejected gas flow is the most stable compared to the other two nozzles, but the gas flow requires a longer distance to stabilize.
At the same upstream pressure, the outlet gas velocity changes of the three nozzles are not the same. There are two main reasons for this: (1) the difference in the mass flow rate of the mixed flow, and (2) the difference in the radial flow distribution. The 2# nozzle has the largest mixed gas mass flow rate with a relatively small axial velocity. This means that the mixed gas flow of the 2# nozzle has the best diffusion effect in the radial direction and its gas flow mixing is the most uniform.
After a comprehensive comparison, the 2# nozzle is considered to be the most suitable for this Mars wind tunnel.

3.2. Contraction Curve

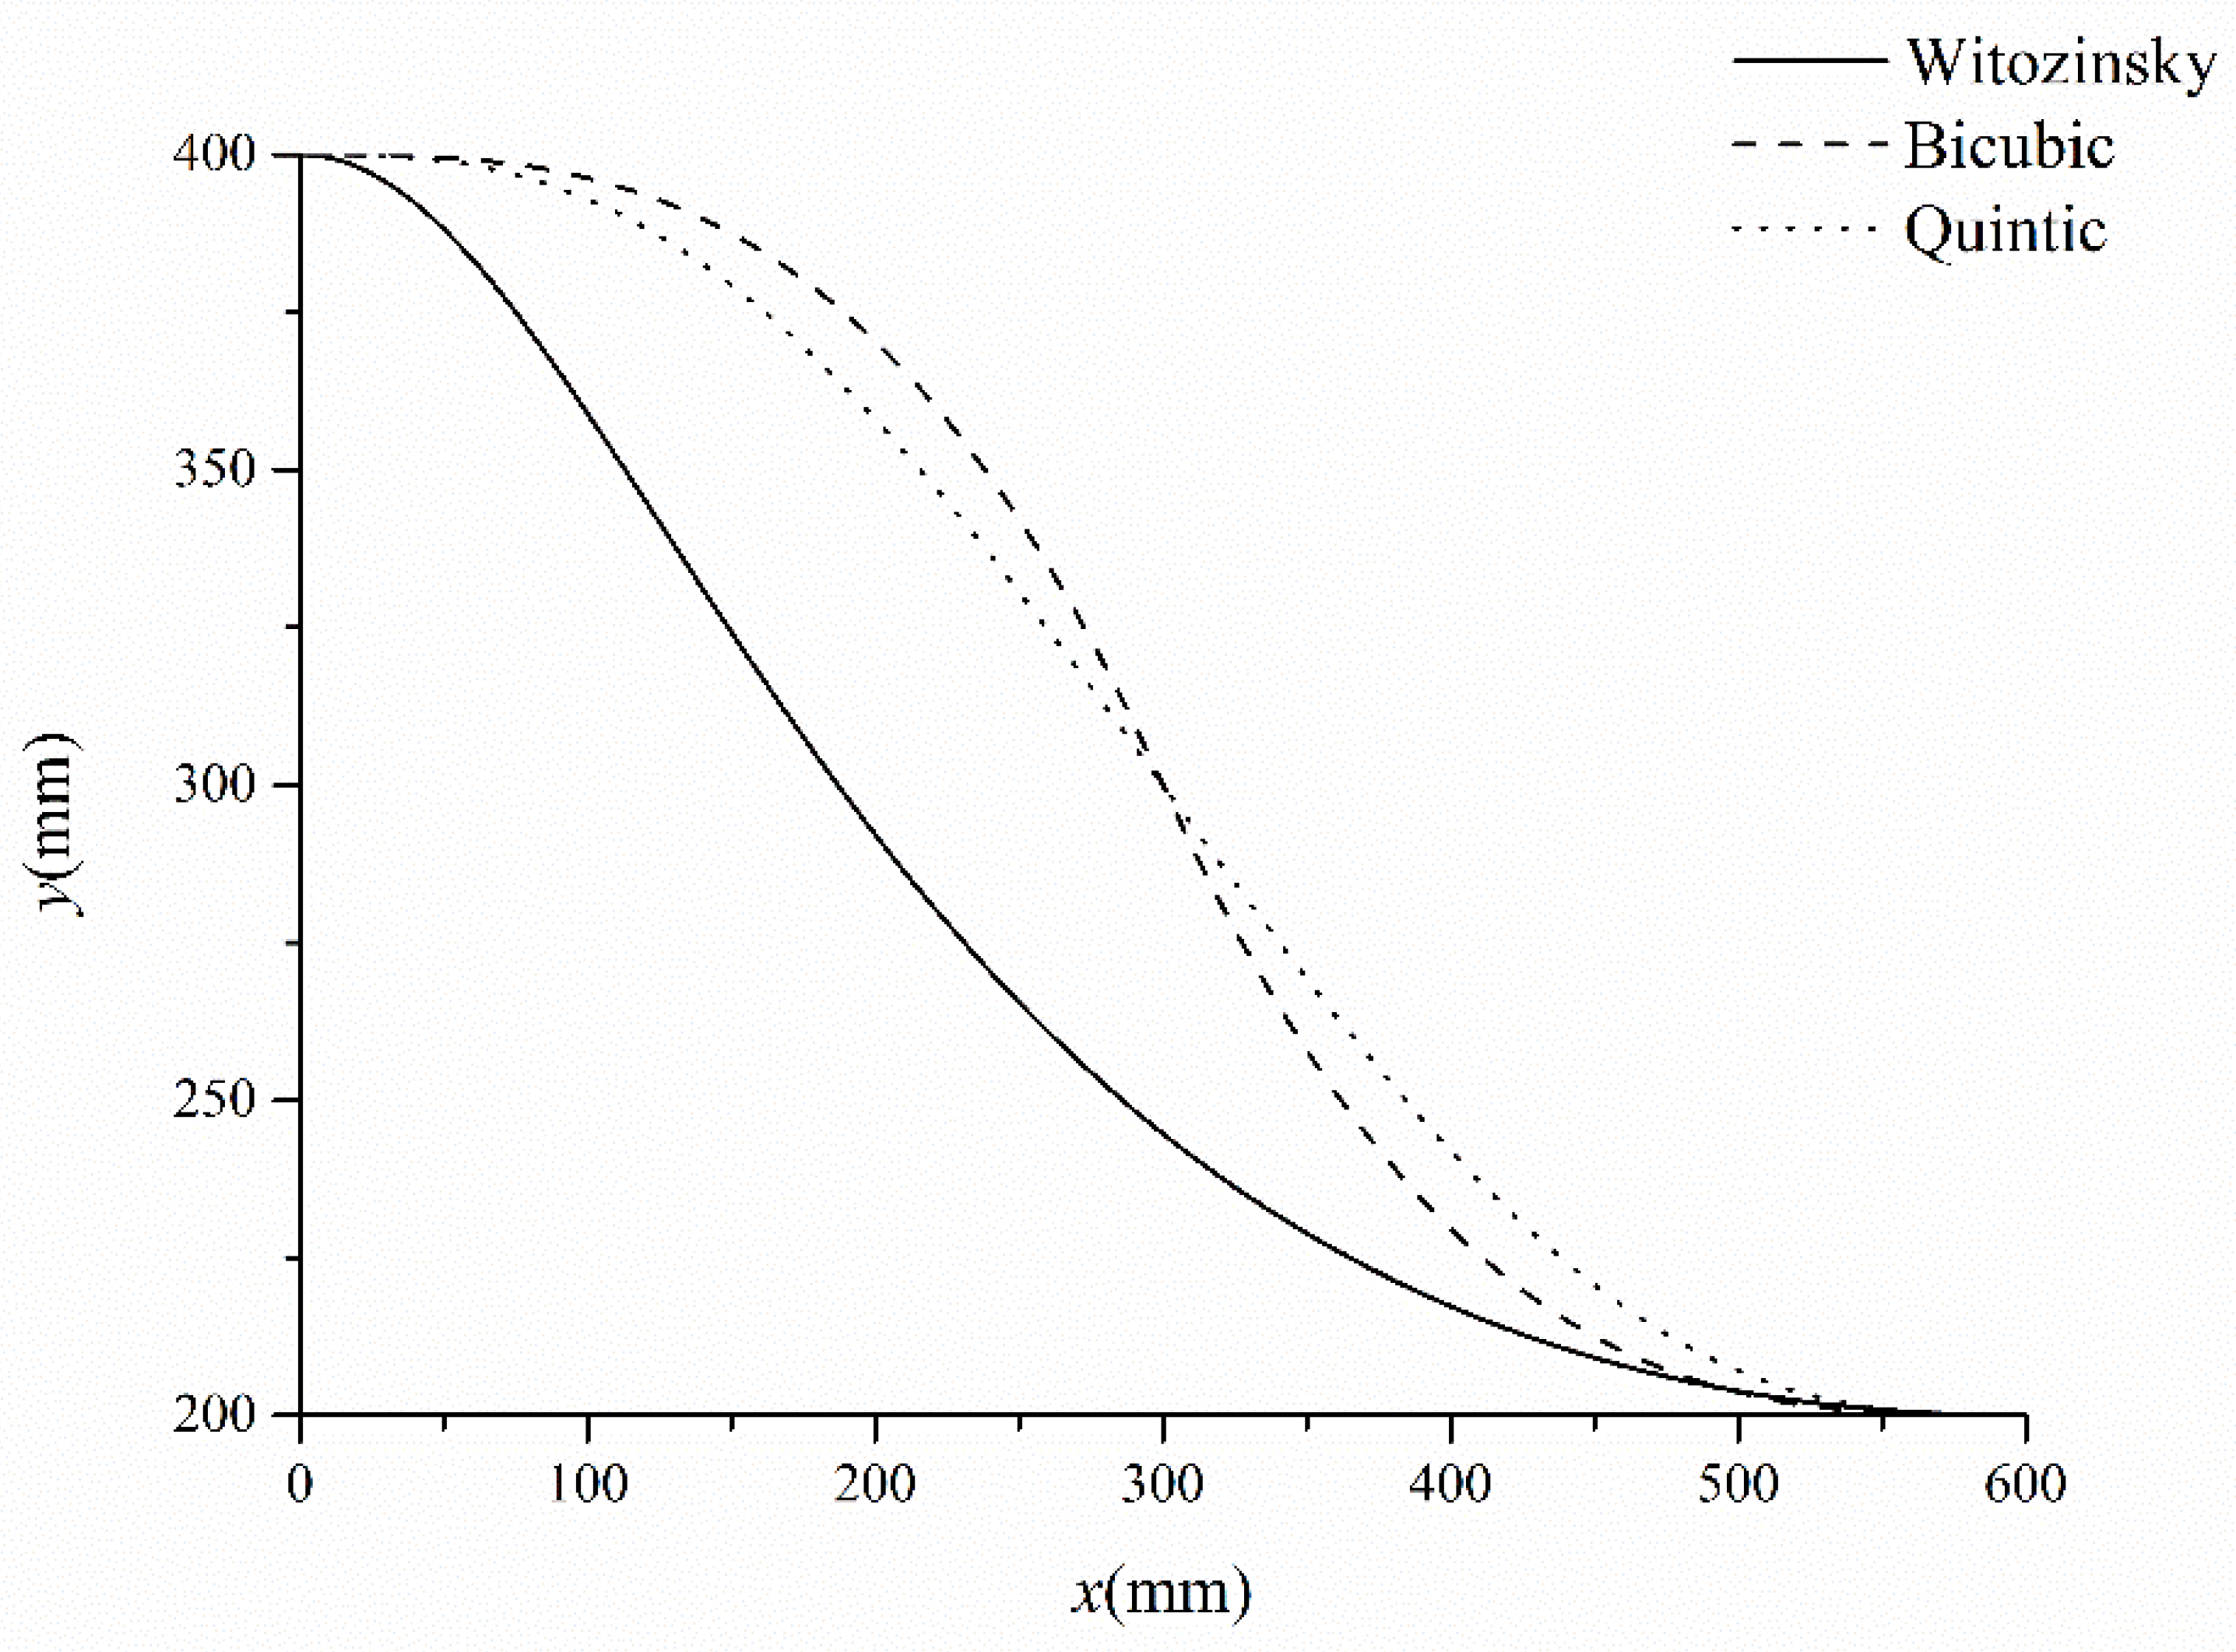
Generally, there are three alternative curves that are available for the contraction section: the Witozinsky curve, the bicubic curve, and the quintic curve [46]. Figure 7 shows the profiles of the three contraction curves. Considering the application of the Mars wind tunnel, the inlet and the outlet of the contraction should be relatively stable with a small gradient to stabilize the gas flow. From Figure 7 we can find that the gradient of the inlet of the Witozinsky curve is large and the outlet is small, and it is just the opposite for the bicubic curve and the quintic curve. However, the question of which of these curves is most suitable for the Mars wind tunnel presented in this paper needs further discussion. Thus, we carried out a series of CFD simulations to compare these curves.
Figure 8 is a symmetrical diagram from the ejector assembly to the test section. The inlet of the contraction is 0.8 m × 0.8 m squared. The distance from the ejector assembly to the contractions is 0.9 m, the contraction is 0.6 m long, and the test section is 0.6 m long.
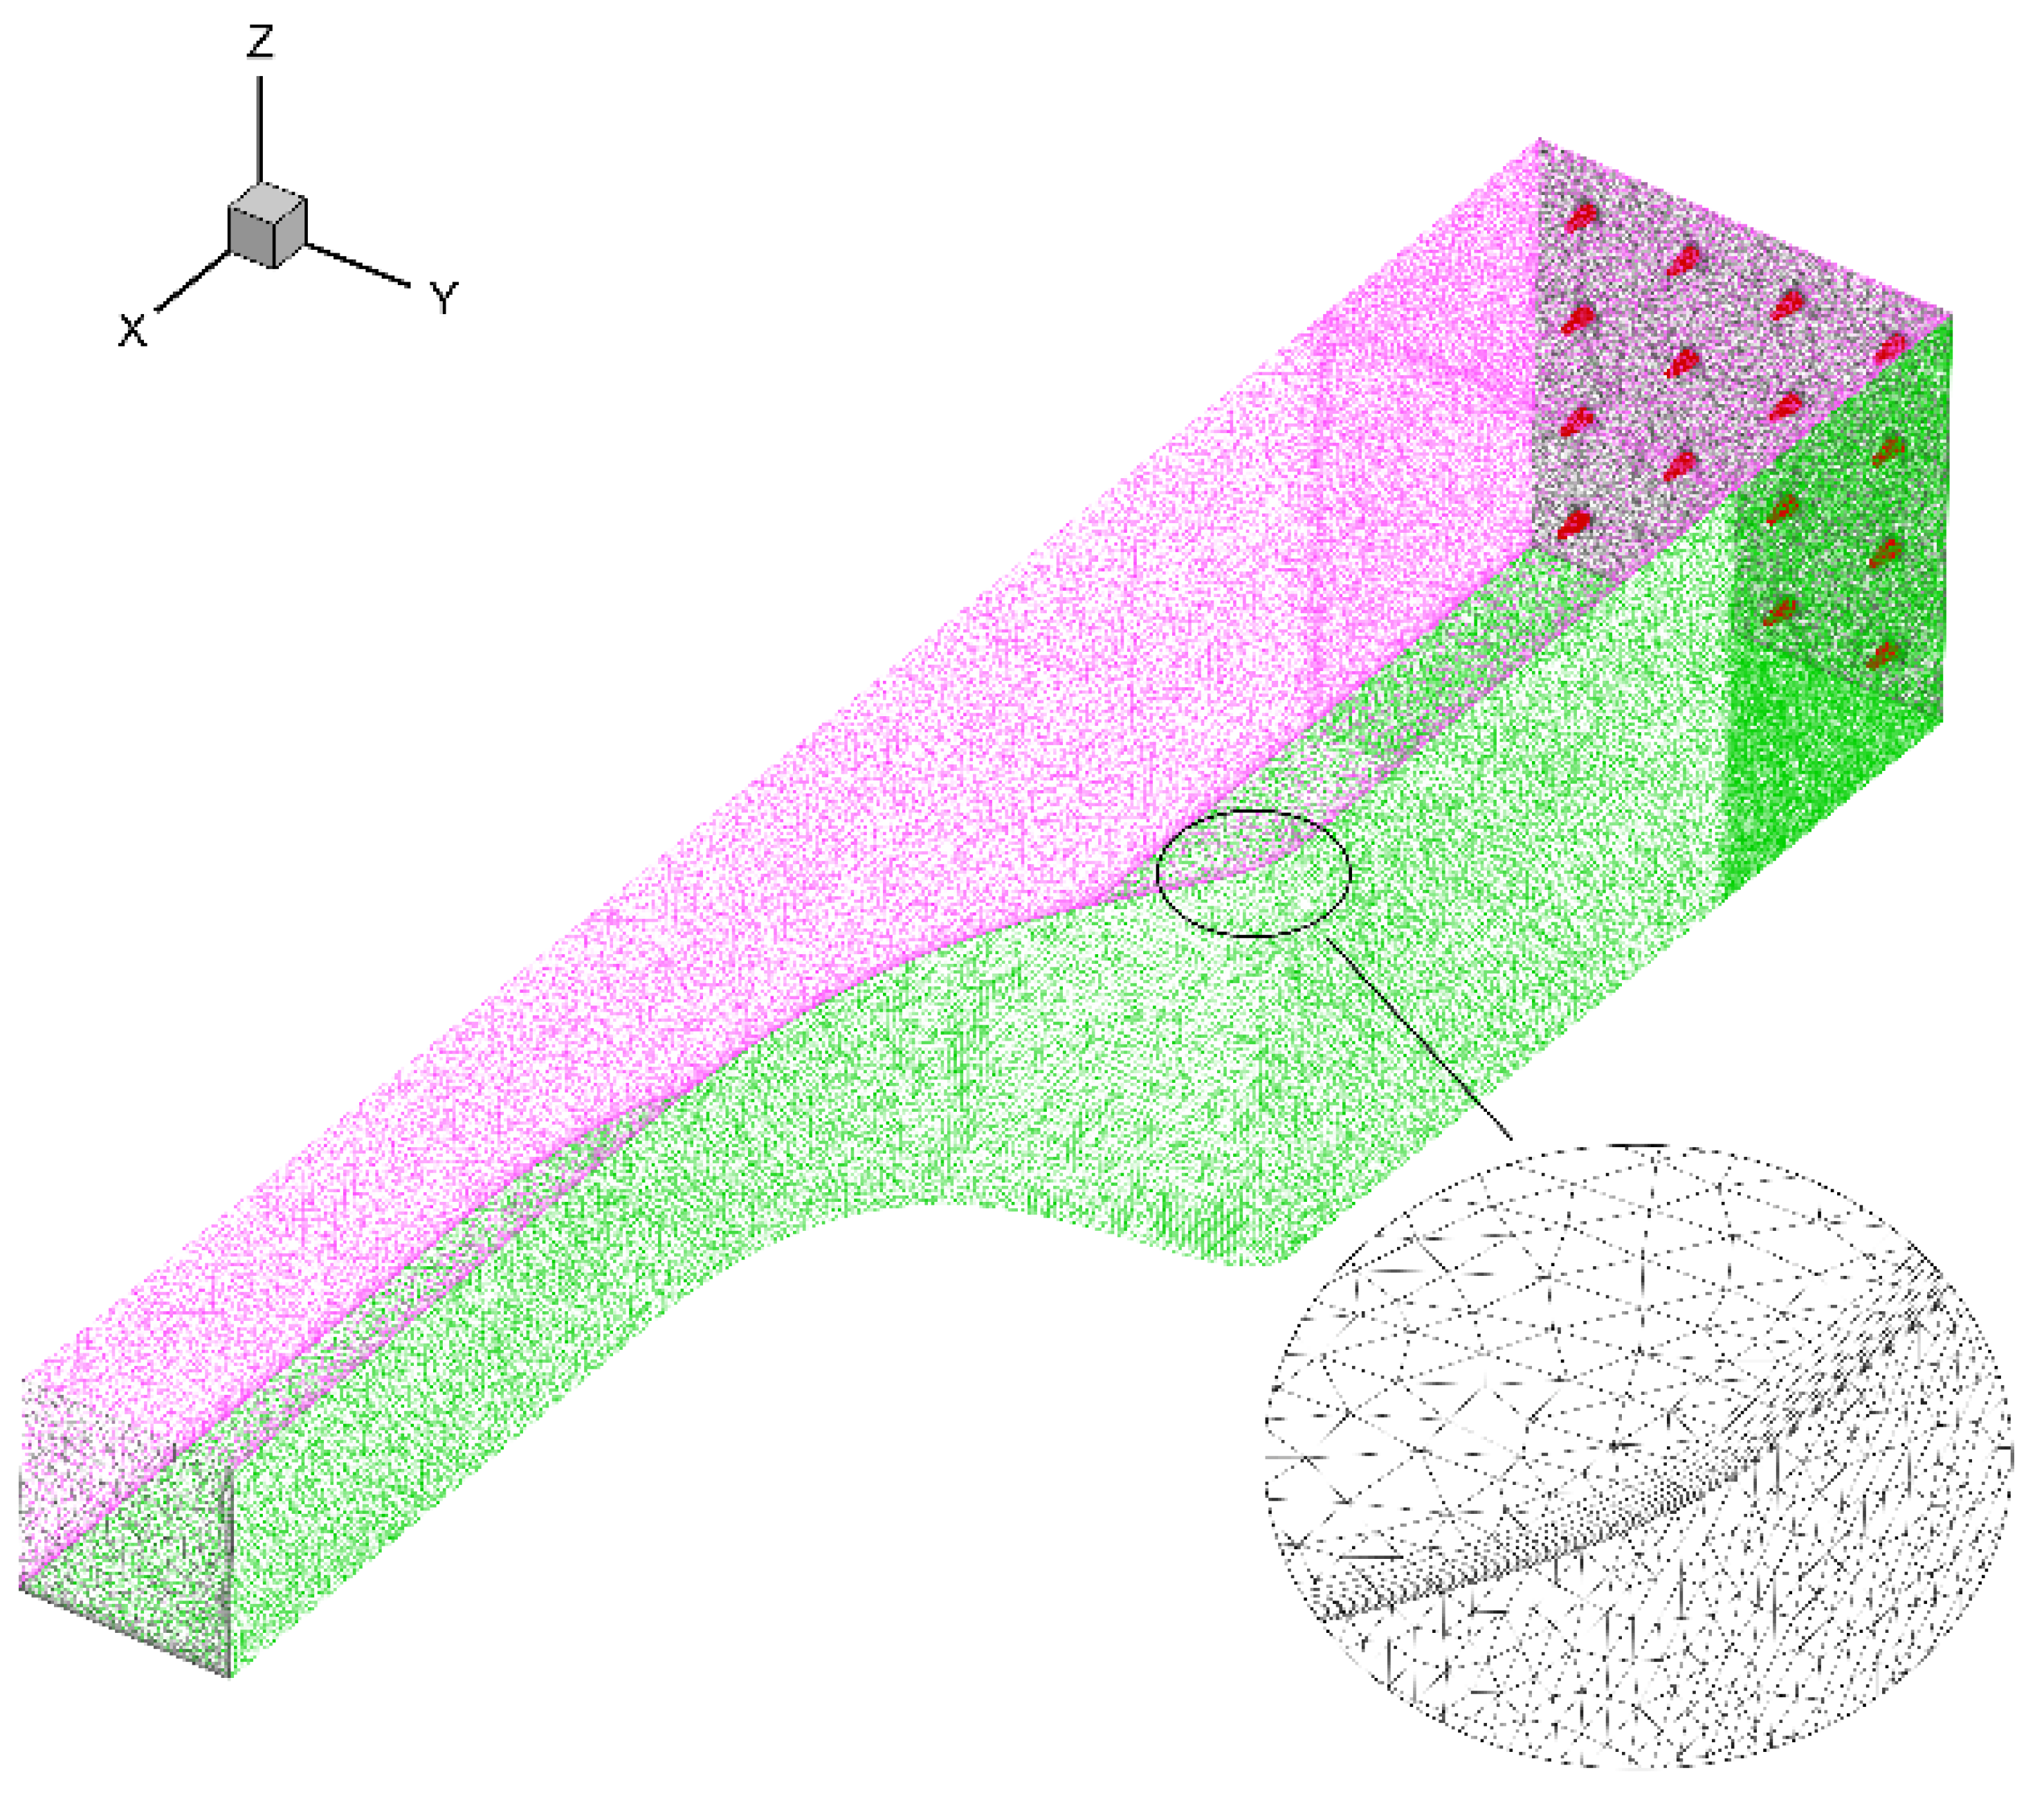
The mesh model of the above sections is shown in Figure 9. Since the structure is axisymmetric, only a 1/4-size model is built. 
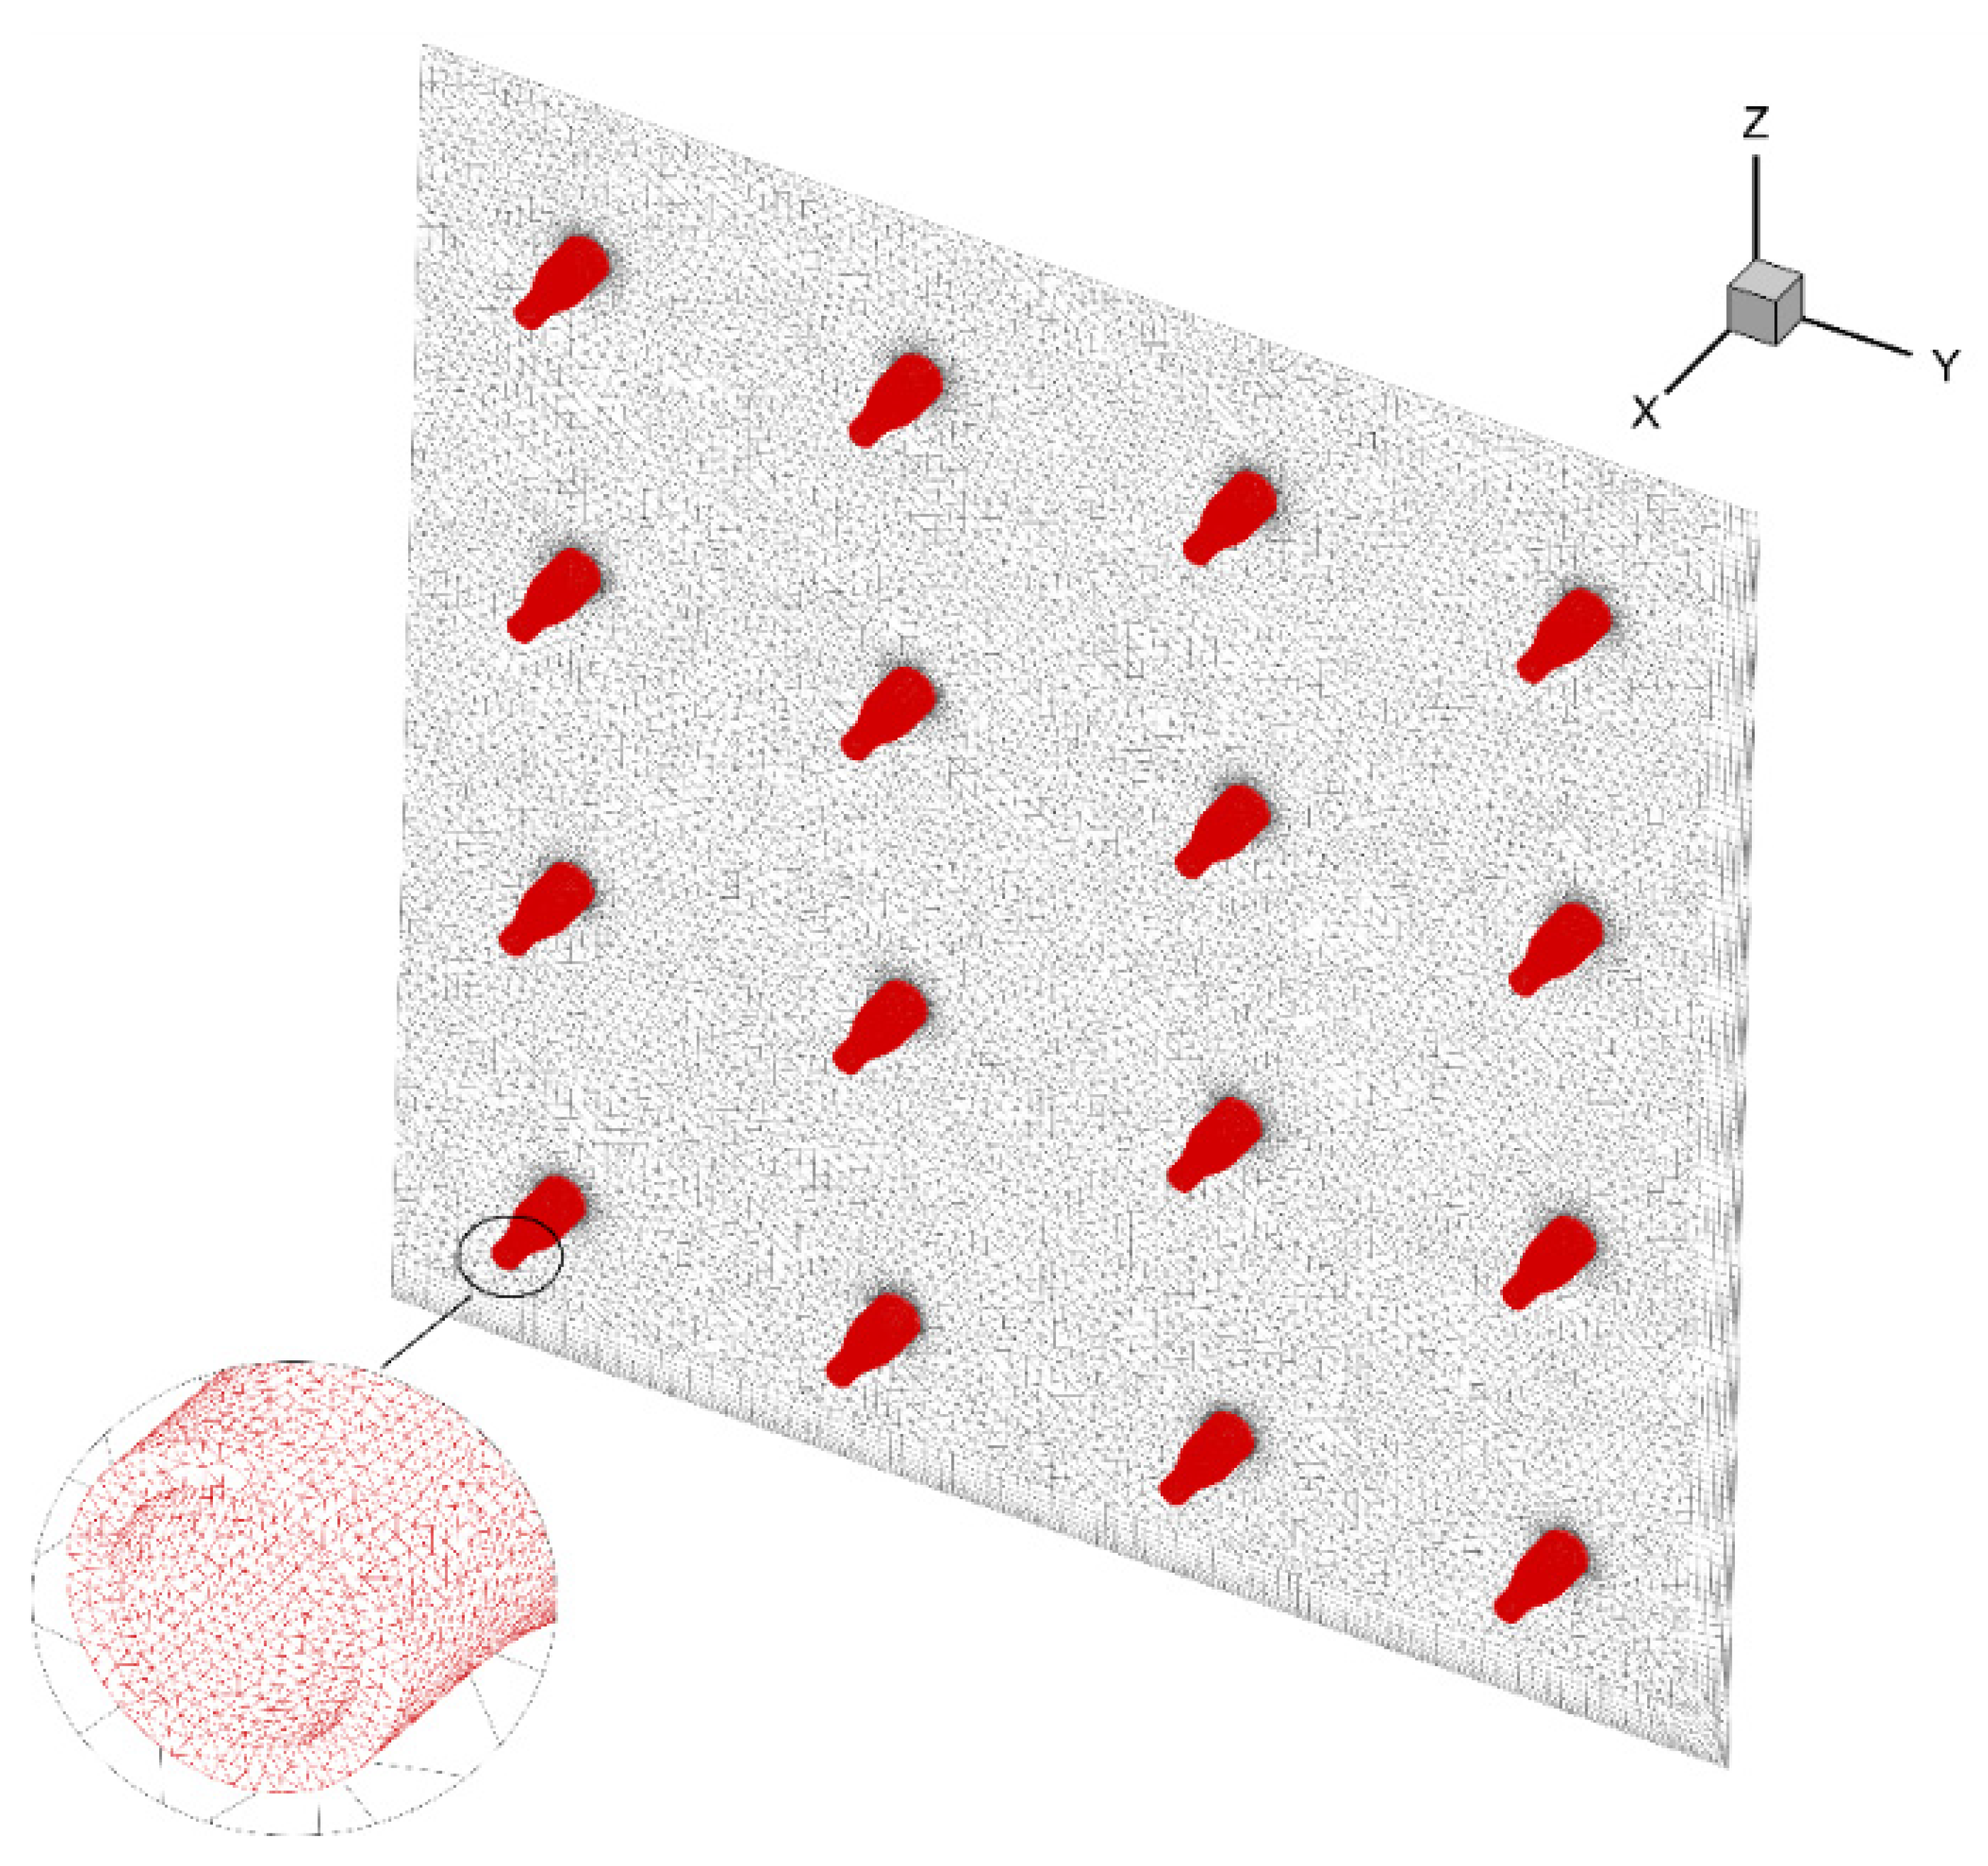
Figure 10 shows the inlet nozzles of the Mars wind tunnel. Based on the previous discussion, we utilize the 2# nozzle here. Comparing the flow field of the 2# nozzle and the size of the contraction, we distribute the 64 nozzles (8 × 8) evenly at the inlet of the tunnel, and the spacing between each nozzle is 0.1 m. As the mesh model in Figure 9. is 1/4 of the actual size, only 16 nozzles are shown in Figure 10.
Hexahedral structured mesh is used in the fluid domain, and the mesh at the wall is refined. The grid-independence analysis is carried out, and the total number of grid cells is 1,210,000. The realizable k-epsilon viscous model is employed. The inlets of the nozzles are set as the pressure-inlet. The inlet of the wind tunnel, except the nozzles, is set as the pressure-inlet with a pressure of 900 Pa; the outlet of the test section is set as the pressure-outlet with a pressure of 900 Pa. The solver is selected as the pressure-based coupled-implicit solver.
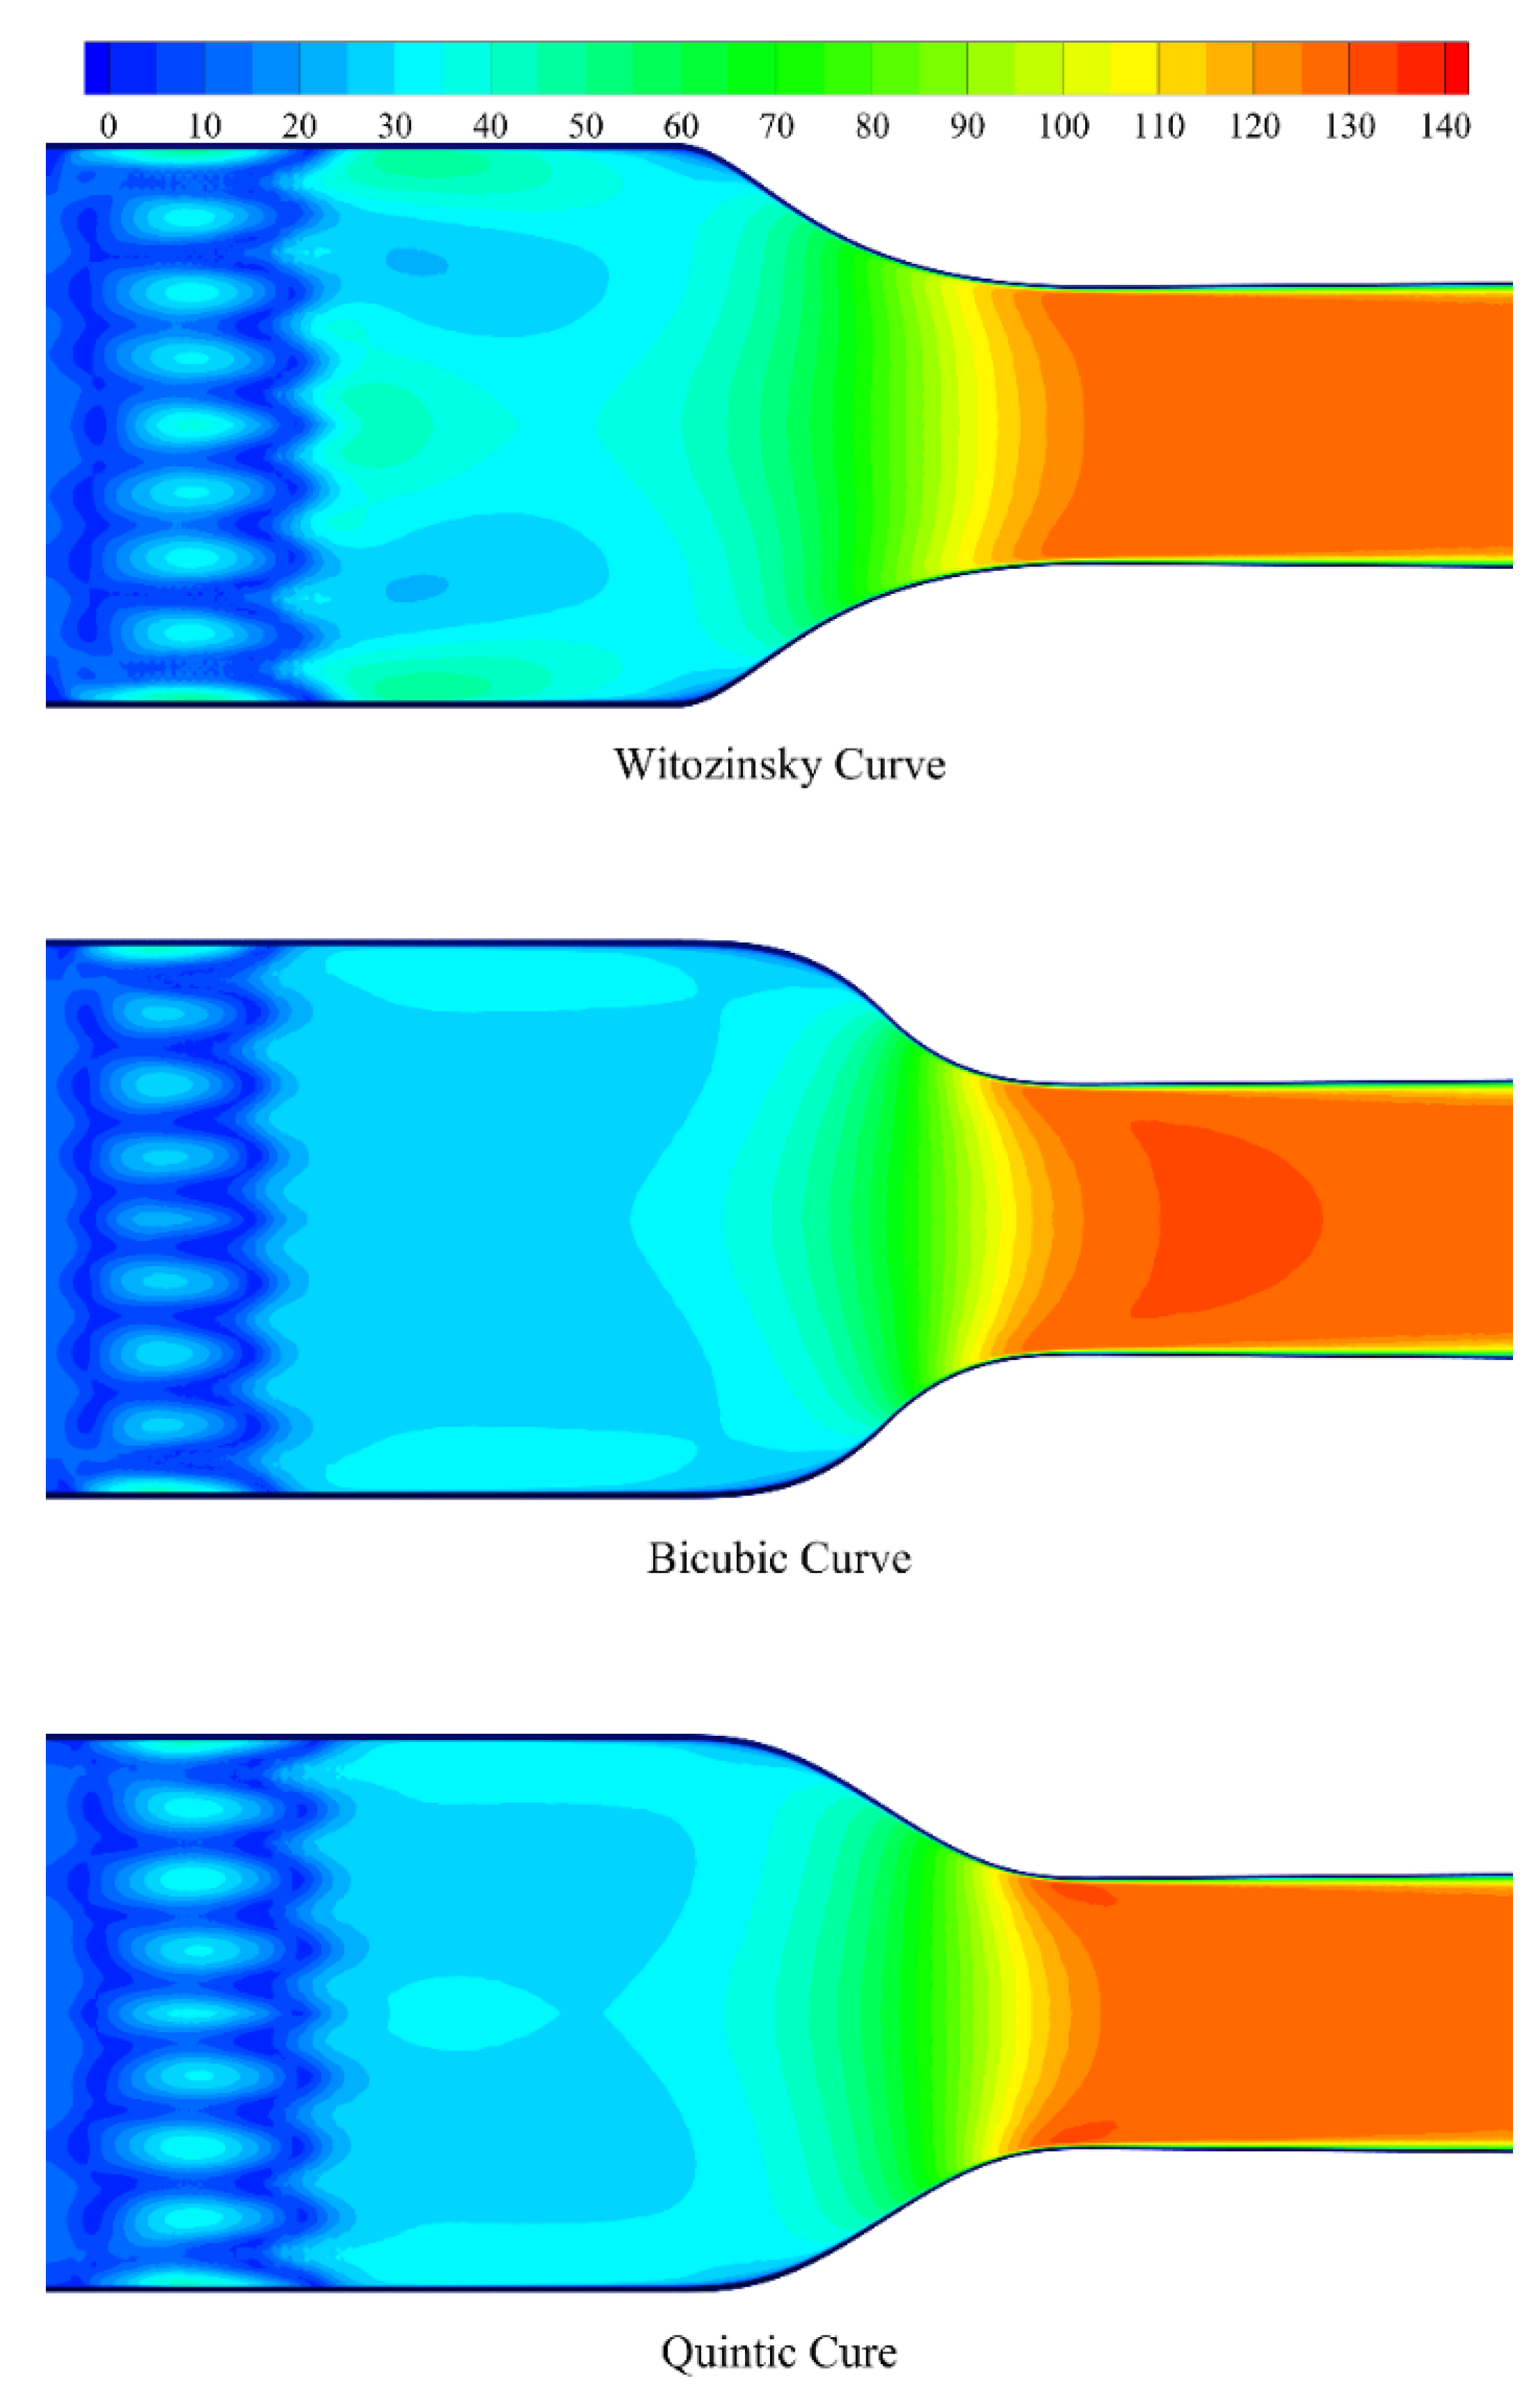
We calculate the velocity distribution of the three wind tunnels with different contractions, then analyze the velocity uniformity and velocity stability of the test sections to find the optimal contraction curve.
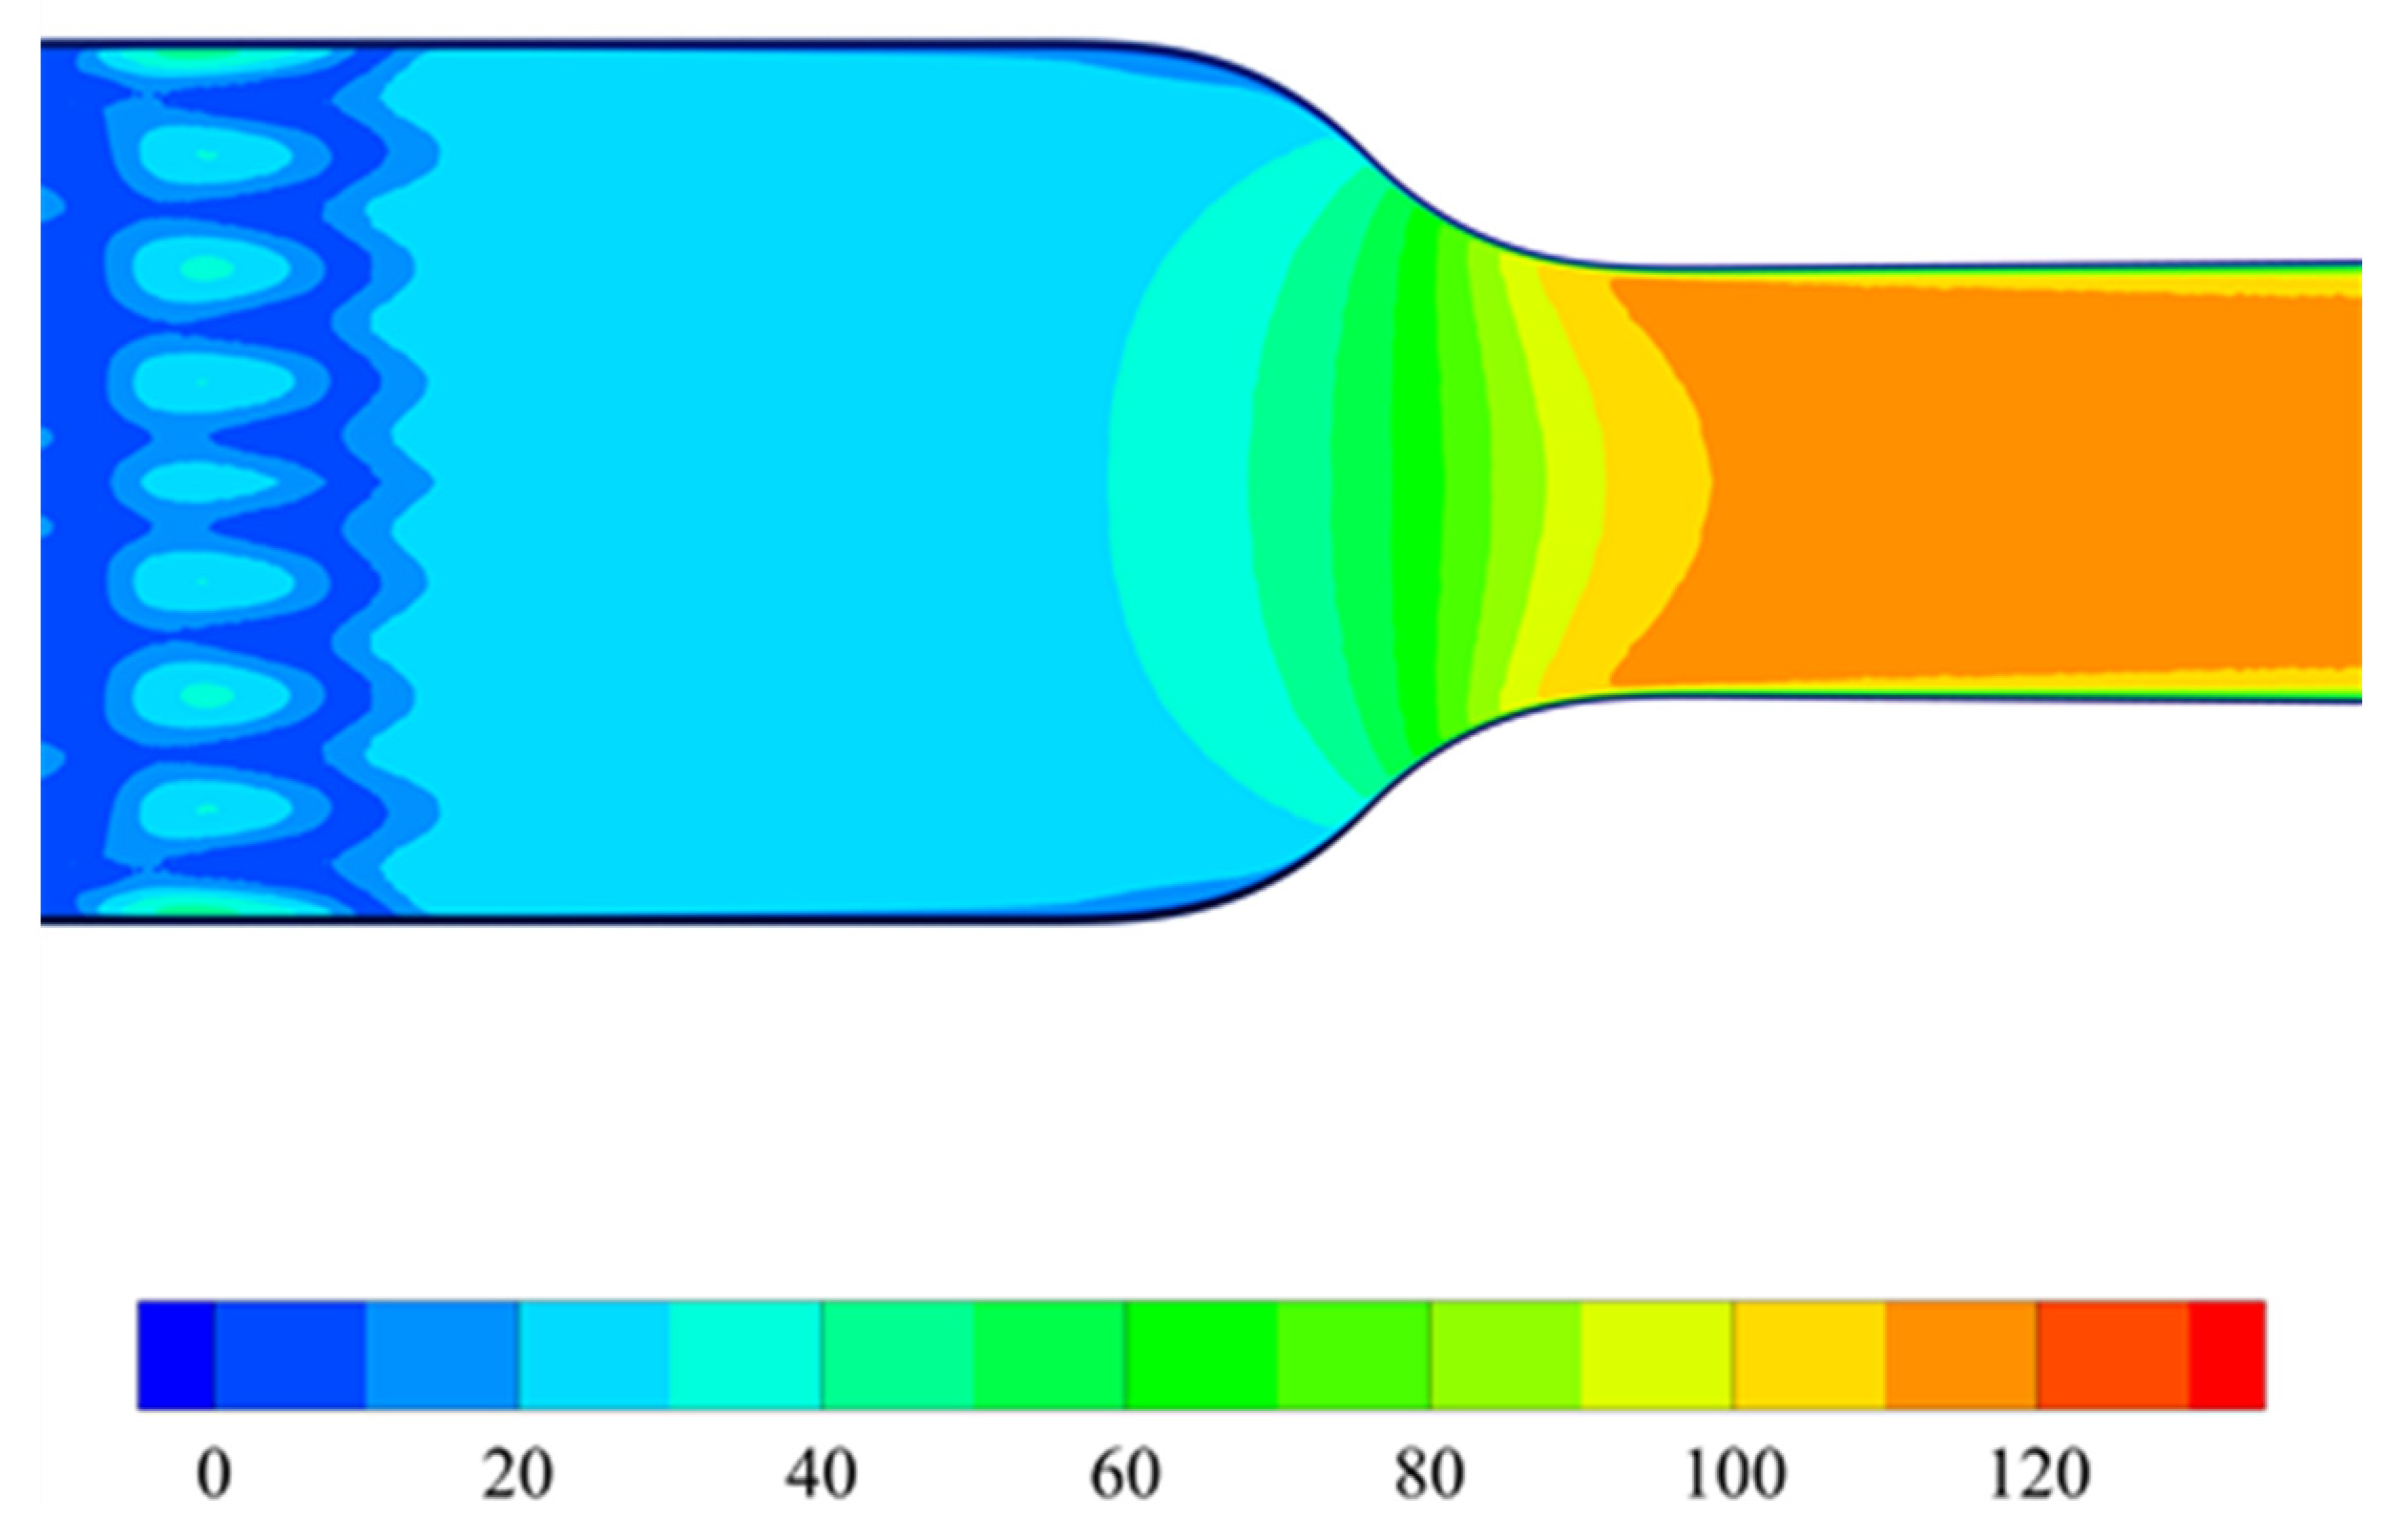
Figure 11 shows the velocity distribution on the symmetry plane of the three wind tunnels. The velocity distribution in the test section seems uniform and can be maintained at about 120 m/s, while the velocity in the contraction with the Witozinsky curve changes more slowly than the others. This helps to uniform the velocity distribution in the radial direction of the test section. Comparatively, the gas velocities in the bicubic curve contraction and the quintic curve contraction change mildly, resulting in poor velocity uniformity in the test section.
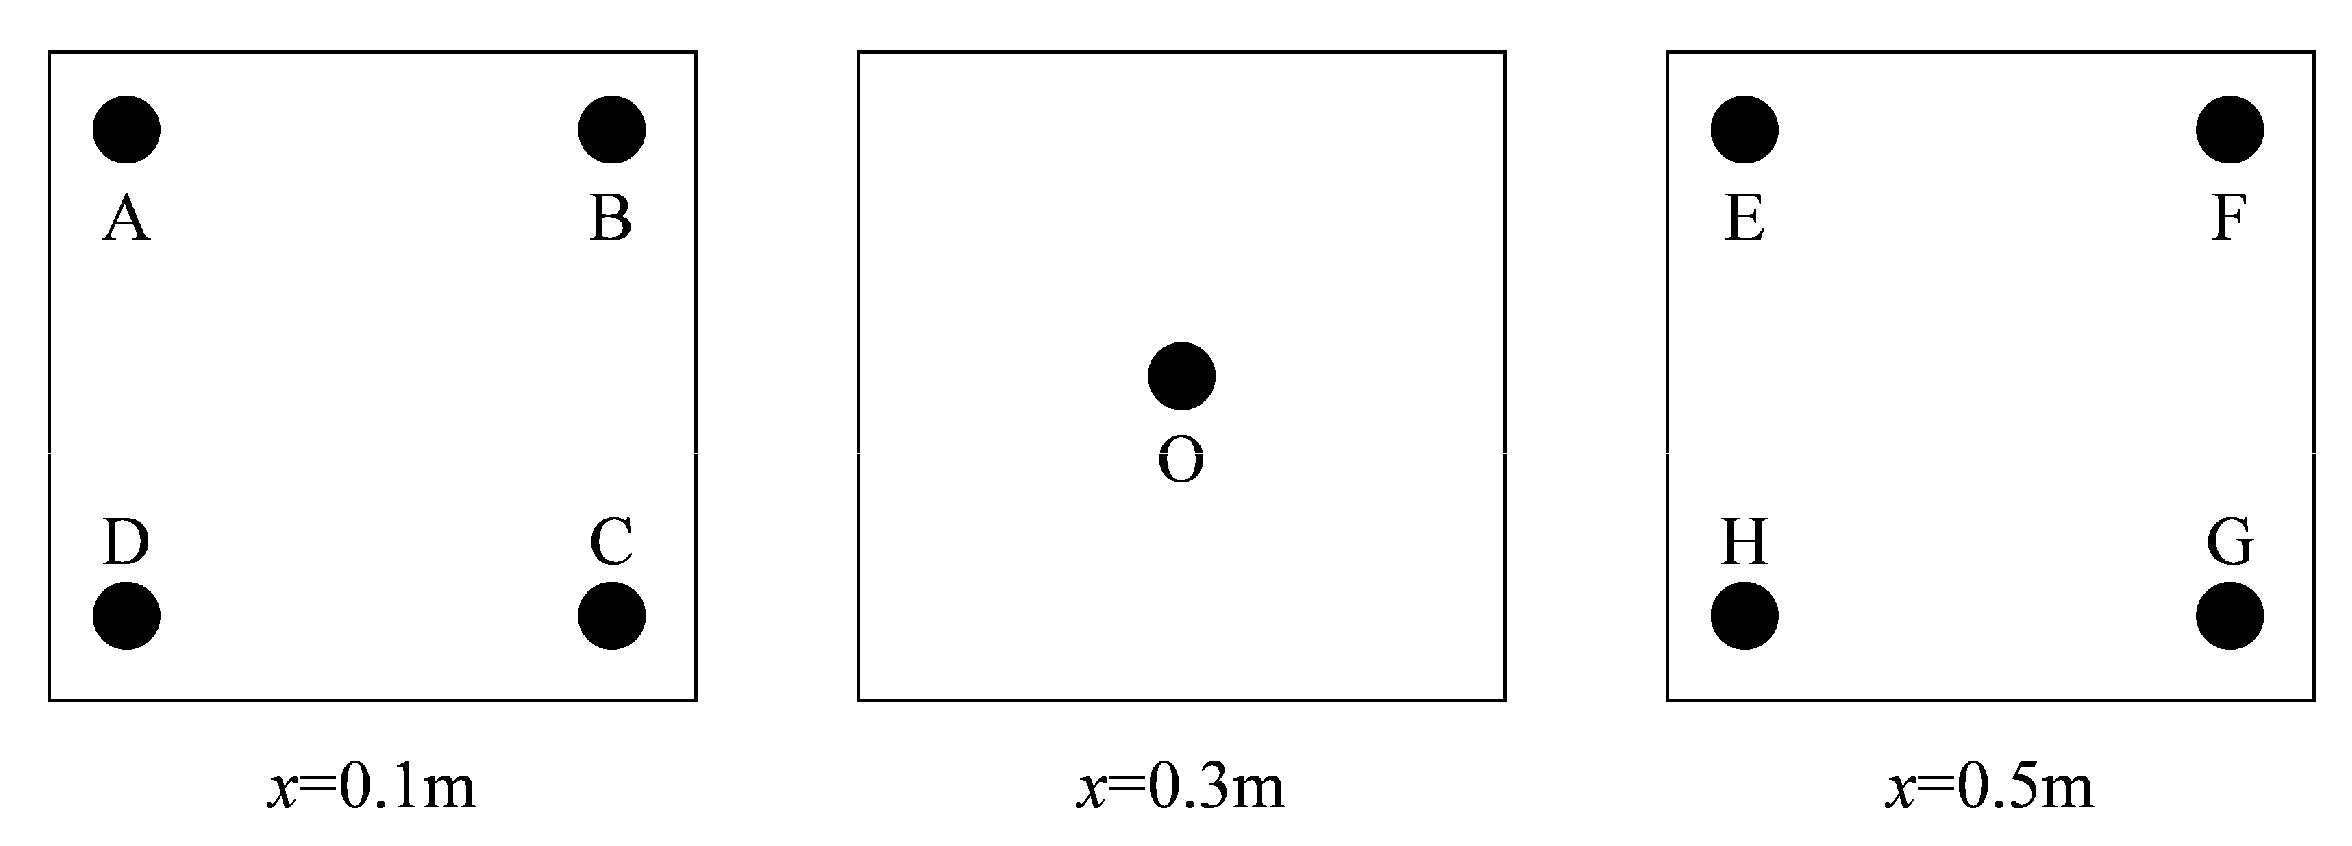
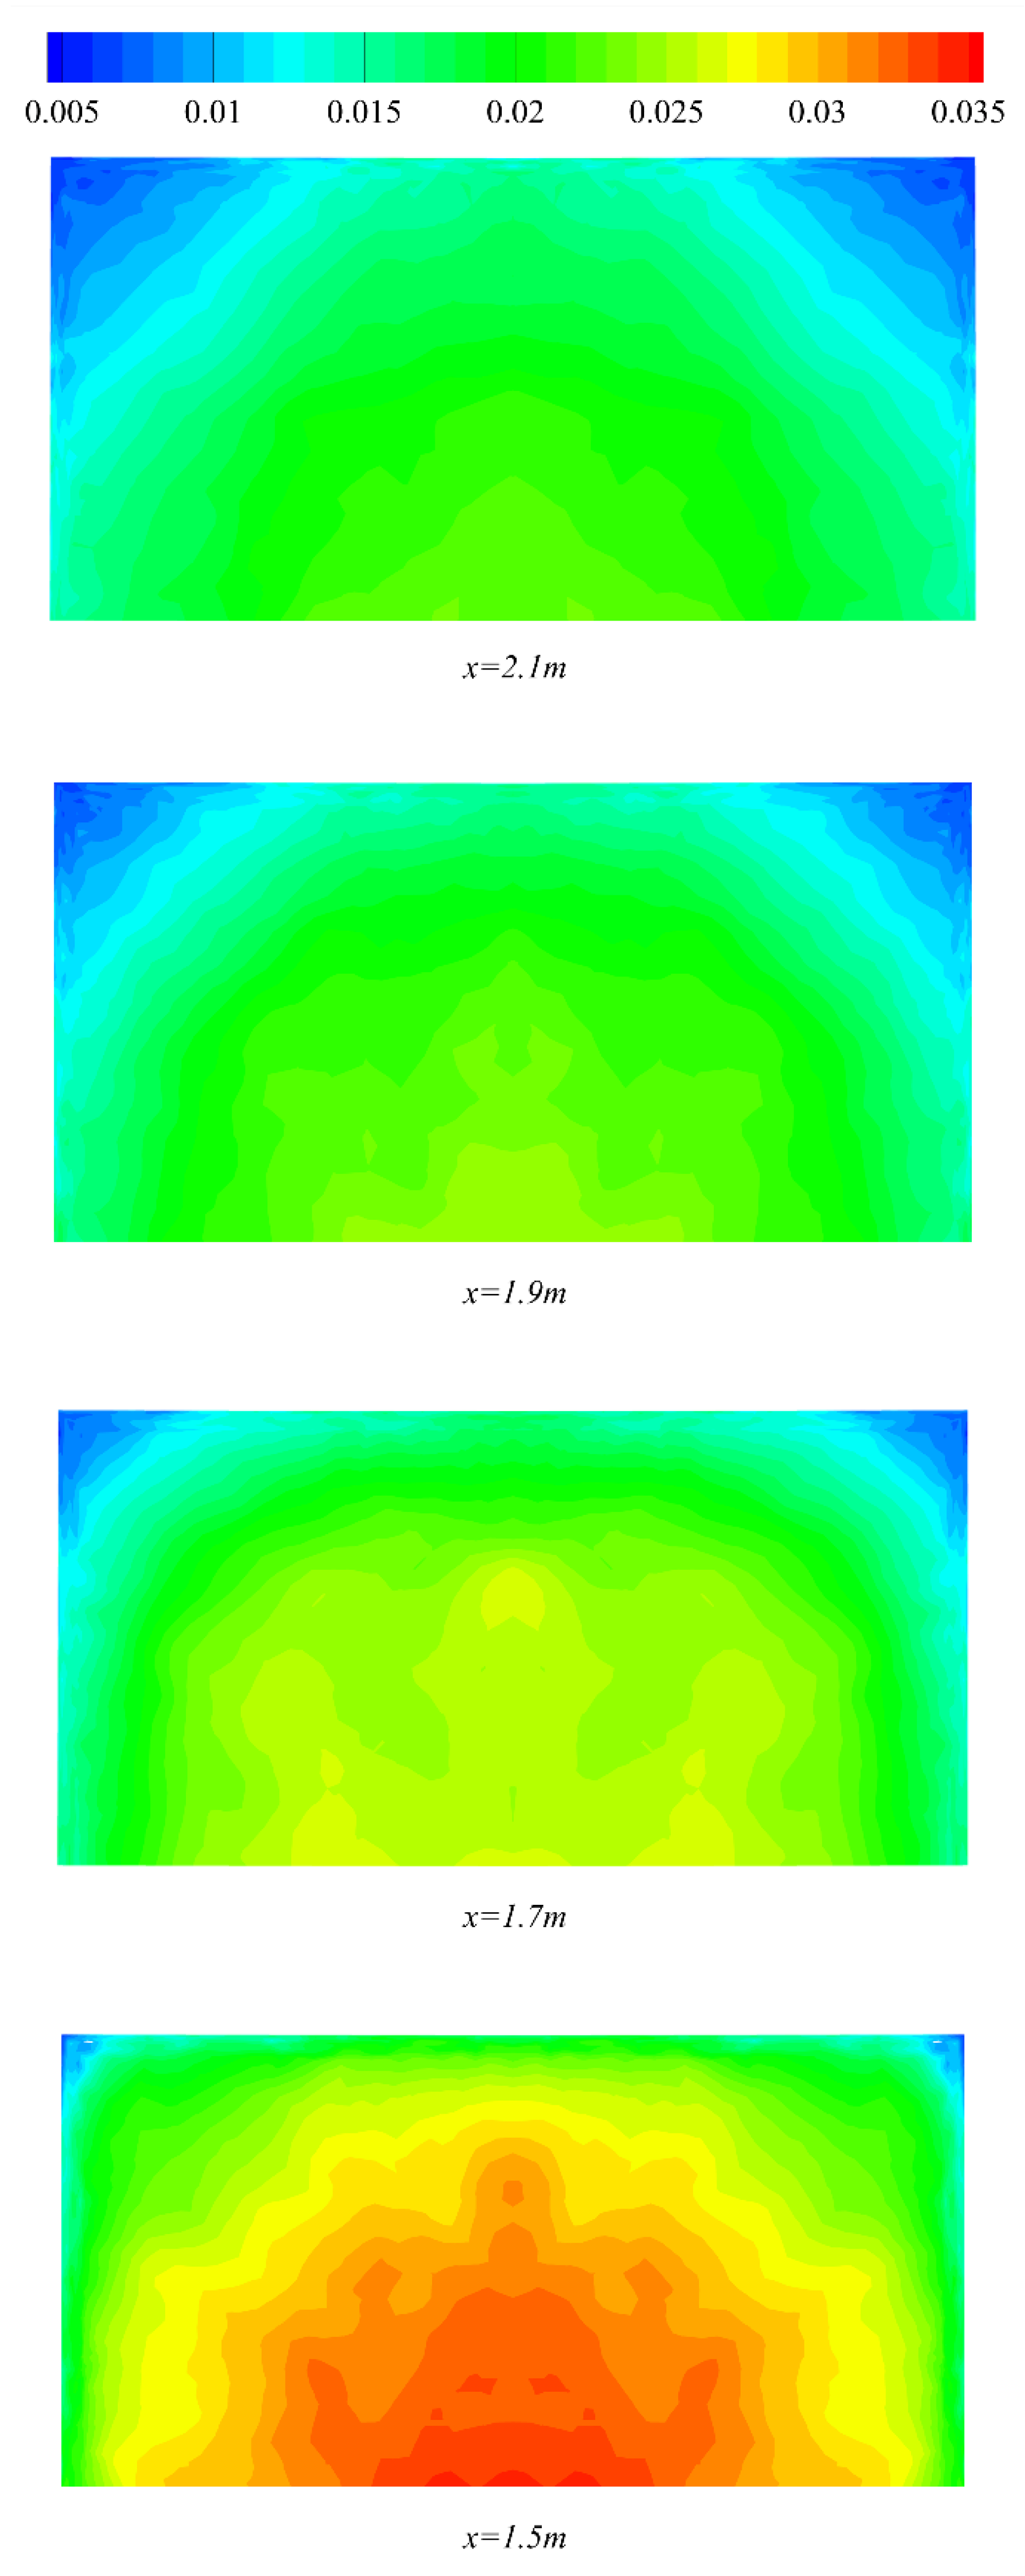
To quantify the flow uniformities and flow stabilities of the test sections of the three different wind tunnels, we select nine points in a test section and measure some key parameters. The nine measuring points, named ‘A~H’ and ‘O’, are shown in Figure 12. The test section (0.6 m long) is divided into three cross sections: x = 0.1 m, x = 0.3 m, and x = 0.5 m.
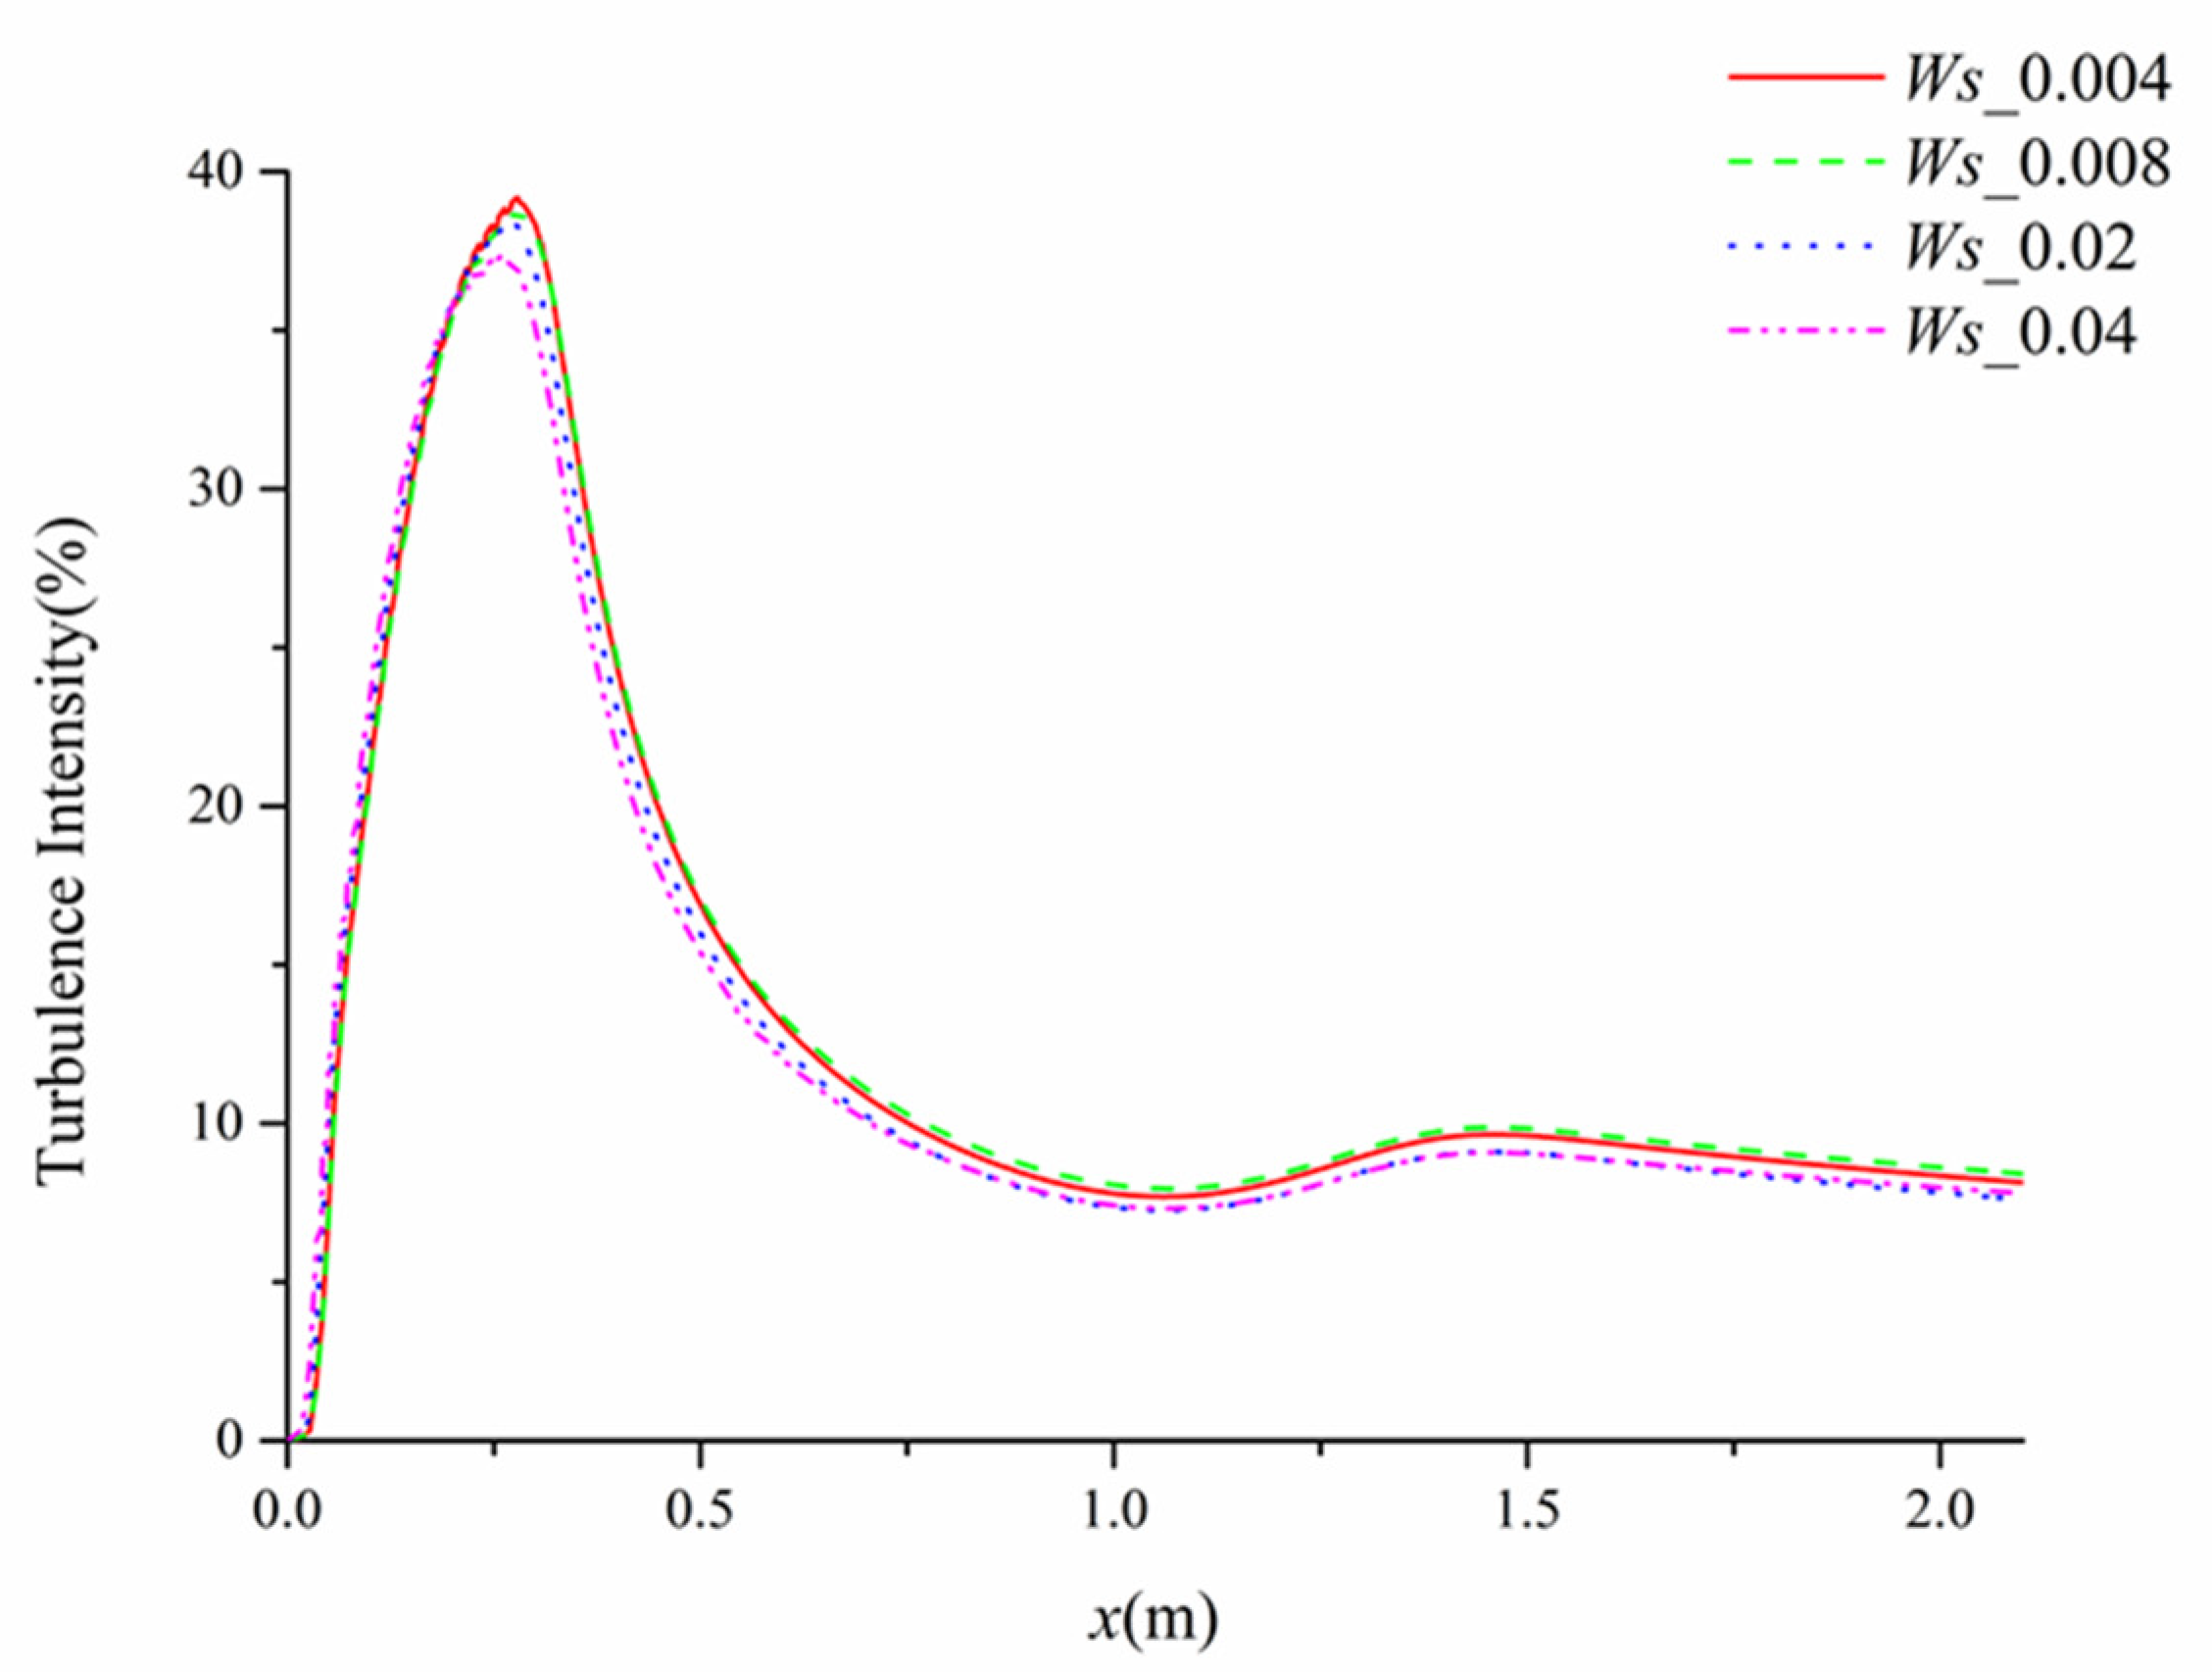
We introduce the velocity inhomogeneity (VI) and the dynamic pressure inhomogeneity (DPI) to describe the flow uniformity—velocity uniformity of the test section. The velocity inhomogeneity (VI) is defined as:
η i = | v i v ¯ 1 |
where i represents the nine measuring points A, B, C…, v i is the velocity at each measuring point, and v ¯ is the average velocity of the nine points.
The dynamic pressure inhomogeneity (DPI) is defined as:
μ i = | q i q ¯ 1 |
where q i is the dynamic pressure at each measuring point, and q ¯ is the average dynamic pressure of the nine points.
The maximum η i and μ i of the three wind tunnels with different contraction curves are shown in Table 4. It is evident that the trends of VI and DPI for the three test sections are the same. The flow uniformity in the test section with the Witozinsky curve contraction is the worst. This reflects the poor rectification effect of the Witozinsky curve on low-density flow. By contrast, the rectification effect of the bicubic curve and the quintic curve is relatively satisfactory.
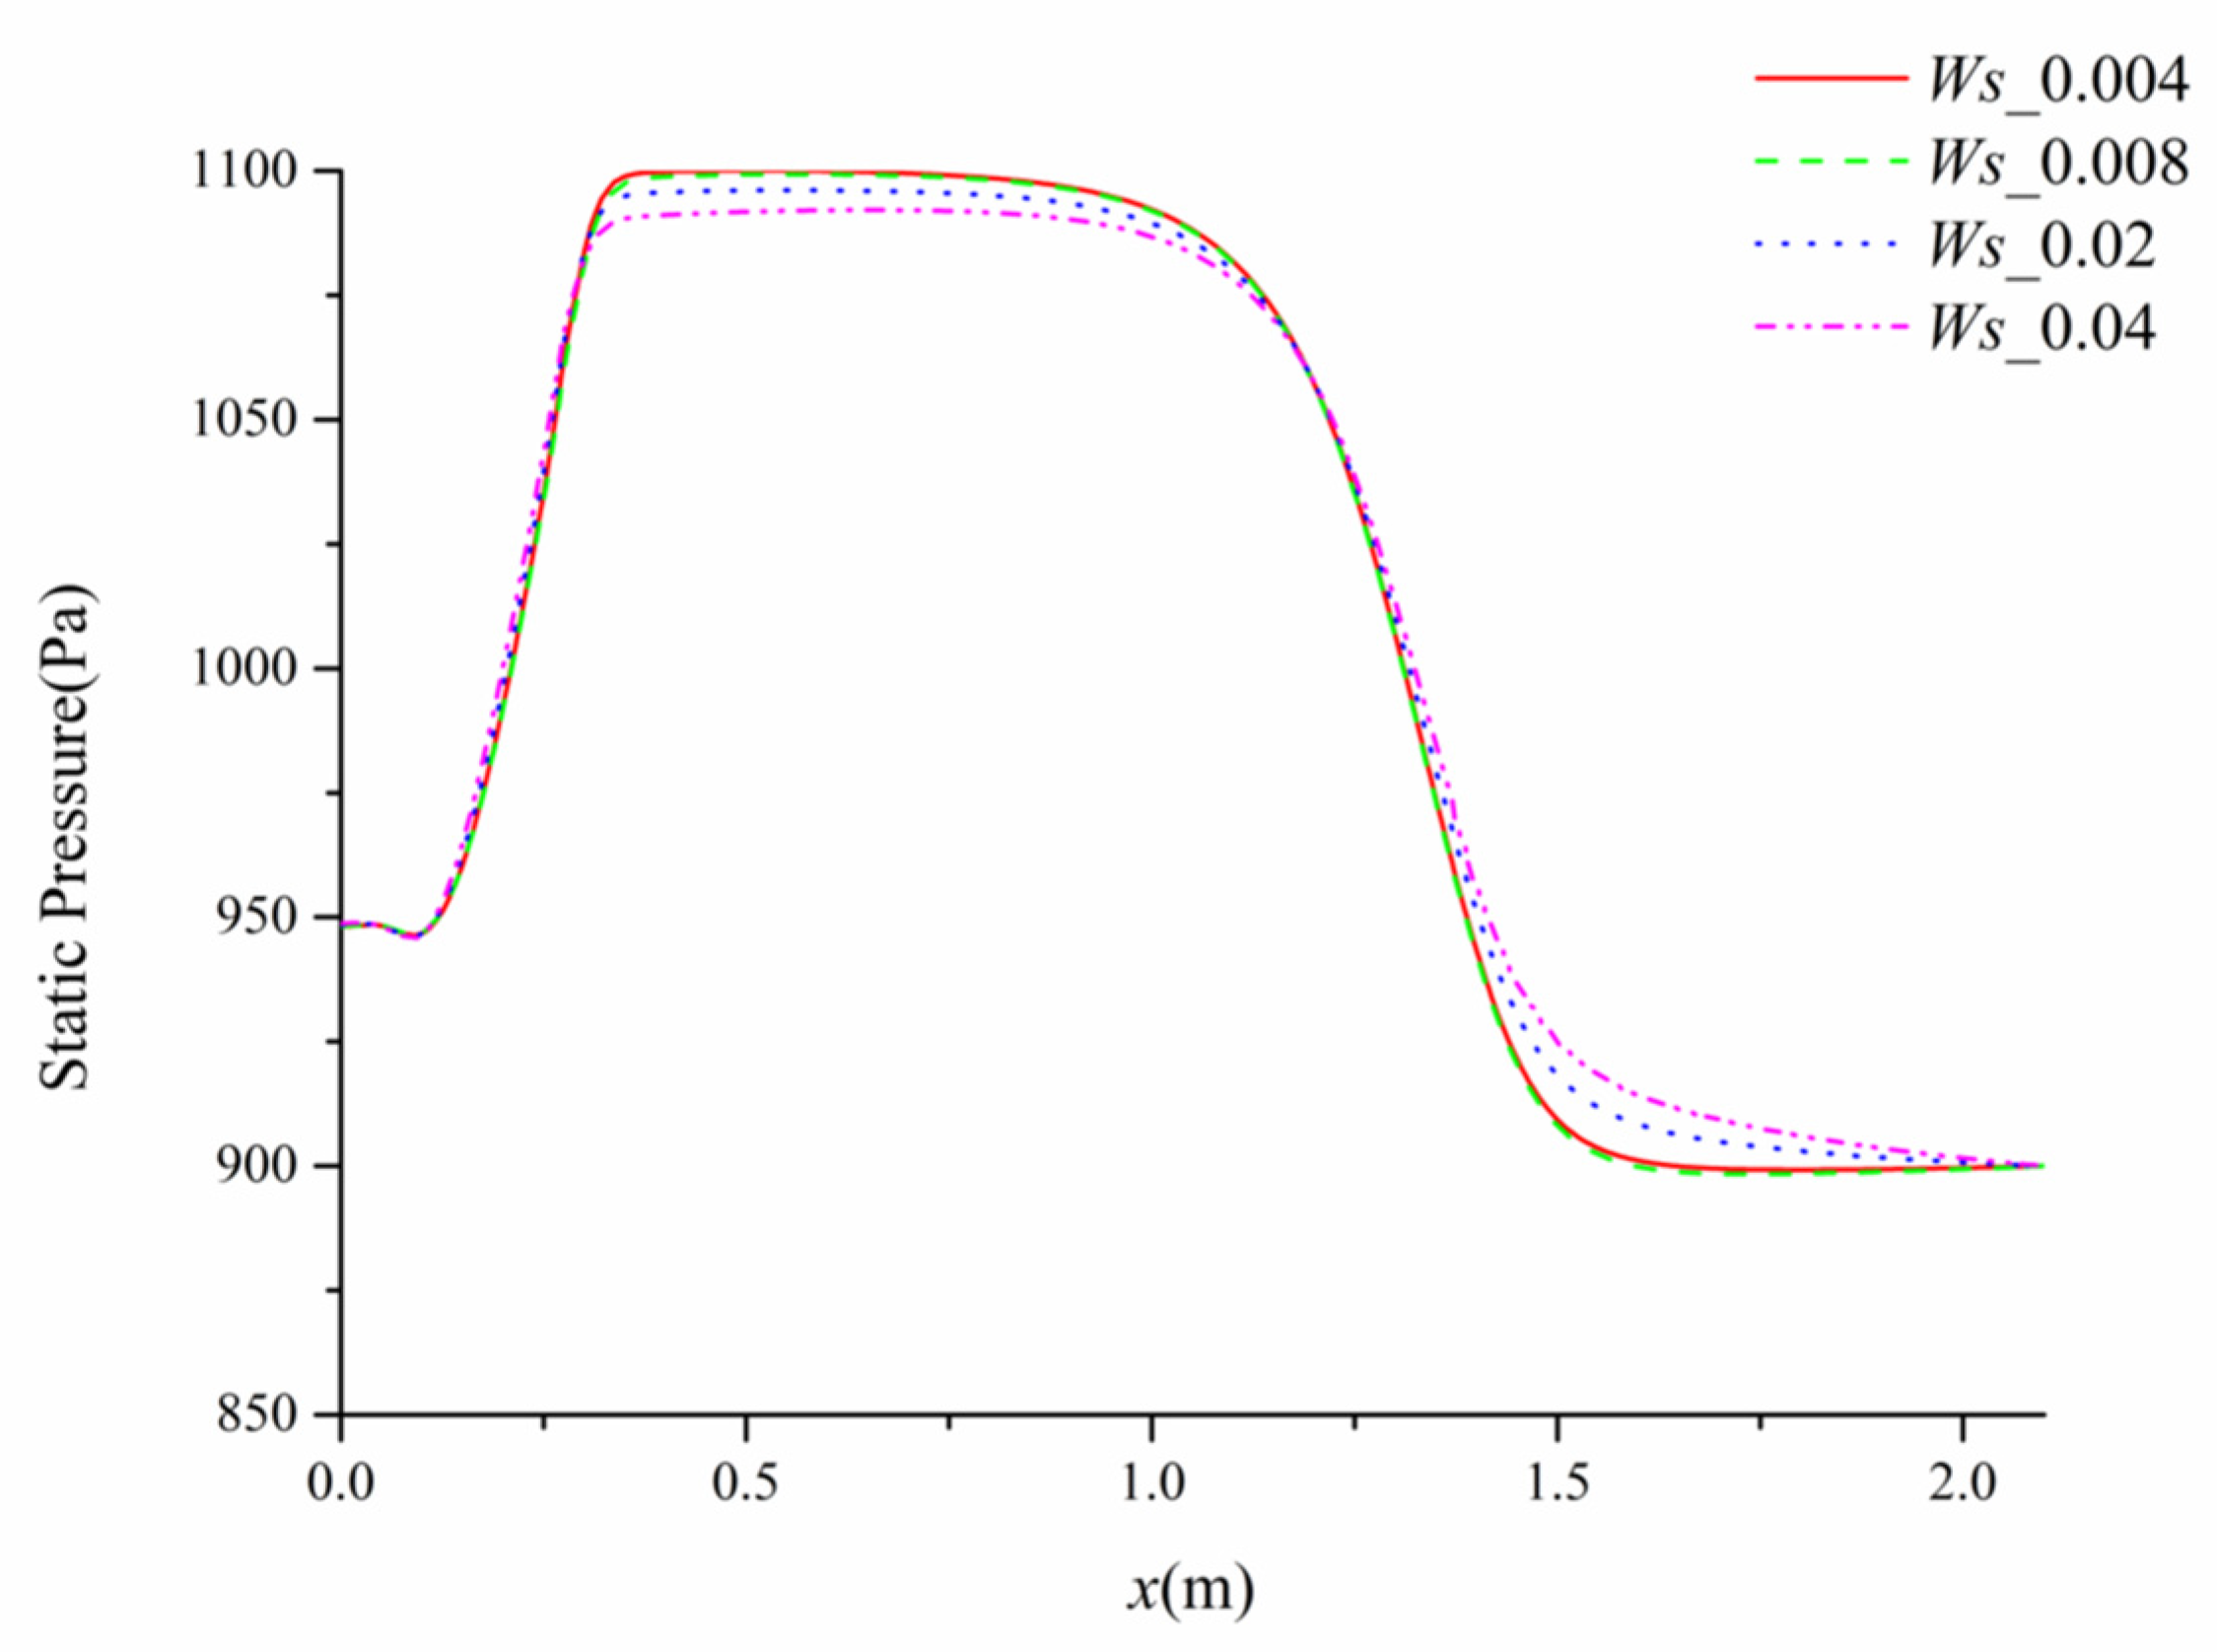
As for the flow stability, the axial static pressure gradient (ASPG) is introduced to describe the velocity stability of each test section. The test section is divided into n equal parts along the axis direction. The axial static pressure of the j = 1, …, n part is defined as:
C p j = Δ P j 1 2 ρ u j 2
where the ΔP is the static pressure difference of the part, ρ is the average density, and u is the axial gas velocity. The axial static pressure gradient is defined as:
C p = 1 n 1 j = 1 n 1 | C p j C p j + 1 L n |
where L is the length of the test section. The ASPGs of three different test sections are illustrated in Table 5. Under the test condition of 0.05 MPa inlet pressure, the ASPGs of the test section with the Witozinsky curve and the bicubic curve are relatively close, while the quintic curve has poor flow stability.
After comprehensively comparing the flow uniformity and the flow stability of the three different test sections, the bicubic curve is considered the best choice for the contraction.
To investigate the rectification effect of the bicubic curve at different flow velocities, CFD studies are carried out under the inlet pressures of 0.01 MPa, 0.05 MPa, and 0.1 MPa. The calculated index parameters for the test section are shown in Table 6.
As shown in Table 6, changes in VI and DPI are positively correlated with the changes in gas velocity in the test section. Furthermore, the increase in gas velocity reduces the flow uniformity. ASPG is more stable compared with flow uniformity. Overall, the flow uniformity in the test section is acceptable under different working conditions when using the bicubic curve as the contraction curve.

4. Two-Phase Flow Simulation

The parameters of the Mars wind tunnel discussed in this paper are determined based on the single-phase gas CFD simulations. In this section, gas-particle two-phase flow CFD simulations are carried out to demonstrate the performance of the Mars wind tunnel under the design of the contraction and the multi-nozzle ejector assembly.
The geometric model of the wind tunnel is derived from the previous section. Since the two-phase flow is complex, the grid near the nozzle wall is processed to increase the density. Under the grid-independence analysis and the consideration of the computational load, the hexahedral structured grid is utilized in the test section and contraction. Meanwhile, the unstructured grid is generated in the ejector assembly and the settling chamber. The total number of the grid cells is 5,420,000. The gas selected is the ideal gas CO2. Since the composition of the dust is complex, we choose SiO2, which is commonly used in the dust wind tunnel, as the particles in this wind tunnel. The diameter distribution function is selected as the commonly used Rosin-Rammler distribution function. The realizable k-epsilon turbulence model is used to solve the gas phase control equation, while the Discrete Phase Model (DPM) is used to solve the trajectory of the particles. The nonspherical model, which assumes that the particles are not spheres, is used to calculate the drag force. The shape factor, which is the ratio of the surface area of a sphere having the same volume as the particle to the actual surface area of the particle, is set to a common value of 0.8 [47]. The rotational lift, shear lift, pressure gradient force, and virtual mass force of the particles are taken into consideration. The turbulent diffusion effect of the particles is also considered. To show the work of the Mars wind tunnel as realistically as possible, gravity is also added to the model.
Figure 13 shows the trajectory and velocity of the particles in the wind tunnel with the inlet pressure of 0.05 MPa and the particle mass flow rate of 0.04 kg/s. Figure 14 is the gas phase velocity distribution on the symmetry plane of the Mars wind tunnel. The particles are ejected from the nozzles along with the high-speed gas flow and then decelerate gradually after entering the setting chamber. Under the drag force of the high-speed gas flow in the test section, the particles accelerate and finally leave the test section. The velocity of the particles in the test section is maintained between about 50~70 m/s, which is much lower than about 120 m/s of the gas phase.
Figure 15 shows the axial static pressure of the Mars wind tunnel under different inlet particle mass flow rates (0.004~0.04 kg/s). The ‘Ws’ in the figure represents the mass flow rate of the SiO2 ejected into the wind tunnel. It is clear in the figure that the static pressure in the test section is stable under any Ws. At the inlet of the test section (x = 1.5), the maximum difference between the four curves is about 16 Pa. Compared with the target pressure of 900 Pa, the pressure fluctuation caused by the mass flow rate change is only 1.78%. With the increase of the Ws, the static pressure in the settling chamber decreases, while the opposite is observed in the test section. The particle mass flow rate affects the static pressure gradient in the settling chamber and the test section. This may be caused by the dissipation effect of the particle on the total pressure of the gas. The increase in the particle mass flow rate causes the dissipation effect to be significant. Moreover, the increase in the particle mass flow rate also reduces the gas flow velocity.
Figure 16 shows the axial turbulence intensity under different particle mass flow rates. Turbulence intensity is defined as the ratio of standard deviation of fluctuating wind velocity to the mean wind speed, and it represents the intensity of wind velocity fluctuation. The turbulence intensity near the exit of the ejector assembly increases significantly, and then decreases rapidly. The increase of the particle mass flow rate weakens the turbulence intensity, but it does not change the trend of the turbulence intensity. At the inlet of the test section (x = 1.5), the maximum difference between the four curves is less than 0.8%. Moreover, the turbulence intensity in the test section is essentially stable, and the difference between the import and the export is less than 10%.
Figure 17 shows the particle concentration at different sections of the test section. For the convenience of comparison, the 0.4 m × 0.4 m cross-section is symmetrically cut from the middle and displayed in the size of 0.4 m × 0.2 m. The particle concentration at the inlet of the test section is the maximum and decreases gradually along the radial direction. After entering the test section, the particles are accelerated by the drag force of the high-speed gas flow. This reduces the particle concentration in the test section.
The above analysis results reveal that the particle concentration influences the gas flow but the effect is not significant. This phenomenon, in turn, confirms that the previous single-phase flow simulations of the nozzles have reference values.
According to the simulation results of the two-phase flow, the design of the nozzle assembly and the contraction curve is competent to provide a satisfactory velocity field and particle concentration field for the test section of the Mars wind tunnel.

5. Conclusions

This paper introduces a novel Mars wind tunnel to simulate the high-speed dust storm environment on Mars. The structure of the Mars wind tunnel is presented. The selection and design process of the nozzle parameters and contraction curve are discussed in detail. Although the gas flow of the Laval nozzle is more stable than that of the other nozzles, it requires a longer distance to stabilize. The 2# convergent nozzle is more suitable for the wind tunnel discussed in this paper. The Witozinsky curve contraction is not good at flow uniformity, and the flow stability of the quintic curve contraction is not satisfactory. In contrast, it is advisable to choose the bicubic curve as the contraction curve. Simulation results show that this wind tunnel can provide a stable flow field and particle concentration field for the test section. This work will guide the construction of the new Mars wind tunnel and contribute to the research of the future Mars lander and spacecraft.
Future work includes:
Optimizing the connection point of the bicubic curve to improve the flow field quality;
Designing experiments to validate the CFD simulation results;
Selecting other special particles to offset the influence of the earth’s gravity;
Designing the system control scheme.

Author Contributions

Conceptualization, H.W., M.L. and J.W.; methodology, M.L. and M.G.; software, H.W., Y.M. and M.G.; validation, H.W. and M.G.; formal analysis, M.L., J.W. and M.G.; investigation, M.L. and M.G.; resources, M.G. and Y.M.; data curation, H.W., M.G. and Y.M.; writing—original draft preparation, H.W. and M.G.; writing—review and editing, H.W.; visualization, H.W., Y.M. and M.G.; supervision, H.W., M.L. and J.W.; project administration, H.W., M.L. and J.W. All authors have read and agreed to the published version of the manuscript.

Funding

This research received no external funding.

Data Availability Statement

The data presented in this study are available on request from the corresponding author. All data are calculated by the author and have been included in this paper.

Conflicts of Interest

No conflict of interest exists in the submission of this manuscript, and the manuscript is approved by all authors for publication. I would like to declare on behalf of my coauthors that the work described was original research that has not been published previously, and not under consideration for publication elsewhere, in whole or in part. All the authors listed have approved the manuscript that is enclosed.

References

  1. Rankin, A.; Maimone, M.; Biesiadecki, J.; Patel, N.; Levine, D.; Toupet, O. Driving curiosity: Mars rover mobility trends during the first seven years. In Proceedings of the 2020 IEEE Aerospace Conference, Big Sky, MT, USA, 7–14 March 2020; IEEE: Piscataway, NJ, USA, 2020. [Google Scholar] [CrossRef]
  2. Hoffman, T. InSight: Mission to mars. In Proceedings of the 2018 IEEE Aerospace Conference, Big Sky, MT, USA, 3–10 March 2018; IEEE: Piscataway, NJ, USA, 2018. [Google Scholar] [CrossRef]
  3. Witze, A. NASA’s Perseverance rover begins key search for life on Mars. Nature 2022, 606, 441–442. [Google Scholar] [CrossRef] [PubMed]
  4. Balaram, J.; Aung, M.; Golombek, M.P. The Ingenuity Helicopter on the Perseverance Rover. Space Sci. Rev. 2021, 217, 56. [Google Scholar] [CrossRef]
  5. Tian, H.; Zhang, T.; Jia, Y.; Peng, S.; Yan, C. Zhurong: Features and mission of China’s first Mars rover. Innovation 2021, 2, 100121. [Google Scholar] [CrossRef] [PubMed]
  6. Muirhead, B.K.; Nicholas, A.K.; Umland, J.; Sutherland, O.; Vijendran, S. Mars Sample Return Campaign Concept Status. Acta Astronaut. 2020, 176, 131–138. [Google Scholar] [CrossRef]
  7. Report of the 90-Day Study on Human Exploration of the Moon and Mars; NASA: Washington, DC, USA, 1989.
  8. Wang, X.; Wang, X. Research Progress and Preliminary Scheme of Space Transportation System for Human Mars Exploration. Aerosp. China 2021, 22, 3–14. [Google Scholar] [CrossRef]
  9. Imhof, B. [Interior] Configuration options, habitability and architectural aspects of the transfer habitat module (THM) and the surface habitat on Mars (SHM)/ESA’s AURORA human mission to Mars (HMM) study. Acta Astronaut. 2007, 60, 571–587. [Google Scholar] [CrossRef]
  10. Polsgrove, T.; Chapman, J.; Sutherlin, S.; Taylor, B.; Robertson, E.; Studak, B.; Vitalpur, S.; Fabisinski, L.; Lee, A.Y.; Collins, T.; et al. Human Mars lander design for NASA’s evolvable mars campaign. In Proceedings of the 2016 IEEE Aerospace Conference, Big Sky, MT, USA, 5–12 March 2016; pp. 1–15. [Google Scholar] [CrossRef] [Green Version]
  11. Barlow, N. Mars: An Introduction to Its Interior, Surface and Atmosphere, 1st ed.; Cambridge University Press: Cambridge, UK, 2008. [Google Scholar]
  12. Smith, P.H.; Bell, J.F.R.; Bridges, N.T.; Britt, D.T.; Gaddis, L.; Greeley, R.; Keller, H.U.; Herkenhoff, K.E.; Jaumann, R.; Johnson, J.R.; et al. Results from the Mars Pathfinder camera. Science 1997, 278, 1758–1765. [Google Scholar] [CrossRef]
  13. Kok, J.F.; Parteli, E.; Michaels, T.I.; Karam, D.B. The physics of wind-blown sand and dust. Rep. Prog. Phys. 2012, 75, 1–72. [Google Scholar] [CrossRef] [Green Version]
  14. Smith, M.D.; Pearl, J.C.; Conrath, B.J.; Christensen, P.R. Thermal Emission Spectrometer results: Mars atmospheric thermal structure and aerosol distribution. J. Geophys. Res.-Planets 2001, 106, 23929–23945. [Google Scholar] [CrossRef] [Green Version]
  15. Yan, Y.P.; Zou, M.; Yao, J.Y.; Yuan, B.F.; Lin, Y.C.; Jin, J.F. Endurance study of bionic wheels for Mars rovers. J. Terramechanics 2017, 74, 57–68. [Google Scholar] [CrossRef]
  16. Graser, E.; McGill, S.; Rankin, A.; Bielawiec, A. Rimmed Wheel Performance on the Mars Science Laboratory Scarecrow Rover. In Proceedings of the 2020 IEEE Aerospace Conference, Big Sky, MT, USA, 7–14 March 2020; pp. 1–12. [Google Scholar] [CrossRef]
  17. Landis, G.A. Dust obscuration of Mars solar arrays. Acta Astronaut. 1996, 38, 885–891. [Google Scholar] [CrossRef]
  18. Bridges, N.T.; Ayoub, F.; Avouac, J.P.; Leprince, S.; Lucas, A.; Mattson, S. Earth-like sand fluxes on Mars. Nature 2012, 485, 339–342. [Google Scholar] [CrossRef] [PubMed] [Green Version]
  19. Balme, M.; Greeley, R. Dust devils on Earth and Mars. Rev. Geophys. 2006, 44, 1–22. [Google Scholar] [CrossRef] [Green Version]
  20. Newman, C.E.; Hueso, R.; Lemmon, M.T.; Munguira, A.; Vicente-Retortillo, A.L.; Apestigue, V.I.C.; Mart, I.; Nez, G.A.N.M.; Toledo, D.; Sullivan, R.; et al. The dynamic atmospheric and aeolian environment of Jezero crater, Mars. Sci. Adv. 2022, 8, eabn3783. [Google Scholar] [CrossRef] [PubMed]
  21. Sullivan, R.; Arvidson, R.; Bell, J.F.; Gellert, R.; Golombek, M.; Greeley, R.; Herkenhoff, K.; Johnson, J.; Thompson, S.; Whelley, P.; et al. Wind-driven particle mobility on mars: Insights from Mars Exploration Rover observations at “El Dorado” and surroundings at Gusev Crater. J. Geophys. Res.-Planets 2008, 113. [Google Scholar] [CrossRef] [Green Version]
  22. Golombek, M.P.; Grant, J.A.; Crumpler, L.S.; Greeley, R.; Arvidson, R.E.; Bell, J.F.; Weitz, C.M.; Sullivan, R.; Christensen, P.R.; Soderblom, L.A.; et al. Erosion rates at the Mars Exploration Rover landing sites and long-term climate change on Mars. J. Geophys. Res.-Planets 2006, 111. [Google Scholar] [CrossRef]
  23. Calle, C.I.; Buhler, C.R.; Johansen, M.R.; Hogue, M.D.; Snyder, S.J. Active dust control and mitigation technology for lunar and Martian exploration. Acta Astronaut. 2011, 69, 1082–1088. [Google Scholar] [CrossRef]
  24. Trigwell, S.; Mazumder, M.K.; Biris, A.S.; Anderson, S.; Yurteri, C.U.; Mittal, K.L. Dust removal from solar panels and spacecraft on Mars. In Surface Contamination and Cleaning; CRC Press: Boca Raton, FL, USA, 2003; Volume 1, pp. 293–310. [Google Scholar]
  25. Kok, J.F.; Renno, N.O. Electrostatics in Wind-Blown Sand. Phys. Rev. Lett. 2008, 100, 014501. [Google Scholar] [CrossRef] [PubMed] [Green Version]
  26. Marshall, J.; Fenton, L.K.; Harlow, J. Limitations of applying grain weight similitude in aeolian studies with NASA Mars Wind Tunnel. Aeolian Res. 2021, 53, 100732. [Google Scholar] [CrossRef]
  27. Viúdez-Moreiras, D.; Gómez-Elvira, J.; Newman, C.E.; Navarro, S.; Marin, M.; Torres, J.; De La Torre-Juárez, M. Gale surface wind characterization based on the Mars Science Laboratory REMS dataset. Part II: Wind probability distributions. Icarus 2019, 319, 645–656. [Google Scholar] [CrossRef]
  28. Banfield, D.; Spiga, A.; Newman, C.; Forget, F.; Lemmon, M.; Lorenz, R.; Murdoch, N.; Viudez-Moreiras, D.; Pla-Garcia, J.; Garcia, R.F.; et al. The atmosphere of Mars as observed by InSight. Nat. Geosci. 2020, 13, 190–198. [Google Scholar] [CrossRef]
  29. Viúdez-Moreiras, D.; Newman, C.E.; Forget, F.; Lemmon, M.; Banfield, D.; Spiga, A.; Lepinette, A.; Rodriguez-Manfredi, J.A.; Gómez-Elvira, J.; Pla-García, J.; et al. Effects of a Large Dust Storm in the Near-Surface Atmosphere as Measured by InSight in Elysium Planitia, Mars. Comparison With Contemporaneous Measurements by Mars Science Laboratory. J. Geophys. Res. Planets 2020, 125, e2020JE006493. [Google Scholar] [CrossRef]
  30. J.P. Laboratory. Mars Dust Storms.; 1976. Available online: https://www.jpl.nasa.gov/news/mars-dust-storms (accessed on 3 October 2022).
  31. Papike, J.J. Planetary Materials; The Mineralogical Society of America: Chantilly, VA, USA, 1998. [Google Scholar]
  32. Kwiek, A. Conceptual design of an aircraft for Mars mission. Aircr. Eng. Aerosp. Technol. 2019, 91, 886–892. [Google Scholar] [CrossRef]
  33. Liu, T.; Oyama, A.; Fujii, K. Scaling Analysis of Propeller-Driven Aircraft for Mars Exploration. J. Aircr. 2013, 50, 1593–1604. [Google Scholar] [CrossRef]
  34. Greeley, R.; White, B.R.; Pollack, J.B.; Iverson, J.D.; Leach, R.N. Dust Storms on Mars: Considerations and Simulations; NASA: Washington, DC, USA, 1977.
  35. Dino, J. Mars Surface Wind Tunnel. 2008. Available online: https://www.nasa.gov/centers/ames/multimedia/images/2005/dust_devils.html (accessed on 30 August 2022).
  36. Gaier, J.R.; Perez-Davis, M.E.; Moinuddin, A.M. Effects of windblown dust on photovoltaic surface s on Mars. In Proceedings of the 26th Intersociety Energy Conversion Engineering Conference, Boston, MA, USA, 4–9 August 1991. [Google Scholar]
  37. Gaier, J.; De Leon, P.; Lee, P.; McCue, T.; Hodgson, E.; Thrasher, J. Preliminary testing of a pressurized space suit and candidate fabrics under simulated Mars dust storm and dust devil conditions. In Proceedings of the 40th International Conference on Environmental Systems, Barcelona, Spain, 11–15 July 2010. [Google Scholar]
  38. Merrison, J.P.; Gunnlaugsson, H.P.; Holstein-Rathlou, C.; Knak Jensen, S.; Mason, J.; Nørnberg, P.; Patel, M.; Portyankina, G.; Rasmussen, K.R. Latest results from the European mars simulation wind tunnel facility. In Proceedings of the EPSC-DPS Joint Meeting 2011, Nantes, France, 2–7 October 2011. [Google Scholar]
  39. Holstein-Rathlou, C.; Merrison, J.; Iversen, J.J.; Jakobsen, A.B.; Nicolajsen, R.; Nørnberg, P.; Rasmussen, K.; Merlone, A.; Lopardo, G.; Hudson, T.; et al. An environmental wind tunnel facility for testing meteorological sensor systems. J. Atmos. Ocean. Technol. 2014, 31, 447–457. [Google Scholar] [CrossRef]
  40. Merrison, J.P.; Bechtold, H.; Gunnlaugsson, H.; Jensen, A.; Kinch, K.; Nornberg, P.; Rasmussen, K. An environmental simulation wind tunnel for studying Aeolian transport on mars. Planet. Space Sci. 2008, 56, 426–437. [Google Scholar] [CrossRef]
  41. Greeley, R.; Leach, R.; White, B.; Iversen, J.; Pollack, J. Threshold windspeeds for sand on Mars—Wind tunnel simulations. Geophys. Res. Lett. 1980, 7, 121–124. [Google Scholar] [CrossRef]
  42. Franz, H.B.; Trainer, M.G.; Malespin, C.A.; Mahaffy, P.R.; Atreya, S.K.; Becker, R.H.; Benna, M.; Conrad, P.G.; Eigenbrode, J.L.; Freissinet, C.; et al. Initial SAM calibration gas experiments on Mars: Quadrupole mass spectrometer results and implications. Planet. Space Sci. 2017, 138, 44–54. [Google Scholar] [CrossRef]
  43. Wu, J.L.; Li, Z.H.; Peng, A.P.; Pi, X.C.; Li, Z.H. Numerical study on rarefied unsteady jet flow expanding into vacuum using the Gas-Kinetic Unified Algorithm. Comput. Fluids 2017, 155, 50–61. [Google Scholar] [CrossRef]
  44. Li, Y.H.; He, C.J.; Li, J.Q.; Miao, L.; Gao, R.Z.; Liang, J.M. Experimental investigation of flow separation in a planar convergent-divergent nozzle. In Proceedings of the 3rd International Conference on Fluid Mechanics and Industrial Applications (FMIA), Taiyun, China, 1 January 2019; Institute of Physics Publishing: Bristol, UK, 2019; p. 012088. [Google Scholar] [CrossRef]
  45. Wei, A.B.; Yu, L.Y.; Gao, R.; Zhang, W.; Zhang, X.B. Unsteady cloud cavitation mechanisms of liquid nitrogen in convergent-divergent nozzle. Phys. Fluids 2021, 33, 092116. [Google Scholar] [CrossRef]
  46. Cao, X.; Bian, J. Supersonic separation technology for natural gas processing: A review. Chem. Eng. Process.-Process Intensif. 2019, 136, 138–151. [Google Scholar] [CrossRef]
  47. Haider, A.; Levenspiel, O. Drag coefficient and terminal velocity of spherical and nonspherical particles. Powder Technol. 1989, 58, 63–70. [Google Scholar] [CrossRef]
Figure 1. General layout of the Mars wind tunnel.
Aerospace 09 00662 g001
Figure 2. Velocity contours of nozzle #1 at different inlet pressures (m/s).
Aerospace 09 00662 g002
Figure 3. Velocity contours of nozzle #2 at different inlet pressures (m/s).
Aerospace 09 00662 g003
Figure 4. Velocity contours of nozzle #3 at different inlet pressures (m/s).
Aerospace 09 00662 g004
Figure 5. Pressure distribution along the central axis.
Aerospace 09 00662 g005
Figure 6. Mach numbers along the central axis.
Aerospace 09 00662 g006
Figure 7. Alternative contraction curves of the Mars wind tunnel.
Aerospace 09 00662 g007
Figure 8. Schematic diagram of the length of each section.
Aerospace 09 00662 g008
Figure 9. Mesh model and its wall details.
Aerospace 09 00662 g009
Figure 10. Mesh model of the inlet nozzles.
Aerospace 09 00662 g010
Figure 11. Velocity distributions of three different wind tunnels (m/s).
Aerospace 09 00662 g011
Figure 12. Layout of measuring points in the test section.
Aerospace 09 00662 g012
Figure 13. Trajectory and velocity of particles (m/s).
Aerospace 09 00662 g013
Figure 14. Velocity distribution of the gas phase (m/s).
Aerospace 09 00662 g014
Figure 15. Axial static pressure under different inlet particle mass flow rates.
Aerospace 09 00662 g015
Figure 16. Axial turbulence intensity under different inlet particle mass flow rates.
Aerospace 09 00662 g016
Figure 17. Particle concentration at different sections of the test section (kg/m3).
Aerospace 09 00662 g017
Table 1. The main simulated environmental parameters of the Mars wind tunnel.
ItemsParameters
Gas mediumCO2
Test section speed60~170 m/s
Static pressure600~1000 Pa
Test section temperature173~293 K
Particle diameter35~125 μm
Table 2. Three nozzles’ geometries.
Nozzle TypeInlet DiameterOutlet DiameterLengthThroat DiameterConvergent AngleDivergent Angle
1#Convergent nozzle10 mm4 mm30 mm-11.8°-
2#Convergent nozzle10 mm6 mm30 mm-7.9°-
3#Laval nozzle10 mm20 mm30 mm4 mm11.8°7.2°
Table 3. Ejection characteristics of the three ejector nozzles.
Nozzle NO.Inlet Pressure (MPa)Nozzle Mass Flow Rate (kg/h)Ejected Gas Flow Rate (kg/h)Ejection Coefficient
1#0.010.00040.011128.10
0.050.00200.028114.05
0.100.00400.041810.45
2#0.010.00160.023714.60
0.050.00820.06437.84
0.100.01640.08024.89
3#0.010.00040.025865.74
0.050.00200.036118.05
0.100.00400.03959.875
Table 4. Flow uniformity indexes of three contraction curves.
Witozinsky CurveBicubic CurveQuintic Curve
Max VI (%)1.431.161.14
Max DPI (%)0.760.660.64
Table 5. ASPG of three different test sections.
Witozinsky CurveBicubic CurveQuintic Curve
ASPG (m−1)0.13760.13420.1845
Table 6. Main index parameters for the test section with bicubic curve contraction.
Inlet Pressure (MPa)0.010.050.1
Average velocity (m/s)82.9129.4167.6
Max VI0.400.661.06
Max DPI (%)0.741.161.62
ASPG (m−1)0.12930.13420.1347
Publisher’s Note: MDPI stays neutral with regard to jurisdictional claims in published maps and institutional affiliations.

