Article

Experimental Investigation into the Effect of Fin Shapes on Heat Dissipation Performance of Phase Change Heat Sink

1
School of Aeronautic Science and Engineering, Beihang University, Beijing 100191, China
2
School of Biological Science and Medical Engineering, Beihang University, Beijing 100191, China
3
National Energy Technology Laboratory, Morgantown, WV 26507, USA
*
Authors to whom correspondence should be addressed.
Aerospace 2022, 9(11), 664; https://doi.org/10.3390/aerospace9110664
Submission received: 30 August 2022 / Revised: 19 October 2022 / Accepted: 24 October 2022 / Published: 28 October 2022

Abstract

:
In this paper, the thermal management of missile-borne components in a flight state is studied. Avoiding excessive component temperatures under the high-temperature circumstances brought by aerodynamic heat is a requirement to guarantee the equipment’s safe and reliable operation. In this work, we designed four finned shell constructions for a phase change module using the phase change temperature control method and then studied their effects on the module’s ability to dissipate heat using an experimental approach. Three sizes of 30 mm, 40 mm, and 50 mm heating pads were used to replicate heat sources with various heat flux densities and heat dissipation regions, with reference to the heating characteristics of various chips. The results demonstrated that the square-shaped fin had the best heat dissipation effect after operating for 10 min under the power of 10 W and 20 W, while the strip-shaped fins exhibited the highest performance under the power of 30 W. The square-shaped fins had the best heat dissipation effect when reducing working time to 5 min. This paper proposes the optimal fin scheme under different power densities, as well as an enhanced heat dissipation idea for the melting process of the phase change materials based on the test results.

1. Introduction

Because of its high latent heat and high power density, the passive cooling module based on the phase change material (PCM) is highly effective and can be used without any power consumption. PCMs absorb a lot of heat and keep a constant temperature in the phase change process, easing the increase in the chip temperature.
Due to the unique application environment of the missile-borne phase change heat storage module, dependability and stability are crucial material selection factors in addition to thermal performance metrics such as phase transition temperature and phase change enthalpy. Therefore, typical organic PCMs such as polyethylene glycols [1,2], fatty acids [3,4], paraffin wax [5,6,7], etc., which have high latent and high stability, are commonly used in missile-borne equipment. With the advantages of a narrow working temperature range, high-temperature control accuracy, and no phase separation problems [8,9,10,11], paraffin wax is a good choice for missile transient temperature control. In addition, it has compatibility with common materials such as aluminum alloy and stable heat storage and release performance, which makes it widely used in practical engineering applications.
However, paraffin wax has the problem of its own low thermal conductivity. Since its thermal conductivity is only 0.2 Wm−1 K−1, pure PCM cannot provide the necessary temperature adjustment capability during the long-term use of the seeker. Researchers are now focusing on how to enhance the phase change module’s thermal conductivity in order to boost its heat storage capacity [12,13].
To enhance the thermal conductivity of the PCM, several methods are used. The introduction of fillers is an effective measure. Expanded graphite [14,15], metal foams [16,17], graphene [18], boron nitride [19], carbon fibers [20,21], metal fibers [22,23], metal meshes [24], copper nanowires [25], carbon nanotubes [26], etc. have been reported with a significant improvement for the heat transfer coefficient of the composited PCM. Among them, expanded graphite, which has excellent benefits and potential, has a large specific surface area, low density, tunable pore structure, a significant amount of adsorption capacity, and strong stability [27].
Structural design is another effective method to strengthen the heat transfer capacity, such as increasing the heat transfer area by designed fins [28,29]. M. Shanks and J. Woods illustrated the effects of material properties, geometry, the internal distribution of thermal conductors, and operating conditions on phase change thermal storage properties; they used Ragone diagrams to show the close relationship between energy and power density [30,31].
In fact, a combination of multiple strengthening methods is often used in engineering applications. It is worth noting that the addition of fillers may reduce the phase change enthalpy of the PCM and too much additive will lead to a decrease in the heat storage capacity of the PCM. Therefore, preparing a PCM heat storage unit with high thermal conductivity and large latent heat through a reasonable structural design, filler addition and process improvement are ideas for the performance optimization of PCMs.
In the missile-borne seeker heat dissipation system, PCM can be encapsulated in an aluminum alloy casing, and heat transfer is enhanced utilizing fins. PCM modules are highly desired to have higher heat transfer ability and less leak rate. The fins also serve as reinforcing ribs in the shell structure, reducing the problem of shell bulging and leakage caused by the volume expansion of the PCM during the phase change process.
According to different heat dissipation requirements, four kinds of hot rib structures are designed to simulate the influence of different power dissipation and heat source areas on heat dissipation. For this paper, we built an experimental platform to test and compare the heat dissipation performance of different shell samples. The result showed that different heat source conditions have their own optimal fin strengthening structure. In addition, optimal fin structures for different power chips are obtained, which provided a numerical basis for the design of the phase change cold plates in practical applications.

2. Model Preparation
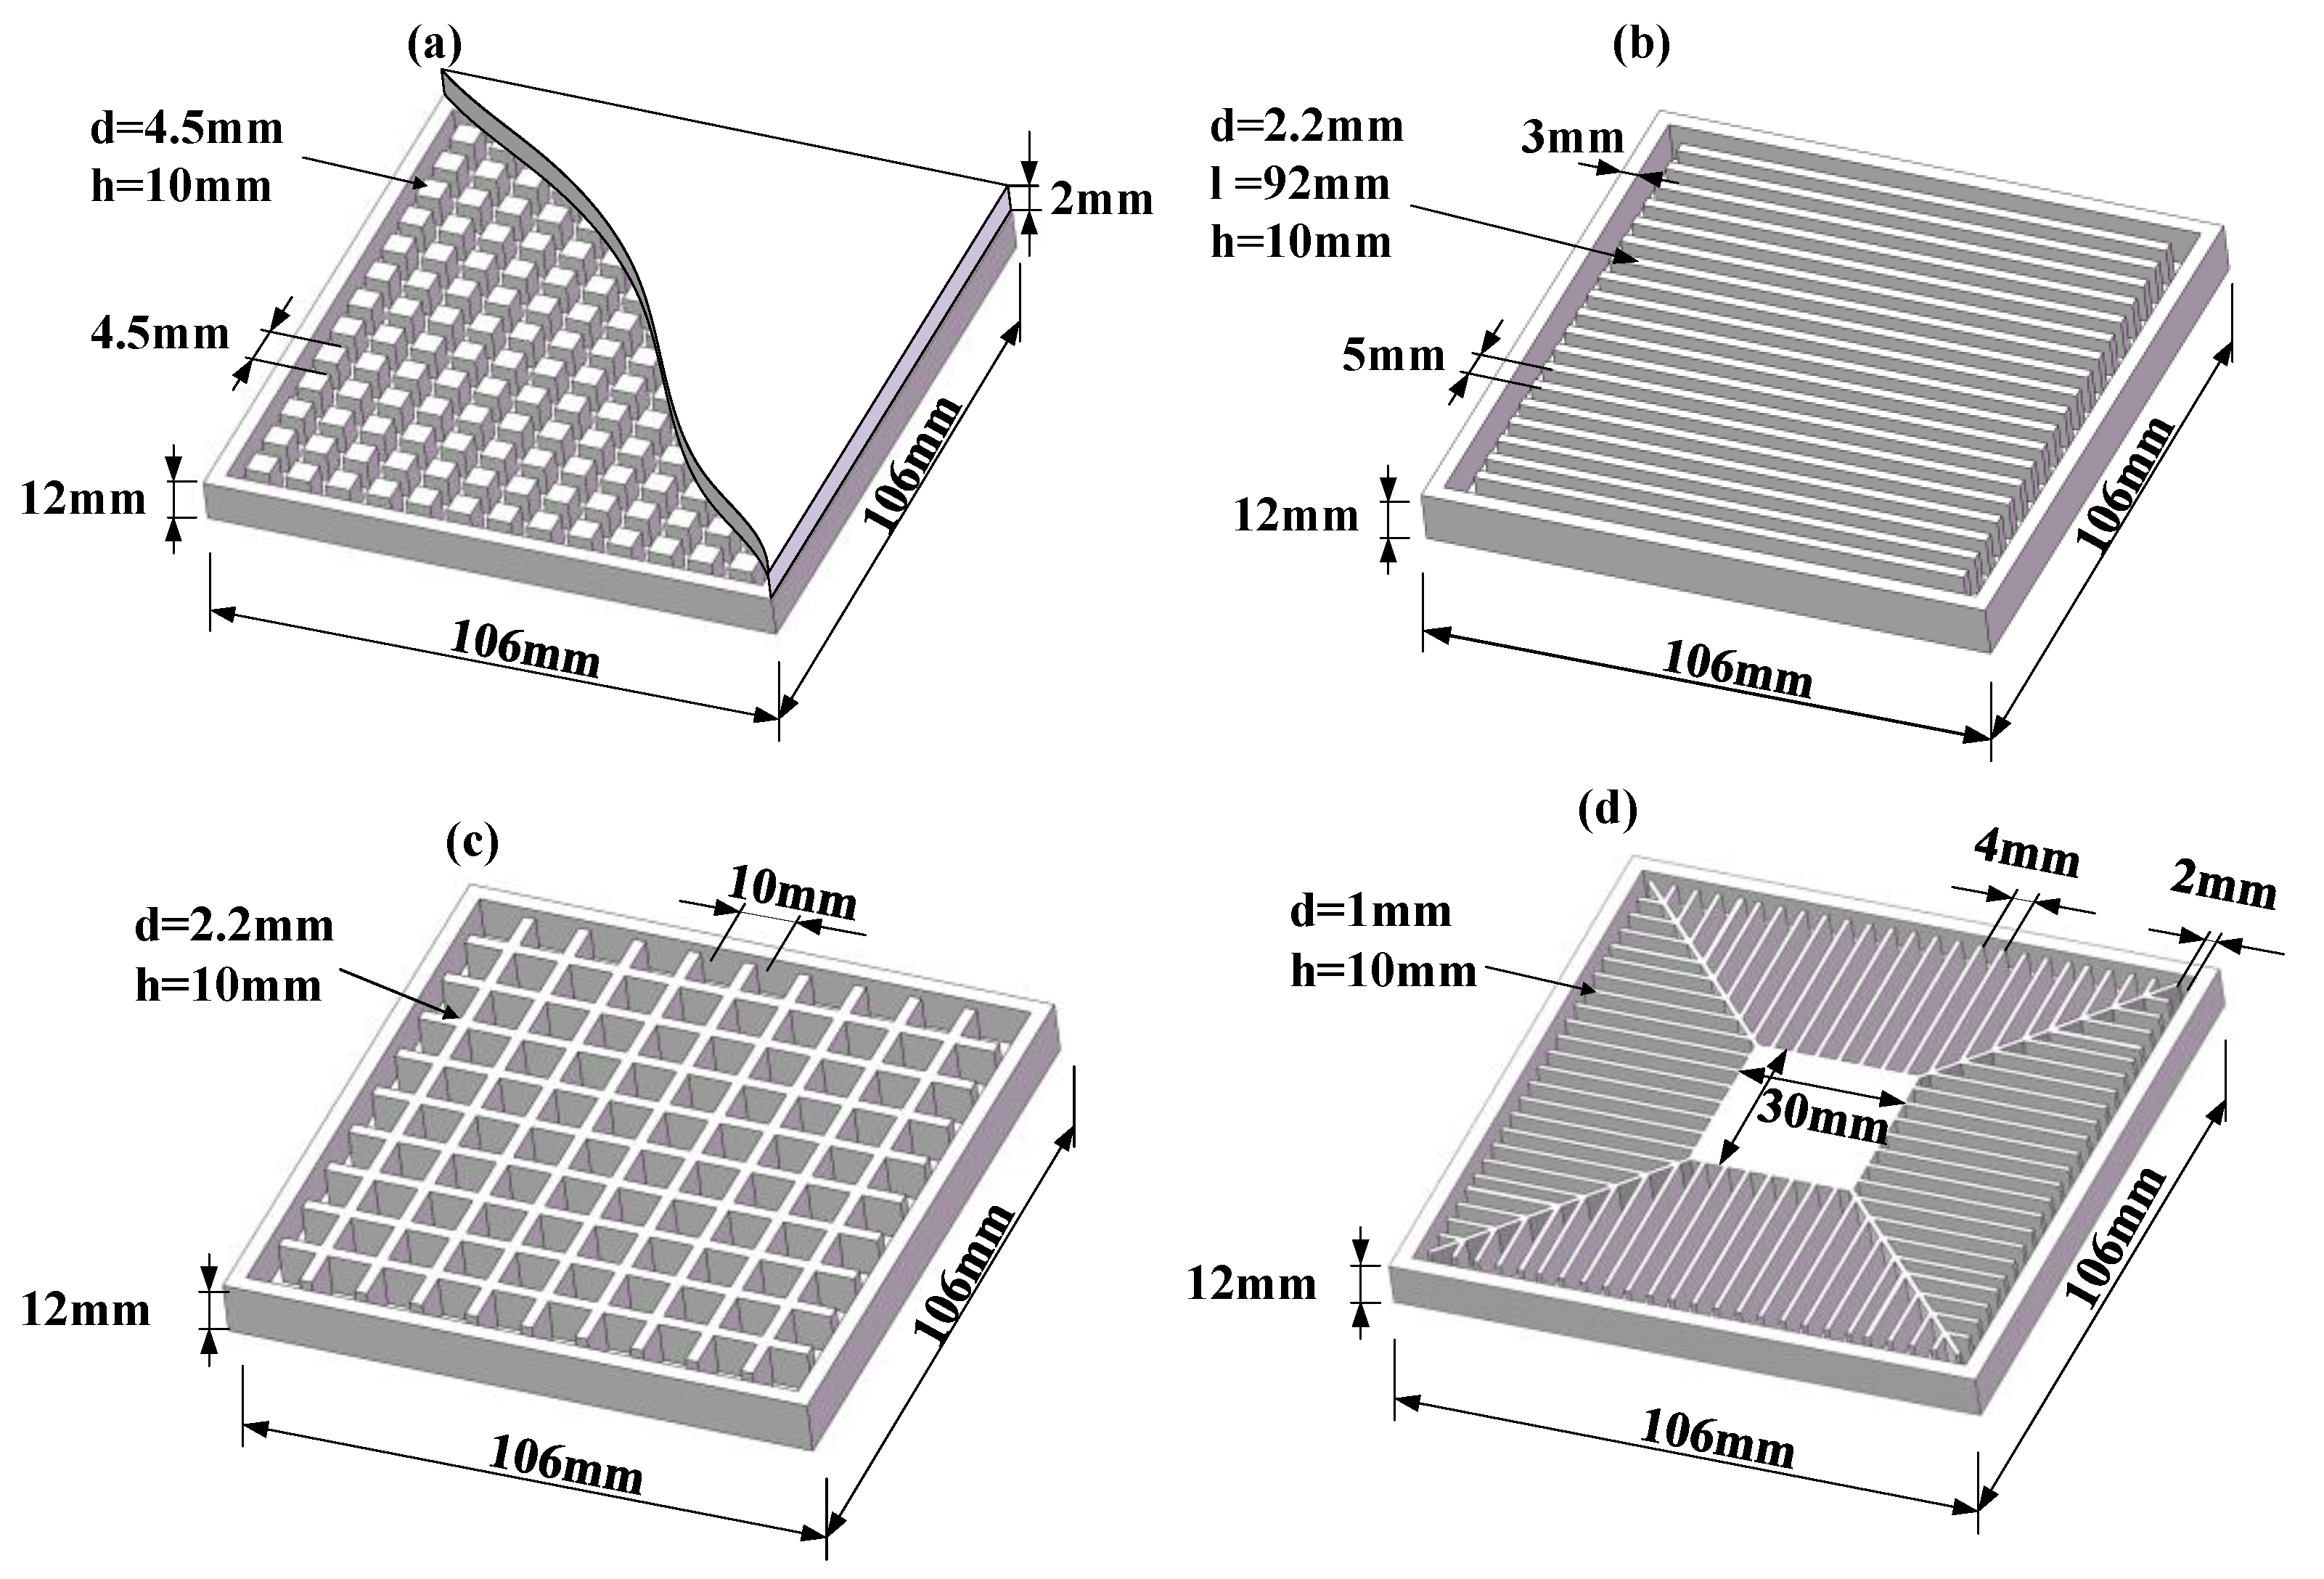
2.1. Physical Model

The missile-borne system has very strict dependability requirements. The internal structure of the module and the application of welding technology are constrained by the use of fillers, which have a significant impact on the product’s reliability. On the same circuit board, various functioned chips will be used for different purposes. Thus, different internal structures are used in various parts of the same phase change cooling module to accommodate chips of various sizes and powers, achieving the best heat dissipation with the least amount of space and weight. Here, we constructed four different types of structures for test comparison, taking into account the actual application of the processing technology, welding technology, and filling technology realization. The four structures were numbered M1–M4, as shown in Figure 1. The length, width, and height were unified to 106 mm × 106 mm × 14 mm. The thickness of the upper and lower bottom surfaces was 2 mm. The thickness of the surrounding area was 3 mm. All of these sizes were kept the same.
To ensure the validity of the comparative test, the module weight was uniformly designed to be 189.75 g. Because of the occurrence of chamfering during processing, the weights of each module are shown in Figure 1a; they were 194.8 g,194.0 g,195.0 g, and 192.9 g, respectively, with the difference being less than 1.2%.
The maximum design temperature of the bomb-borne environment was 70 °C. To ensure normal operation in such a working environment, the paraffin wax with a phase transition temperature of 74.01 °C was selected as the research object. The DSC curve is shown in Figure 2. The module was filled with liquid state PCM, with the filling rate of 92%. The material volume in each module was 6000 mm3, with a mass of 52 g. Their weights are shown in Figure 3b and Table 1 as 52.1 g, 52 g, 52 g, and 51.8 g, respectively.
The heat source was arranged at the bottom of the module. Three types of the heat sources with different geometries (30 mm × 30 mm, 40 mm × 40 mm, 50 mm × 50 mm) were designed and given 10 W, 20 W, and 30 W. The temperature rise of the heat source within 10 min was used as an indicator to analyze the heat dissipation capacity of each heat dissipation module under different heat source areas and different power densities.
A suitable encapsulation enclosure must have high thermal conductivity, mechanical stability, and non-reaction with the core material [32,33,34]. Aluminum alloy 6063 was used as the shell material; its physical parameters are shown in Table 2.

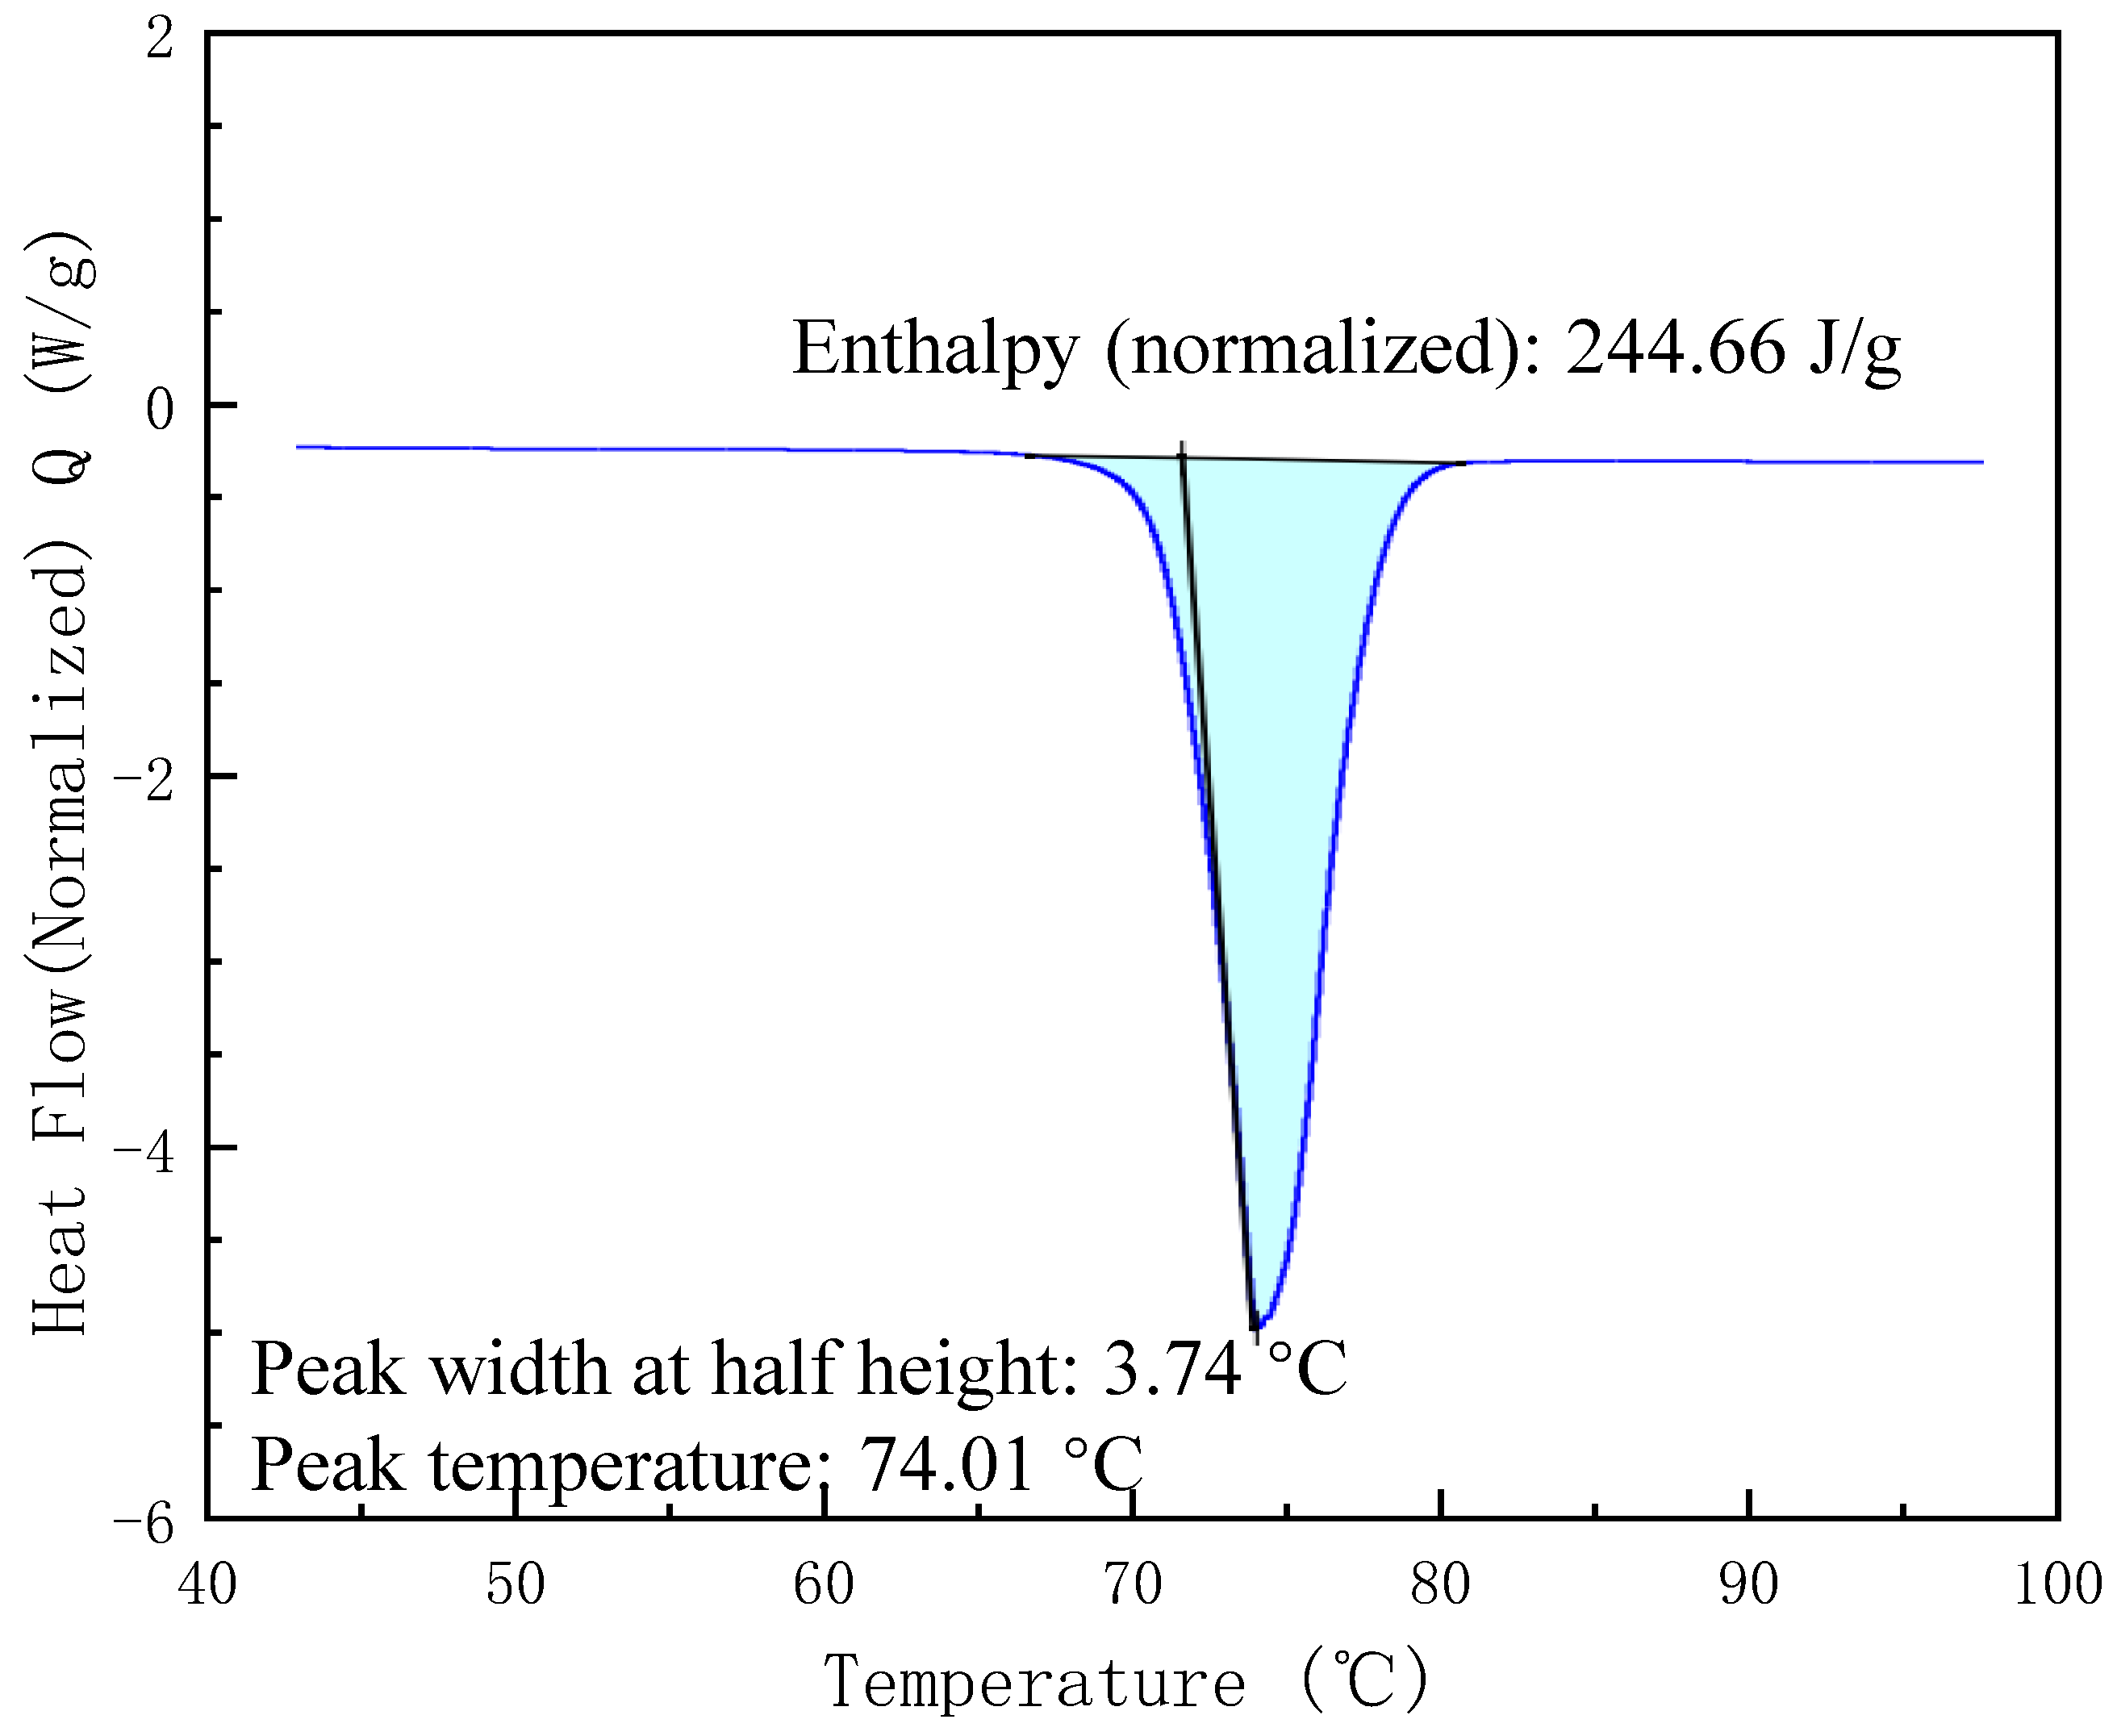
2.2. Theoretical Enthalpy Calculation

The entire process of phase change heat absorption can be divided into three stages. The sensible heat absorption process absorbs heat through the temperature rise of the shell and PCM in the first stage. The latent heat of PCM dominates in the second. This stage lasts until all of the paraffin wax has melted, at which point the temperature continues rising at the third stage.
The total enthalpy of PCM can be calculated by the sum of sensible enthalpy and latent enthalpy [35] as
h = h o + T o T C p d T + λ L
where To is the initial temperature, ho is the enthalpy of reference, Cp is specific heat, L is the latent heat of PCM, and λ is the liquid fraction that varies between 0 and 1, which can be calculated by
λ = 0 ,                    i f         T < T s 1 ,                    i f         T > T l T T s T l T s ,            i f         T s < T < T l
Here, Tl and Ts denote the liquidus and solidus temperatures. In this temperature range, PCM takes place, forming a mushy region [36].

3. Experimental

3.1. Materials

The PCM was purchased from Hangzhou Joule Heat Transfer Technology Co., Ltd. (Hangzhou, China). It can be seen from the DSC curve that its melting point is 74.01 °C, and the latent heat of phase transformation is 244.66 Jg−1. The thermal conductivity of the paraffin wax (solid/liquid phase) is 0.2 Wm−1 k−1, and volume expansion coefficient is 1.21 (liquid density 0.87 g/cm3, solid density1.05 g/cm3).
The phase change module shell was made of aluminum alloy 6063-T6, with a thermal conductivity of 202.4 Wm−1 K−1 and density of 2719 kg/m3 [11]. The contact surface of the chip and the phase change module was coated with a thermally conductive ester, with a thermal conductivity of 6 Wm−1 K−1, to reduce the contact thermal resistance between them; it was purchased from Suzhou TianMai Thermal Technology Co., Ltd., Suzhou, China.

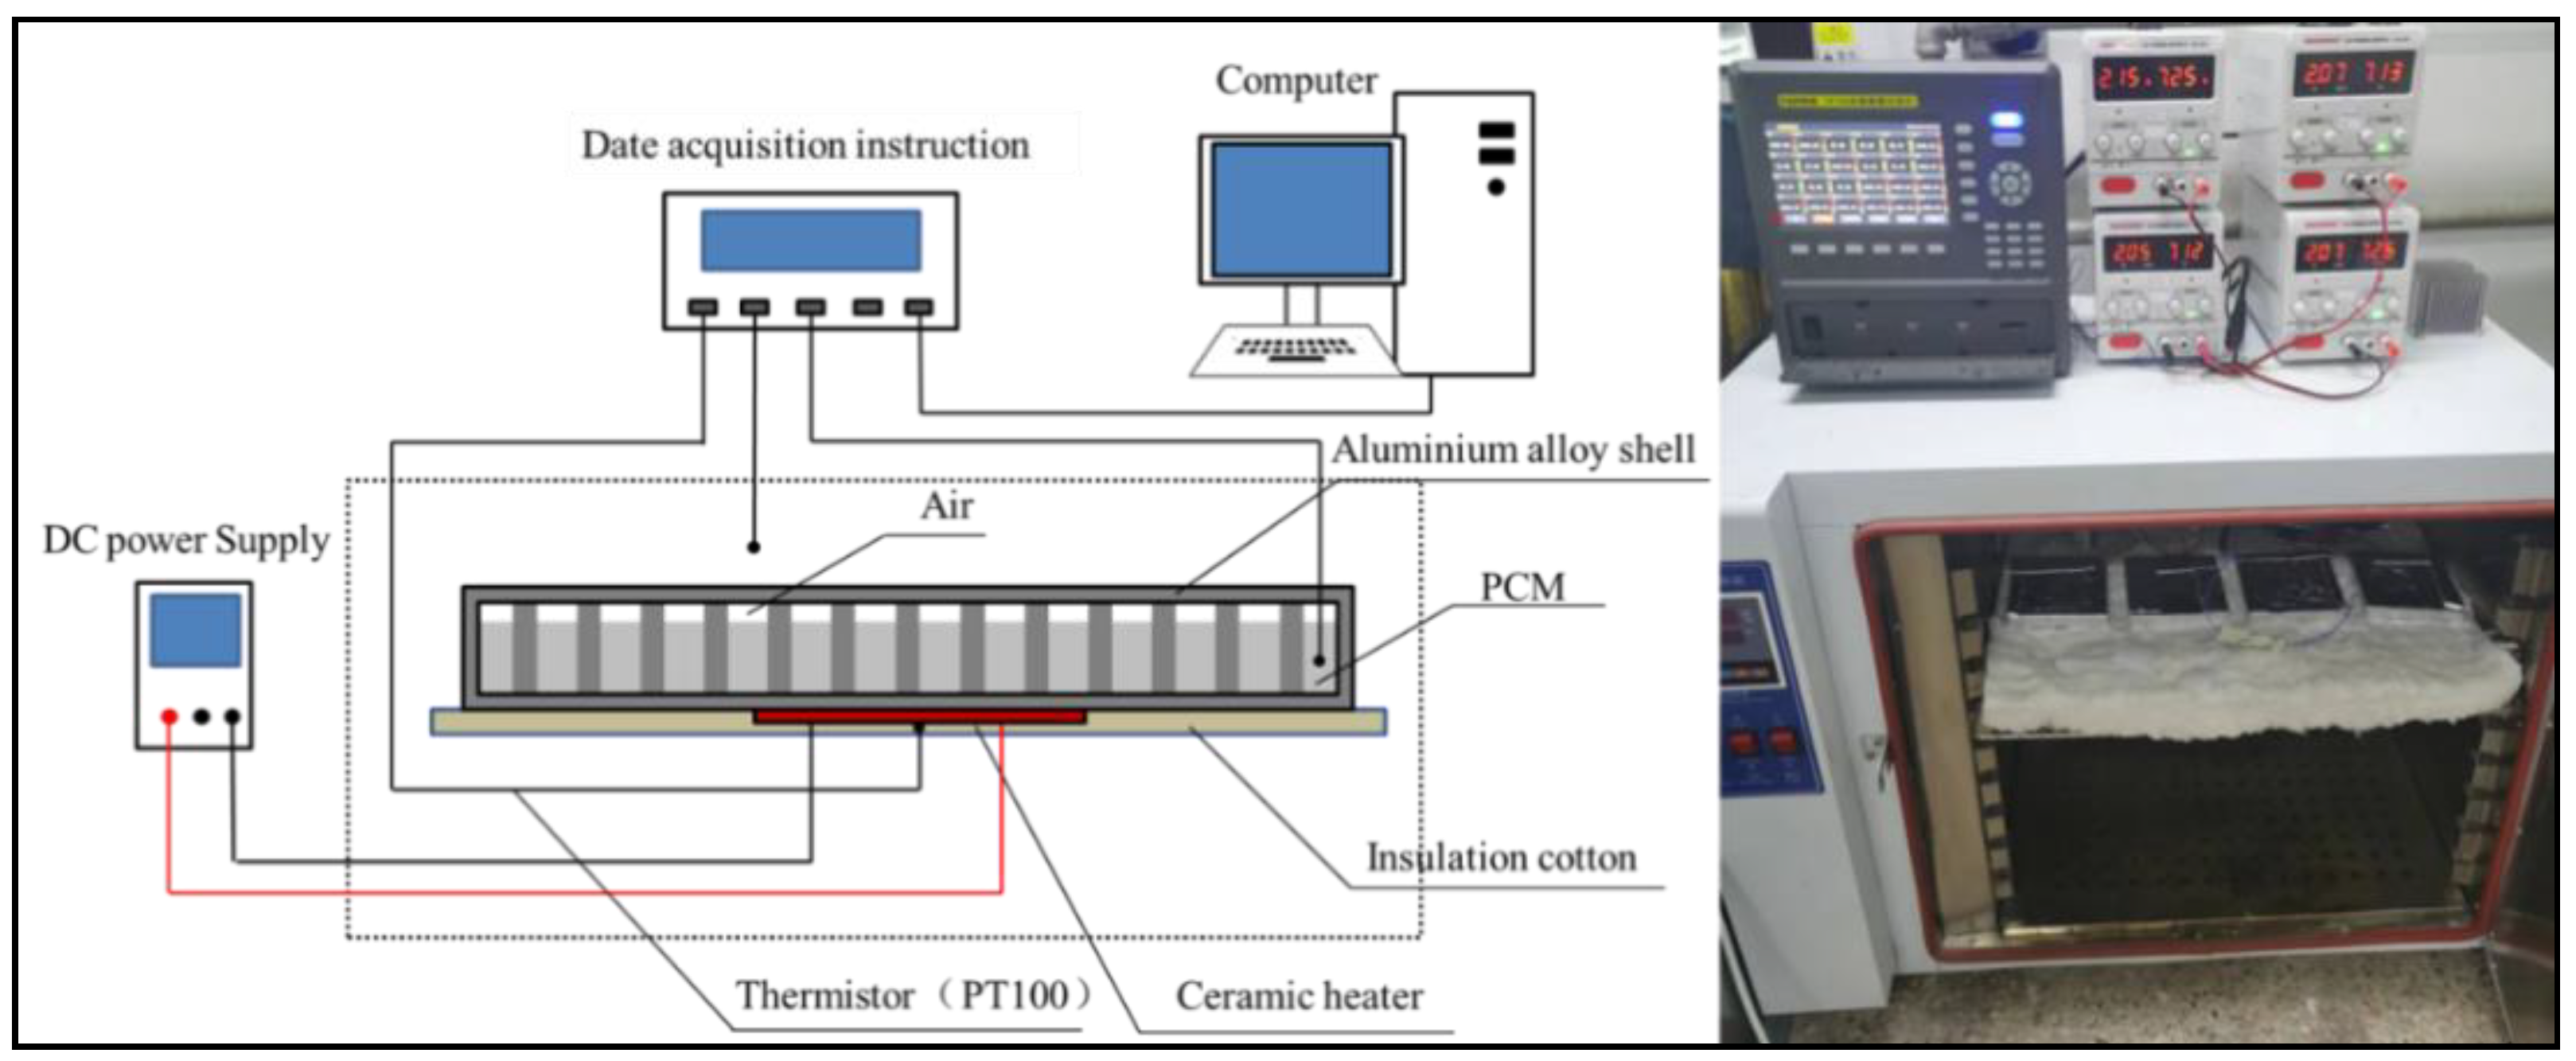
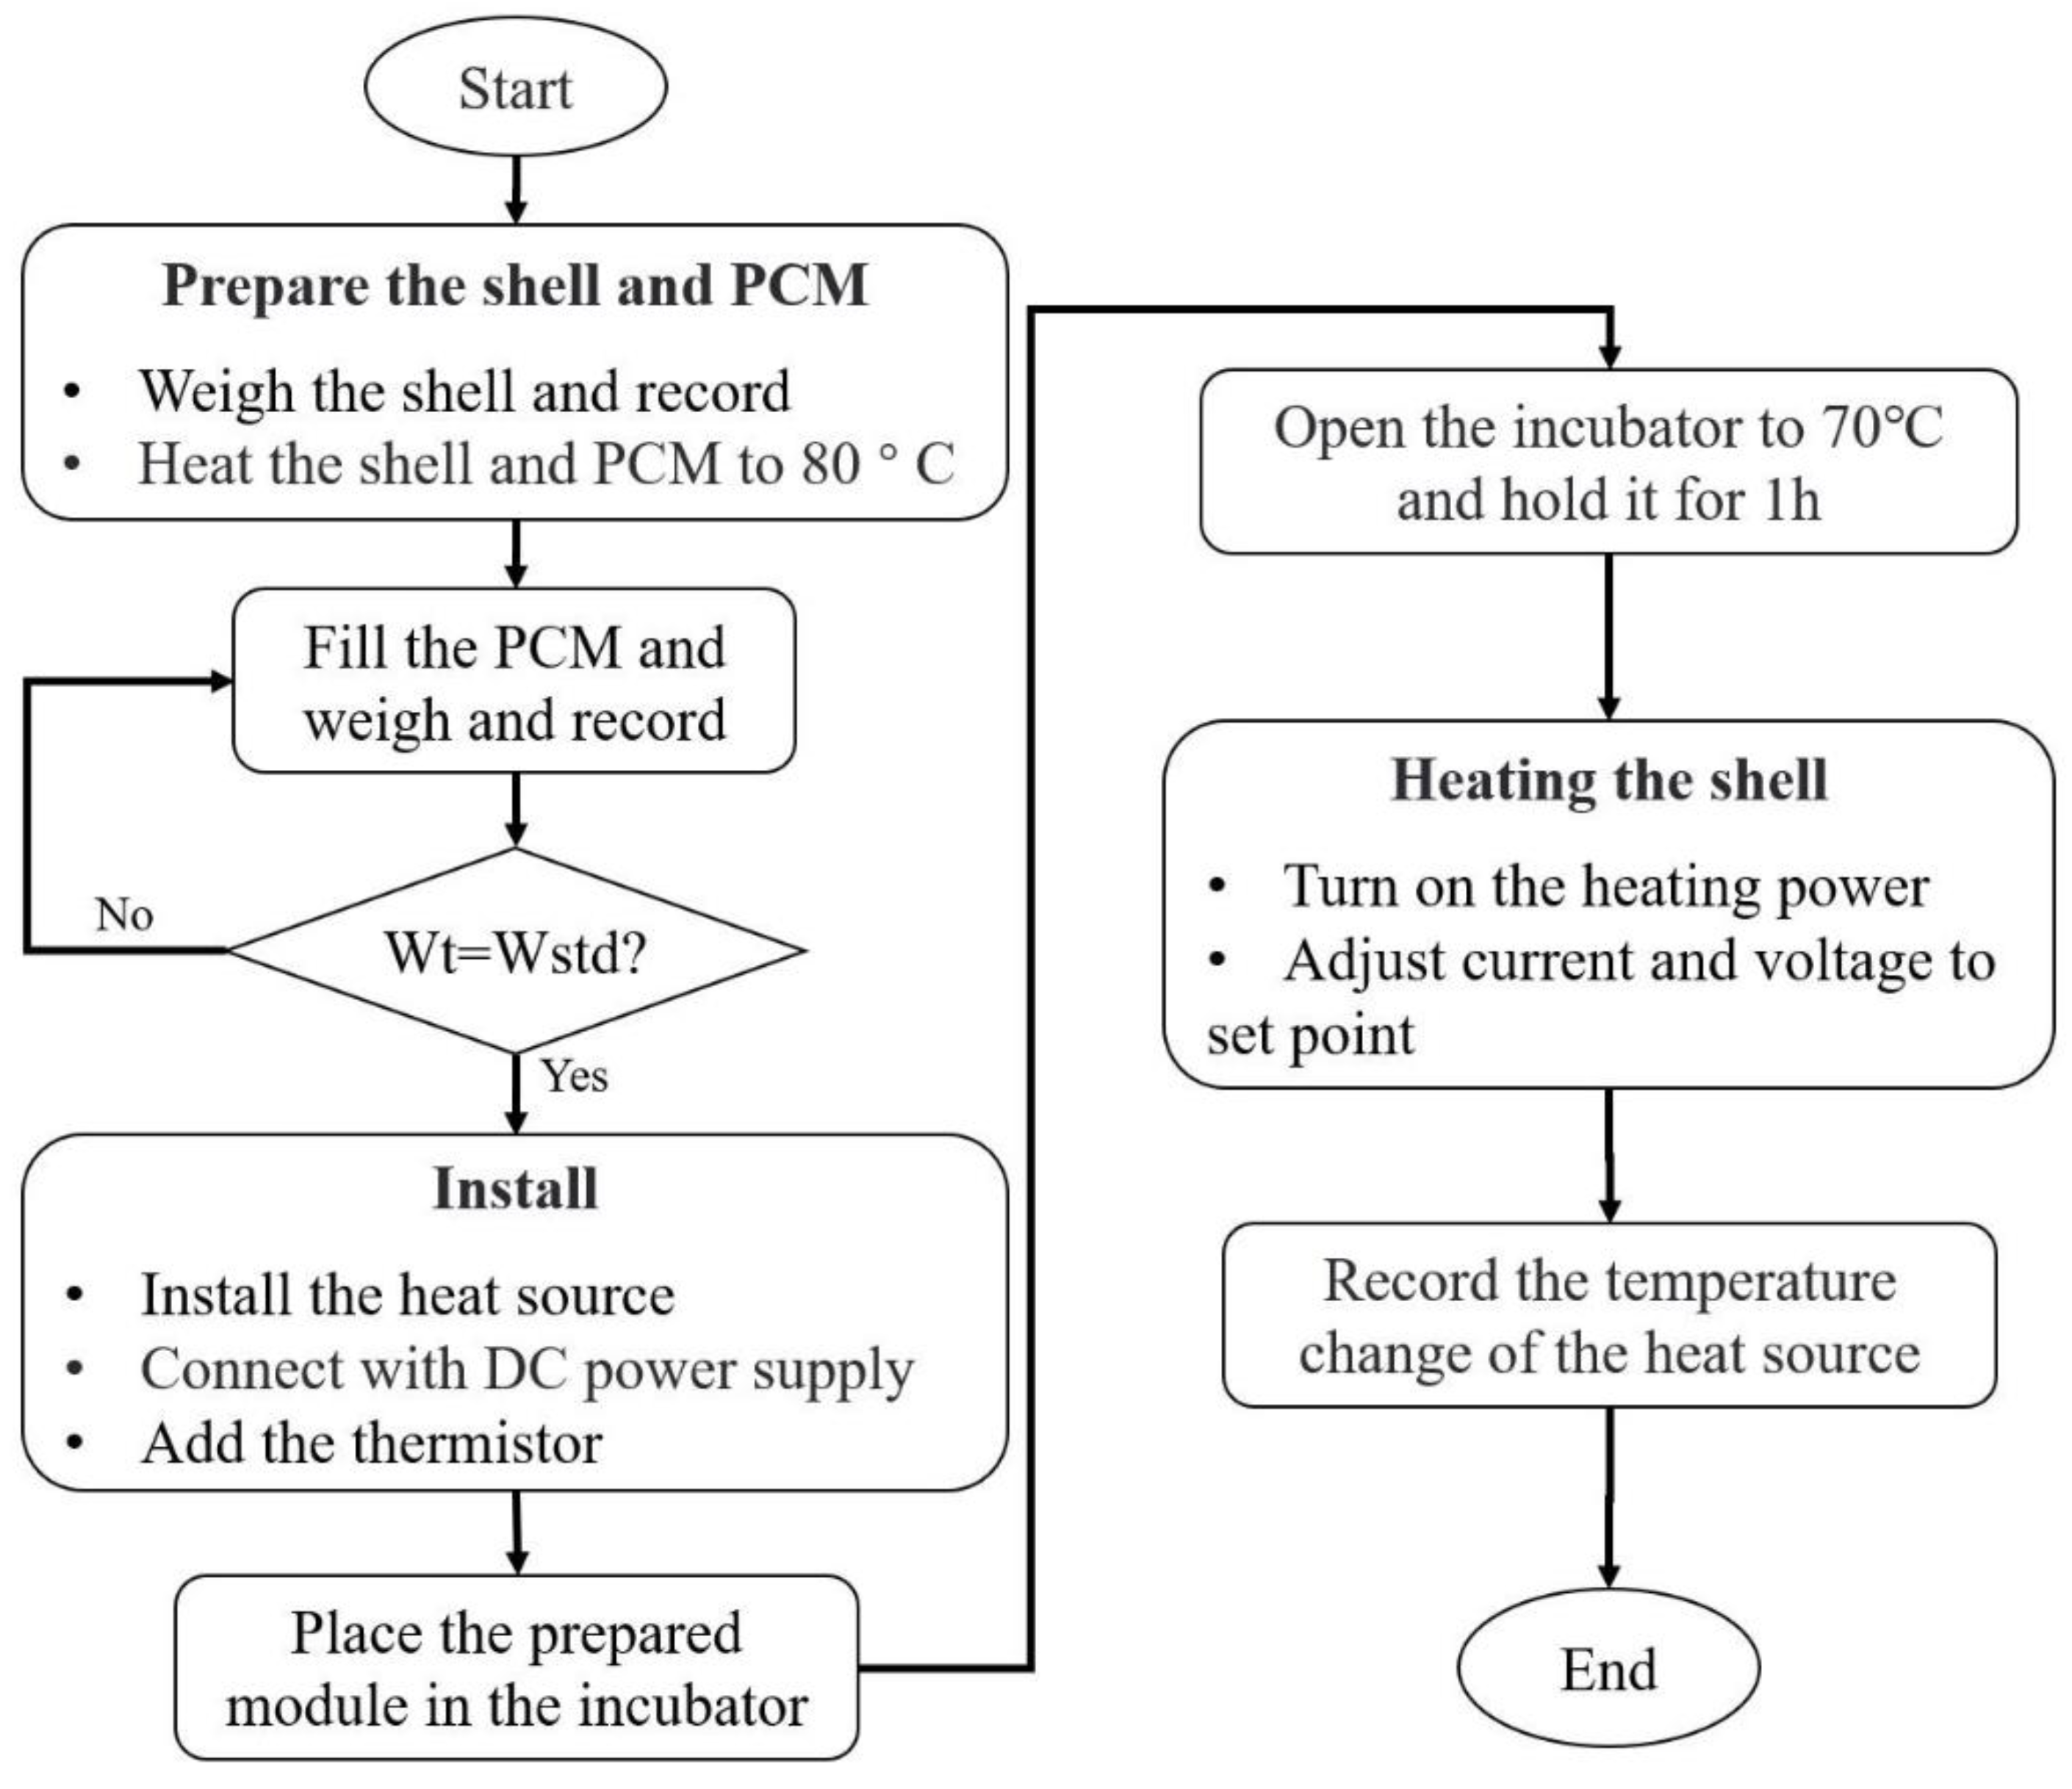
3.2. Experimental Procedure

Paraffin wax with a phase transition point of 74.01 °C was selected as the PCM of the passive thermal management system under a 70 °C extreme missile-carrying environment. The experiments were carried out under natural convection conditions in an incubator. The data logger was used to record the temperature change process. In order to better compare the heat dissipation performance of each phase change module, the lower surface of the chip was insulated with thermal insulation cotton. The heat transfer and temperature control performance can be obtained by comparing the temperature variation of the heating surface.
A ceramic plate heater, made of AL2O3 coated with electrode slurry, was used for a heat supply. We prepared three sizes of heating plates, 30 mm × 30 mm, 40 mm × 40 mm, and 50 mm × 50 mm, and the thickness was uniformly 2 mm.
A data acquisition instrument (TOPRIE-TP700)and thermistor were used to test and record the temperature of each node. The temperature measurement accuracy of PT100 is 0.01 °C. Nine thermistors were used to monitor the temperature of the heat source as well as the PCMs. We pasted the thermistor numbers SD1~SD4 on the bottom of the heater, respectively, and pasted SD5~SD8 in the PCM at the edge of the module, as shown in Figure 4, to control the temperature of the material when the heating began. A thermocouple SD9 was placed 150 mm away from the modules inside the incubator to measure the ambient temperature of the modules.
Four DC power supplies (MAISHENG-MS305D) were used to control the power of the plate heater. We provided a constant heat flow by changing voltage and current. A scale with a measurement accuracy of 0.1 g was used for weighing to ensure the same weight of the phase change material was filled in each module. After the phase change material was filled, the upper cover was bonded to the casing through a thermally conductive ester. Figure 4 shows the designed and constructed experimental setup.
A vacuum incubator (KEWEI-DZF) was used to provide the temperature environment for the test system. Then, the prepared test modules were placed evenly on the insulation cotton in the incubator. The bottom surfaces of the chip and modules were covered with heat preservation cotton to reduce heat loss during the experiment and make the heat dissipate from the heat sink as much as possible. Before the test, the temperature of the incubator was adjusted to 70 °C and kept for 1 h to ensure that the temperatures of both the inner box and the phase change module were uniform.
The flow chart is shown in Figure 5.

4. Uncertainty Analysis

Many factors affect the experimental results, such as the fluctuation of the input power, the fluctuation of the temperature inside the incubator, the uniformity of the overall problem of the phase change module when the heat source is started, and the measurement error of the thermocouple. Among them, the initial temperature uniformity of the module and the input power have the greatest influence. To ensure experimental accuracy and consistency, we embedded a thermocouple inside each module to monitor the temperature of the phase change material and arranged a thermocouple around the module to monitor the temperature at the starting point to improve the accuracy of the test. We also considered the error of the input power.
To ensure the accuracy of the experiment results, we calculated the uncertainty and analyzed the error through the following equation [37].
Δ σ = ± i = 1 N ( σ θ i × Δ θ i )
where Δσ is the derivative of the desired quantity, Δθ is the error rate calculated in the quantity, and θ is the calculated value.

4.1. Error of Input Power

The absolute error and relative error of power during the experiment of each module are shown in Table 3.
Table 3 shows the initial current and voltage inputs for each type of heat source, with the input error controlled within 2%. During the experiment, the resistance of the simulated heat source increased with the increase in temperature, which also brought fluctuations in input power. From the beginning to the end of the experiment, the input power decreased by about 2~3%. In the same set of experiments, the declines were similar.

4.2. Error of Ambient Temperature

In the present work, the constant temperature box heated from the bottom ensured that the experiment’s environment stayed at the appropriate temperature. Consequently, there was a temperature difference of around 3 °C between the bottom and top of the box and a difference of about 1.8 °C between the center and the edge of the box. The four modules were arranged in a single plane for the experiment, which had minimal impact from thermal convection and radiation.

4.3. Error of Processing and Filling

The actual weight of each module was slightly heavier than the design weight because of processing errors and chamfering. As shown in Table 1, each of the four module shells weighed 2.67%, 2.23%, 2.77%, and 1.67% more than the design weight. The difference in the filling amount of the phase change material was 0.1 g, 0 g, 0 g, and 0.8 g. However, the cells of module 3 were not connected, which made the uniformity of the material filling difficult to ensure and also led to the existence of the error.
All of the aforementioned factors brought errors into the test results, among which the input power had the greatest impact. During the result comparison process, we discarded data with large errors to ensure that the input relative error was less than 2%, ensuring the accuracy of the test results.

5. Results and Discussions

In the experiment, 36 sets of comparative experiments were designed according to the heat source area, power, and fin shape. The following two sets of comparisons were carried out to analyze the temperature rise characteristics under different states and to propose optimization ideas.

5.1. Temperature Rise of Different Fin Structures

Four types of fins (columnar-shaped, bar-shaped, square-shaped, and sunflower-shaped) of the heat sources with three sizes of heat sources were loaded with 10 W, 20 W, and 30 W power, respectively, to compare and analyze the temperature rise of each module under different heat source conditions. The optimal fin scheme under different power conditions was obtained.
The temperature change over time under 10 W is displayed in Figure 6. When the heater size was 30 mm, the end heat sink temperatures were 81.8 °C, 78.4 °C, 76.3 °C, and 77.9 °C, correspondingly. For the 40 mm heaters, the temperatures were 80.3 °C, 76.7 °C, 75.4°C, and 75.8 °C; for the 50 mm heaters, they were 77.2 °C, 75.3 °C, 74 °C, and 74.6 °C, respectively.
It was obvious from the experimental results that the temperature rise of module 1 was the maximum and module 3 was minimal, followed by module 4. The temperature rise of each module in different states is listed in Table 4. For eachof comparison, we used the temperature rise in module 1 as a baseline and compared it with the percentages of module 2, module 3, and module 4, which were all lower than module 1. As shown in Table 4, the temperature rise of module 3 was 47.1%, 47.1%, and 44.3% lower than that of module 1 under different heat sources. The data for module 2 were 29.4%, 34%, and 24.3%. This showed the superiority of module 3 in low-power heat dissipation. That is because when the power was low, the melting of the material directly above the heat source played a major role. The square-shaped and sunflower-shaped fins formed a network structure with high local thermal conductivity, which quickly absorbed the heat of the heat source to suppress the temperature increase in the heat source. In addition, the good performance of module 3 at low power may also be related to the uneven filling of the phase change materials. The temperature rise difference decreased with the increase in the heat source area, as shown in Figure 6 and Figure 7.
Figure 7 shows that the final temperature rise of each module under the power of 30 W was 116.3 °C, 96.8 °C, 99.9 °C, and 103.4 °C for the 30 mm heater; 108.3 °C, 87.3 °C, 88.9 °C, and 89.1 °C for the 40 mm heater; and 95.7 °C, 83.6 °C, 86.4 °C, and 85.6 °C for the 50 mm heater, respectively. As can be seen from the figures, when faced with high power density, module 3 and module 4 had better initial performances. Taking a 30 mm heater as an example, after 5 min of operation, the temperatures of heat sources 1, 2, 3, and 4 were 100.7 °C, 89.6 °C, 87.2 °C, and 87.8 °C, respectively. The temperature of heaters 3 and 4 were 2.4 °C and 1.8 °C lower than that of heater 2, respectively.
As can be seen from Table 5, after 10 min of work, the temperature increase in module 2 was the smallest at each heat source size. With the prolongation of the heating time, the performance of module 2 was more stable. When the time reached a certain point, the temperature of module 3 and module 4 exceeded module 2. The reason is, compared with module 3, the fin spacing of module 2 was only 3 mm, which was lower than the 7.8 mm of module 3, and, compared with module 4, its fin thickness was 2 mm, which was thicker than 1 mm of module 4 (Figure 1). Therefore, module 2 was more efficient in utilizing the distant latent heat as the heating time increased.
Comparing the results in Figure 6 and Figure 7, it was found that under low-power conditions, the square-shaped and sunflower-shaped fins performed better. Under high-power conditions, the continuous mesh fins performed better initially but the linear fins with thicker thermal ribs were more stable and durable afterward.
The experiments showed a common result that the heat dissipation performance of the columnar-shaped structure was the worst. The reason is that the discrete fins cannot spread the heat laterally around the fins, but through the bottom plate and then conduct it upwards, which increases the path for heat conduction.

5.2. Thermal Performance under Different Powers and Heater Areas

In order to explain the temperature rise characteristics of each module more clearly, the temperature change of each heater under 30 W of power was used for an independent analysis. The experimental results are shown in Figure 8.
The temperature rise of the four modules decreased with the increase in the heat source area, which showed unity. The final temperature difference between the 40 mm and 50 mm heaters was smaller than the temperature difference between the 30 mm and 40 mm heaters.
For heat sources of 30 W of power, the heat flux density was 3.333 W/cm2, 1.875 W/cm2, and 1.2 W/cm2, accordingly.
When modules 3 and 4 were heated with a 30 mm heat source, Figure 8 demonstrates that the initial temperature rise was mild but climbed dramatically after 342 s and 350 s, respectively. This demonstrates that the overall thermal conductivity can satisfy the requirements of thermal diffusion at a heat flux density of 1.875 W/cm2. After 300 s, the temperature change rates of the three heat sources all increased significantly for module 1. This demonstrates that the heat flux of 1.2 W/cm2 is greater than the thermal diffusivity. Module 2 did not change all that much. This demonstrates that a 30 mm heat source exhibits good internal thermal diffusivity within 10 min.
From the temperature rise curves of each module, it was seen that the temperature rise of module 3 and module 4 was gentle in the initial stage; when the 30 × 30 mm heat source exceeded a critical point, the temperature rise slope increased, especially for module 4, as was obvious. The 40 × 40 mm and 50 × 50 mm heat sources did not show this change. The reason is that the thermal conductivity of the 40 × 40 mm and 50 × 50 mm heat sources were below the corresponding heat flux density of the fins, leading to minor thermal diffusivity. For module 1, the heat flux density of 1.2 W/cm2 exceeded its thermal diffusivity, so all three curves had inflection points. Module 2 did not change too significantly. This shows that for a heat source of 30 mm × 30 mm, a good internal thermal diffusion capacity within 10 min could elongate its temperature control time.

5.3. Analysis of the Temperature Rise Curve

Two critical points (inflection points) were seen from the results above. The first critical point indicated that the phase change material began to melt and the temperature rise rate of the heat source was suppressed. At this time, the heat source changed from a state of rapid temperature rise to a slow temperature rise. Then, it entered the second stage. During the process, the phase change material above the heat source was preferentially melted and the temperature rise rate was the slowest. Then, the heat was transferred to the remote end, and the remote phase change material gradually melted After that, the module absorbed heat and entered the sensible heat stage and the temperature of the heat source rose rapidly. A second critical point occurred between the second stage and the third stage, which characterized the transition of the phase change module from sensible heat dominance to latent heat dominance.
In Figure 9, for the sunflower-shaped fins, curve b shows that when the heater temperature T1 reached 78.6 °C the temperature rise rate slowed down, and when the heating time t2 reached 300 s the temperature rise rate increased significantly. Decreasing the power to 20 W, T1 dropped to 75.2 °C and t2 became 350 s. When the heater size was increased to 50 mm, T1 became 74.5 °C and the t2 inflection point did not appear within 600 s. When changing the heat sink to a bar-shaped structure, T1 rose to 83.4 °C and t2 was delayed by about 400 s. This shows that, for the same fin structure, as the power decreased, the temperature T1 decreased and the t2 was prolonged. The sunflower structure had greater local thermal conductivity and worse overall thermal conductivity; therefore, when compared to Heater 2, T1 of Heater 4 was raised and t2 was extended. In conclusion, Heater 2’s temperature was lower than Heater 4’s.
For the short-term temperature control requirements of the bomb, the design goal should be to reduce the temperature of the first inflection point and delay the second inflection point. The way to reduce inflection point 1 is to improve the heat transfer performance from the contact surface of the heat source to the phase change material to quickly suppress the temperature rise. When the heat source area is fixed, delaying the appearance of the second inflection point will increase the overall thermal conductivity, strengthen the heat transfer effect of the fins, spread the heat to the edge of the module, and increase the effective heat fusion.

6. Conclusions

The experiment studied the temperature control of the chip in a short time by heat sink with different fin structures in a high-temperature environment of 70 °C. The heat dissipation effect of the four PCM heat sinks was evaluated by loading 10 W, 20 W, and 30 W of heat from 30 × 30 mm, 40 × 40 mm, and 50 × 50 mm heat sources, respectively.
The results showed that continuous fins provide better heat dissipation than discrete fins.
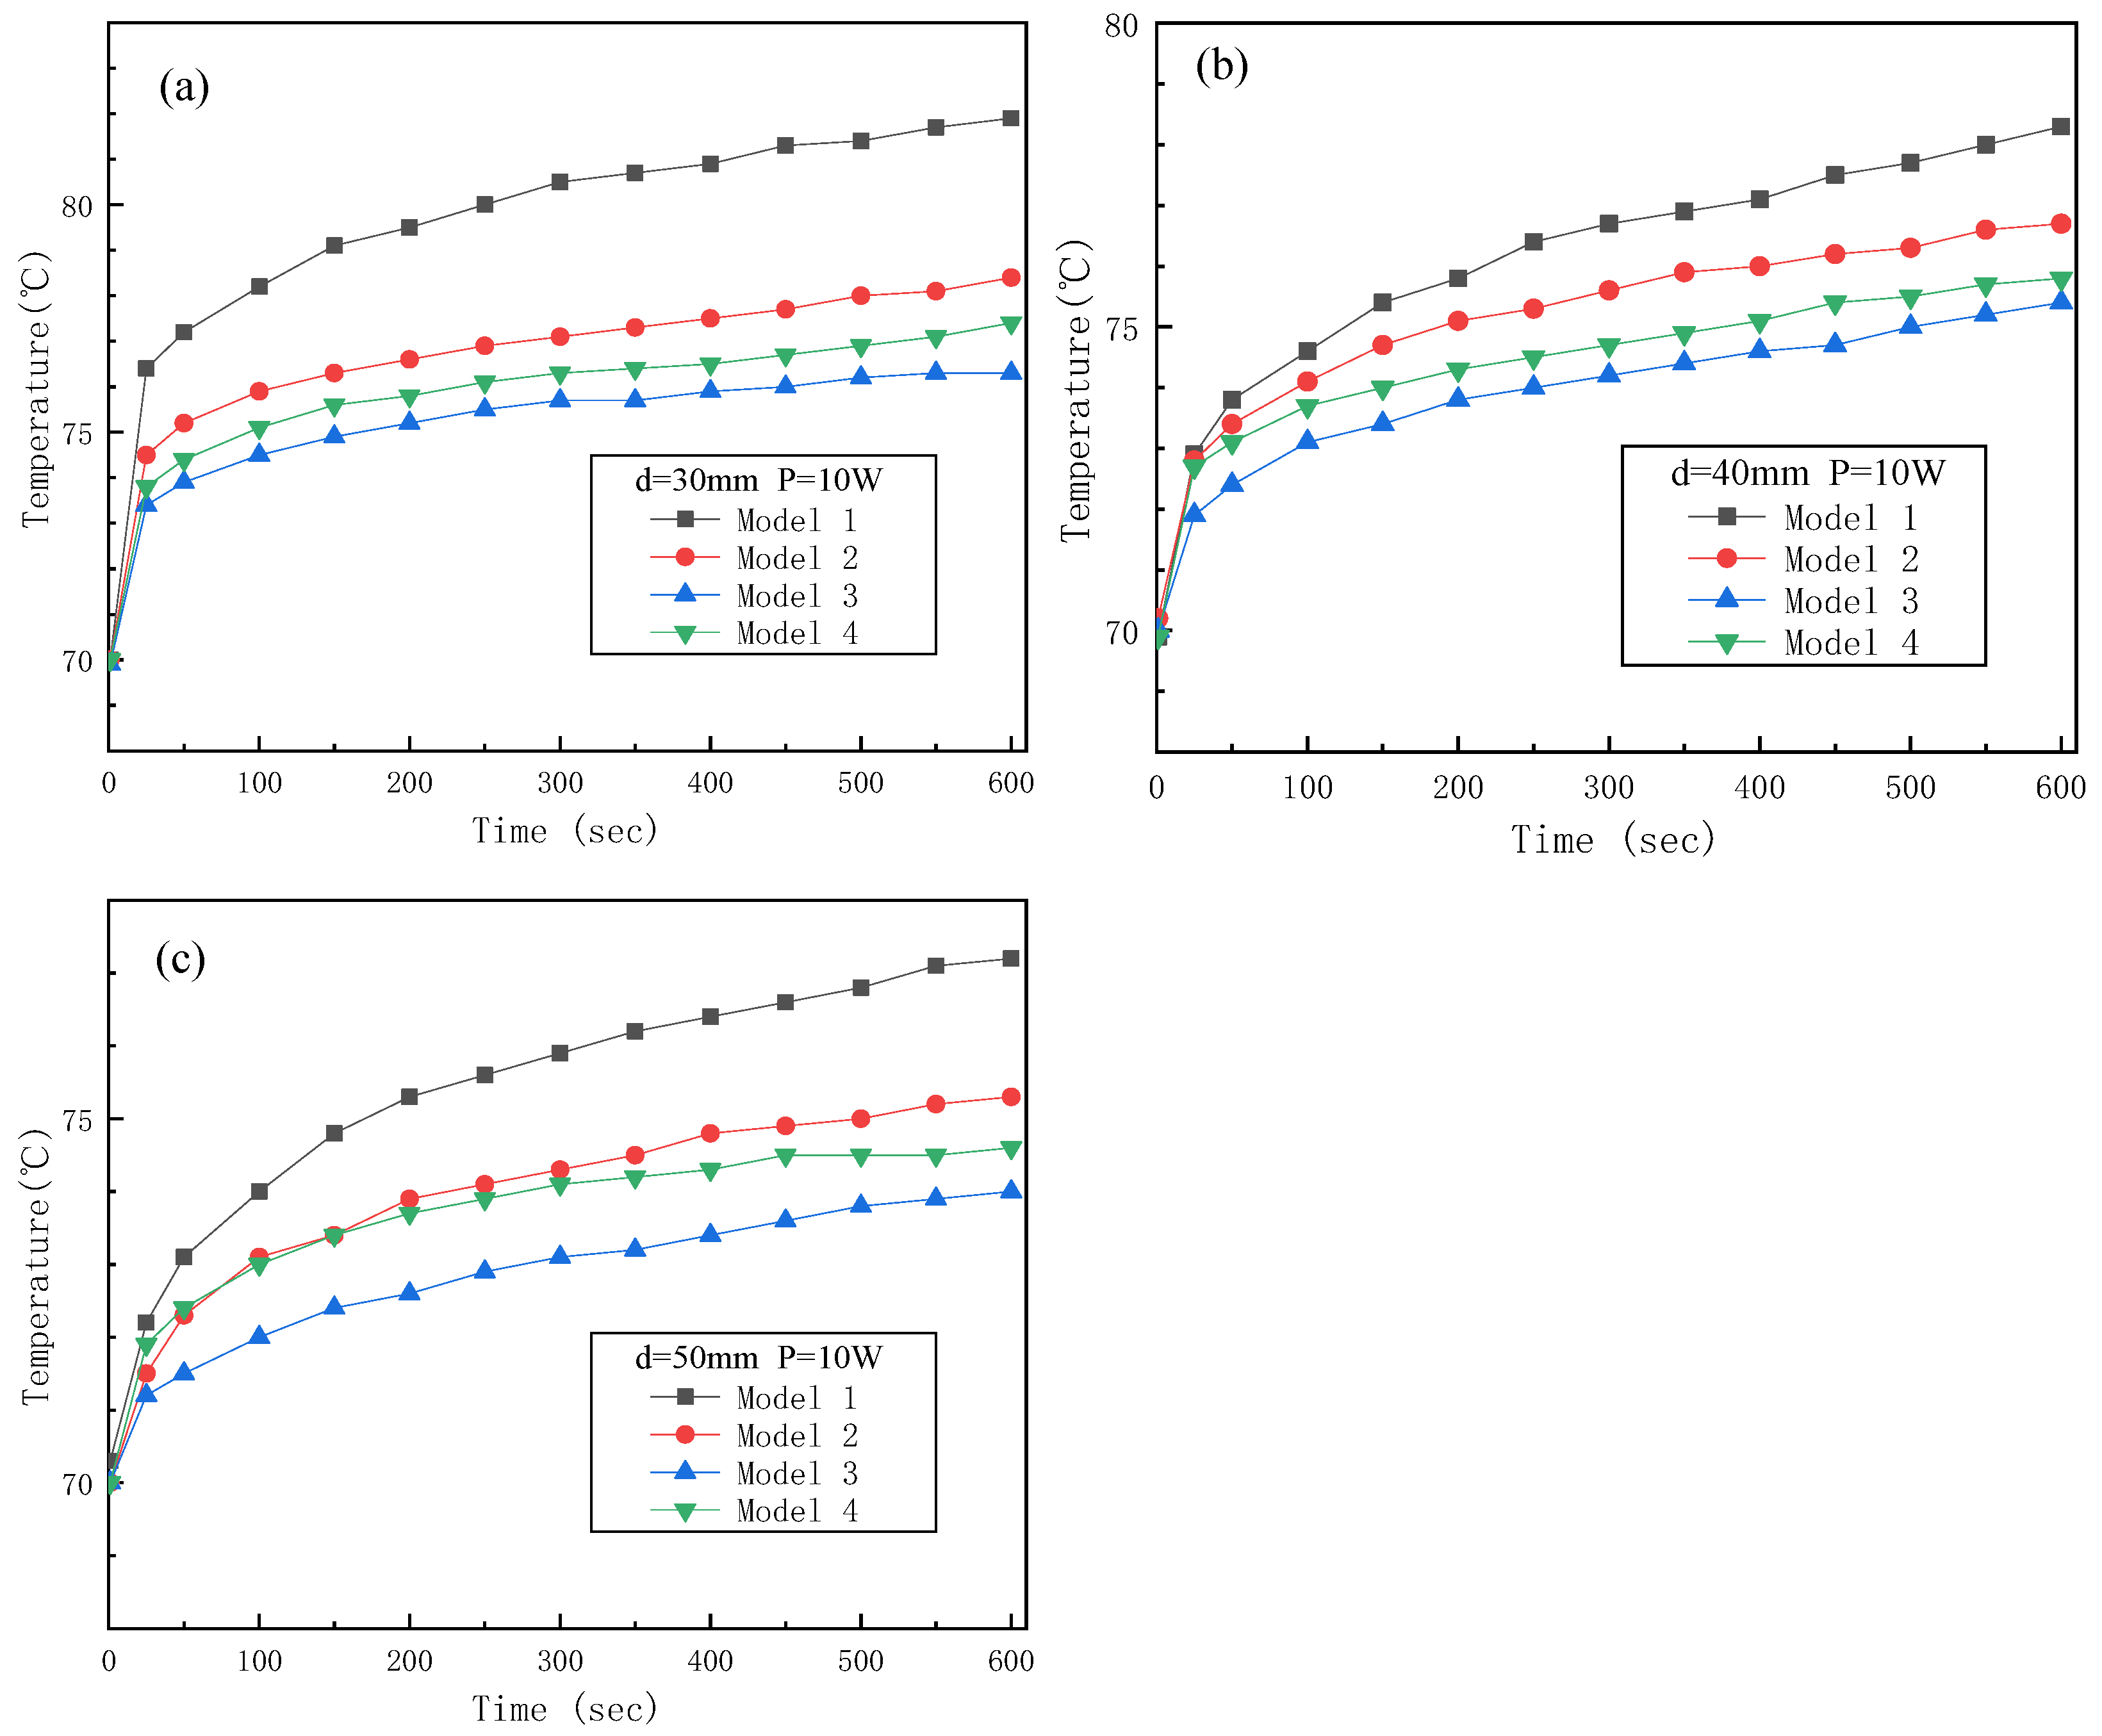
  • In the case of low power (10 W), the continuous fin structure in module 3 and module 4 had better performance. Under the power consumption of 10 W, the square-shaped fin structure in module 3 performed the best. Based on the temperature rise of module 1, the temperature rise of module 3 was about 10%~20% lower than that of module 2.
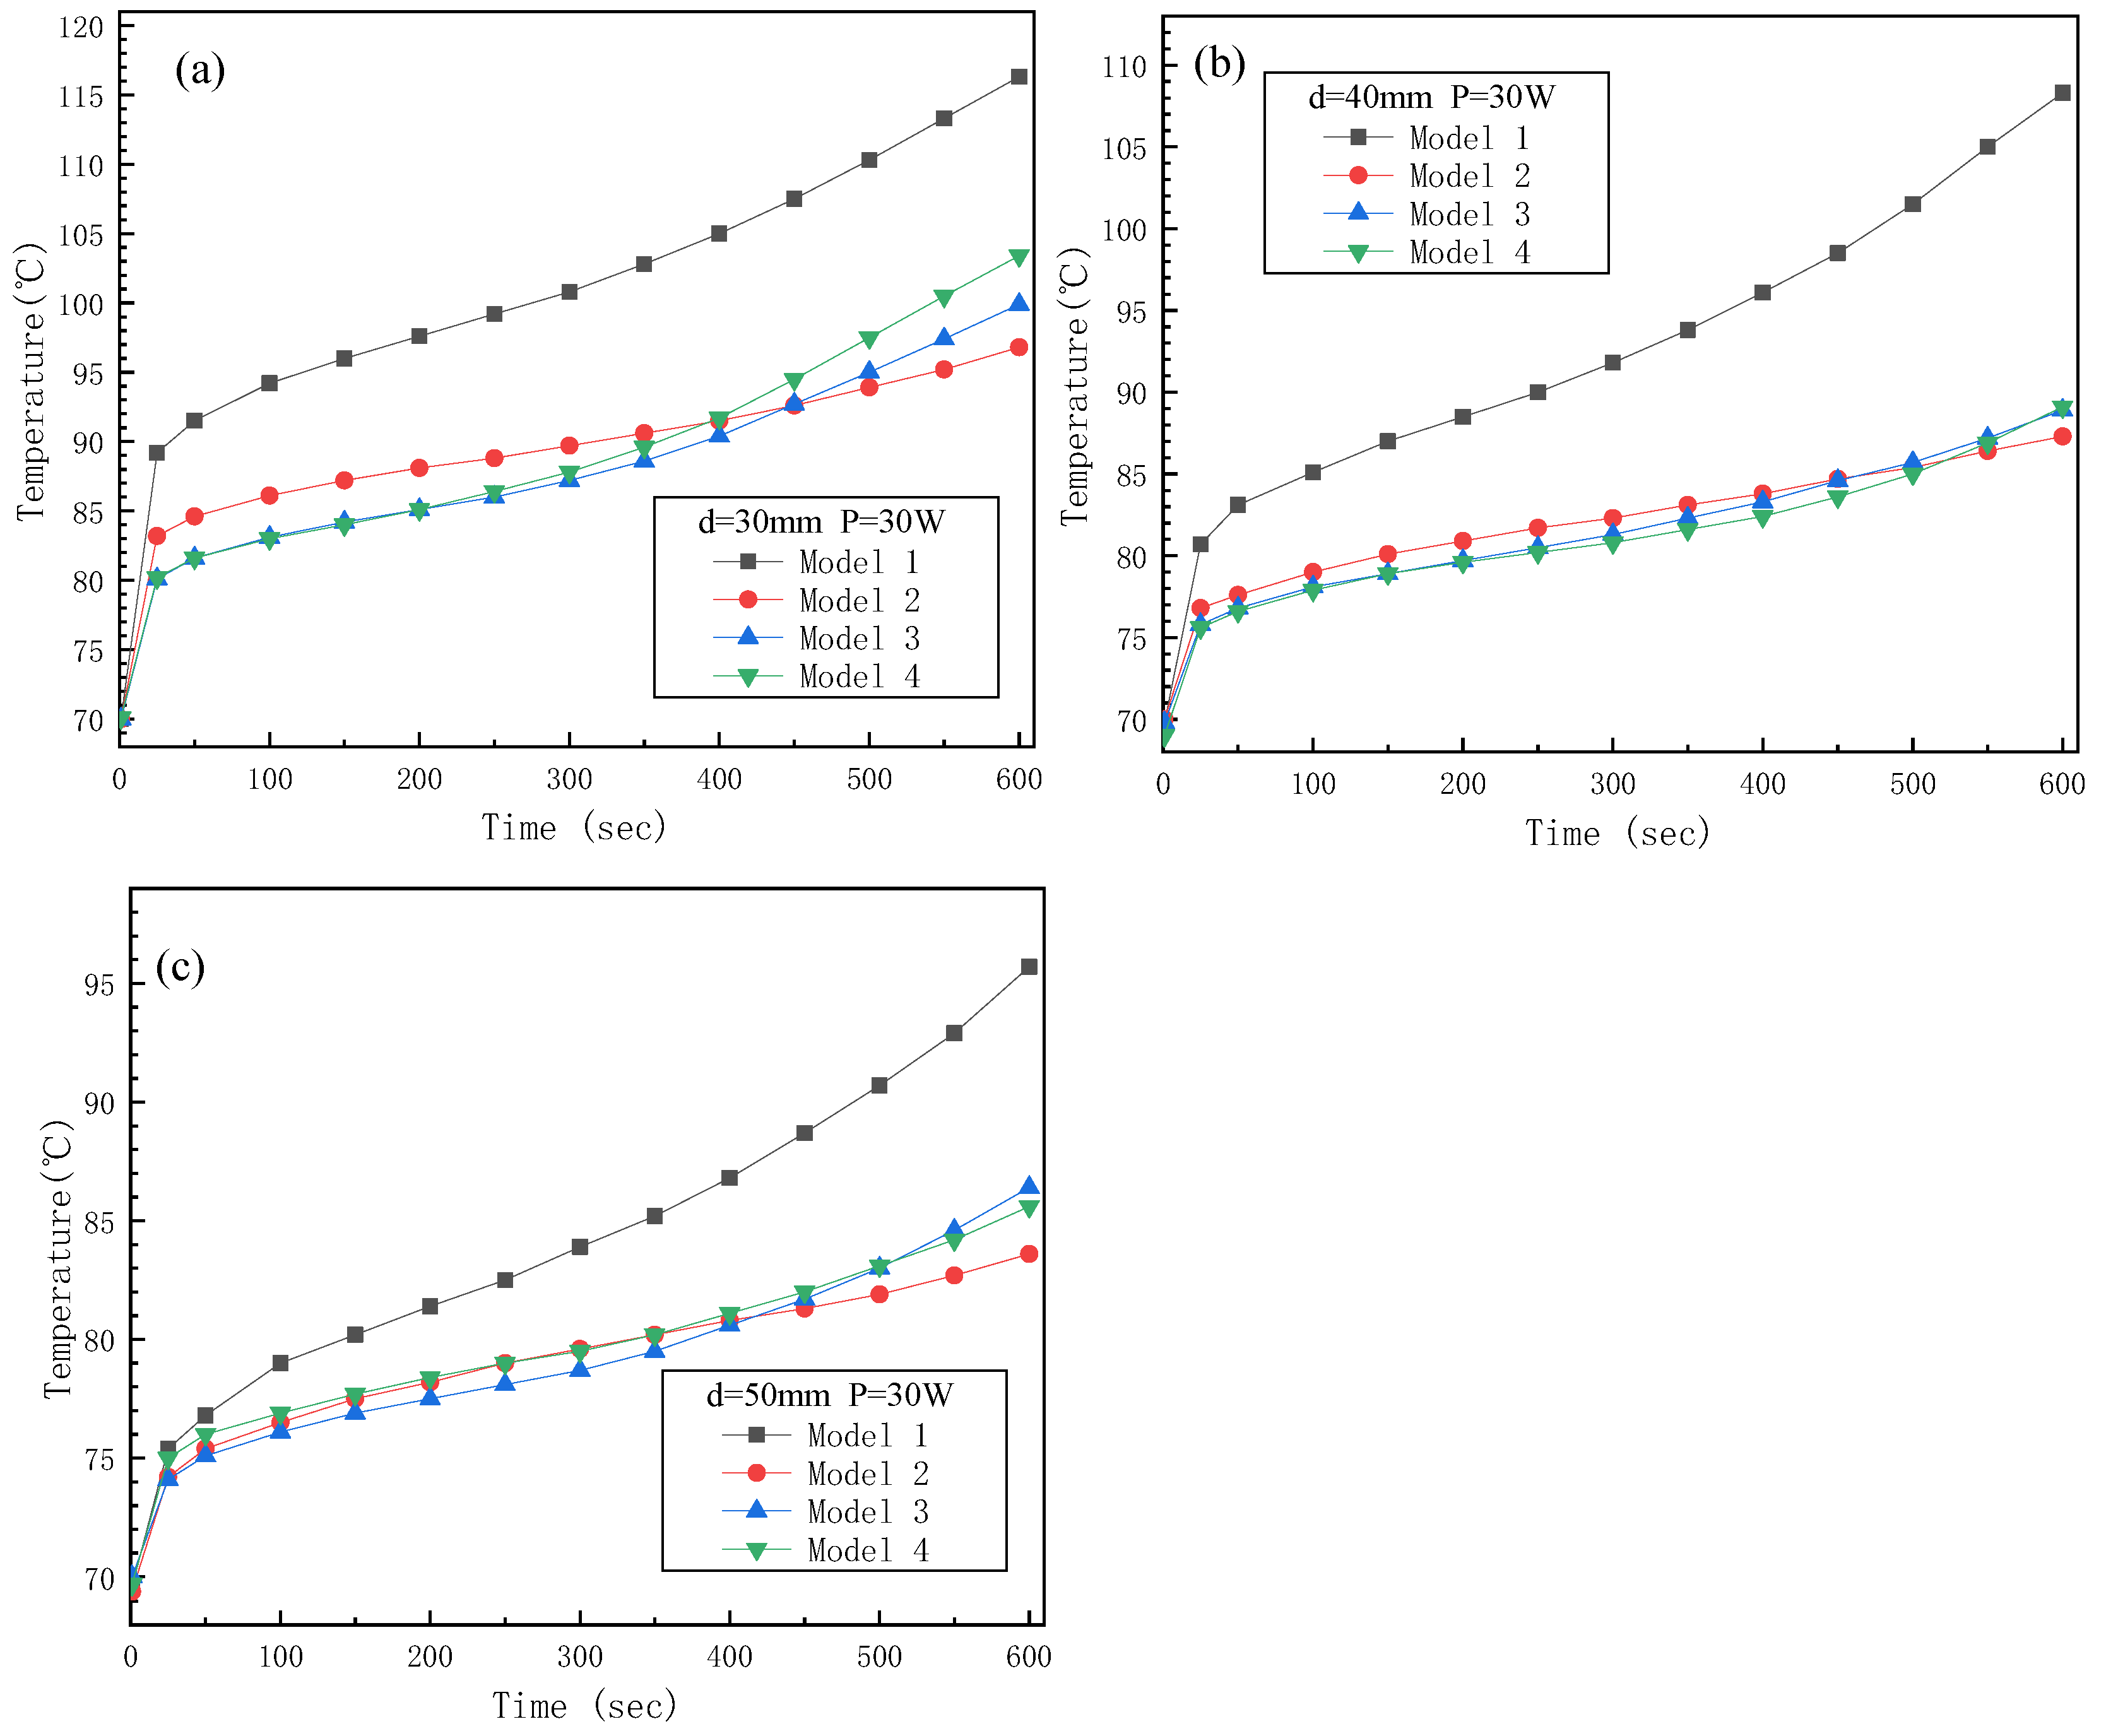
  • Under the condition of 30 W power, the early stage in module 3 and module 4 had a better heat transfer effect. However, with the prolongation of heating time, the thickness and spacing of the fins played an important role; the linear fin structure in module 2 showed a more stable and lasting enhanced heat dissipation capability.
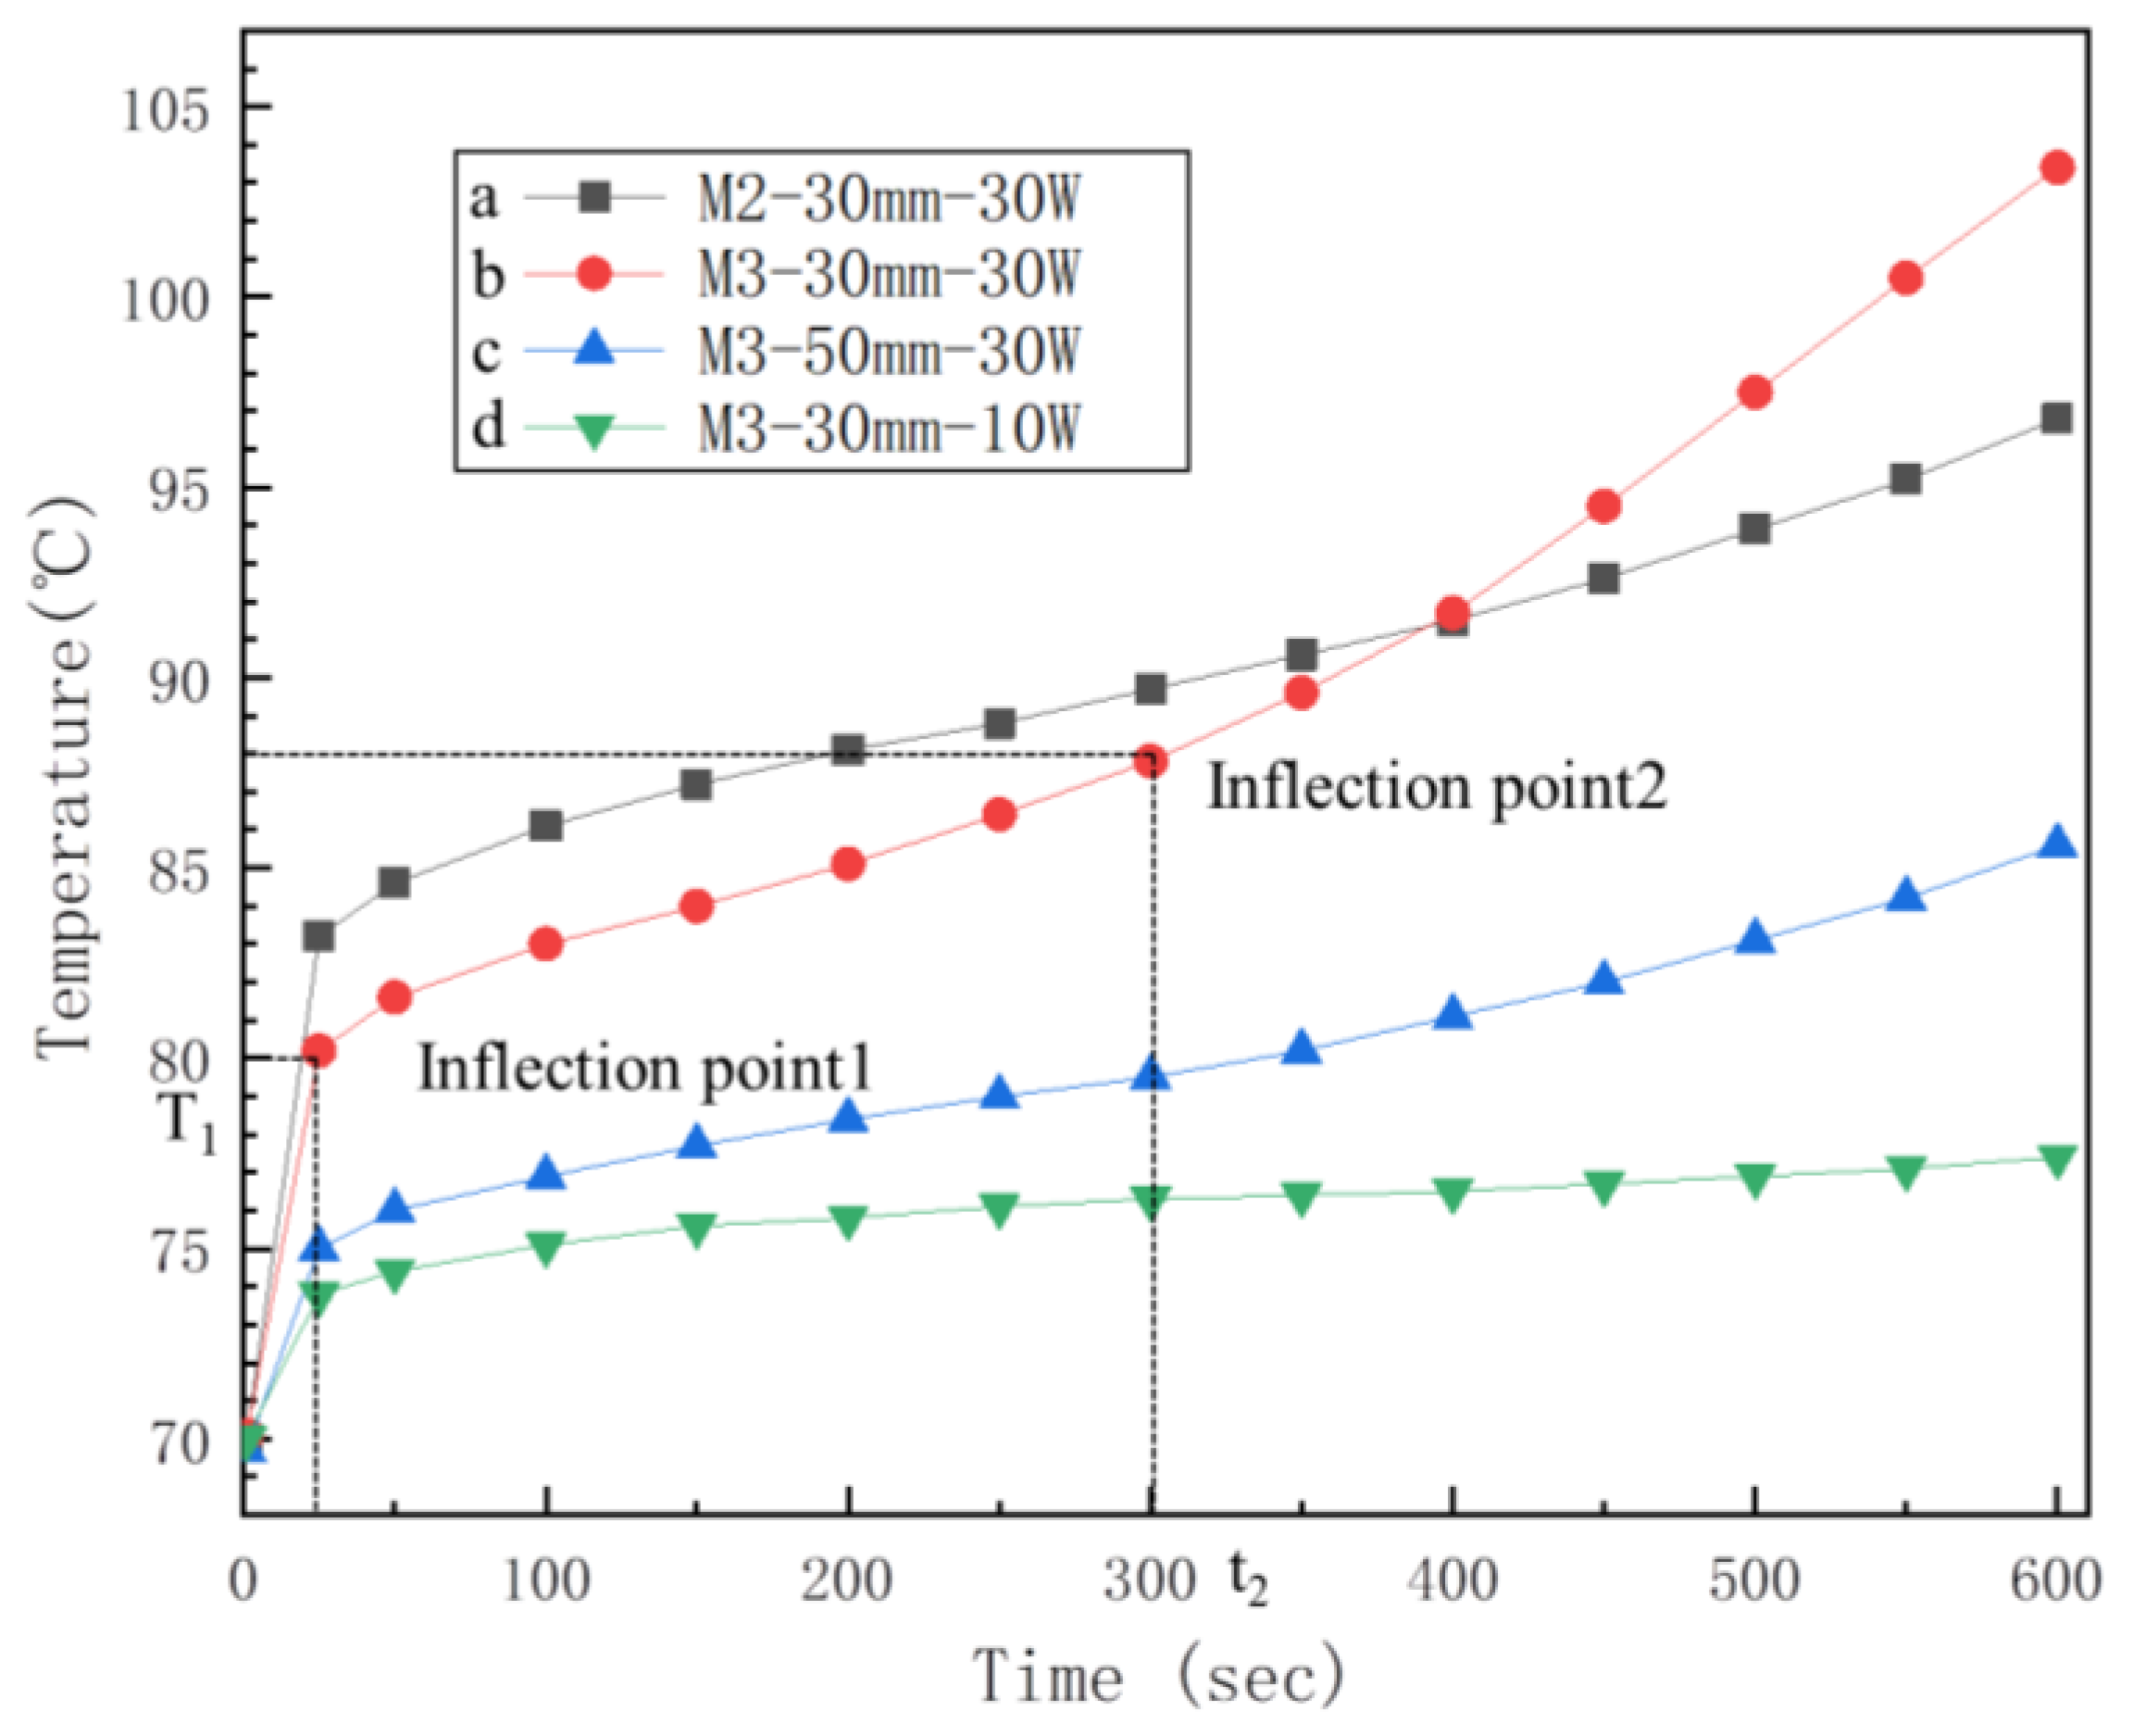
  • For heat sources that work for a long time, the emphasis is on extending the heat to the surrounding area and extending the time of the second inflection point.
  • For heat sources with high power consumption and a short working time, the focus is on strengthening the local thermal conductivity and reducing the temperature of the first inflection point.
The research ignored the intricacy of the process realization of different fin structures in favor of practical engineering needs. In actuality, processing and paraffin filling are made easier by discrete and semi-discrete fin structures. In real-world applications, the right fin structure can be chosen based on the properties of the heat source. The study presented in this paper serves as a resource and foundation for the choice of fin kinds.

Author Contributions

Conceptualization, Y.H.; data curation, X.L., Y.W. and Z.C.; formal analysis, Y.W.; funding acquisition, K.Z. and Y.H.; investigation, X.L., Y.W. and Z.C.; methodology, X.L., Y.W., Z.C. and M.G.; resources, M.G.; software, Z.C.; supervision, K.Z. and Y.H.; validation, M.G.; writing—original draft, X.L.; writing—review and editing, K.Z., M.G. and Y.H. All authors have read and agreed to the published version of the manuscript.

Funding

This work was supported by the National Natural Science Foundation of China (Grants No. 52276046 and No. 52176051).

Acknowledgments

We are grateful to Caiyun Wang who made proofreading of the manuscript. We also greatly appreciate Xiaochuan Liu’s useful discussion.

Conflicts of Interest

The authors declare no conflict of interest.

References

  1. Wang, J.G.; Lu, S.; Wang, Y.Z.; Wang, K. Effect analysis on thermal behavior enhancement of lithium-ion battery pack with different cooling structures. J. Energy Storage 2020, 32, 101800. [Google Scholar] [CrossRef]
  2. Akkaldevi, C.; Chitta, S.D.; Jaidi, J.; Panchal, S.; Fowler, M.; Fraser, R. Coupled Electrochemical-Thermal Simulations and Validation of Minichannel Cold-Plate Water-Cooled Prismatic 20 Ah LiFePO4 Battery. Electrochem 2021, 2, 643–663. [Google Scholar] [CrossRef]
  3. Sharma, D.K.; Prabhakar, A. A review on air cooled and air centric hybrid thermal management techniques for Li-ion battery packs in electric vehicles. J. Energy Storage 2021, 41, 02885. [Google Scholar] [CrossRef]
  4. Tousi, M.; Sarchami, A.; Kiani, M.; Najafi, M.; Houshfar, E. Numerical study of novel liquid-cooled thermal management system for cylindrical Li-ion battery packs under high discharge rate based on AgO nanofluid and copper sheath. J. Energy Storage 2021, 41, 102910. [Google Scholar] [CrossRef]
  5. Pesaran, A.A. Battery Thermal Management in EVs and HEVs: Issues and Solutions," presented at Advanced Automotive Battery Conference. Battery Man 2001, 6, 34–39. [Google Scholar]
  6. Amine, K.; Liu, J.; Belharouak, I. High-temperature storage and cycling of C-LiFePO4/graphite Li-ion cells. Electrochem. Commun. 2005, 7, 669–673. [Google Scholar] [CrossRef]
  7. Ramadass, P.; Haran, B.; White, R.; Popov, B.N. Capacity fade of Sony 18650 cells cycled at elevated temperatures Part I. Cycling performance. J. Power Sources 2002, 112, 606–613. [Google Scholar] [CrossRef] [Green Version]
  8. Parry, A.J.; Eames, P.C.; Agyenim, F.B. Modeling of Thermal Energy Storage Shell-and-Tube Heat Exchanger. Heat Transf. Eng. 2014, 35, 1–14. [Google Scholar] [CrossRef]
  9. Elbahjaoui, R.; El Qarnia, H. Numerical Study of a Shell-and-Tube Latent Thermal Energy Storage Unit Heated by Laminar Pulsed Fluid Flow. Heat Transf. Eng. 2017, 38, 1466–1480. [Google Scholar] [CrossRef]
  10. Lee, Y.T.; Chung, J.D. Performance Estimation of a Latent Heat Thermal Energy Storage System with Different Packing Module Arrangements, Boundary Conditions and Melting Models. Heat Transf. Eng. 2018, 39, 1081–1090. [Google Scholar] [CrossRef]
  11. Patel, J.R.; Rathod, M.K. Phase change material selection using simulation-oriented optimization to improve the thermal performance of lithium-ion battery. J. Energy Storage 2022, 49, 103974. [Google Scholar] [CrossRef]
  12. Zhang, P.; Meng, Z.N.; Zhu, H.; Wang, Y.L.; Peng, S.P. Melting heat transfer characteristics of a composite phase change material fabricated by paraffin and metal foam. Appl. Energy 2017, 185, 1971–1983. [Google Scholar] [CrossRef] [Green Version]
  13. Kumar, P.M.; Anandkumar, R.; Mylsamy, K.; Prakash, K.B. Experimental investigation on thermal conductivity of nanoparticle dispersed paraffin (NDP). Mater. Today 2021, 45, 735–739. [Google Scholar]
  14. Kumar, R.; Nirwan, A.; Mondal, B.; Kumar, R.; Dixit, A. Study on thermophysical properties of pentadecane and its composites with thermally expanded graphite as shape-stabilized phase change materials. J. Therm. Anal. Calorim. 2022, 147, 8689–8697. [Google Scholar] [CrossRef]
  15. Liu, J.; Jiang, D.; Fei, H.; Xu, Y.; Zeng, Z.; Ye, W. Preparation and properties of lauric acid-octadecanol/expanded graphite shape-stabilized phase change energy storage material. Mater. Today Commun. 2022, 31, 103325. [Google Scholar] [CrossRef]
  16. Bianco, N.; Busiello, S.; Iasiello, M.; Mauro, G.M. Finned heat sinks with phase change materials and metal foams: Pareto optimization to address cost and operation time. Appl. Therm. Eng. 2021, 197, 117436. [Google Scholar] [CrossRef]
  17. Lei, J.; Yang, C.; Huang, X.; Li, Z.; Zhang, Y. Solidification enhancement of phase change materials using nanoparticles and metal foams with nonuniform porosity. J. Energy Storage 2021, 44, 103420. [Google Scholar] [CrossRef]
  18. Malik, M.; Dincer, I.; Rosen, M.; Fowler, M. Experimental Investigation of a New Passive Thermal Management System for a Li-Ion Battery Pack Using Phase Change Composite Material. Electrochim. Acta 2017, 257, 345–355. [Google Scholar] [CrossRef]
  19. Wheelock, P.B.; Cook, B.C.; Harringa, J.L.; Russell, A.M. Phase changes induced in hexagonal boron nitride by high energy mechanical milling. J. Mater. Sci. 2004, 39, 343–347. [Google Scholar] [CrossRef]
  20. Wheelock, P.B.; Cook, B.C.; Harringa, J.L.; Russell, A.M. Anisotropically enhanced heat transfer properties of phase change material reinforced by graphene-wrapped carbon fibers. Sol. Energy Mater. Sol. Cells 2020, 206, 110280. [Google Scholar]
  21. Samimi, F.; Babapoor, A.; Azizi, M.; Karimi, G. Thermal management analysis of a Li-ion battery cell using phase change material loaded with carbon fibers. Energy 2016, 96, 355–371. [Google Scholar] [CrossRef]
  22. Ren, Q.; Wang, Z.; Zhu, J.; Qu, Z.G. Pore-scale heat transfer of heat sink filled with stacked 2D metal fiber-PCM composite. Int. J. Therm. Sci. 2021, 161, 106739. [Google Scholar] [CrossRef]
  23. Haruki, N.; Horibe, A.; Nakashima, K. Anisotropic Effective Thermal Conductivity Measurement of Various Kinds of Metal Fiber Materials. Int. J. Thermophys. 2013, 34, 2385–2399. [Google Scholar] [CrossRef]
  24. Wu, W.; Yang, X.; Zhang, G.; Ke, X.; Wang, Z.; Situ, W.; Li, X.; Zhang, J. An experimental study of thermal management system using copper mesh-enhanced composite phase change materials for power battery pack. Energy 2016, 113, 909–916. [Google Scholar] [CrossRef]
  25. Sari, A.; Karaipekli, A. Preparation, thermal properties and thermal reliability of palmitic acid/expanded graphite composite as form-stable PCM for thermal energy storage. Sol. Energy Mater. Sol. Cells 2009, 93, 571–576. [Google Scholar] [CrossRef]
  26. Du, X.; Xu, J.; Deng, S.; Du, Z.; Cheng, X.; Wang, H. Amino-Functionalized Single-Walled Carbon Nanotubes-Integrated Polyurethane Phase Change Composites with Superior Photothermal Conversion Efficiency and Thermal Conductivity. Acs Sustain. Chem. Eng. 2019, 7, 17682–17690. [Google Scholar] [CrossRef]
  27. Mitran, R.A.; Ioniţǎ, S.; Lincu, D.; Berger, D.; Matei, C. A Review of Composite Phase Change Materials Based on Porous Silica Nanomaterials for Latent Heat Storage Applications. Molecules 2021, 26, 241. [Google Scholar] [CrossRef]
  28. Qin, Z.; Low, Z.H.; Ji, C.; Duan, F. Efficacy of angled metallic fins for enhancing phase change material melting. Int. Commun. Heat Mass Transf. 2022, 132, 105921. [Google Scholar] [CrossRef]
  29. Hussein, A.; Abd-Elhady, M.S.; El-Sheikh, M.N.; El-Metwally, H.T. Improving Heat Transfer Through Paraffin Wax, by Using Fins and Metallic Strips. Arab. J. Sci. Eng. 2018, 43, 4433–4441. [Google Scholar] [CrossRef]
  30. Shanks, M.; Shoalmire, C.M.; Deckard, M.; Gohil, K.N.; Lewis, H., II; Lin, D.; Shamberger, P.J.; Jain, N. Design of Spatial Variability in Thermal Energy Storage Modules for Enhanced Power Density. Appl. Energy 2022, 314, 118966. [Google Scholar] [CrossRef]
  31. Woods, J.; Mahvi, A.; Goyal, A.; Kozubal, E.; Odukomaiya, A.; Jackson, R. Rate capability and Ragone plots for phase change thermal energy storage. Nat. Energy 2021, 6, 295–302. [Google Scholar] [CrossRef]
  32. Marske, F.; Dasler, J.; Haupt, C.; Bacia, K.; Hahn, T.; Enke, D. Influence of surfactants and organic polymers on monolithic shape-stabilized phase change materials synthesized via sol-gel route. J. Energy Storage 2022, 49, 104127. [Google Scholar] [CrossRef]
  33. Ge, M.; Cheng, X.; Huang, W.; Hu, R.; Cheng, Y. Damage mode and load distribution of countersunk bolted composite joints. J. Compos. Mater. 2021, 55, 1717–1732. [Google Scholar] [CrossRef]
  34. Ge, M.; cheng, X.; Zhang, Q. Compressive test and numerical simulation of center-notched composite laminates with different crack configurations. Polym. Compos. 2017, 38, 2631–2641. [Google Scholar] [CrossRef]
  35. Abdi, A.; Martin, V.; Chiu, J.N.W. Numerical investigation of melting in a cavity with vertically oriented fins. Appl. Energy 2019, 235, 1027–1040. [Google Scholar] [CrossRef]
  36. Mundra, S.S.; Pardeshi, S.S. Analysis of phase change material inside horizontally oriented heat storage unit: A numerical and experimental approach. Case Stud. Therm. Eng. 2022, 31, 101831. [Google Scholar] [CrossRef]
  37. Venkateshan, S. Mechanical Measurement; Springer: Berlin/Heidelberg, Germany, 2015. [Google Scholar]
Figure 1. Physical model of fins with different structures of (a) a discrete columnar-shaped structure, (b) a continuous bar-shaped structure, (c) a continuous square-shaped structure, and (d) a continuous sunflower-shaped structure.
Aerospace 09 00664 g001
Figure 2. DSC curve of the paraffin wax.
Aerospace 09 00664 g002
Figure 3. Weight of module (a) before PCM filling and (b) after PCM filling.
Aerospace 09 00664 g003
Figure 4. Experiment platform.
Aerospace 09 00664 g004
Figure 5. Flow chart of the experiment.
Aerospace 09 00664 g005
Figure 6. Performance of each module under 10 W with heat source size S = (a) 30 mm × 30 mm, (b) 40 mm × 40 mm, and (c) 50 mm × 50 mm.
Aerospace 09 00664 g006
Figure 7. Performance of each module under 30 W with heat source size S = (a) 30 mm × 30 mm, (b) 40 mm × 40 mm, and (c) 50 mm × 50 mm.
Aerospace 09 00664 g007
Figure 8. Performance of each phase change module under 30 W with different heat source sizes: (a) module 1, (b) module 2, (c) module 3, (d) module 4.
Aerospace 09 00664 g008
Figure 9. Performance of each phase change module under 30 W.
Aerospace 09 00664 g009
Table 1. Weight deviation table between shell and PCM.
ModelShell Weight (g)PCM Weight (g)Total Weight (g)
TheoreticalPracticalDeviation RatioTheoreticalPracticalDeviation RatioPractical
M1189.75194.82.67%5252.10.19%246.9
M2189.751942.23%52520%246
M3189.751952.77%52520%247
M4189.75192.91.67%5252.81.54%245.7
Table 2. Physical properties of the aluminum sheet, paraffin, plate heater, and thermal ester.
Materialk (Wm−1 K−1)ρ (kg m−3)Cp (Jkg−1 K−1)
Al (T6-6063)202.42719871
PCM0.2867 (l)2000
Thermal ester619001200
Plate heater203600750
Table 3. Uncertainty of input power.
Module NumberS (mm)P (W)I (A)V (Volt)dPdp/p × 100%
Module 130 × 3010 W1.665.980.070.70%
20 W2.338.72−0.32−1.60%
30 W2.8110.68−0.01−0.03%
40 × 4010 W1.685.910.070.70%
20 W2.398.38−0.03−0.15%
30 W2.7510.80.31.00%
50 × 5010 W1.466.90−0.07−0.70%
20 W2.039.750.211.05%
30 W2.5012.0000.00%
Module 230 × 3010 W1.655.970.151.50%
20 W2.348.72−0.4−2.00%
30 W2.7410.790.441.47%
40 × 4010 W1.626.120.090.90%
20 W2.338.72−0.32−1.60%
30 W2.9210.3−0.08−0.27%
50 × 5010 W1.516.64−0.03−0.30%
20 W2.129.44−0.01−0.05%
30 W2.5811.610.050.17%
Module 330 × 3010 W1.695.94−0.04−0.40%
20 W2.358.67−0.37−1.85%
30 W2.8210.630.020.07%
40 × 4010 W1.675.980.010.10%
20 W2.408.34−0.02−0.10%
Module NumberS (mm)P (W)I (A)V (Volt)dPdp/p × 100%
Module 340 × 4030 W2.7910.8−0.13−0.43%
50 × 5010 W1.466.90−0.07−0.70%
20 W2.029.710.391.95%
30 W2.6311.40.020.07%
Module 430 × 3010 W1.636.14−0.01−0.10%
20 W2.348.72−0.4−2.00%
30 W2.7410.810.381.27%
40 × 4010 W1.596.240.080.80%
20 W2.288.78−0.02−0.10%
30 W2.9810.6−0.40−1.32%
50 × 5010 W1.516.64−0.03−0.30%
20 W2.149.41−0.14−0.70%
30 W2.4712.120.060.20%
Note: S is the size of the heater, P is power, I is current, V is voltage, and dP is power uncertainty.
Table 4. The temperature of different size heat sources under each cooling module working at 10 W power for 10 min.
PowerSizeModuleInitial
Temperature
End
Temperature
Temperature RiseTemperature Contrast
10 W30 mmM169.9 °C81.8 °C11.9 °C0%
M270 °C78.4 °C8.4 °C29.4%
M370 °C76.3 °C6.3 °C47.1%
M470.1 °C77.9 °C7.8 °C34.5%
40 mmM170.1 °C80.3 °C10.2 °C0%
M270.1 °C76.7 °C6.6 °C34%
M370 °C75.8 °C5.4 °C47.1%
M470 °C75.4 °C5.8 °C43.1%
50 mmM170.2 °C77.2 °C7.0 °C0%
M270 °C75.3 °C5.3 °C24.3%
M370.1 °C74 °C3.9 °C44.3%
M470 °C74.6 °C4.6 °C34.3%
Table 5. The temperature of different size heat sources under each cooling module working at 30 W power for 10 min.
PowerSizeModuleInitial
Temperature
End
Temperature
Temperature RiseTemperature Contrast
30 W30 mmM170 °C116.3 °C46.3 °C0%
M270 °C96.8 °C26.8 °C42.1%
M370.1 °C99.9 °C28.8 °C37.8%
M470.1 °C103.4 °C33.4 °C27.9%
40 mmM170.1 °C108.3 °C38.2 °C0%
M270 °C87.3 °C17.3 °C54.7%
M369.9 °C88.9 °C19 °C50.3%
M469.9 °C89.1 °C19.2 °C49.7%
50 mmM170 °C95.7 °C25.7 °C0%
M270.1 °C83.6 °C13.5 °C47.5%
M370 °C86.4 °C16.4 °C36.2%
M469.8 °C85.6 °C15.8 °C38.5%
Publisher’s Note: MDPI stays neutral with regard to jurisdictional claims in published maps and institutional affiliations.

