Article

Simulation of and Experimental Research on Rivulet Model on Airfoil Surface

1
Laboratory of Fundamental Science on Ergonomics and Environmental Control, School of Aeronautic Science and Engineering, Beihang University, Beijing 100191, China
2
Shanghai Aircraft Design & Research Institute, Commercial Aircraft Corporation of China Ltd., Shanghai 201210, China
3
TUM School of Engineering and Design, Technische Universität München, 80333 Munich, Germany
*
Author to whom correspondence should be addressed.
Aerospace 2022, 9(10), 570; https://doi.org/10.3390/aerospace9100570
Submission received: 24 August 2022 / Revised: 20 September 2022 / Accepted: 26 September 2022 / Published: 29 September 2022

Abstract

:
The occurrence of aircraft icing can significantly affect flight performance. One of the most important aspects in the study of anti-icing technology for aircraft is the distribution of overflow water. Owing to the external airflow pressure, shear stress, and surface tension, the water film breaks up to form steady rivulets. Experiments on NACA0012 airfoil surfaces were conducted based on an open straight-flow and low-speed wind tunnel. Simultaneously, an engineered three-dimensional rivulet model considering the surface roughness was established based on the energy-minimum principle. A comparison between the simulation and experimental results shows that the errors in the water film breakup location and the flow velocity of rivulets are less than 20%, and the errors in the spacing and width of rivulets are less than 40%. In addition, the effects of surface temperature and uniform roughness on water film breakup were investigated. Furthermore, the rivulet model was applied to the numerical calculation of the thermal performance of hot-air anti-icing systems. The simulations reveal that the uniform roughness of the wing surface causes the water film to break earlier. As the surface roughness increases, the thickness, spacing, and width of the rivulets increase, and the rivulet flow velocity decreases.

1. Introduction

When an aircraft passes through clouds containing supercooled water droplets, ice may accumulate on the surfaces of windward components. Ice increases the weight of the aircraft, destroys its aerodynamic profile, and seriously affects its flight performance [1]; therefore, it is likely to cause serious accidents. To ensure the safety of the flight, modern commercial aircraft are always equipped with anti-icing systems [2]. Current wing anti-icing systems used in aircraft tend to achieve dry evaporation within the protected zone under continuous maximum-icing conditions. There is no good solution for simulating overflow water and ice under intermittent maximum icing conditions. With the continuous development of composite materials and electrothermal anti-icing technology, wet evaporation has been widely used. This is because composites often have temperature limitations. Effective simulations of overflow water and ice caused by insufficient protection are a prominent issue in the development of aircraft anti-icing systems.
Under the influence of airflow pressure, shear stress, and evaporation, the thickness of the water film on the surface changes in the flow direction. When the water film thickness reaches a critical value, the water film breaks up into rivulets under the dominant effect of surface tension. The rivulets reduce the area of effective heat and mass transfer between the water, the airfoil surface, and the external airflow, thereby reducing the evaporated water. Water is more likely to flow out of the protected zone and thus freeze, which is harmful to the aircraft. Therefore, it is important to accurately simulate the process of water film breakup and the rivulet formation.
Since the 1920s, research on aircraft anti-icing technology has been conducted in developed countries [3]. Many research results have been obtained from both experimental and simulation analyses. In the 1920s, icing wind tunnels with simple constructions were already being used for ground-based experiments. Early experiments mostly used invasive methods to measure film thickness [4]. It was not until the end of the 20th century that non-invasive measurement methods began to be developed. In 1999, Johnson et al. [5] successfully measured the spacing, flow velocity, and dynamic contact line of rivulets on an inclined plate by using fluorescence imaging. In 2005, Hoffmann et al. [6] measured the thickness and flow velocity of rivulets by using a particle-tracking method. In 2012, Hagemeier et al. [7] measured the water film thickness, contact angle, and flow velocity using photoluminescence and generalised an empirical equation between the dynamic contact angle and Ca number. In 2014, Zhang et al. [8] measured the water film thickness and rivulet flow patterns on the surface of a NACA0012 airfoil using digital image-projection technology. It was concluded that the water film broke up and formed rivulets outside of the droplet impingement zone. The spacing and width of the rivulets decreased with increasing air speeds. In 2017, Bonart et al. [9] used photoluminescence to establish an empirical equation between a single rivulet area and the Re and Ka numbers by conducting experiments on an inclined smooth surface. In 2020, Liu et al. [10] found through experiments that the initial roughness at the leading edge of the wing increased the thickness, width, and spacing of the rivulets.
Simulation studies of aircraft anti-icing systems began in the 1950s, with Messinger [11] first proposing a thermodynamic icing model in 1953. The model calculated the icing rate and volume under the given flow field and droplet impact characteristics by establishing the energy balance equation. This laid the foundation for the numerical calculation of icing. Most of current engineering studies on aircraft anti-icing are based on the Messinger model. They do not consider the transition from the water film to rivulets under the influence of aerodynamic forces, surface tension, and the wetting characteristics of the skin. The earliest rivulet model was proposed by Hobler [12] in 1965, and was developed by Mikielewicz and Moszynski [13] in 1975. The model stated that the water film broke up when it reached a critical thickness, following the conservation of mass, conservation of energy, and energy-minimum principles to produce steady rivulets. It also assumed that the gas–liquid interface shape of a rivulet is part of a semicircle and that the velocity distribution is one-dimensional. In 1991, Al-Khalil [14] introduced a two-dimensional velocity distribution model for rivulets under shear stress. The critical thickness, spacing, and radius of rivulets were obtained. The effect of water film breakup on the performance of aircraft anti-icing systems was analysed. Rothmayer [15] considered the effect of surface wave phenomena in the water film model and established the Plante boundary layer model based on the Navier–Stokes equations. In 2004, Saber [16] used the minimum total energy criterion to investigate the breakup process of thin liquid films flowing on vertical or inclined planes under interfacial shear stress. Since 2006, Silva [17,18] has developed a heat-transfer model for two-dimensional electrothermal anti-icing surfaces based on Al-Khalil’s theory. They considered the influence of water film flow and surface wetting characteristics on the heat transfer performance. In 2008, Wang et al. [19,20] carried out a series of studies on wind-driven water film flow on rough surfaces. Based on the high Reynolds number boundary layer theory, several viscosity-dominated properties of water film were investigated, including the flow and heat transfer processes of the water film and phenomena caused by surface instability of two-dimensional water film. In 2016, Dong and Zheng [21] accurately simulated the water film and rivulet distribution on the surface of the NACA 0012 airfoil and obtained the thickness and width of rivulets.
Researchers have made extensive and successful efforts on experimental and simulation studies of overflow water on airfoil surfaces. However, most simulations have focused on the water film thickness and the effect of the rivulet model on heat transfer characteristics. There are few studies on the water film breakup location and the profile parameters of rivulets. Systematic simulations of the effects of roughness and surface temperature on rivulets have not been conducted. This paper develops a three-dimensional mathematical model of the water film breakup to better simulate the water film breakup location and the thickness, spacing, width, and flow velocity of the rivulets. It is validated by experiments. The simulation model is also used to investigate the effects of surface roughness and temperature on the breakup of the water film and the effect of the rivulet model on the performances of anti-icing systems.

2. Mathematical Models

2.1. Water Film Flow Model

In the case of icing, the water film thickness generally does not exceed 10−4 m, which is much smaller than the dimensions in the flow direction. Therefore, the water film flow can be assumed to be a purely shear-driven process, yielding a linear velocity distribution of
v ( y ) = τ μ · y  
For a single control volume, the following equation can be obtained from the conservation of mass.
m ˙ in , f   =   m ˙ imp , f     m ˙ evap , f   =   m ˙ out , f
where the expressions for the impinging and evaporating water flows within the volume are as follows:
m ˙ imp , f   =   V · LWC · β
m ˙ evap , f   =   h c p , air · Pr Sc 2 3 · M water M air · P v , sat T s   -   P v , l P l   -   P v , sat T s
In Equation (3), V is the air speed, LWC is the liquid-water content of air, and β is the local collection coefficient of the water droplets. In Equation (4), h is the convective heat transfer coefficient of the surface, Pr and Sc are the Prandtl and Schmidt numbers, respectively, Mwater and Mair are the relative molecular masses of water and air, respectively, Pv, sat (Ts) is the saturated water vapour pressure at wall temperature, and Ts, and Pl, and Pv, l are the air pressure and water vapour partial pressure outside the boundary layer, respectively.
The average velocity of the water film flow can be calculated using Equation (1):
¯ v   =   1 δ f 0 δ f v y dy   =   τ δ f 2 μ
Assuming a single control volume with an inflow width l, the mass flow rate within the volume can be calculated by
m ˙ f   =   ρ ¯ v l δ f   =   ρ τ l δ f 2 2 μ
The thickness of the water film can be calculated as
δ f   = 2 μ   m ˙ f ρ τ l
where
m ˙ f   =   1 2 m ˙ in , f   +   m ˙ out , f

2.2. Rivulet Flow Model

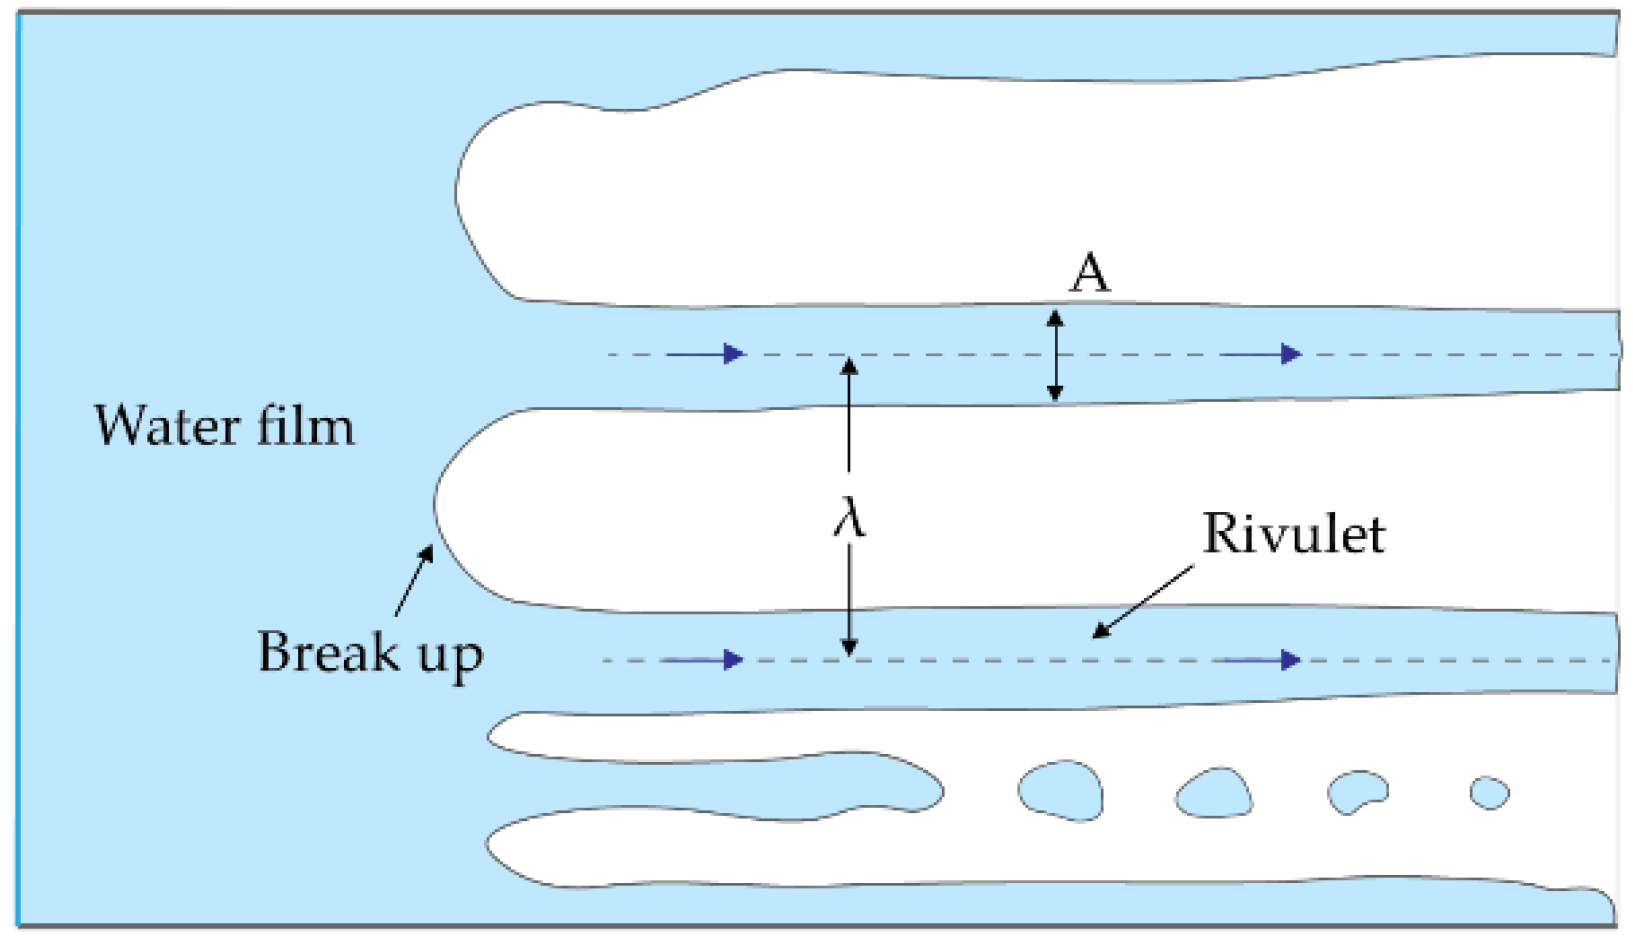
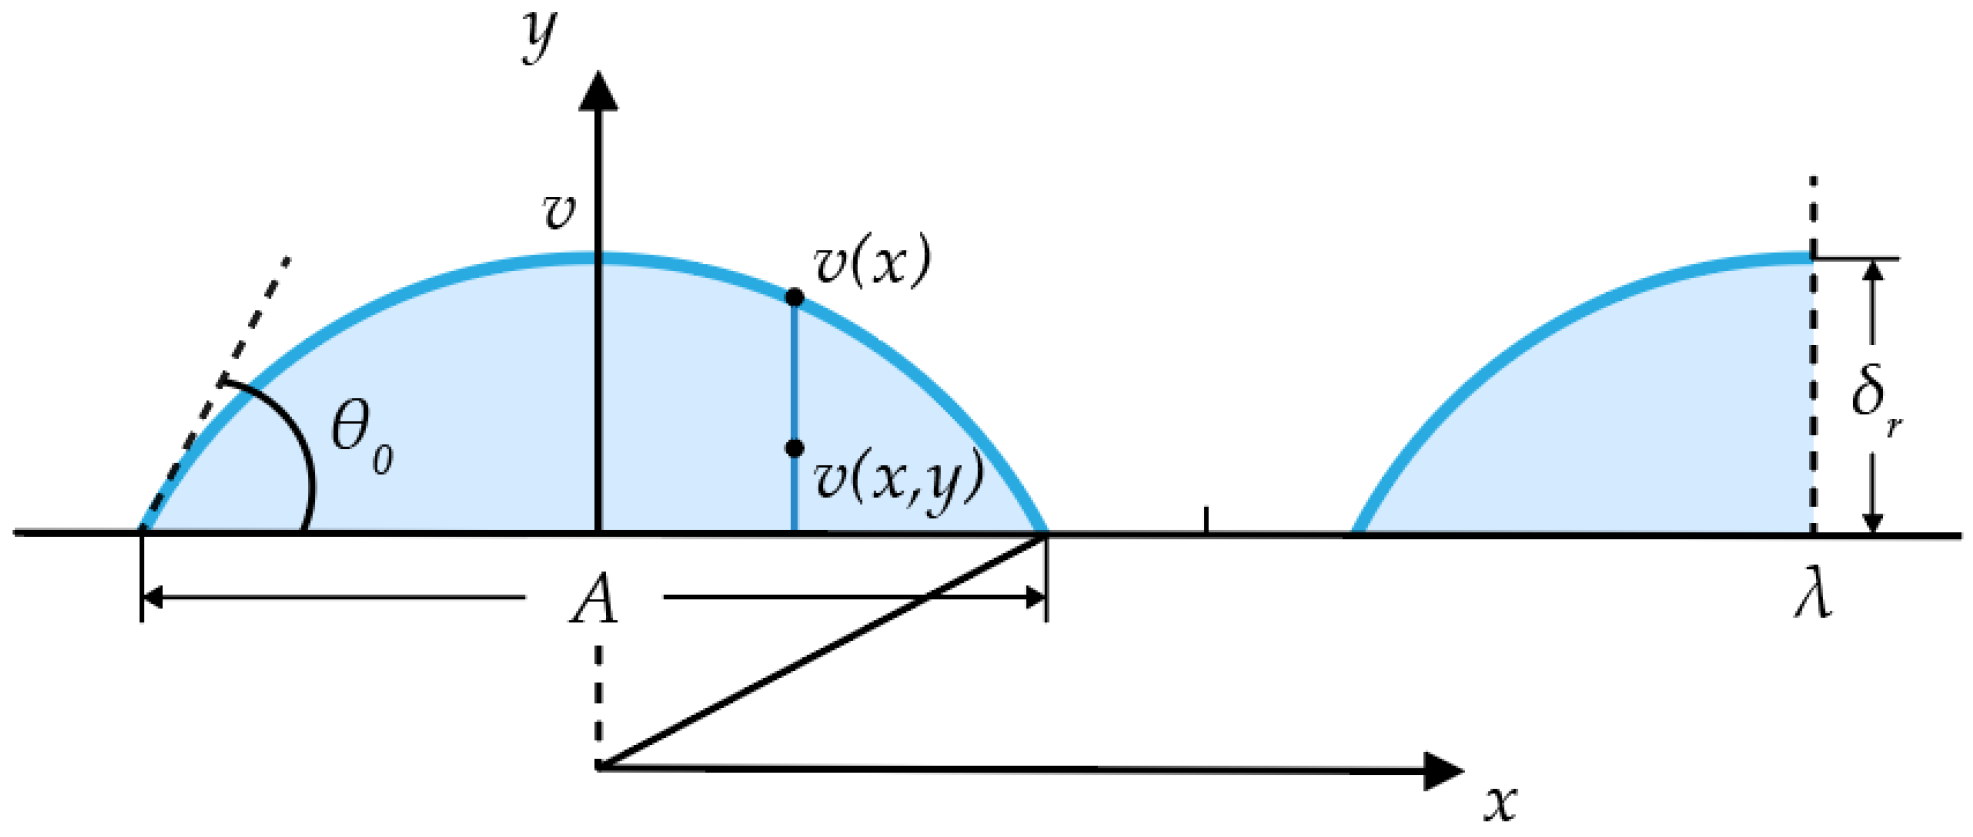
2.2.1. Two-Dimensional Water Film Breakup Model

According to the experiments, the surface is always wetted, and the water film does not break up in the impingement zone. As the water flows downward, the flow of water decreases owing to evaporation. The water film breaks up under surface tension, and rivulets form. Based on the minimum-energy principle, when the water film thickness δf is less than the critical thickness h0, the water film breaks up. It is assumed that multiple independent rivulets of the same shape and equal distance form, as shown in Figure 1.
Since the surface tension is the main force that maintains the external shape of the rivulets, one can assume that the rivulet has a shape that forms part of a circle. It is also assumed that the surface has a fixed contact angle of θ0 and that the distance between two adjacent rivulets is λ. The outer-edge of the rivulet is shear-driven and follows a laminar flow model, with a no-slip boundary condition at the bottom. Therefore, a coordinate system for the velocity distribution of the rivulet flow can be established, as shown in Figure 2.
According to the stream profile shown in Figure 2, the velocity at the highest point in the centre of the rivulet is
v = τ μ ( 1   - cos θ 0 ) R  
Due to the fact that the velocity at the highest point decreases linearly to zero along the profile of the gas–liquid interface and that the velocity at any point on the interface also decreases linearly to zero along the thickness direction to the wall, the final expression for the velocity distribution of the rivulet model can be obtained as
v ( x , y ) = τ R μ θ 0 ( 1   - cos θ 0 ) ( θ 0   - arcsin x R ) R 2   x 2       R cos θ 0 ( y   -   R cos θ 0 )  
Owing to the small cross-sectional size of the rivulet, its physical parameters and surface tension can be assumed to be constant. The fluid is a noncompressible Newtonian fluid. The flow is a fully developed steady-state free-surface laminar flow. The critical thickness h0 of the water film breakup and the shape parameters of the rivulets can be calculated by relating the conservation of mass and energy equation before and after the breakup of the water film and the energy minimum equation at the breakup location.
Based on the velocity distribution in Equations (1) and (10), the mass equations for the water film and rivulets can be obtained by integration as Equations (11) and (12), respectively.
m ˙ f   = m ˙ f λ   = 0 h 0 ρ v y dy   =   ρ τ 2 μ h 0 2
m ˙ r = m ˙ r λ   =   2 λ 0 R sin θ 0 R cos θ 0 R 2 -   x 2 ρ v x , y d y d x   =   ρ τ λ μ ϕ θ 0 R 3
where
ϕ ( θ 0 ) = 1   - cos θ 0 θ 0 ( θ 0 2   4 + sin 2 θ 0 4 + cos 2 θ 0   -   cos θ 0 )  
Similarly, the energy equations for the water film and rivulets can be obtained by integration as Equations (14) and (15), respectively.
E f = E f λ = 0 h 0 ρ 2 v 2 ( y ) d y + σ lv + σ ls = ρ τ 2 6 μ 2 h 0 3 + σ lv + σ ls  
E r = E r λ = 2 λ ( 0 R sin θ 0 R cos θ 0 R 2   -   x 2 ρ 2 v 2 ( x , y ) d y d y + θ 0 R σ lv + ( λ 2   -   R sin θ 0 ) σ sv R sin θ 0 σ ls )
where σlv is the surface tension at the gas–liquid interface, σsv is the surface tension at the solid–gas interface, and σls is the surface tension at the solid–liquid interface. They are all constants.
After introducing the Laplace–Young equation for the three-phase contact surface, Equation (15) can be written as
E r = ρ τ 2 3 λ μ 2 g ( θ 0 ) R 4 + ( 2 R θ 0 λ + cos θ 0   -   2 R sin θ 0 cos θ 0 λ ) σ lv + σ ls  
where
g ( θ 0 ) = ( 1   - cos θ 0 θ 0 ) 2 ( θ 0 3 6 + θ 0 4 + 7 4 sin θ 0 cos θ 0   -   2 θ 0 cos θ 0 )  
In addition, the expression for the local wetting factor, i.e., the ratio of the wetted area to the overall area, can be obtained from the geometric profile equation of the rivulets:
F = 2 R sin θ 0 λ  
Combining the conservation of mass, conservation of energy, and lowest energy principle equations, one obtains
m ˙ f   =   m ˙ r
E f = E r
( E r ) F = 0   and   2 ( E r ) F 2   >   0
Then,
h + = 3 2 ( 2 θ 0   - sin 2 θ 0 ) 1 3 [ h + g ( θ 0 ) ] 2 3 ϕ ( θ 0 )   -   ( 1   - cos θ 0 )  
where h+ is defined as a dimensionless critical thickness expressed as
h + = ρ τ 2 h 0 3 6 μ 2 σ lv  
When the contact angle of the surface is determined, the dimensionless critical thickness h+ can be solved iteratively using Equation (22). Combined with the local shear stress, Equation (23) is used to solve the critical thickness h0 for water film breakup. Outside of the droplet impingement zone, when the water film thickness δf is less than h0, the water film breaks up, and a steady rivulet flow forms.
When Equations (18)–(20) are combined, the local wetting factor, radius, spacing, and thickness of the rivulets at the breakup location can be solved:
F = - h + g ( θ 0 ) ( θ 0   - sin θ 0 cos θ 0 ) [ sin θ 0 ϕ ( θ 0 ) ] 3 2 F   -   1 2 + sin θ 0 ( 1   - cos θ 0 + h + ) θ 0   - sin θ 0 cos θ 0
R = h 0 ( sin θ 0 ϕ ( θ 0 ) F ) 1 2
λ = 2 R sin θ 0 F
δ r = ( 1   - cos θ 0 ) R
Due to the fact that water film breakup does not occur within the impingement zone, i.e., there is no impingement water entering the rivulet region, the following mass conservation equation is available for a single control volume:
m ˙ in , r   -   m ˙ evap , r   =   m ˙ out , r
Based on Equations (24)–(27) and the rivulet profile, the mass flow rate of evaporated water before and after water film breakup can be obtained using the following equation:
m ˙ evap , r   =   θ 0 F sin θ 0 m ˙ evap , f
Based on Equation (12), the mass flow rate within a single control volume and the rivulet radius can be deduced as
  m ˙ r   =   ρ τ l λ μ ϕ ( θ 0 ) R 3
R   =   [ λ μ   m ˙ r ρ τ l ϕ ( θ 0 ) ] 1 3
Similarly, the local wetting factor F and thickness δr can be calculated using Equations (26) and (27). In addition, based on the profile and flow velocity of the rivulets, the mass flow rate of a single rivulet can be obtained as
m ˙ rivulet   =   v R 2 θ 0   - sin θ 0 cos θ 0

2.2.2. Three-Dimensional Mass Flow Allocation Model

For three-dimensional surface water films, the direction of the shear force is not necessarily perpendicular to the grid edges, i.e., each grid may have multiple water inflow and outflow surfaces. The direction of the shear force can be used to determine the mass distribution of the overflow water. A hexahedral grid can be considered as an example, as shown in Figure 3. Faces one and two are the inflow surfaces and faces three and four are the outflow surfaces.
According to the mass balance criterion, the mass flow rate of water flowing into the control volume is equal to the mass flow rate of water flowing out of it. Therefore, the three-dimensional Messinger mass conservation equation can be established as
i   m ˙ in , i   +   m ˙ imp   -   m ˙ evap   =   i m ˙ out , i
where i   m ˙ in , i is the mass flow rate into the current control volume and i m ˙ out , i is the mass flow rate out of the control volume. Depending on the direction of the shear stress, the mass flow rate distribution scheme can be obtained as
m ˙ out , 3   =   i m ˙ out , i · l 3 τ · n 3 l 3 τ · n 3   +   l 4 τ · n 4
m ˙ out , 4   =   i m ˙ out , i l 4 τ · n 4 l 3 τ · n 3   +   l 4 τ · n 4
The rivulet model assumes that multiple equally spaced rivulets of the same shape are formed when the water film breaks up. To retain this feature better when extending the two-dimensional rivulet model to a three-dimensional model, m is introduced to represent the total number of rivulets.
m   =   l 1 τ · n 1   +   l 2 | τ · n 2 | λ
where l1 and l2 are the side lengths of faces one and two, respectively. By distributing the total number of rivulets on the outflow face according to the direction of the shear stress, one obtains
m 3   =   m l 3 τ · n 3 l 3 τ · n 3   +   l 4 τ · n 4
m 4   =   m l 4 τ · n 4 l 3 τ · n 3   +   l 4 τ · n 4
In the subsequent calculation grid, the number of rivulets on all of the inflow surfaces is superimposed to obtain the total number. The average spacing of the rivulets is calculated using Equation (36):
λ - = l 1 τ · n 1   +   l 2 τ · n 2 m

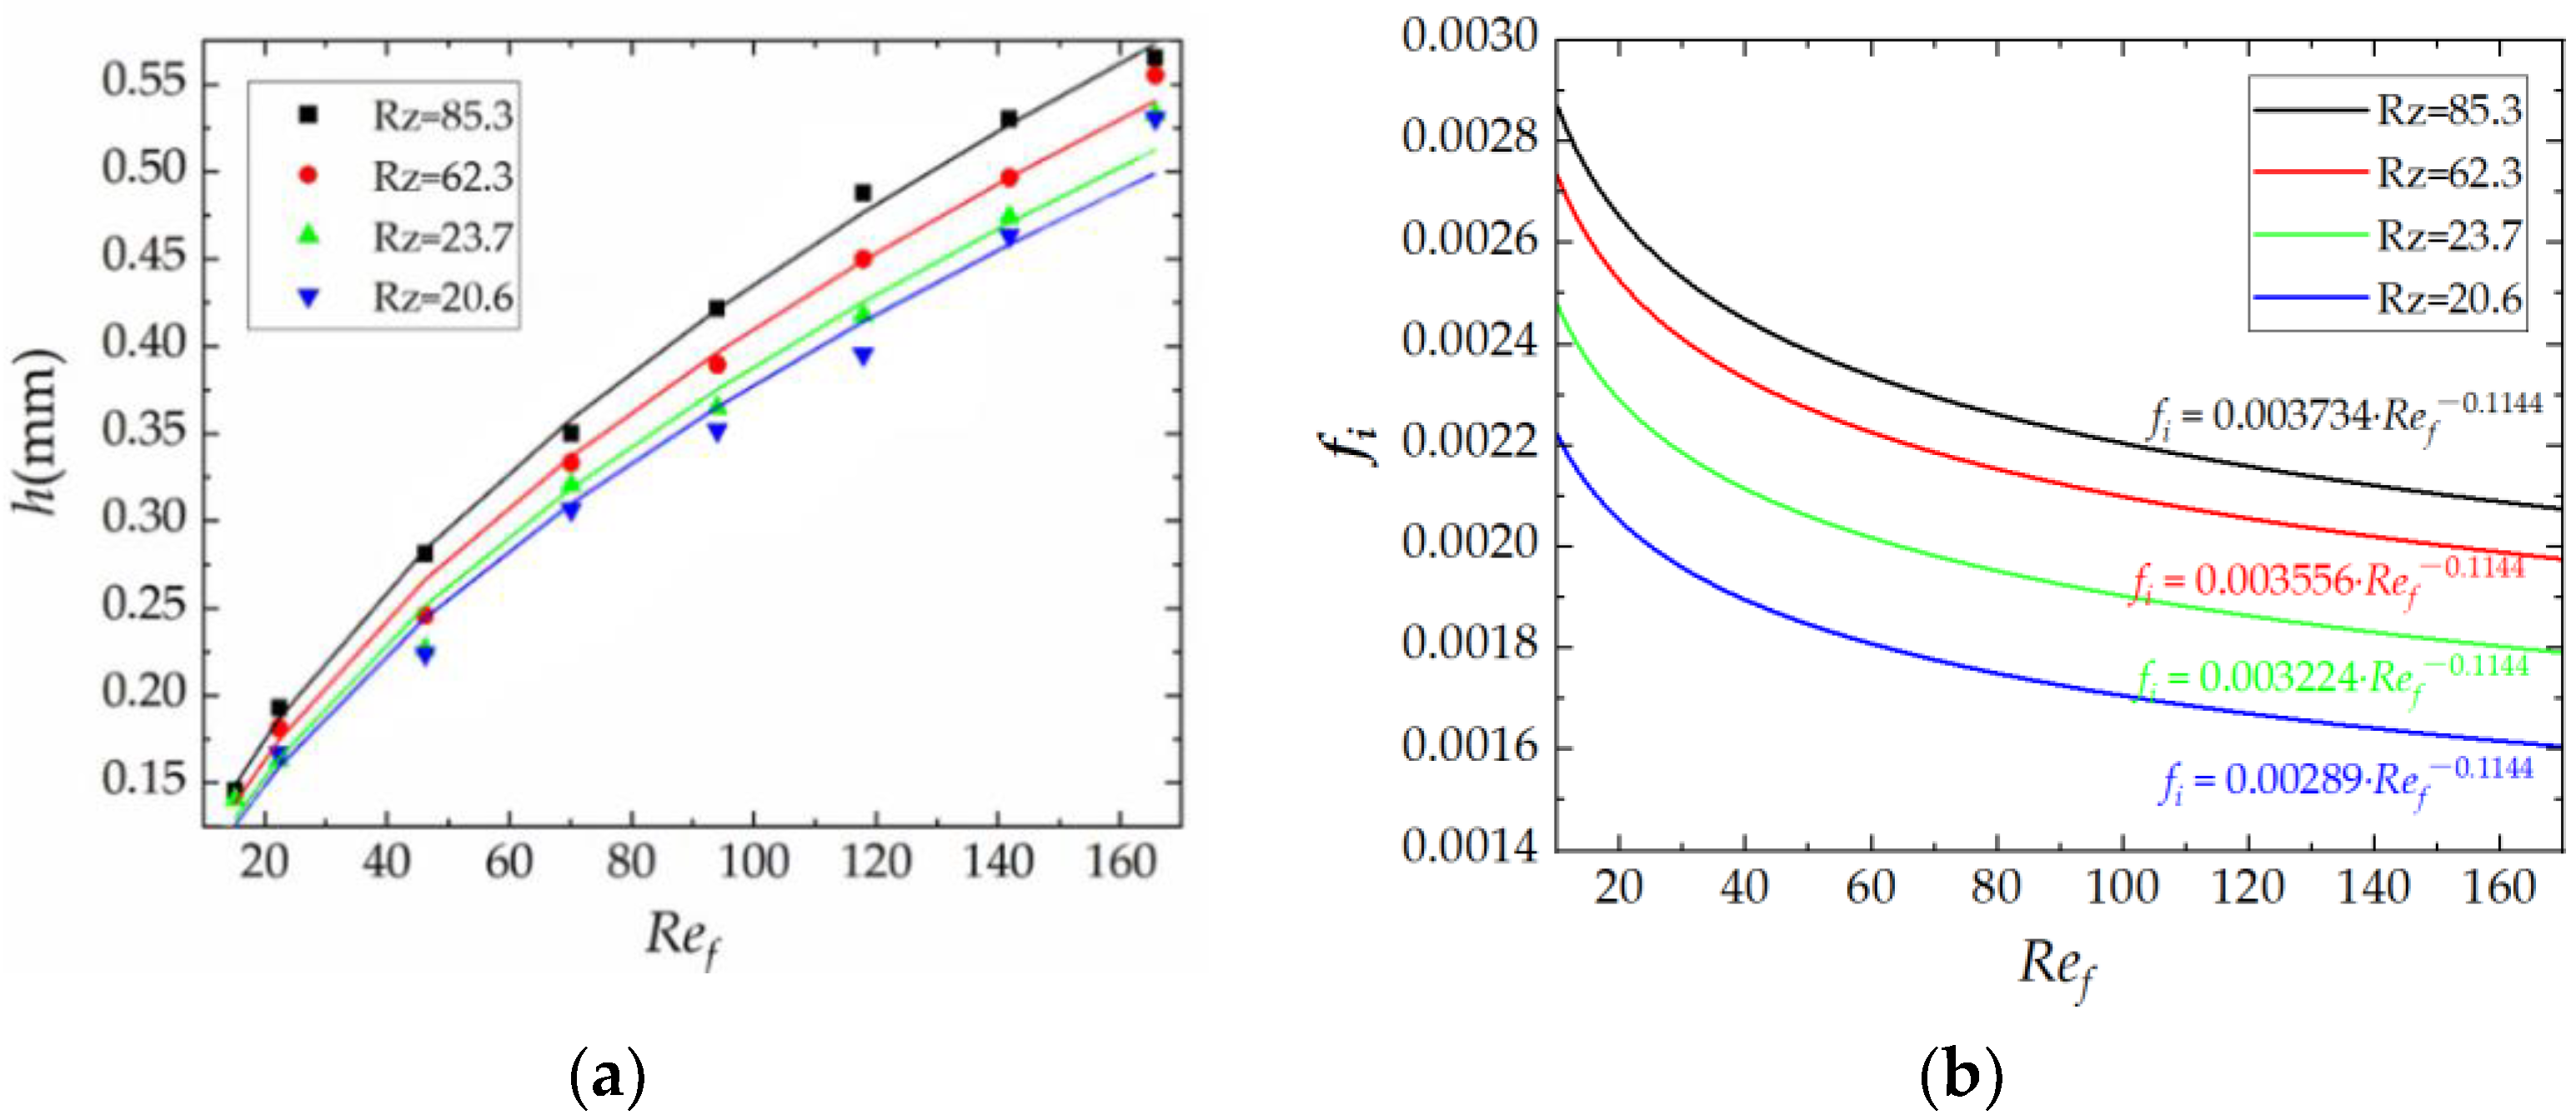
2.3. Roughness Model

The roughness of the airfoil surface affects the flow process of the water film when it is driven by a constant air speed. First, the expression for the Reynolds number of the water film is defined as
R e f = Q V L · ν l
where L is the wetting width of the water film and νl is the kinematic viscosity of the liquid. According to the equation proposed by Myers [22] for predicting the thickness of a continuous water film, one obtains
h 3 3 ( σ 3 h x 3   -   ρ g h x cos α + ρ g sin α ) + h 2 2 T 1 = μ Q V
For a two-dimensional water film, the above equation can be simplified as
2 ρ l g sin α h 3 + 3 τ h 2 = 6 μ l Q V
where ρl is the density of the water film, g is the acceleration of gravity, μl is the viscosity of the liquid, QV is the volume flow rate, and h is the average water film thickness. Then,
h = ( 2 μ l Q V τ ) 1 2
Due to the fact that the air flow rate is much greater than the liquid flow rate during the flow of the water film, the expression for the airflow shear force can be obtained as
τ = f i 1 2 ρ a U a 2
where fi is the interfacial shear factor, Ua is the air speed, and ρa is the air density. The relationship between the interfacial shear coefficient fi and the water film thickness can be obtained by combining Equations (40), (42), and (44):
f i = 4 μ l Re f L h   2 ρ l ρ a U a 2
According to Equation (45) and the experimental summary of Zhao et al. [23], the relationships between the Reynolds number and the average thickness of the water film and those between the Reynolds number and the interfacial shear coefficient were obtained for different roughness values, as shown in Figure 4.
Based on the expression shown in Figure 4b, one can assume that
f i = C · Re f - 0 . 1144
A linear fit to the relationship between the coefficient C and the roughness factor Rz yields
f i = ( 0 . 0039   -   11 . 7422 Rz ) · Re f - 0 . 1144
Combining Equations (44) and (47) reveals that the expression for the modified shear force τr considering roughness is
τ r = ( 1   -   3003 . 1151 Rz ) · τ

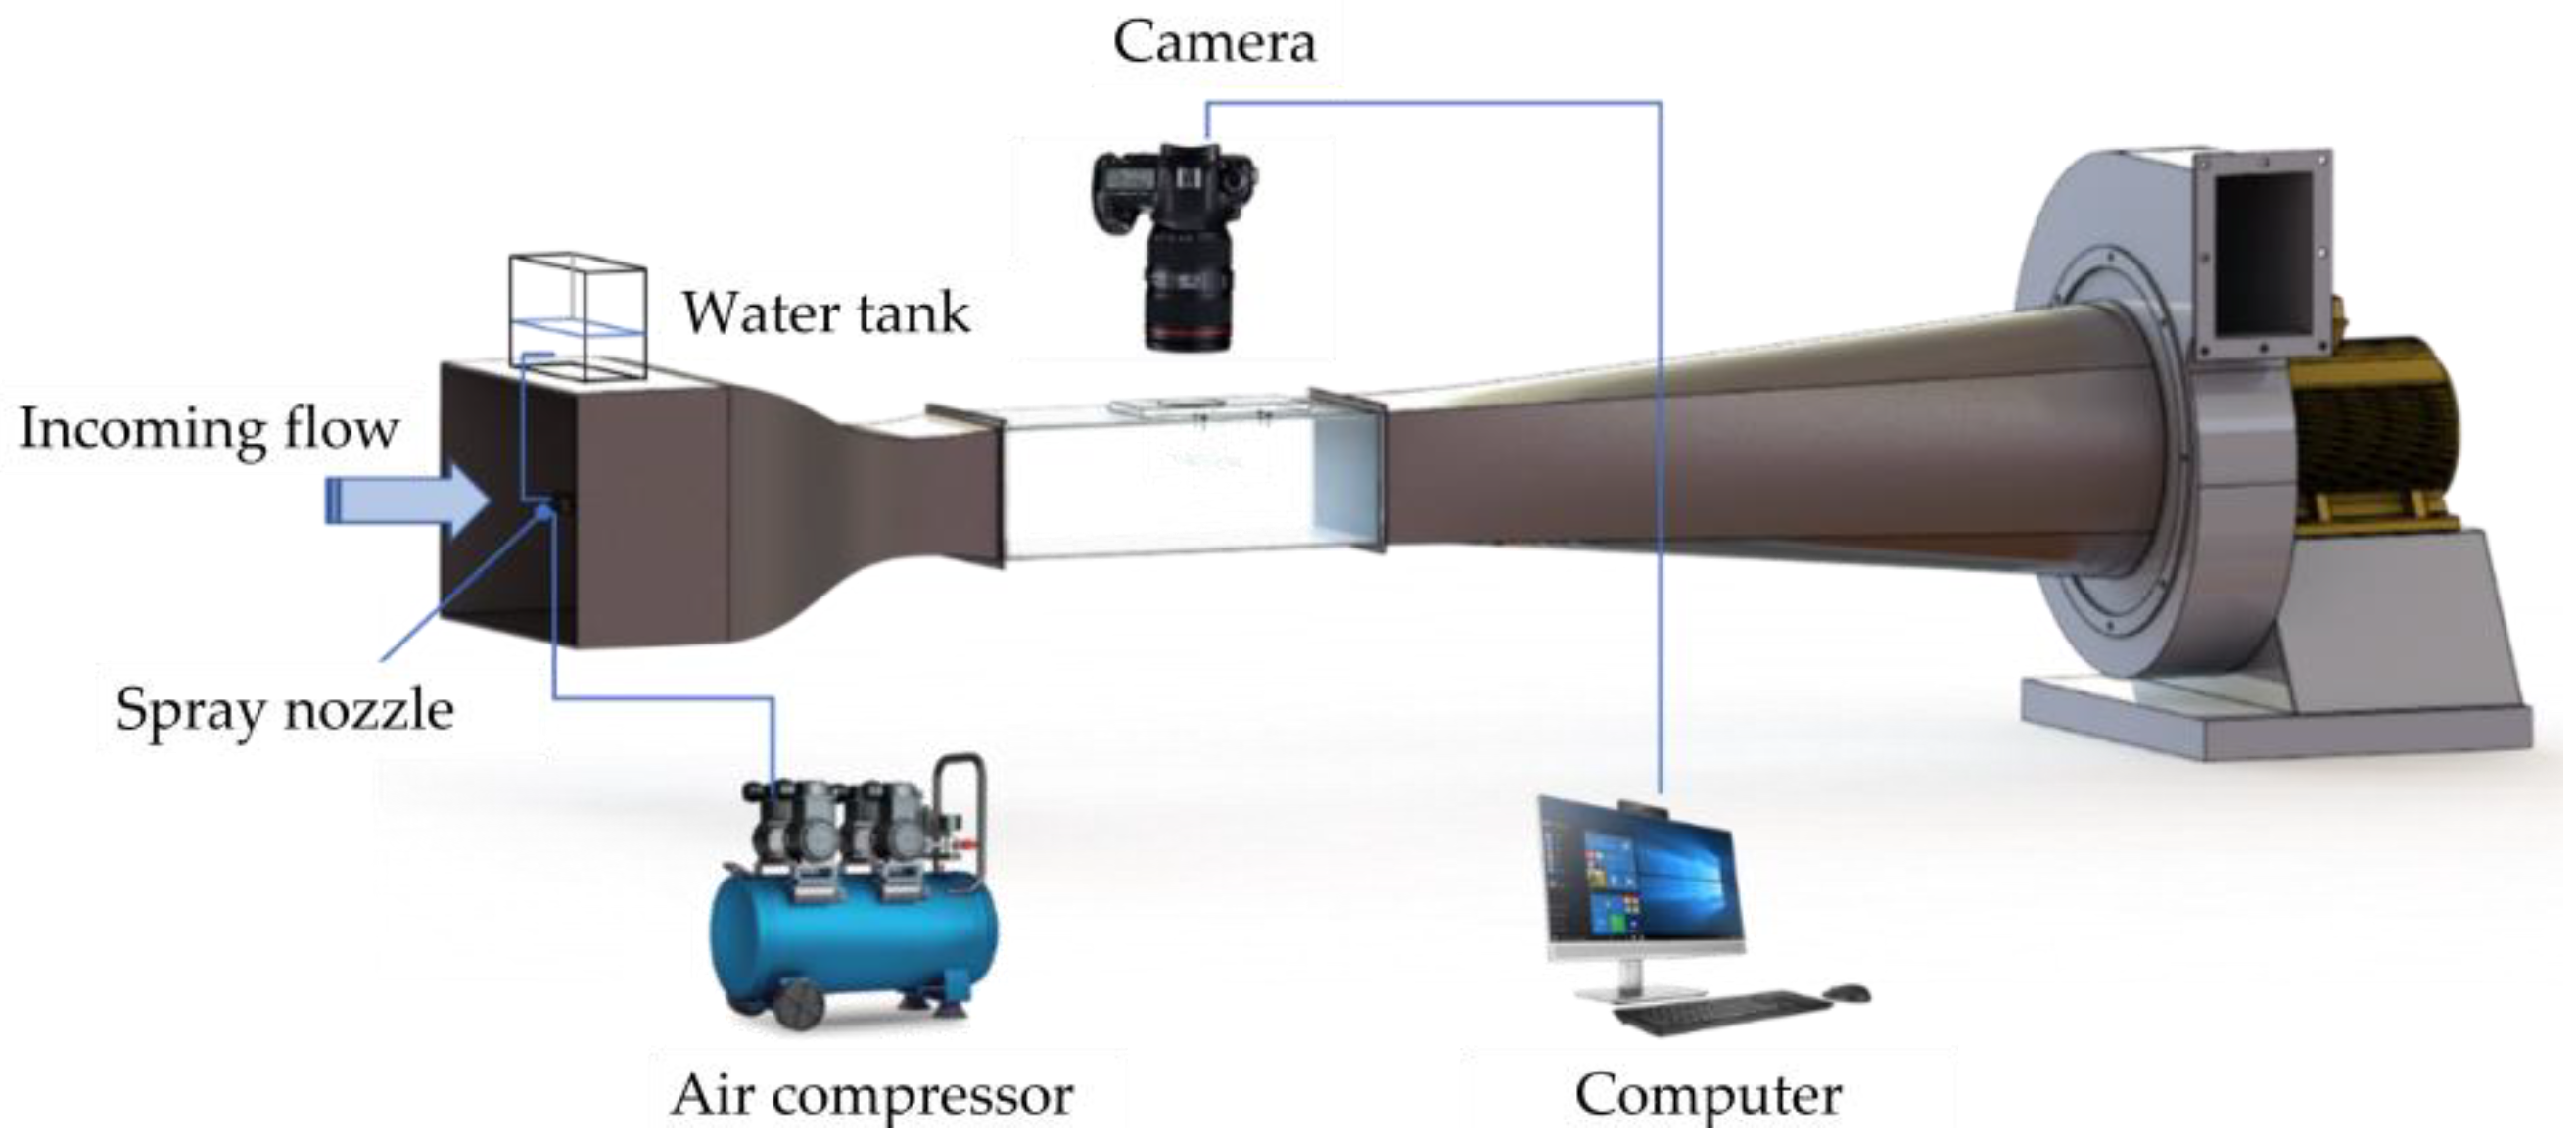
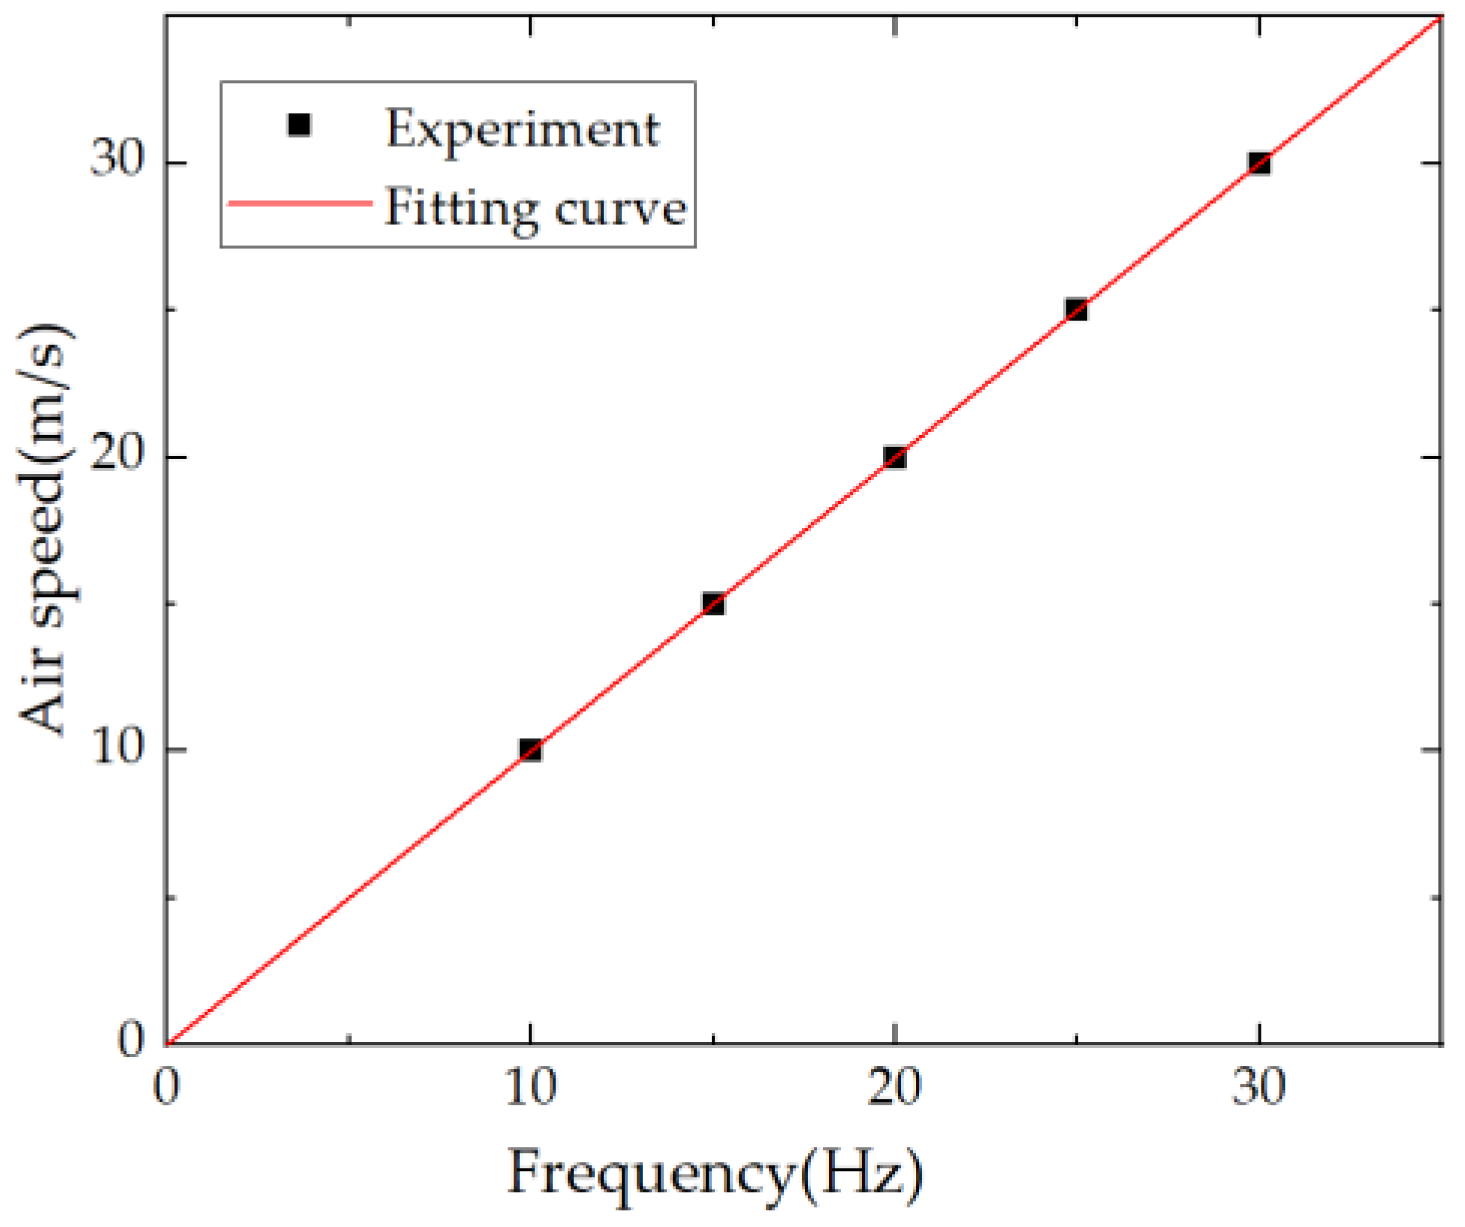
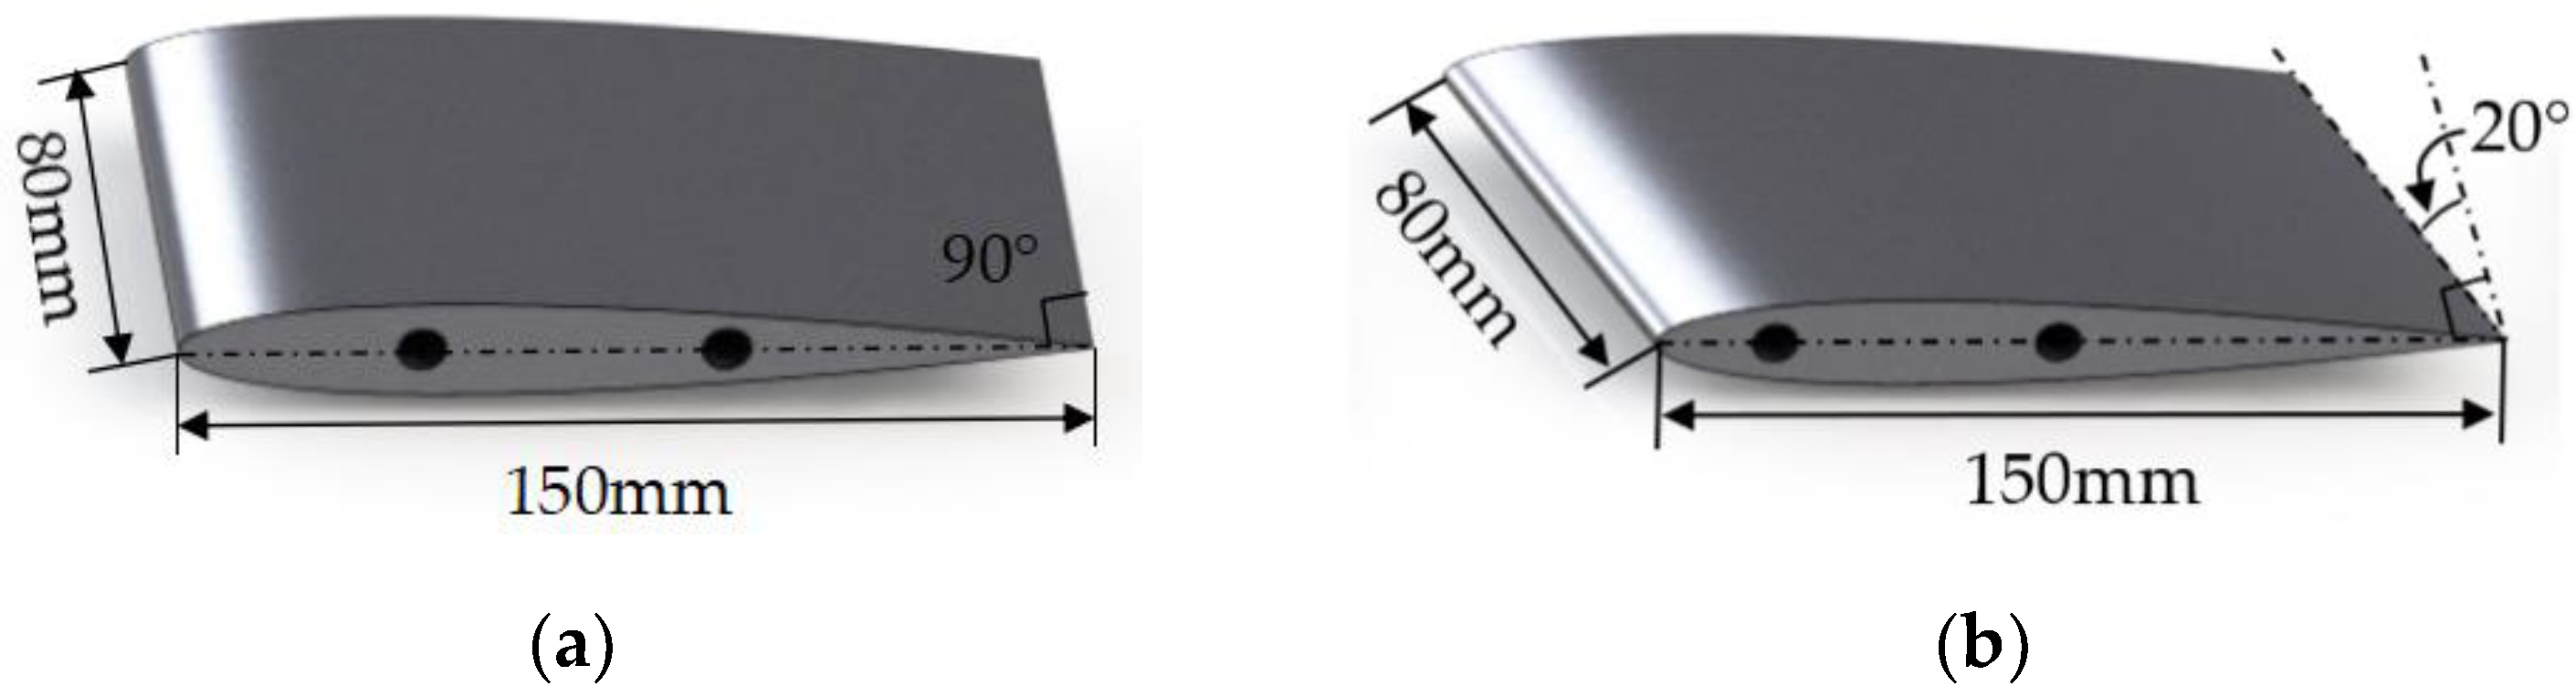
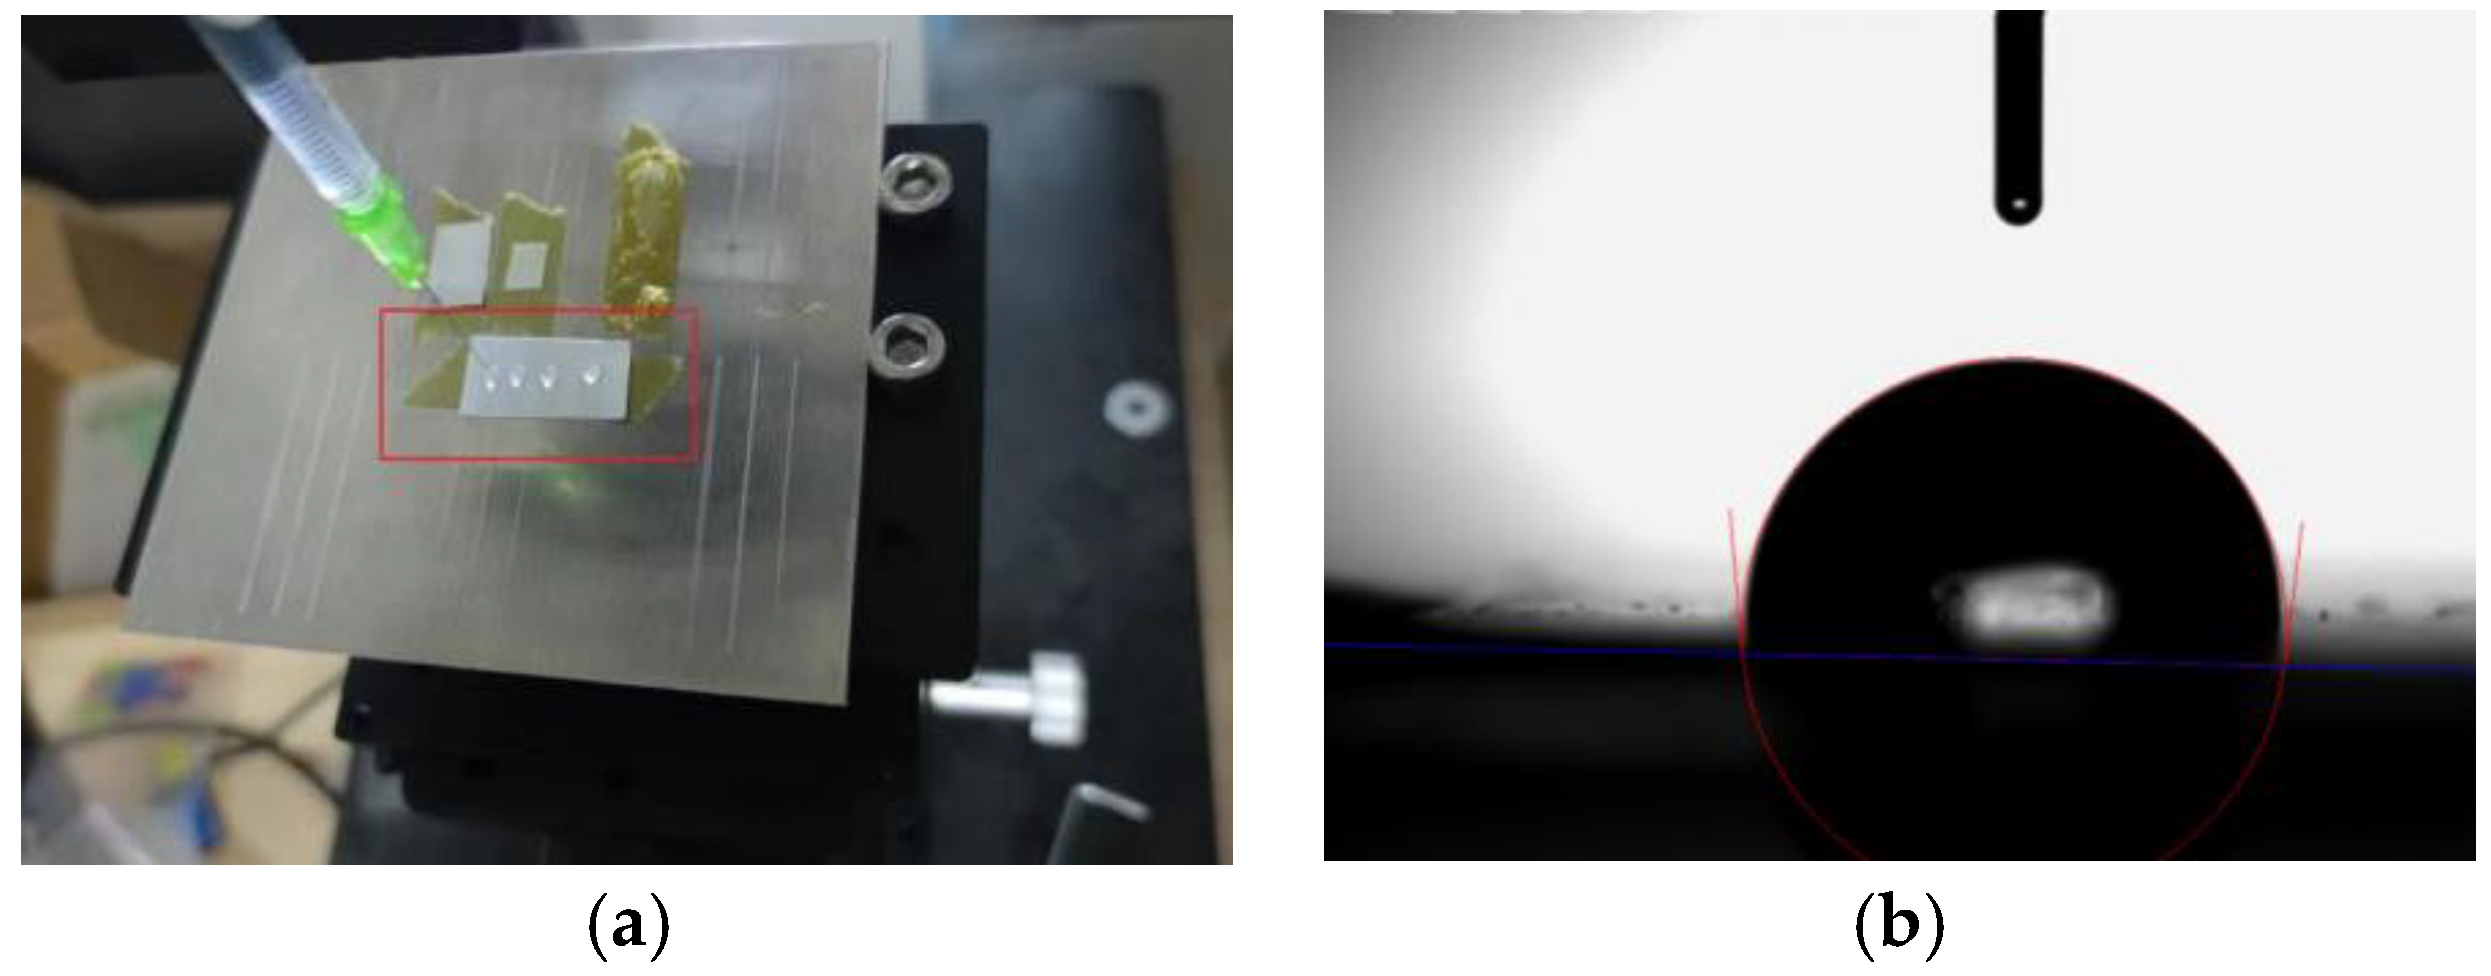
3. Experimental System

To verify the accuracy of the theoretical model, experiments were conducted on the flow and breakup of water films on the wing surface at low air speeds. The experimental platform was based on an open straight-flow and low-speed wind tunnel in the Human–Machine and Environmental Engineering Laboratory of Beihang University, as shown in Figure 5. It mainly consisted of a wind tunnel, spray device, image observation system, data acquisition system, and data-processing system.
As shown in Figure 5, the main body of the wind tunnel included a fan, stabilisation section, contraction section, test section, and diffusion section. The fan model used was an SCH-HD900D4-L180, which was controlled by an ABB controller. The air speed was calibrated by using a CP300 multifunctional differential pressure transmitter with an adjustable range of 0–30 m/s. Figure 6 shows the relationship between wind speed in the test section of wind tunnel and the frequency of the fan. It can be seen from the calibration results that there was a good linear relationship between them. The experiment shows that the fan has good frequency-conversion stability.
The length of the test section was 1000 mm, with a cross section of 300 mm × 400 mm. The experiments were conducted at an air pressure of 0.3 MPa. High-pressure air was mixed with water and passed through a siphon air-atomising nozzle. Water droplets impinged on the airfoil to form a water film. The tests showed that the median particle size of the nozzle was 30 μm. A high-performance camera (CANON, EOS 5D Mark IV) was used to capture video through the top viewing window of the test section at 60 fps. The camera was connected to a computer for real-time remote control, monitoring, and data transfer. The captured video images were postprocessed using Photoshop. The actual length was calibrated using pixels (1 pixel ≈ 0.253 mm). The camera calibration uncertainty was 0.2 pixels. The width, spacing, flow distance, and other parameters of rivulets were measured and calculated in pixels. The manual data-processing uncertainty was 1 pixel.
The experimental samples were NACA0012 straight-wing and sweptback-wing models, both with a chord length of 150 mm and span of 80 mm, as shown in Figure 7. The sweep angle of the sweptback wing was 20°.
The static contact angle of the wing surface, measured with a static contact angle-measuring instrument and analysed using the image-profiling method, was 97 ± 2°. The schematic diagram of the experimental measurement is shown in Figure 8. The experimental temperature was 21.9 °C. In order to better observe the experimental phenomenon of water film breakup, the air speed was set from 15 to 30 m/s. The total water flow rate was constant. The liquid water content was 4.80–8.50 g/m3. The liquid water content was calibrated by measuring the mass difference of the sponge before and after absorbing the water. The mass difference was divided by the product of the upwind area of the sponge, air speed, and testing time to obtain the liquid water content. An EX-H series microbalance was used, whose measurement range was 0–210 g with a measurement error of 0.02 mg.

4. Results and Analysis

4.1. Validation of the Simulation Model

The Fluent user-defined function was used to simulate and analyse the same conditions as the experiments to verify the accuracy of the rivulet model. First, the droplet movements were programmed and modelled based on the Eulerian transport equations, and then the local droplet collection efficiencies on the surface of the wing were calculated. This method has been validated and applied by many researchers [24,25]. The water droplet collection efficiencies for the straight wing are shown in Figure 9. Second, the relevant program was written according to the theoretical model to calculate the overflow water distribution and water film breakup process on the wing surface, based on the results of the airflow field and water droplet impingement characteristics.
Research on dynamic contact angles has generally addressed forward and backward angles in the flow direction. The angles on either side of the rivulet cross section have been less well studied. However, they can significantly affect the rivulet flow shape. The experiments showed that the contact angles on both sides of the rivulet were significantly less than the static contact angle of 97.4° when the air speed was low. Observing the experimental phenomena at different air speeds indicated that the contact angle may be related to the surface material properties and air speed.
Owing to the small number of studies on the side contact angle of the rivulet, the contact angle on both sides of the rivulet is unknown. To determine the value of the contact angle, a range of contact angles was considered from 2° to 64° at an air speed of 30 m/s. The results of the simulation are shown in Table 1, where A is the cross-sectional width of a single rivulet and λ is the distance between the centre lines of each rivulet. The width and spacing of the rivulets decrease with increasing contact angle. Simulation and experimental results reveal that the simulation error for the profile of the rivulets was minimised when the contact angle of the current theoretical model was set at 2° to 4°. For simplicity, a uniform contact angle of 2.5° was used for the subsequent simulations for all test conditions.
In order to illustrate the experiments more visually, the experimental phenomenon of water film breakup observed at an air speed of 20 m/s is shown in Figure 10.
Comparisons of the experimental and simulated results for the straight and sweptback wings are shown in Figure 11 and Figure 12, where the contact angle is 2.5°. The deviations between simulation and experimental observation are shown as well. The results reveal that the error between the experiment and the simulation was less than 40% for the spacing and width of the rivulet flow and less than 20% for the water film breakup location and rivulet flow velocity, indicating that the simulation method is feasible.
In addition, the following rules can be obtained:
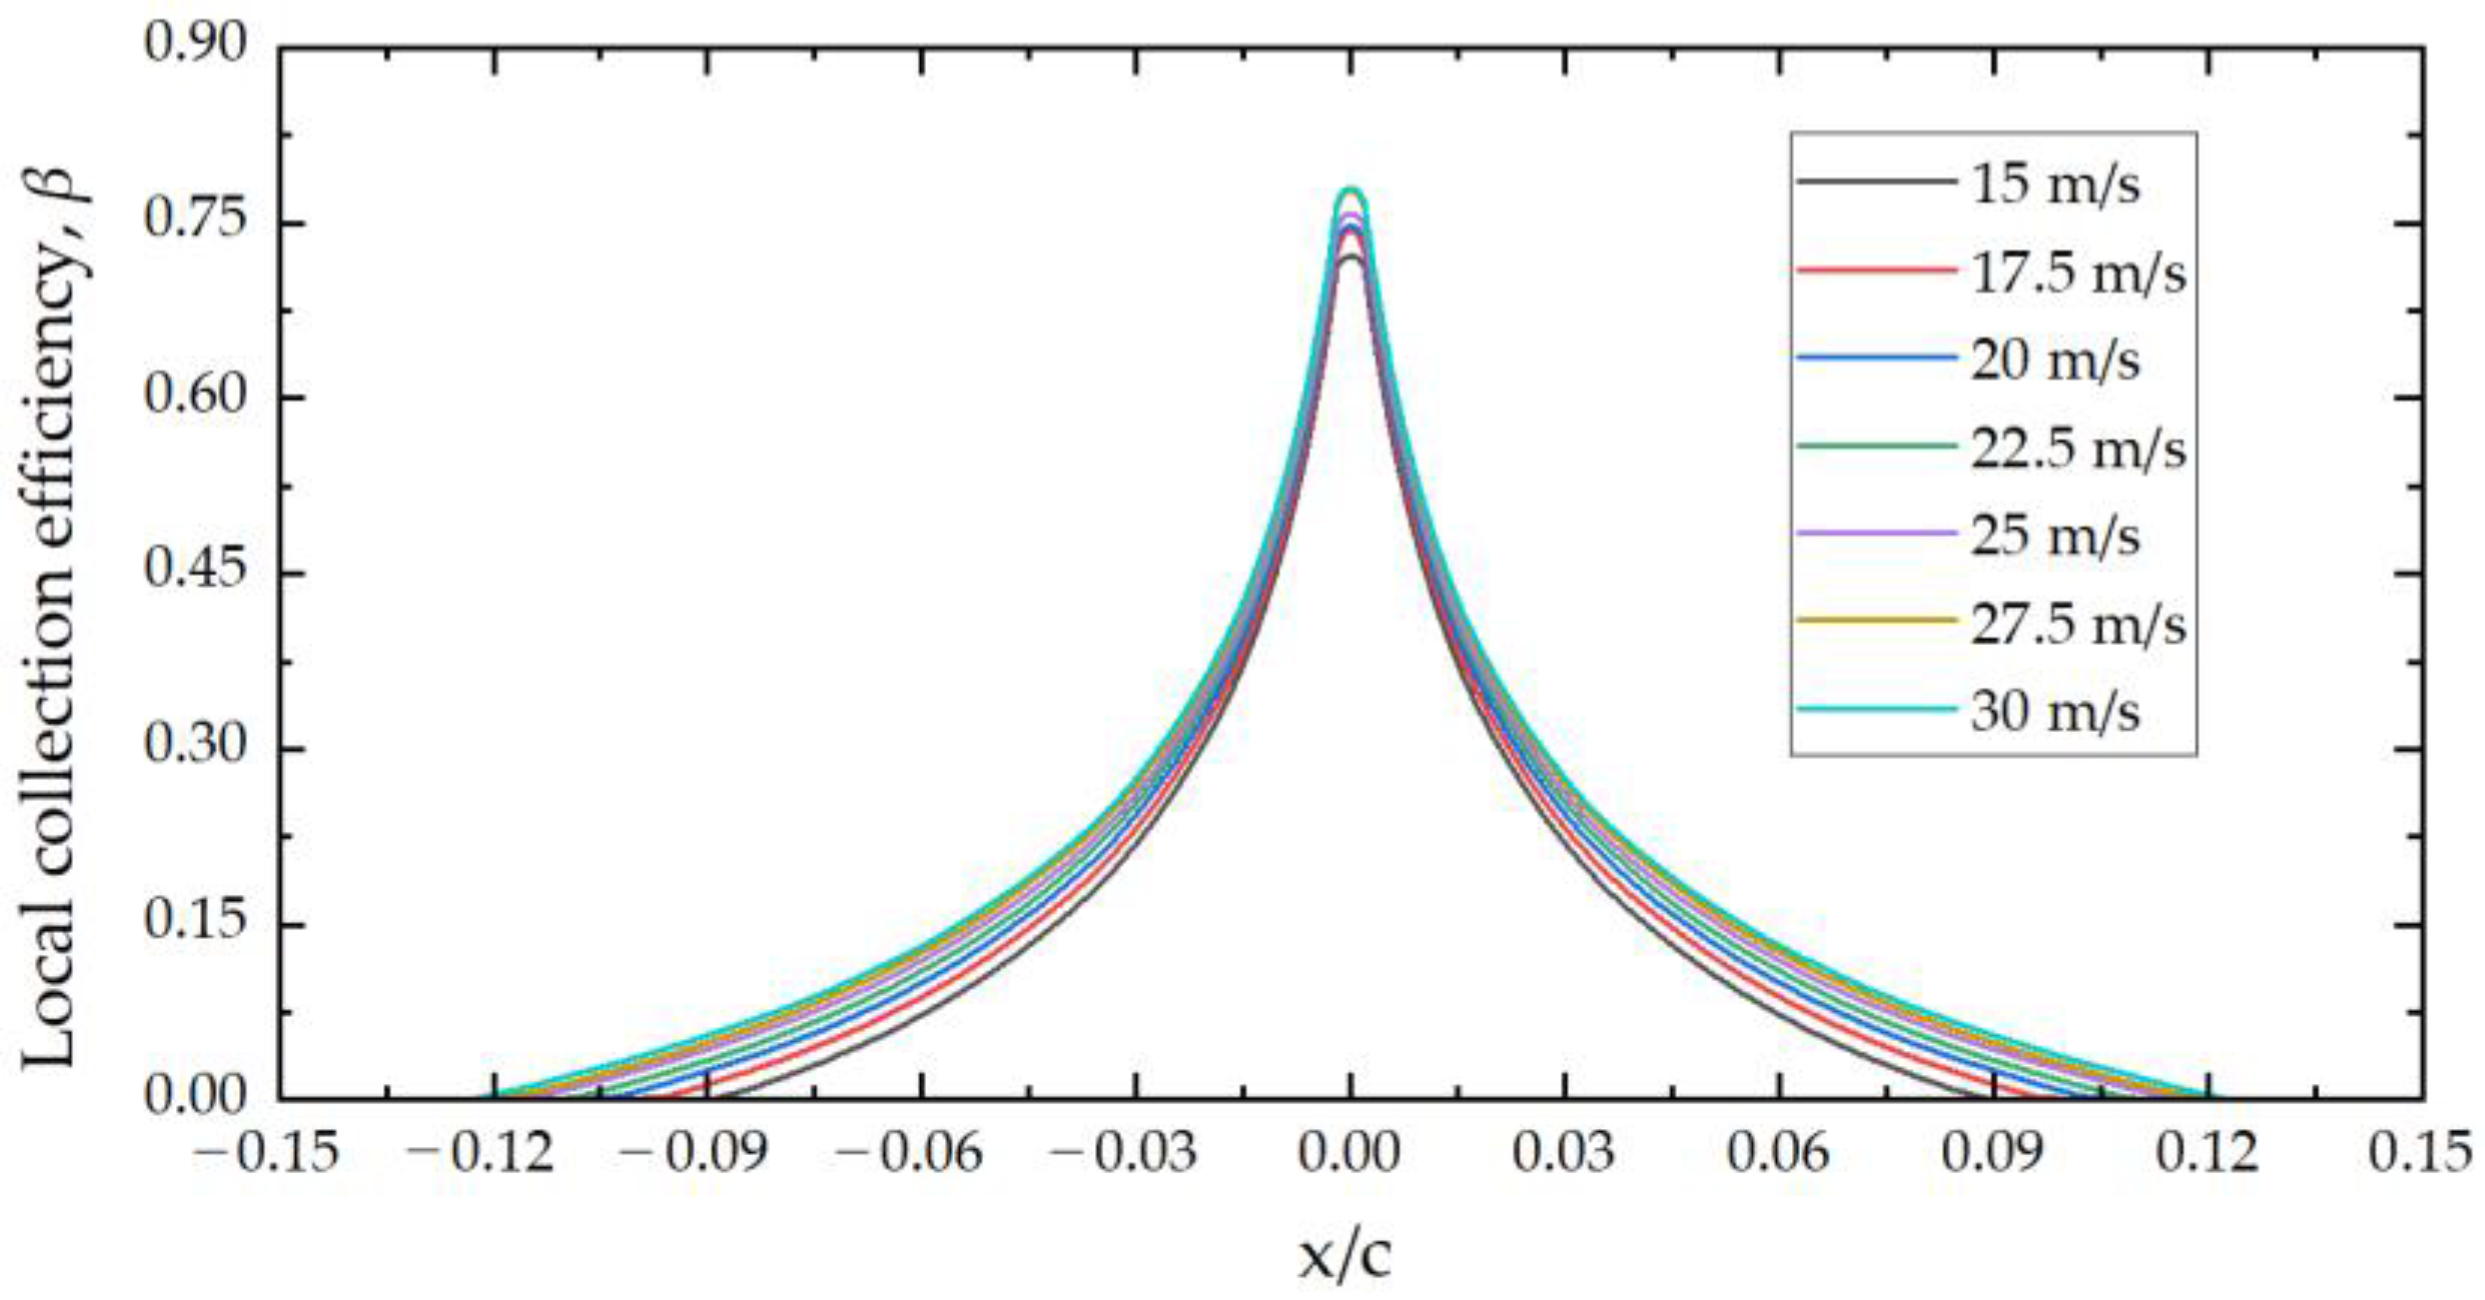
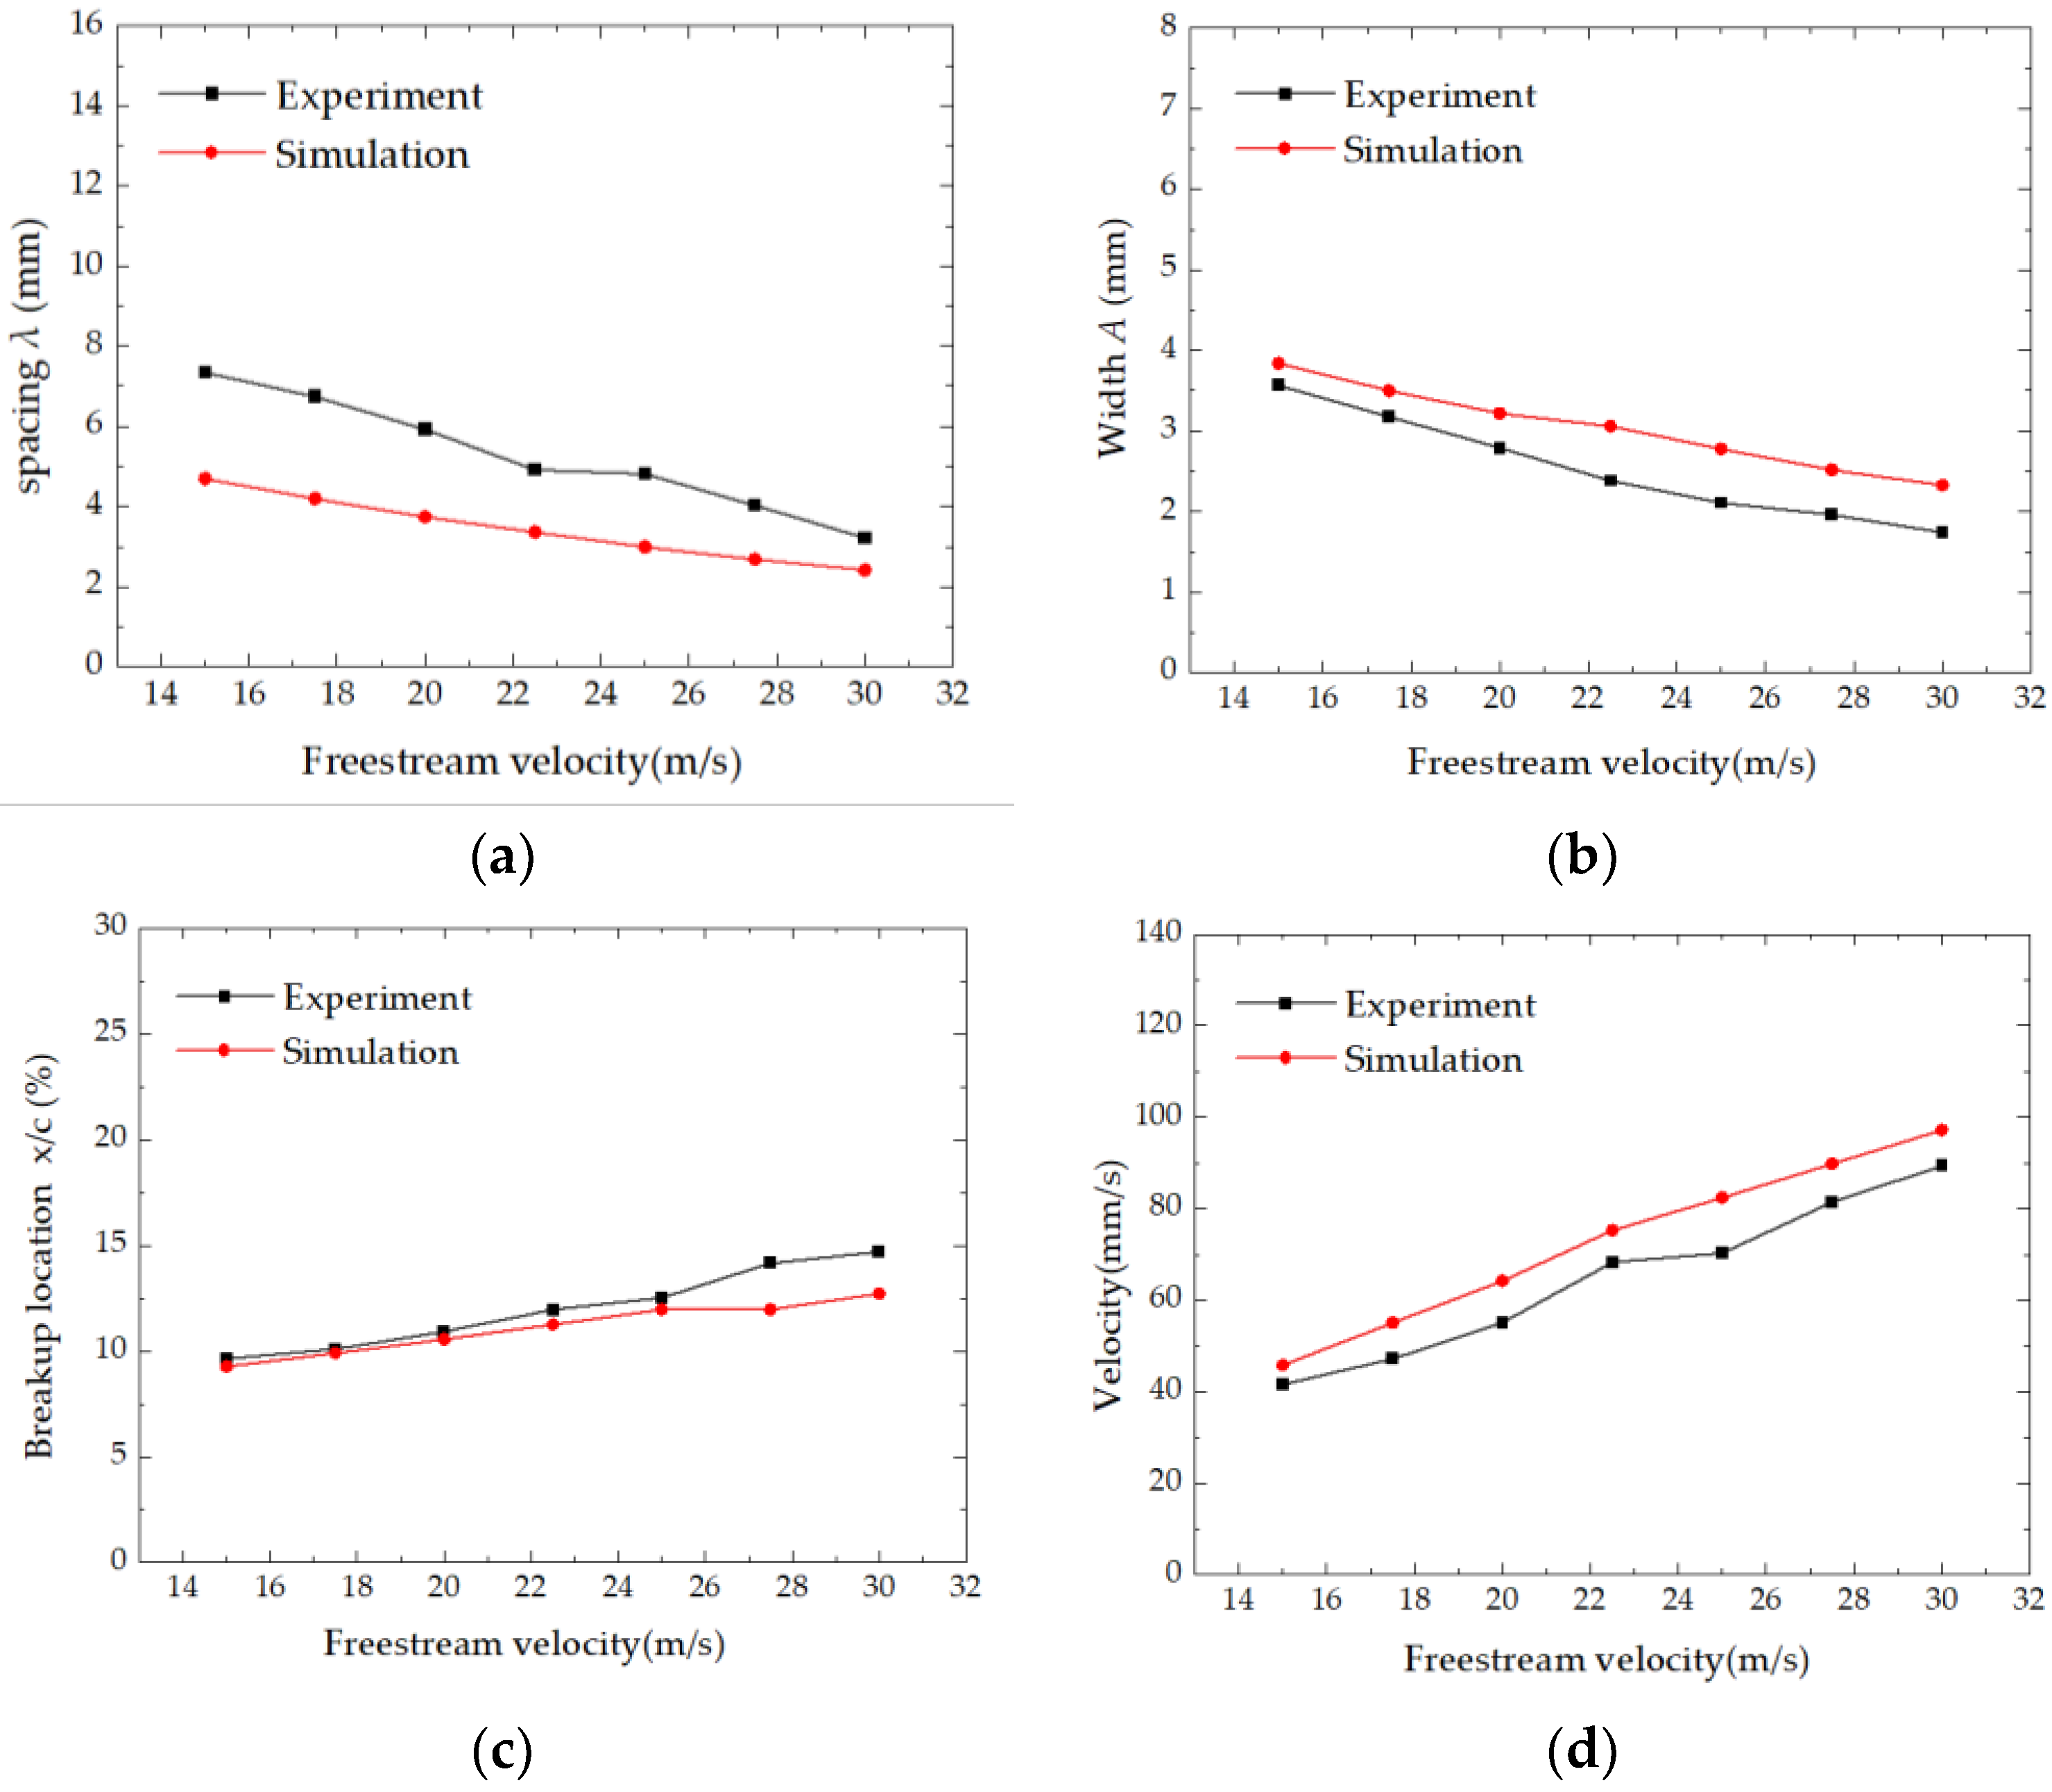
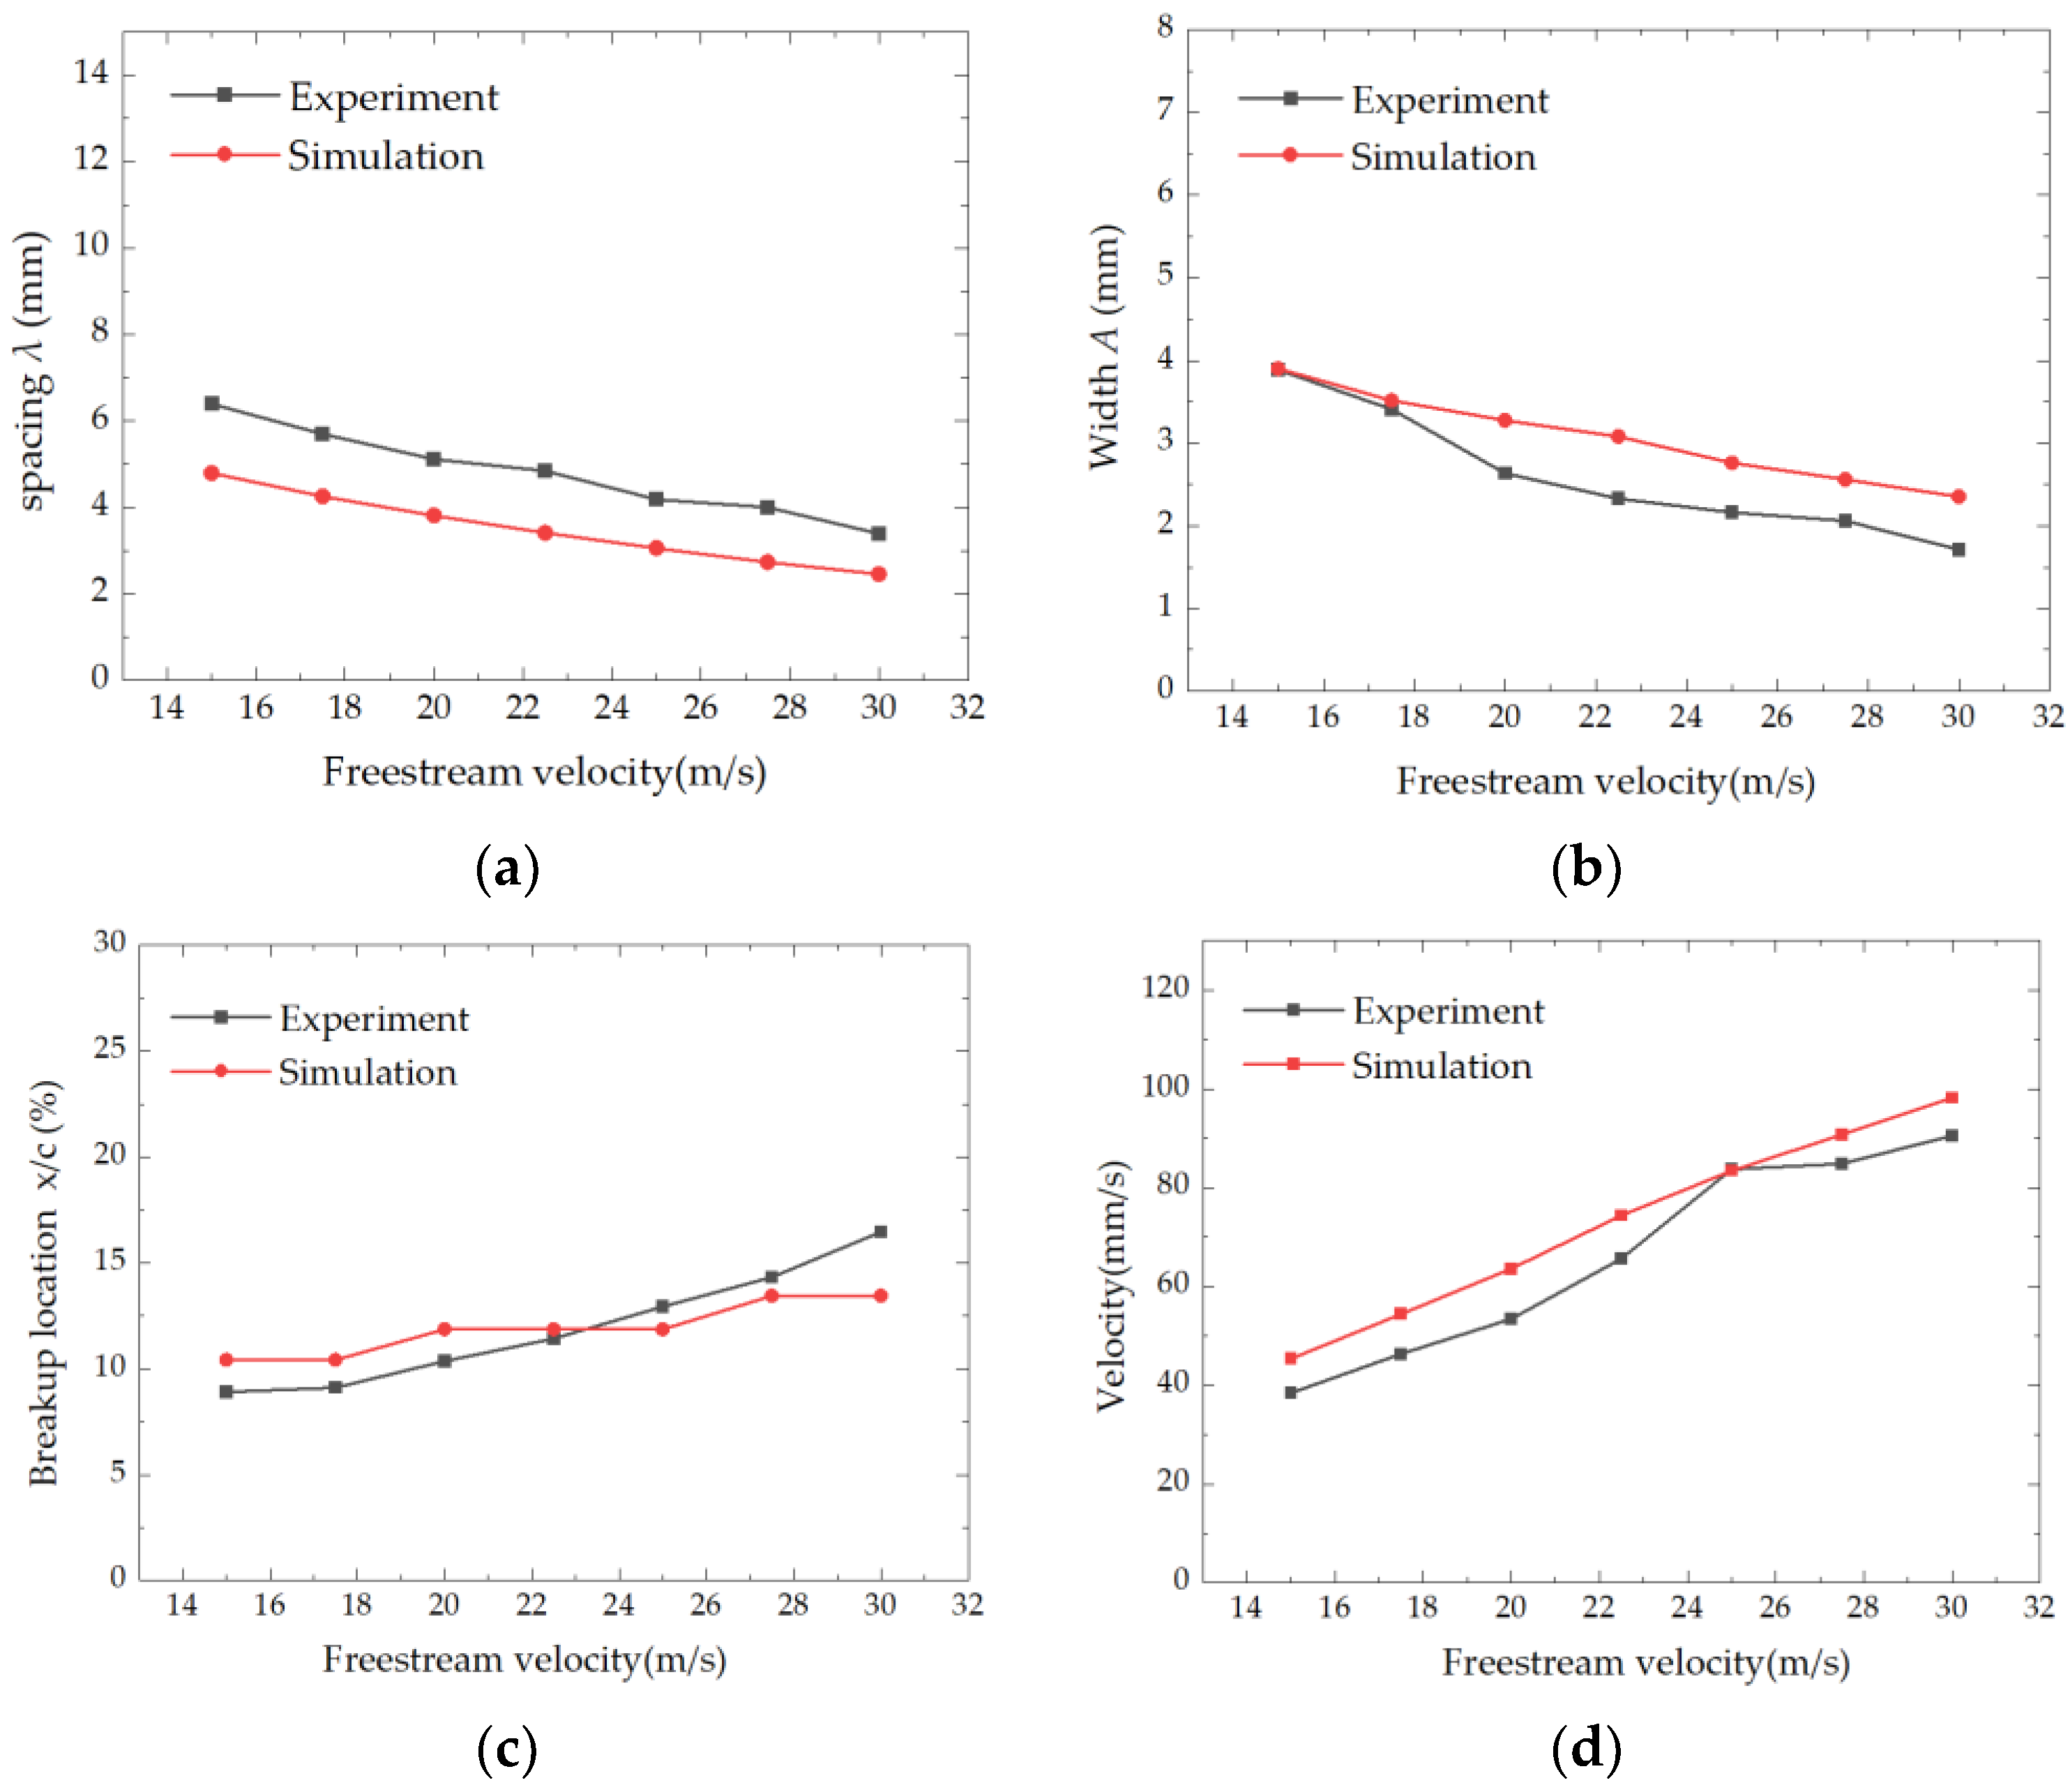
  • When the flow rate of the water supply from the nozzle is constant, an increase in the air speed delays the breakup of the water film. This is because, when the air speed increases, the shear force on the surface of the wing also increases, resulting in a decrease in the critical thickness of the water film breakup.
  • The width and spacing of the rivulets decrease as the air speed increases. However, the velocity of the rivulet flow gradually increases. According to Equations (9) and (23)–(26), the rivulet flow velocity is proportional to τ1/3, and the spacing of the rivulets is proportional to τ−2/3. Thus, the shear stress increases with an increase in air speed, resulting in an increasing rivulet velocity and a decreasing rivulet spacing.
The simulations were performed under the same conditions with hexahedral meshes and triangular prism meshes at a 30-m/s air speed. The results obtained for each parameter are very close. The water film breakup location is shown in Figure 13, where the blue area represents the continuous water film region, the green area represents the rivulet flow region, and the red area represents the location where the water film breaks up. This shows that the simulation model is well adapted to different grid topologies. The grid shape does not affect the calculation results.

4.2. Effect of Surface Temperature on Water Film Breakup

To study the effect of surface temperature on water film breakup, the simulation was carried out at a wind speed of 30 m/s and a liquid water content of 8.0 g/m3, keeping the ambient temperature constant at 268.15 K and changing the surface temperature from 275.15 to 293.15 K. The results are presented in Table 2.
The data in Table 2 shows that, as the surface temperature increases, the water film breakup location moves forward, and the thickness, spacing, width, and flow velocity of the rivulets all decrease. When the surface temperature increases by 5 °C (from 278.15 to 283.15 K), the water film breakup location shifts forward by 5.49% and the thickness, spacing, width, and flow velocity of the rivulets decrease by 1.29%, 1.40%, 1.63%, and 1.48%, respectively. This is because the higher the surface temperature, the greater the evaporation of the water. Consequently, the amount of water overflow on the airfoil surface decreases.

4.3. Effect of Roughness on Water Film Breakup

According to the roughness model in Section 2.3, the simulation was performed by taking a roughness factor Rz from 150 to 300 μm at an air speed of 30 m/s and a liquid water content of 11.0 g/m3. The results are presented in Table 3.
Based on the data, the following rules can be obtained:
  • When the surface of the wing has a uniform roughness, an increase in roughness causes the water film to break earlier. This is because, according to Equation (48), an increase in roughness results in a smaller surface shear than that of a smooth surface. When Equation (23) is combined, it is found that the dimensionless critical thickness becomes smaller; therefore, the water film breaks up earlier.
  • The thickness, width, and spacing of the rivulets increase with increasing surface roughness. This is because, as the surface roughness increases, the surface shear stress decreases. Combined with the experimental phenomenon, an increase in surface roughness increases the resistance to water flow, which is manifested by the water flowing more slowly and the width and spacing of rivulets becoming larger. From a theoretical point of view, the same conclusion can be drawn from Equations (10) and (25)–(27).
  • A comparison of the last two rows in Table 3 shows that the water film breakup location does not change when the roughness increases to a specific value. This is because the water film breakup location moves forward and coincides with the water impingement limit. Since the experiments showed that the water film does not break up within the impingement range of the water droplets, the breakup location does not move forward, even if the roughness increases further. Therefore, it can be concluded that when the water flow rate is relatively high, water film breakup should occur outside of the impingement limit. However, there is a critical value of roughness such that, when the roughness is greater than or equal to it, water film breakup occurs at the impingement limit.
  • As the air speed increases, the droplet impingement zone increases, i.e., the impingement limit shifts back. Therefore, it can also be concluded that, as the air speed increases, the critical value of the roughness also increases.

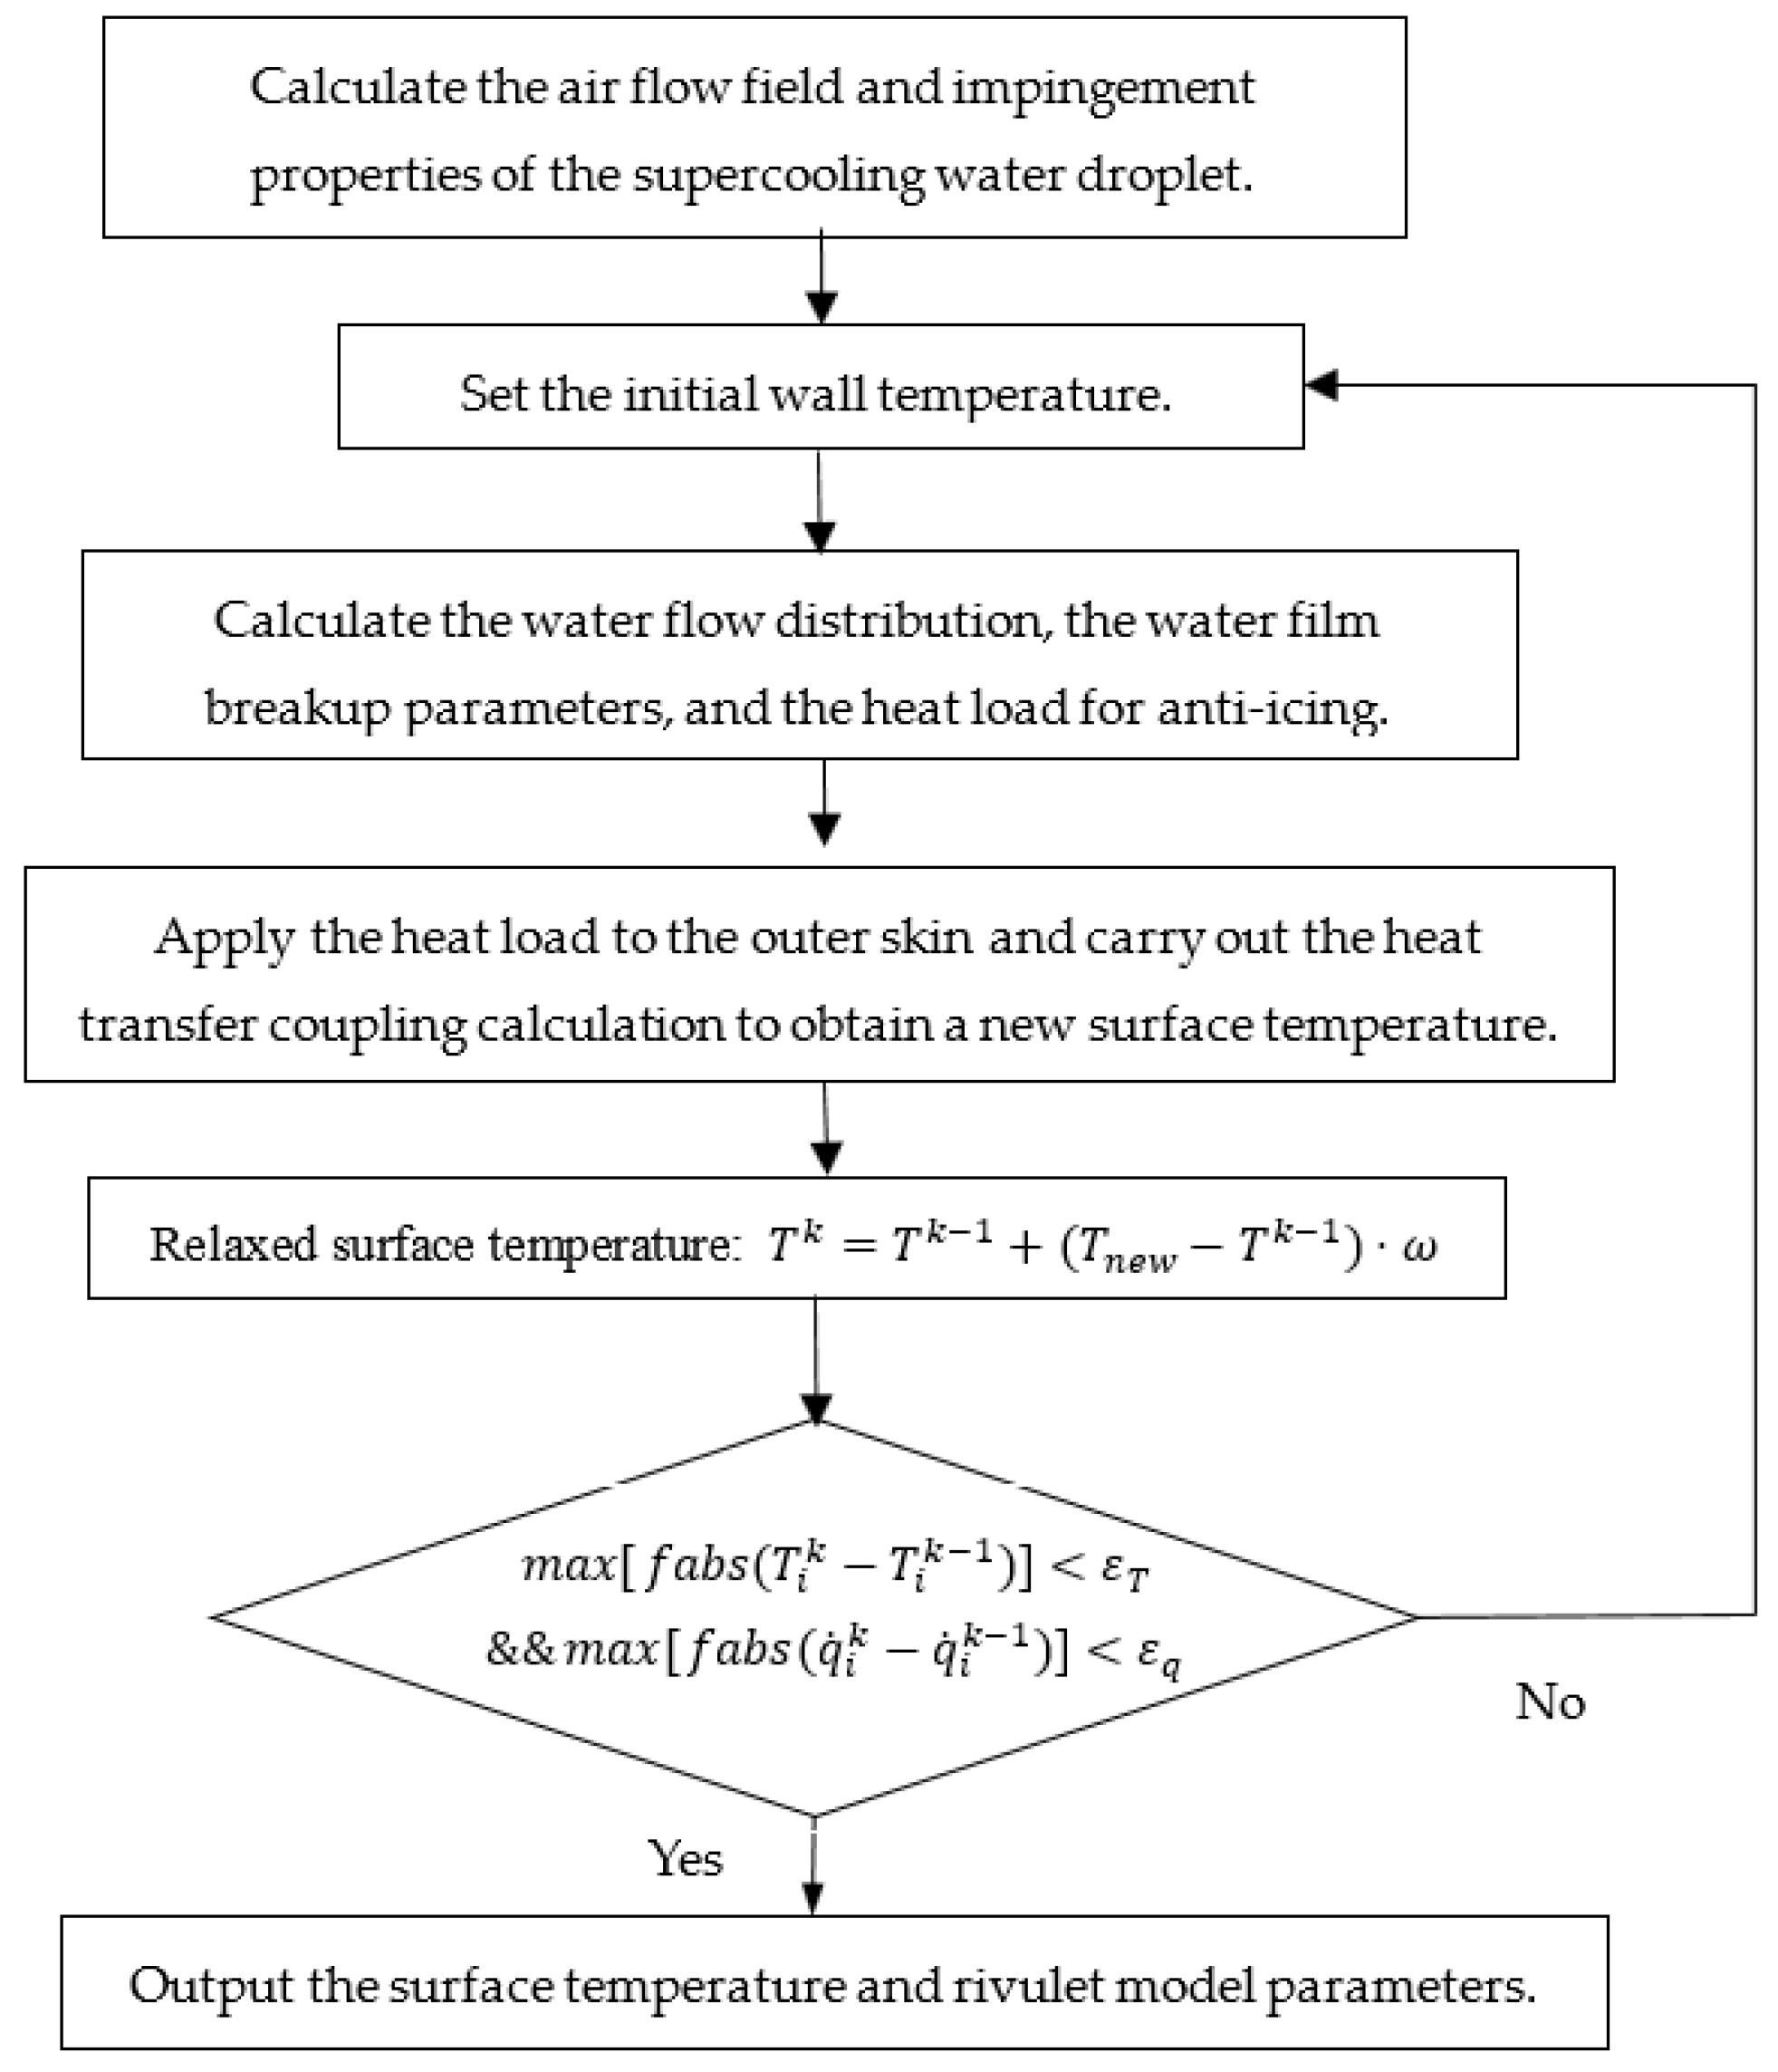
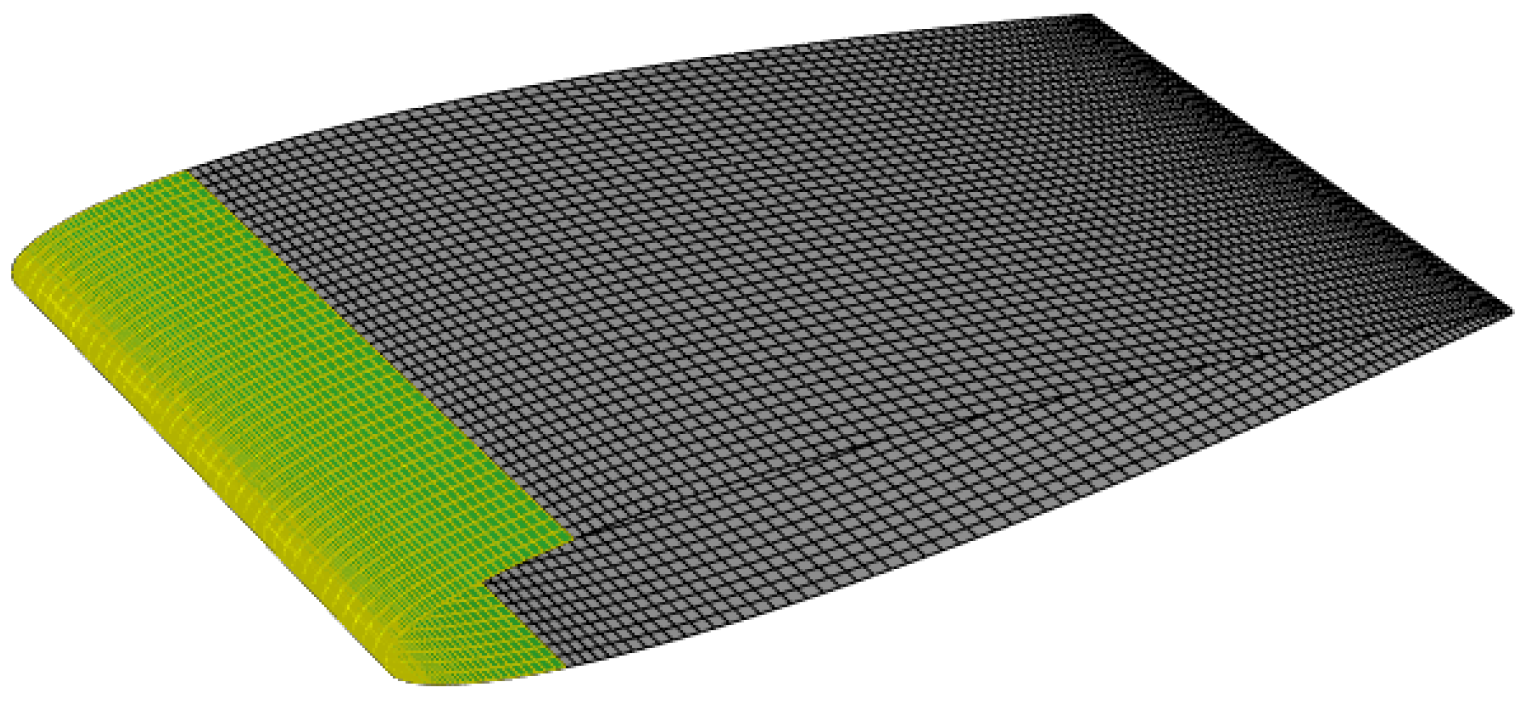
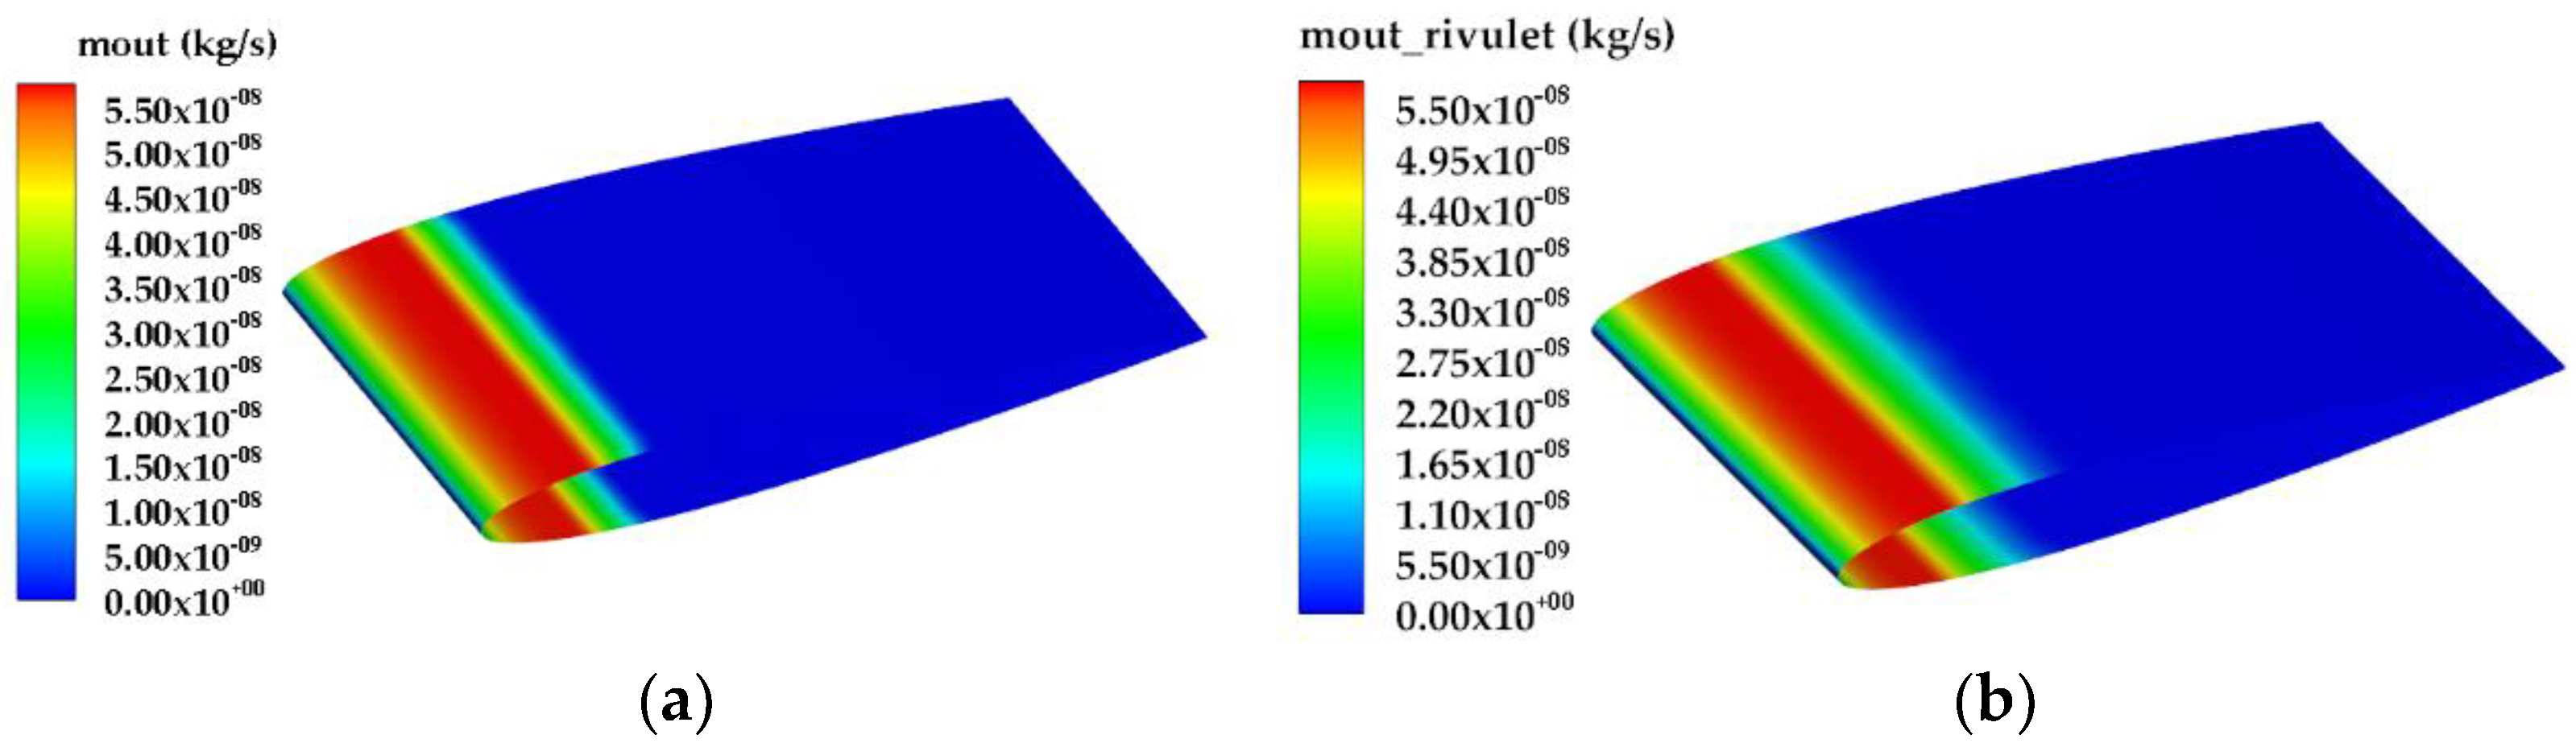
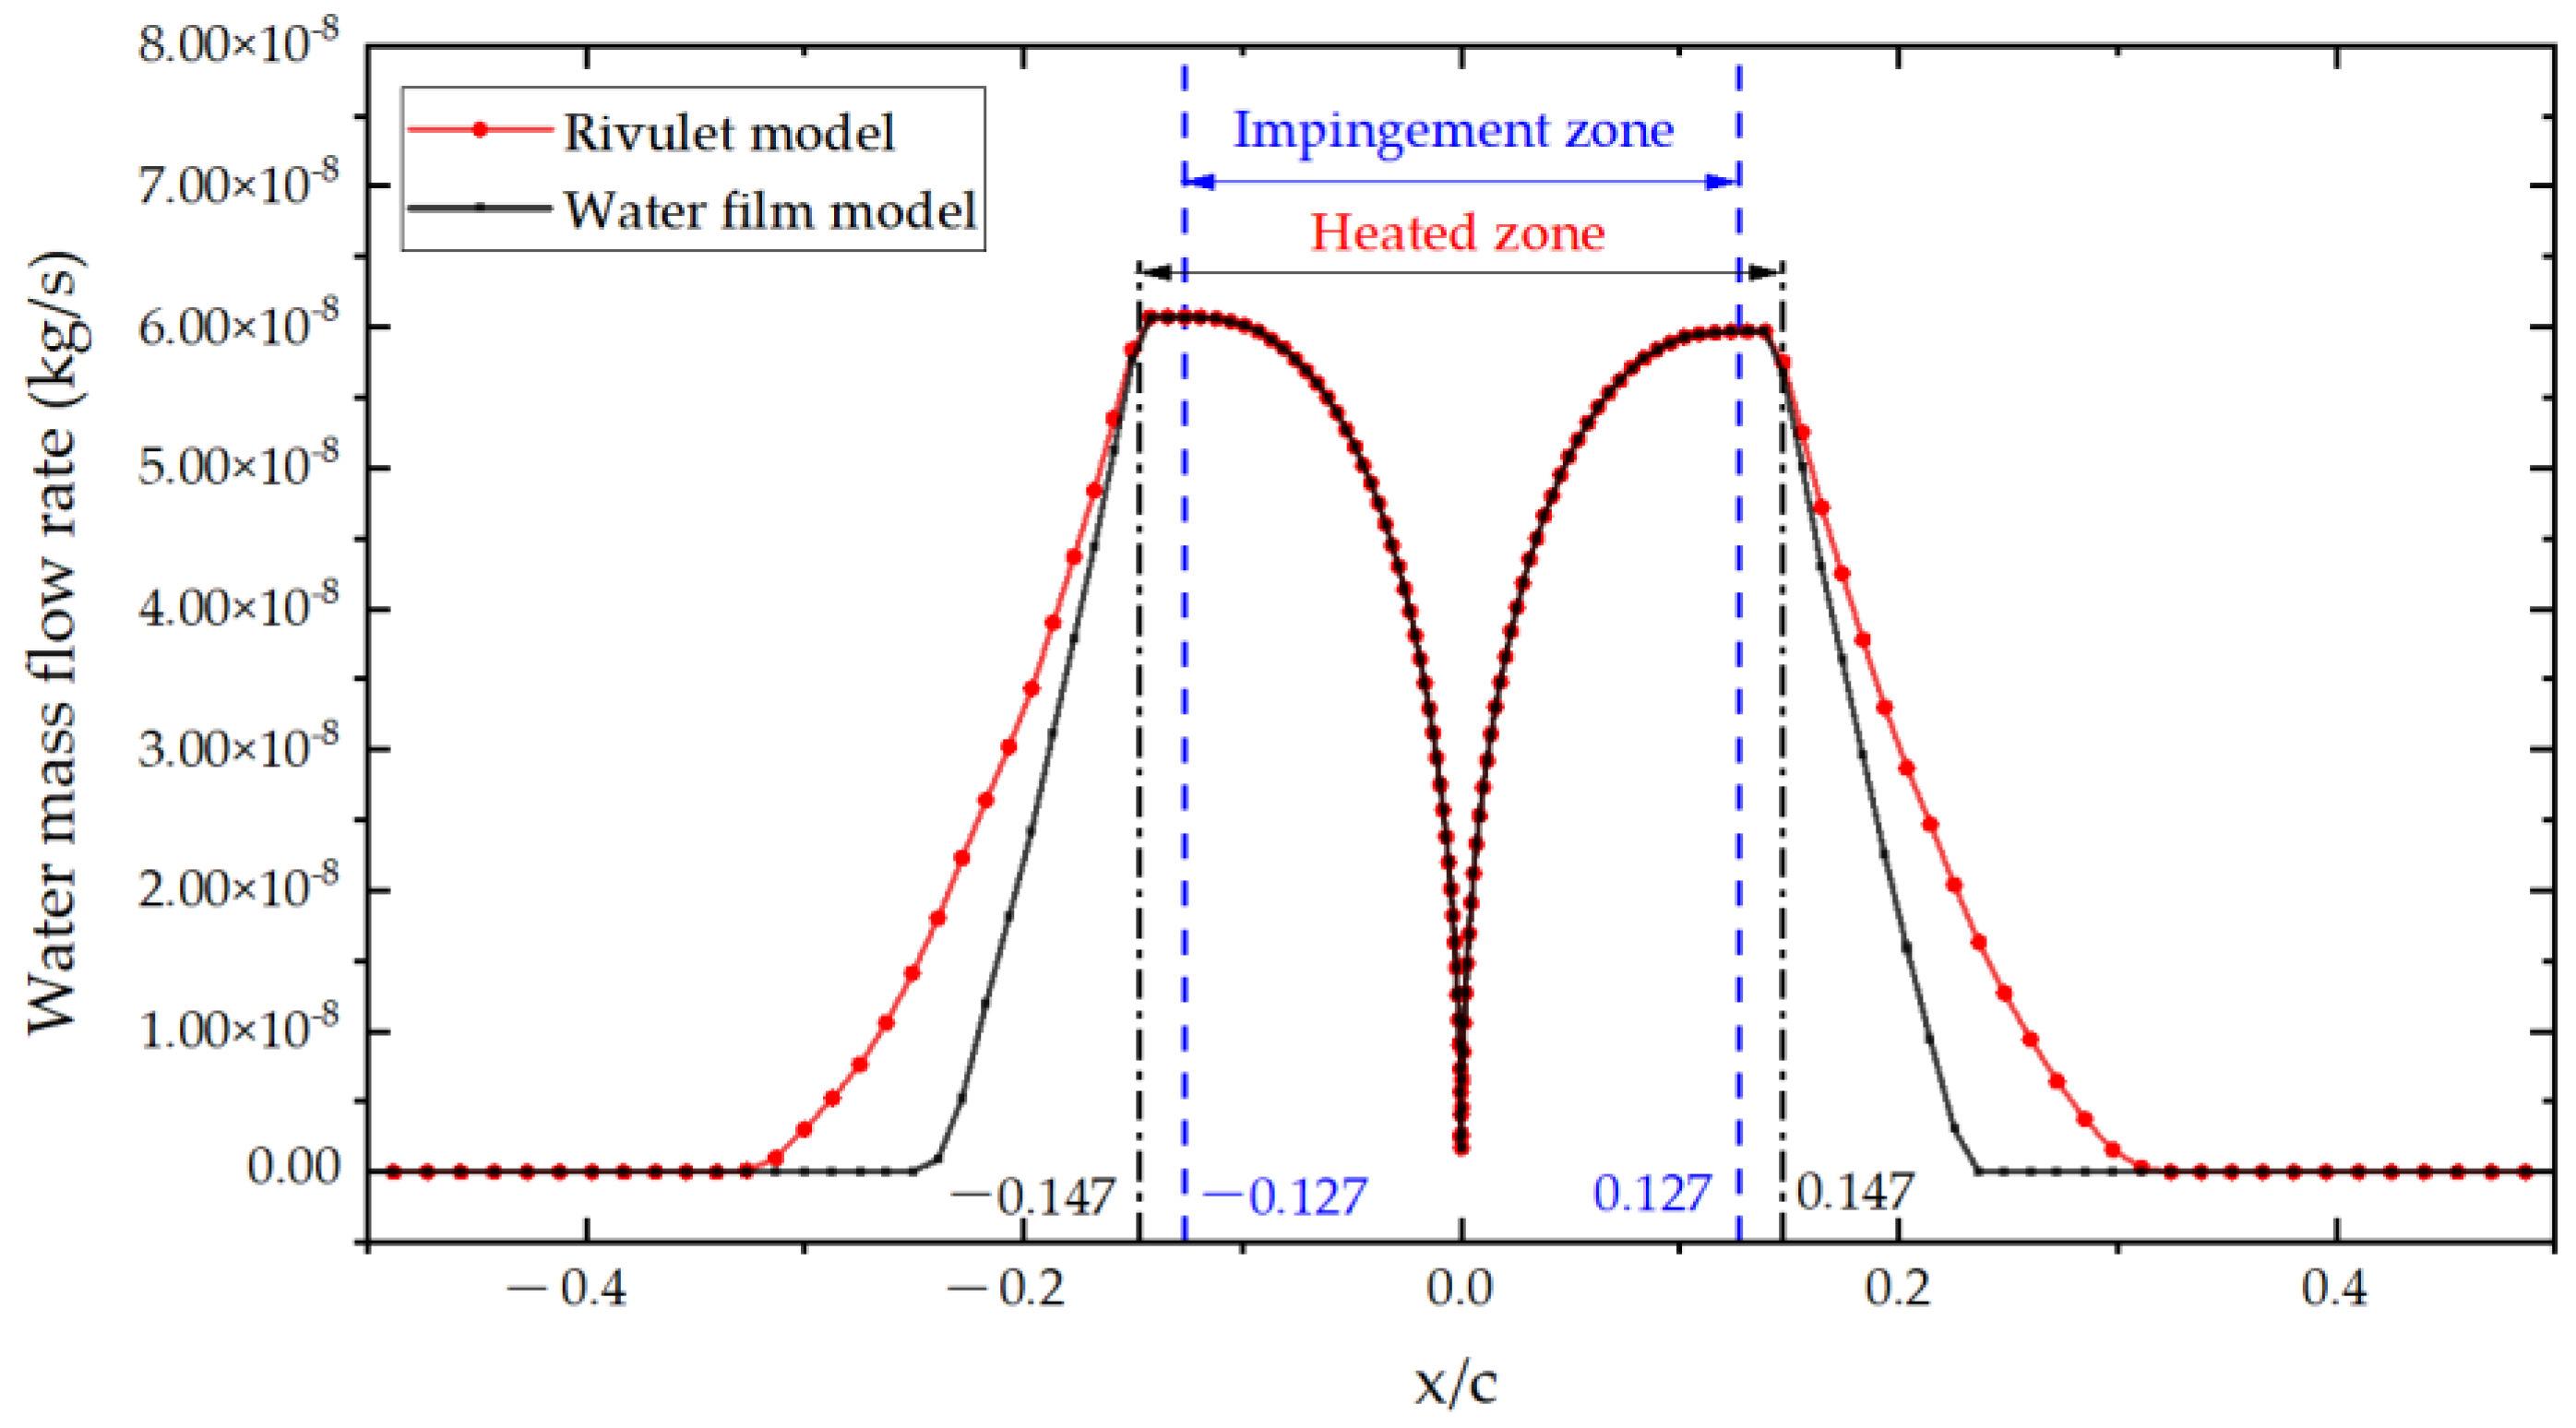
4.4. Effect of Water Film Breakup on Anti-Ice System

The influence of the water film breakup phenomenon on the thermal anti-icing performance was further investigated. Based on previous research on the coupled heat-transfer characteristics of thermal anti-icing systems [24,26], the corresponding anti-icing characteristics of electrothermal anti-icing systems considering water film breakup were simulated and analysed by means of the coupled heat-transfer of the inner and outer skin. First, the heat load of the outer skin of the wing was calculated based on the external flow field and droplet impingement. Then, the solid thermal conductivity and air–droplet two-phase fluid heat-transfer effects were calculated simultaneously. The mass and energy equations were solved until the wall temperature and heat flow reached equilibrium, at which time the calculation was complete. A calculation flowchart is shown in Figure 14.
As an example, when the ambient temperature was 268.15 K, the air speed was set to 30 m/s, and the liquid water content was 0.1 g/m3. For simplicity, a uniform heat flux boundary was used to heat the leading edge of the inner skin of the wing. The thermal conductivity of the skin was set to 120 W/m·K. The heat flux in the heated area was 4 W/cm2. The heating range is shown in Figure 15. It was approximately 14.7% of the total chord length of the wing.
The simulations show that, after considering the water film breakup, the rivulet spacing is 0.78 mm, the width is 0.58 mm, and the breakup location is at approximately 12.7% of the total chord length of the wing. Figure 16 shows the contours of the amount of runback water on the wing surface for the water film and rivulet models. Figure 17 shows the chordal distribution of the overflow water for the water film and rivulet models at the centre of the wingspan. The areas with positive horizontal coordinates represent the upper surface of the wing, and the areas with negative horizontal coordinates represent the lower surface. In addition, the black dotted line represents the limit of the heated zone, and the blue dashed line represents the droplet impingement limit. The impingement limit of water is approximately 12.7% of the total chord length.
As shown in Figure 17, the heated zone completely covers the water impingement zone. In the heated zone, two curves appear to coincide in the figure. With the rivulet model, the area of the overflow water is extended from 23.7% to 32.4% of the chord length (an increase of 8.7%). This is because of the reduced area of overflow water compared with the traditional water film model. As a result, the area of heat exchange with the environment is reduced, and the amount of water evaporating naturally decreases, resulting in an increase in the range of overflow water. This shows that the rivulet model can better simulate the distribution of overflow water on the wing surface and provide guidance for better designs of anti-icing systems.

5. Conclusions

In current simulations in the field of aircraft anti-icing, the water film breakup location and the shape of rivulets have not been investigated in detail. A systematic summary of the effects of the surface temperature and roughness on the water film breakup phenomenon is also required. Based on a summary of previous theoretical models, an engineered water film breakup model, i.e., rivulet model, was established. Simulations of the water film breakup location and parameters, such as the thickness, spacing, width, and flow velocity of rivulets, were performed, and they were verified experimentally. Comparisons between the simulation and experiment showed that the errors in the water film breakup location and rivulet flow velocity were less than 20%, and the errors in the rivulet spacing and width were less than 40%. In addition, the effects of the surface temperature and uniform roughness on water film breakup were investigated. The rivulet model was also applied to the hot-air anti-icing process on the wing surface. The following laws were derived.
  • At a given water supply flow rate, an increase in air speed delays the breakup of the water film. Meanwhile, the width and spacing of the rivulets decrease, and the rivulet flow velocity increases.
  • An increase in surface temperature advances the breakup of the water film. The thickness, spacing, width, and flow velocity of the rivulets decrease with an increasing surface temperature.
  • If uniform roughness exists on the surface, the increased roughness causes the water film to break earlier. The thickness, spacing, and width of the rivulets increase, and the rivulet flow velocity decreases with an increasing surface roughness.
  • When the water flow rate is relatively large, there is a critical value of roughness, causing water film breakup to occur at the water impingement limit when the roughness is greater than or equal to this value. At this point, the breakup location no longer changes. As the air speed increases, the impingement limit moves downstream; therefore, the critical value of the roughness increases.
These findings will help with the simulation, design, and optimization of anti-icing systems for aircraft. The future scope will be extending the experiment further to cover a wider range of environmental conditions. For example, higher surface roughness and air speeds could be investigated to verify if similar laws could be obtained. In addition, the experimental platform can be optimized to further measure the cross-sectional geometric parameters of rivulets. Thus, the rivulet shape function will be modified, and the theoretical model will be optimized.

Author Contributions

Conceptualization, Y.L., X.B., G.L. and R.Z.; methodology, Y.L., X.B. and X.S.; validation, Y.L. and X.B.; formal analysis, X.S., G.L., H.J. and F.Z.; investigation, Y.L. and K.M.; resources, X.B., X.S., G.L., H.J. and D.W.; data curation, Y.L.; writing—original draft preparation, Y.L. and K.M.; writing—review and editing, X.B.; project administration, X.B., G.L., R.Z. and F.Z. All authors have read and agreed to the published version of the manuscript.

Funding

This research was funded by the National Key R&D Program of China, grant number No. 2021YFB2601700; COMAC CIV, grant number No. CIRP202010002; and the Fundamental Research Funds for the Central Universities, grant number No. YWF-21-BJ-J-732.

Data Availability Statement

The data presented in this study are available on request from the corresponding author.

Conflicts of Interest

The authors declare no conflict of interest.

References

  1. Gohardani, O. Progress in Aircraft Icing and Aircraft Erosion Research; Aerospace and System Engineering and Research; Nova Science Publishers: Hauppauge, NY, USA, 2017; ISBN 978-1-5361-2030-1. [Google Scholar]
  2. Thomas, S.K.; Cassoni, R.P.; MacArthur, C.D. Aircraft Anti-Icing and de-Icing Techniques and Modeling. J. Aircr. 1996, 33, 841–854. [Google Scholar] [CrossRef]
  3. Carroll, T.; McAvoy, W. Formation of Ice on Airplanes. Airw. Age 1928, 58–59. [Google Scholar]
  4. Alekseenko, S.; Nakoryakov, V.E.; Pokusaev, B.G. Wave Flow of Liquid Films; Begell House: Danbury, CT, USA, 1994. [Google Scholar]
  5. Johnson, M.F.G.; Schluter, R.A.; Miksis, M.J.; Bankoff, S.G. Experimental Study of Rivulet Formation on an Inclined Plate by Fluorescent Imaging. J. Fluid Mech. 1999, 394, 339–354. [Google Scholar] [CrossRef]
  6. Hoffmann, A.; Ausner, I.; Repke, J.-U.; Wozny, G. Fluid Dynamics in Multiphase Distillation Processes in Packed Towers. Comput. Chem. Eng. 2005, 29, 1433–1437. [Google Scholar] [CrossRef]
  7. Hagemeier, T.; Hartmann, M.; Kühle, M.; Thévenin, D.; Zähringer, K. Experimental Characterization of Thin Films, Droplets and Rivulets Using LED Fluorescence. Exp. Fluids 2012, 52, 361–374. [Google Scholar] [CrossRef]
  8. Zhang, K.; Hu, H. An Experimental Study of the Wind-Driven Water Droplet/Rivulet Flows over an Airfoil Pertinent to Wind Turbine Icing Phenomena. In Proceedings of the Fluids Engineering Division Summer Meeting, Chicago, IL, USA, 3–7 August 2014; Volume 46247, p. V01DT39A001. [Google Scholar]
  9. Bonart, H.; Marek, A.; Repke, J.-U. Experimental Characterization of Stable Liquid Rivulets on Inclined Surfaces: Influence of Surface Tension, Viscosity and Inclination Angle on the Interfacial Area. Chem. Eng. Res. Des. 2017, 125, 226–232. [Google Scholar] [CrossRef]
  10. Liu, Y.; Zhang, K.; Tian, W.; Hu, H. An Experimental Study to Characterize the Effects of Initial Ice Roughness on the Wind-Driven Water Runback over an Airfoil Surface. Int. J. Multiph. Flow 2020, 126, 103254. [Google Scholar] [CrossRef]
  11. Messinger, B.L. Equilibrium Temperature of an Unheated Icing Surface as a Function of Air Speed. J. Aeronaut. Sci. 1953, 20, 29–42. [Google Scholar] [CrossRef]
  12. Hobler, T. Heat and Mass Transfer Bibliography: Polish Works. Int. J. Heat Mass Transf. 1965, 8, 841–844. [Google Scholar] [CrossRef]
  13. Mikielewicz, J.; Moszynski, J.R. Breakdown of a Shear Driven Liquid Film; Polish Academy of Sciences: Gdansk, Poland, 1975. [Google Scholar]
  14. Al-Khalil, K.M. Numerical Simulation of an Aircraft Anti-Icing System Incorporating a Rivulet Model for the Runback Water; The University of Toledo: Toledo, Spain, 1991. [Google Scholar]
  15. Rothmayer, A.; Tsao, J. Water Film Runback on an Airfoil Surface. In Proceedings of the 38th Aerospace Sciences Meeting and Exhibit, Reno, NV, USA, 10–13 January 2000; p. 237. [Google Scholar]
  16. Saber, H.H.; El-Genk, M.S. On the Breakup of a Thin Liquid Film Subject to Interfacial Shear. J. Fluid Mech. 2004, 500, 113–133. [Google Scholar] [CrossRef]
  17. Silva, G.; Silvares, O.; Zerbini, E. Water Film Breakdown and Rivulets Formation Effects on Thermal Anti-Ice Operation Simulation. In Proceedings of the 9th AIAA/ASME Joint Thermophysics and Heat Transfer Conference, San Francisco, CA, USA, 5–8 June 2006; p. 3785. [Google Scholar]
  18. Silva, G.; Silvares, O.; Zerbini, E.; Hefazi, H.; Chen, H.-H.; Kaups, K. Differential Boundary-Layer Analysis and Runback Water Flow Model Applied to Flow around Airfoils with Thermal Anti-Ice. In Proceedings of the 1st AIAA Atmospheric and Space Environments Conference, San Antonio, TX, USA, 22–25 June 2009; p. 3967. [Google Scholar]
  19. Wang, G.; Rothmayer, A. Air Driven Water Flow Past Small Scale Roughness. In Proceedings of the 43rd AIAA Aerospace Sciences Meeting and Exhibit, Reno, NV, USA, 10–13 January 2005; p. 653. [Google Scholar]
  20. Wang, G. Thin Water Films Driven by Air through Surface Roughness; Iowa State University: Ames, IA, USA, 2008. [Google Scholar]
  21. Dong, W.; Zheng, M.; Zhu, J.; Lei, G. Calculation and Analysis of Runback Water Flow on Anti-Icing Airfoil Surface. J. Aircr. 2016, 53, 1597–1605. [Google Scholar] [CrossRef]
  22. Myers, T.G.; Thompson, C.P. Modeling the Flow of Water on Aircraft in Icing Conditions. AIAA J. 1998, 36, 1010–1013. [Google Scholar] [CrossRef]
  23. Zhao, H.; Zhu, C.; Zhao, N.; Zhu, C.; Wang, Z. Experimental Research on the Influence of Roughness on Water Film Flow. Aerospace 2021, 8, 225. [Google Scholar] [CrossRef]
  24. Bu, X.; Lin, G.; Shen, X.; Hu, Z.; Wen, D. Numerical Simulation of Aircraft Thermal Anti-Icing System Based on a Tight-Coupling Method. Int. J. Heat Mass Transf. 2020, 148, 119061. [Google Scholar] [CrossRef]
  25. LI, H.; HUANG, P. Numerical Simulation of Mixed Phase Icing on Two-Dimensional Airfoil. Acta Aeronaut. Astronaut. Sin. 2021, 42, 124085. [Google Scholar]
  26. Shen, X.; Wang, H.; Lin, G.; Bu, X.; Wen, D. Unsteady Simulation of Aircraft Electro-Thermal Deicing Process with Temperature-Based Method. Proc. Inst. Mech. Eng. Part G J. Aerosp. Eng. 2020, 234, 388–400. [Google Scholar] [CrossRef]
Figure 1. Schematic diagram of water film breakup.
Aerospace 09 00570 g001
Figure 2. Rivulet model.
Aerospace 09 00570 g002
Figure 3. Schematic diagram of a three-dimensional control volume.
Aerospace 09 00570 g003
Figure 4. Relationships between the Reynolds number of water film and the average thickness and interfacial shear coefficient under different roughness values: (a) Relationship between the Reynolds number of water film and the average thickness of water film [23]; (b) Relationship between the Reynolds number of water film and the interfacial shear coefficient.
Aerospace 09 00570 g004
Figure 5. Water film breakup experimental system.
Aerospace 09 00570 g005
Figure 6. Calibration of air speed in the test section of the wind tunnel.
Aerospace 09 00570 g006
Figure 7. Experimental samples: (a) Straight wing; (b) Sweptback wing.
Aerospace 09 00570 g007
Figure 8. Static contact angle measurement: (a) Equipment; (b) Captured image.
Aerospace 09 00570 g008
Figure 9. Local collection efficiencies at different air speeds.
Aerospace 09 00570 g009
Figure 10. The experimental phenomenon captured at an air speed of 20 m/s.
Aerospace 09 00570 g010
Figure 11. Comparison of experiment and simulation results for a straight wing: (a) The spacing between rivulets; (b) The width of the rivulets; (c) Water film breakup location as a percentage of the total chord; (d) Rivulet velocity at 1/2 chord position.
Aerospace 09 00570 g011
Figure 12. Comparison of experiment and simulation results of a sweptback wing: (a) The spacing between rivulets; (b) The width of the rivulets; (c) Water film breakup location as a percentage of the total chord; (d) Rivulet velocity at 1/2 chord position.
Aerospace 09 00570 g012
Figure 13. Location of water film breakup.
Aerospace 09 00570 g013
Figure 14. Flow chart of heat transfer coupling calculation.
Aerospace 09 00570 g014
Figure 15. Heated area of the anti-ice system.
Aerospace 09 00570 g015
Figure 16. Contour of the water mass flow rate (kg/s): (a) Water film model; (b) Rivulet model.
Aerospace 09 00570 g016
Figure 17. Distribution of the water flow rate along the chord.
Aerospace 09 00570 g017
Table 1. Comparison of rivulet shape parameters under different contact angles.
Contact Angle (deg)A (mm)λ (mm)
Simulation22.752.51
41.571.89
160.410.55
320.200.27
640.090.13
Experiment-1.74 ± 0.303.22 ± 0.30
Table 2. Parameters of water film breakup under different surface temperatures.
Surface Temperature
(K)
A
(mm)
λ
(mm)
Thickness at the Breakup Location
(10−5 m)
Breakup Location
x/c (%)
Velocity
(mm/s)
275.152.462.883.1416.93113.13
278.152.452.853.1116.03112.48
283.152.412.813.0715.15110.82
293.152.302.712.9512.71105.82
Table 3. Parameters of water film breakup under different roughness factors.
Rz
(μm)
A
(mm)
λ
(mm)
Thickness at the Breakup Location
(10−5 m)
Breakup Location
x/c (%)
Velocity
(mm/s)
1504.675.445.9342.27107.19
2004.685.465.9620.9186.69
2505.826.567.1612.7168.09
30011.2611.1112.1912.7145.87
Publisher’s Note: MDPI stays neutral with regard to jurisdictional claims in published maps and institutional affiliations.

